ezblue \addauthoreporange
Heterogeneous Treatment Effects in Panel Data
Abstract
We address a core problem in causal inference: estimating heterogeneous treatment effects using panel data with general treatment patterns. Many existing methods either do not utilize the potential underlying structure in panel data or have limitations in the allowable treatment patterns. In this work, we propose and evaluate a new method that first partitions observations into disjoint clusters with similar treatment effects using a regression tree, and then leverages the (assumed) low-rank structure of the panel data to estimate the average treatment effect for each cluster. Our theoretical results establish the convergence of the resulting estimates to the true treatment effects. Computation experiments with semi-synthetic data show that our method achieves superior accuracy compared to alternative approaches, using a regression tree with no more than 40 leaves. Hence, our method provides more accurate and interpretable estimates than alternative methods.
1 Introduction
Suppose we observe an outcome of interest across distinct units over time periods; such data is commonly referred to as panel data. Each unit may have been subject to an intervention during certain time periods that influences the outcome. As a concrete example, a unit could be a geographic region affected by a new economic policy, or an individual consumer or store influenced by a marketing promotion. Our goal is to understand the impact of this intervention on the outcome. Since the effect of the intervention might vary across individual units and time periods as a function of the unit-level and time-varying covariates, we aim to estimate the heterogeneous treatment effects. This is a key problem in econometrics and causal inference, enabling policymakers or business owners to make more informed decisions about which units to target for future interventions.
We develop a new method, the Panel Clustering Estimator (PaCE), for estimating heterogeneous treatment effects in panel data under general treatment patterns. The causal effects are modeled as a non-parametric function of the covariates of the units, which may vary over time. To estimate heterogeneous effects, PaCE splits the observations into disjoint clusters using a regression tree and estimates the average treatment effect of each cluster. In addition to the development of this novel method, we make the following theoretical and empirical contributions.
Regression tree with bounded bias (Theorem 3.2)
We show that, subject to mild assumptions on the regression tree and a density assumption on the covariates, the bias introduced by approximating the treatment effect function with a piece-wise constant function, produced by the regression tree, decreases polynomially as the number of leaves in the tree increases.
Optimal rate for average treatment effect estimation (Theorem 3.5)
We obtain guarantees for the recovery of average treatment effects for each cluster of observations that matches the optimal rate, up to logarithmic factors. This extends the convergence guarantee of [17] to a setting with multiple treatments. Similar to [17], we allow for general intervention patterns.
Enhanced empirical accuracy with simple estimator
Using semi-synthetic data, we demonstrate that PaCE achieves empirical performance competitive with, and often superior to, alternative methods for heterogeneous treatment effect estimation, including double machine learning, causal forest, and matrix completion-based methods. Furthermore, PaCE offers a much simpler and more interpretable estimate, as we achieve this enhanced performance using a regression tree with at most 40 leaves.
1.1 Related literature
Causal inference using panel data is often approached through the synthetic control framework, where treated units are compared to a synthetic control group constructed from untreated units [1, 2]. However, for these methods, the treatment is restricted to a block. Matrix completion approaches offer a more flexible alternative, allowing for general treatment patterns [4, 7, 35]. The treated entries are viewed as missing entries, and low-rank matrix completion is utilized to estimate counterfactual outcomes for the treated entries. In most of the matrix completion literature, the set of missing or treated entries are assumed to be generated randomly [12]. However, this assumption is not realistic in our panel data setting. Other works explore matrix completion under deterministic sampling [10, 17, 19, 22, 24], and our work extends the methodology from [17].
Several methods for estimating heterogeneous treatment effects use supervised learning techniques to fit models for the outcome or treatment assignment mechanisms [14, 15, 18, 23, 27]. Although these methods are intended for cases where observations are drawn i.i.d. from one or multiple predefined distributions, they could still be applied to panel data. In contrast, our approach is specifically designed for panel data with underlying structure. By avoiding complex machine learning methods, our approach not only provides accurate results for panel data but also offers interpretable estimates.
The first step of our method involves grouping data into clusters that vary in their treatment effects using a regression tree. As in [8], we greedily search for good splits, iteratively improving the tree’s representation of the true heterogeneous treatment effects. However, unlike supervised learning where the splitting criterion is directly computable, treatment effects are not readily observed. Therefore, we estimate the splitting criterion, an approach used in [5, 6, 29, 33]. While methods like causal forest only use information within a given leaf to estimate the treatment effect for observations in that leaf [33], our method leverages global information from the panel structure to determine the average treatment effect of each cluster, enabling us to achieve high accuracy with just one tree.
The second step involves estimating the average treatment effect in each cluster. For this step, we utilize the de-biased convex estimator introduced by [17]. This estimator is applicable to panel data with general treatment patterns but is specifically designed for estimating average, rather than heterogeneous, treatment effects. It uses a convex estimator, similar to those used in [20, 34], and introduces a novel de-biasing technique that improves upon the initial estimates. Additionally, [17] builds on previous works [11, 13] to provide theoretical guarantees for recovering the average treatment effect with provably minimal assumptions on the intervention patterns. The results of [17] are specific to the case where there is only one treatment. We build on their proof techniques to show convergence when the number of treatments is , and also nest this technique into the first step of our algorithm to estimate heterogeneous effects.
1.2 General notation
For any matrix , denotes the spectral norm, denotes the Frobenius norm, denotes the nuclear norm, and denotes the sum of the absolute values of the entries in . For any vector , denotes its Euclidean norm, and denotes the maximum absolute value of its components. We use to denote element-wise matrix multiplication. For a matrix subspace , let denote the projection operator onto , the orthogonal space of . We define the sum of two subspaces and as . We write whenever , for some fixed constant ; is defined similarly.
2 Model and algorithm
PaCE is designed for panel data, where an outcome of interest is observed across distinct units for time periods. Let be the matrix of these observed outcomes. Our objective is to discern how these outcomes were influenced by various treatments under consideration.
We assume that, in a hypothetical scenario where the treatments were not applied, the expected outcomes would be represented by an unknown low-rank matrix . To incorporate the influence of the external factors, we introduce the covariate tensor , where an element signifies the -th covariate of unit at time . For convenience, we will write as the vector of relevant covariates for unit at time . We consider distinct treatments, each represented by a binary matrix that encodes which observations are subjected to that treatment. For each treatment applied to unit at time period , the treatment effect is modeled as a non-parametric Lipschitz function of the covariates . We consider the treatment effects of distinct treatments to be additive.111This is a flexible framework because, as we allow for up to treatments, the interactions of individual treatments can be modeled as additional treatments. Combining all of these elements, the observed outcome matrix can be expressed as the sum of , the combined effects of the treatments, and a noise matrix . Mathematically,
where denotes the matrix where the element in -th row and -th column is . We note that our model implicitly assumes unconfoundedness, which is common in the literature [21].
Our goal is to estimate the treatment effect function for each , having observed , , and . Our methodology PaCE consists of two main steps. First, we build a specialized tree for each treatment , designed to partition the observations into disjoint clusters that differ in their treatment effects. Next, we estimate the average treatment effect of each cluster, thus obtaining estimates for the treatment effect functions that are piece-wise constant functions of the covariates. The following subsections will delve into the specifics of these two steps.
2.1 Clustering the observations
Initially, the entire dataset with entries is in one single cluster. This cluster serves as the starting point for the iterative partitioning process, where we split the data into more granular clusters for each treatment that better represent the true heterogeneous treatment effects. We present our method for clustering observations in Algorithm 1. Below, we discuss its two main steps.
| (1) |
-
•
For and , let the function encode the new cluster after splitting the -th cluster for treatment based on the comparison of the -th covariate to :
-
•
Identify the split that minimizes the estimated mean squared error: , where
-
•
For , update the cluster .
Step 1
We solve (the convex) Problem 1 to obtain a rough estimate of the counterfactual matrix, represented by , for a given clustering of observations. The regularization term penalizes the rank of . The term is introduced to center each row of matrix without penalization from the nuclear norm term. The inclusion of this term deviates from the convex problem in [17], and we find that its inclusion improves empirical performance. The choice of is discussed in our theoretical results.
Step 2
In the second step, we greedily choose a valid split to achieve a better approximation of the true heterogeneous treatment effects. A valid split is one that complies with predefined constraints, which will be discussed in our theoretical guarantees. While the provided algorithm selects splits that minimize the mean squared error (MSE), alternative objectives such as mean absolute error (MAE) may be used instead.
2.2 Estimating the average treatment effect within each cluster
After partitioning all observations into clusters for each of the treatments, the next step in our algorithm is to estimate the average treatment effect within each cluster. This is done using an extension of the de-biased convex estimator introduced in [17]. We first obtain an estimate of the average treatment effects by solving a convex optimization problem. This initial estimate is then refined through a de-biasing step.
For simplicity, we define separate treatment matrices for each cluster. Letting for , are defined as follows: for . These are binary matrices that identify observations that are in a given cluster and receive a given treatment. We denote the true average treatment effect of the treated in each cluster as , and let be the associated residual matrices, which represent the extent to which individual treatment effects differ from the average treatment effect. More precisely, for ,
Finally, we define as the combined residual error, where , and is the total error.
We normalize all of these treatment matrices to have Frobenius norm 1. This standardization allows the subsequent de-biasing step to be less sensitive to the relative magnitudes of the treatment matrices. Define . By scaling down the treatment matrices in this way, our estimates are proportionally scaled up. Similarly, we define a rescaled version of , given by
First, we solve the following convex optimization problem with the normalized treatment matrices to obtain an estimate of and :
| (2) |
Because we introduced the term in the convex formulation, which centers the rows of without penalization from the nuclear norm term, serves as our estimate of , projected to have zero-mean rows, while serves as our estimate of the row means of . For notational convenience, let denote the projection onto . That is, for any matrix ,
Hence is the projection of with zero-mean rows. Let be the vector representing the row means of . Let denote the rank of ,222Note that we can show , so is a low-rank matrix as well. and let be its SVD, with . We denote by the span of the space and the tangent space of in the manifold of matrices with rank . That is,
The closed form expression of the projection is given in Lemma B.1.
The following lemma gives a decomposition of that suggests a method for de-biasing of . The difference between our error decomposition and the decomposition presented in [17] stems from the fact that we introduced the term in (2).
Lemma 2.1 (Error decomposition).
Suppose is a minimizer of (2). Let be the SVD of , and let denote the span of the tangent space of and . Then,
| (3) |
where is the matrix with entries and are vectors with components
As noted in [17], since depends solely on observed quantities, it can be subtracted from our estimate. Thus, we define our de-biased estimator as for each . The rescaling by adjusts our estimate to approximate , rather than
The de-biased serves as our final estimate. Specifically, if an observation’s covariates belong to the -th cluster, then for each treatment , our estimate of is given by , which represents the average treatment effect of treatment associated with the cluster that belongs to.
3 Theoretical guarantees
Our analysis determines the conditions for the convergence of our algorithm’s estimates to the true treatment effect functions for each . Our proof incorporates ideas from [17, 33].
The final treatment effect estimate given by PaCE has two sources of error. First, there is the approximation error, which stems from the approximation of the non-parametric functions by piece-wise constant functions. The second source of error, the estimation error, arises from the estimation of the average treatment effect of each cluster. Note that the deviation between our estimate and the true treatment effect is, at most, the sum of these two errors. We will analyze and bound these two different sources of error separately to demonstrate the convergence of our method.
3.1 Approximation error
We start by bounding the bias introduced by approximating by a piece-wise constant function. To guarantee consistency, we establish constraints on valid splits. We adopt the -regularity condition from Definition 4b of [33]. This condition requires that each split retains at least a fraction of the available training examples and at least one treated observation on each side of the split. We further require that the depth of each leaf be on the order and that the trees are fair-split trees. That is, during the tree construction procedure in Algorithm 1, for any given node, if a covariate has not been used in the splits of its last parent nodes, for some , the next split must utilize covariate . If multiple covariates meet this criterion, the choice between them can be made arbitrarily, based on any criterion.
Additionally, we assume that the proportion of treated observations with covariates within a given hyper-rectangle should be approximately proportional to the volume of the hyper-rectangle. This is a ‘coverage condition’ that allows us to accurately estimate the heterogeneous treatment effect on the whole domain using the available observations. For the purposes of this analysis, we assume that all covariates are bounded and normalized to .
Assumption 3.1.
Suppose that all covariates belong to . Let be the lower and upper corners of any hyper-rectangle. We assume that the proportion of observations that have covariates inside this hyper-rectangle is proportional to the volume of the hyper-rectangle , with a margin of error . More precisely,
for some fixed constants and some .
3.1 is a broader condition than the requirement for the covariates to be i.i.d. across observations, as assumed in [33]. Our assumption only requires that the covariates maintain an even density. Indeed, Lemma A.2 in Appendix A illustrates that while i.i.d. covariates satisfy the assumption with high probability, the assumption additionally accommodates (with high probability) scenarios where covariates are either constant over time and only vary across different units, or constant across different units and only vary over time.
In the following result, we demonstrate that, as the number of observations grows, a regression tree, subject to some regularity constraints, contains leaves that become increasingly homogeneous in terms of treatment effect.
Theorem 3.2.
Let be an -regular, fair-split tree, split into leaves, each of which has a depth of at least for some constant . Suppose that and that 3.1 is satisfied. Then, for each treatment and every leaf of , the maximum difference in treatment effects between any two observations within the cluster of observations in that leaf is upper bounded as follows:
where and is the Lipschitz constant for the treatment effect function .
Using the above theorem, we can make the following observation. For any , denote by the regression tree function that is piece-wise constant on each cluster for , with a value of assigned to each cluster . Then, for all covariate vectors , we have because the value assigned to each cluster by is an average of treatment effects within that cluster. This demonstrates that it is possible to approximate the true treatment effect functions with a regression tree function with arbitrary precision. As the number of leaves in the tree increases, the approximation error of the tree decreases polynomially. The theorem requires an upper bound on , which grows with as the dataset expands, due to the definition of the margin or error . For PaCE, we constrain to be on the order of (we require in Theorem 3.5), thereby complying with the upper bound requirement.
3.2 Estimation error
We now bound the estimation error, showing that it converges as increases. For simplicity, we will assume that so that we can write all necessary assumptions and statements in terms of directly. We stress, however, that even without , the statement of Theorem 3.5 also holds by replacing all occurrences of in 3.3, 3.4, and Theorem 3.5 with . Proving this only requires changing to in the proofs accordingly.
Our main technical contribution is extending the convergence guarantee from [17] to a setting with multiple treatment matrices and a convex formulation that centers the rows of without penalization. We require a set of conditions that extend the assumptions made in [17] to multiple treatment matrices.
Throughout the paper, we define the subspace . We next define and similarly to and in Lemma 2.1, except we replace all quantities associated with with the corresponding quantity for . That is, , and for . Now, we are ready to introduce the assumptions that we need to bound the estimation error.
Assumption 3.3 (Identification).
There exist positive constants such that
-
(a)
,
-
(b)
-
(c)
Item 3.3(a) and Item 3.3(b) are the direct generalization of Assumptions 3(a) and 3(b) from [17] to multiple treatment matrices. Proposition 2 of [17] proves that their Assumptions 3(a) and 3(b) are nearly necessary for identifying . This is because it is impossible to recover if were also a matrix of rank for some . More generally, if lies close to the tangent space of in the space of rank- matrices, recovering is significantly harder (the signal becomes second order and may be lost in the noise). In our setting with multiple treatment matrices, we further require that there is no collinearity in the treatment matrices; otherwise, we would not be able to distinguish the treatment effect associated with each treatment matrix. Mathematically, this is captured by Item 3.3(c).
Assumption 3.4 (Noise assumptions).
We make the following assumptions about and .
-
(a)
,
-
(b)
for all ,
-
(c)
for all .
The assumptions involving are mild: they would be satisfied with probability at least if has independent, zero-mean, sub-Gaussian entries with sub-Gaussian norm bounded by (see Lemma D.10), an assumption that is canonical in matrix completion literature [17]. Both Item 3.4(a) and Item 3.4(b) were also used in [17]. Because is a zero-mean matrix that is zero outside the support of , the assumption is mild. In fact, it is satisfied with high probability if the entries of are sub-Gaussian with certain correlation patterns [26]. Furthermore, we note that if there is only one treatment matrix or if all treatment matrices are disjoint, then Item 3.4(c) is guaranteed to be satisfied. This is because, for each , is a zero-mean matrix that is zero outside of the support of . Consequently, in these scenarios, we simply have .
We denote by and the largest and smallest singular values of respectively, and we let be the condition number of .
Theorem 3.5.
Note that the bound becomes weaker as shrinks. In other words, more treated entries within a cluster results in a more accurate estimate for that cluster, as expected. Our rate in Theorem 3.5 matches, up to and factors, the optimal error rate obtained in Theorem 1 of [17], which bounds the error in the setting with one treatment matrix. Our bound accumulated extra factors of because we allowed treatment matrices, and we have an extra factor of because we assumed , instead of Proposition 1 from [17] proves that their convergence rate is optimal (up to factors) in the “typical scenario" where and . We can conclude the same for our rate in Theorem 3.5.
The convergence rate of PaCE is primarily determined by the slower asymptotic convergence rate of the approximation error. However, our result in Theorem 3.5 is of independent interest, as it extends previous results on low-rank matrix recovery with a deterministic pattern of treated entries to allow for multiple treatment matrices.
4 Empirical evaluation
To assess the accuracy of PaCE, we demonstrate its performance on semi-synthetic data. Using publicly available panel data as the baseline , we introduced an artificial treatment and added a synthetic treatment effect to treated entries to generate the outcome matrix . Since the true heterogeneous treatment effects are known, we can verify the accuracy of various methods. Our results show that PaCE often surpasses alternative methods in accuracy, while using a tree with no more than 40 leaves to cluster observations. Thus, PaCE not only offers superior accuracy, but also provides a simple, interpretable solution.
Data
To demonstrate the effectiveness of our methodology, we use two publicly available U.S. economic datasets. The first source comprises monthly Supplemental Nutrition Assistance Program (SNAP) user counts by zip code in Massachusetts, spanning January 2017 to March 2023, obtained from the Department of Transitional Assistance (DTA) public records [25]. SNAP is a federal aid program that provides food-purchasing assistance to low-income families [30]. The second data source comprises nine annual demographic and economic data fields for Massachusetts zip codes, U.S. counties, and U.S. states from 2005 to 2022, provided by the U.S. Census Bureau [31].
We use this data to conduct experiments on panels of varying sizes. In the first set of experiments, we use the SNAP user count as the baseline, , with the zip code-level census data for Massachusetts as covariates. The panel size is 517 zip codes over 70 months. The second set of experiments uses the population below the poverty line (from the U.S. census data) in each state and U.S. territory as the baseline and the remaining census data fields as covariates, with a panel size of 52 states and territories over 18 years. The third set of experiments is similar to the second, but the unit is changed to counties, resulting in a panel size of 770 counties over 18 years. The time period is provided as an additional covariate for the methods that we benchmark against.
Treatment generation
To generate the treatment pattern, we varied two parameters: 1) the proportion of units receiving the treatment and 2) the functional form of the treatment—either adaptive or non-adaptive. In the non-adaptive case, a random proportion of units receive the treatment for a random consecutive period of time. In the adaptive case, for each time period, we apply the treatment to the proportion of units that show the largest absolute percentage change in outcome in the previous time period. The purpose of the adaptive treatment is to mimic public policies that target either low-performing or high-performing units.
The treatment effect is generated by randomly sampling two covariates and either adding or multiplying them, then normalizing the magnitude of the effects so that the average treatment effect is 20% of the average outcome. For the SNAP experiments, the treatment effect is added to the outcome to simulate an intervention increasing SNAP usage. For the state and county experiments, the treatment effect is subtracted from the outcome to represent an intervention that reduces poverty.
Each set of parameters is tested on 200 instances, with the treatment pattern and treatment effect being randomly regenerated for each instance.
Benchmark methods
We benchmark PaCE against the following methods: double machine learning (DML) [14, 15], doubly robust (DR) learner [18], XLearner [23], and multi-arm causal forest [6].333Additional methods are shown in Appendix E. In the main text, we include the five best methods. We implemented PaCE to split the observations into at most 40 clusters. The hyper-parameter used in the convex programs (1) and (2) was tuned so that had a rank of , which was chosen arbitrarily and fixed across all experiments. During the splitting procedure in Algorithm 1, we utilize binary search on each covariate to find the best split. See Appendix E for implementation details.
| Adaptive | Proportion treated | Effect | |||||||||||
|---|---|---|---|---|---|---|---|---|---|---|---|---|---|
| All | No | Yes | 0.05 | 0.25 | 0.5 | 0.75 | 1.0 | Add. | Mult. | ||||
| SNAP | |||||||||||||
| PaCE | 0.59 | 0.58 | 0.60 | 0.26 | 0.54 | 0.76 | 0.75 | 0.65 | 0.64 | 0.54 | |||
| Causal Forest | 0.16 | 0.17 | 0.16 | 0.14 | 0.17 | 0.16 | 0.14 | 0.21 | 0.02 | 0.30 | |||
| DML | 0.11 | 0.21 | 0.00 | 0.12 | 0.13 | 0.08 | 0.09 | 0.11 | 0.17 | 0.04 | |||
| LinearDML | 0.14 | 0.04 | 0.24 | 0.48 | 0.15 | 0.01 | 0.02 | 0.04 | 0.17 | 0.11 | |||
| XLearner | 0.00 | 0.00 | 0.00 | 0.00 | 0.00 | 0.00 | 0.00 | 0.00 | 0.00 | 0.00 | |||
| State | |||||||||||||
| PaCE | 0.41 | 0.39 | 0.42 | 0.23 | 0.32 | 0.39 | 0.54 | 0.56 | 0.46 | 0.36 | |||
| Causal Forest | 0.05 | 0.09 | 0.01 | 0.06 | 0.04 | 0.04 | 0.05 | 0.04 | 0.04 | 0.05 | |||
| DML | 0.27 | 0.29 | 0.26 | 0.41 | 0.36 | 0.27 | 0.17 | 0.16 | 0.31 | 0.24 | |||
| LinearDML | 0.02 | 0.01 | 0.04 | 0.02 | 0.06 | 0.01 | 0.01 | 0.02 | 0.02 | 0.02 | |||
| XLearner | 0.17 | 0.13 | 0.20 | 0.25 | 0.14 | 0.19 | 0.15 | 0.11 | 0.10 | 0.23 | |||
| County | |||||||||||||
| PaCE | 0.06 | 0.10 | 0.02 | 0.16 | 0.08 | 0.04 | 0.02 | 0.01 | 0.07 | 0.06 | |||
| Causal Forest | 0.29 | 0.38 | 0.20 | 0.25 | 0.28 | 0.31 | 0.31 | 0.30 | 0.23 | 0.34 | |||
| DML | 0.35 | 0.35 | 0.35 | 0.34 | 0.37 | 0.34 | 0.39 | 0.31 | 0.47 | 0.24 | |||
| LinearDML | 0.20 | 0.04 | 0.35 | 0.22 | 0.22 | 0.21 | 0.16 | 0.17 | 0.19 | 0.20 | |||
| XLearner | 0.05 | 0.07 | 0.04 | 0.03 | 0.03 | 0.06 | 0.07 | 0.07 | 0.01 | 0.10 | |||
Evaluation
We represent the estimated treated effects by , a matrix where the element in -th row and -th column is the estimate . Accuracy of the estimates is measured using the normalized mean absolute error (nMAE), calculated relative to the true treatment effect :
In Table 1, we present the proportion of instances where each method results in the lowest nMAE. We observe that PaCE performs best in the SNAP and state experiments, achieving the highest proportion of instances with the lowest nMAE. However, it often performs worse than DML and Causal Forest in the county experiments. We hypothesize that this is because the county census data, having many units relative to the number of time periods, ‘most resembles i.i.d. data’ and has less underlying panel structure. However, the average nMAE achieved by PaCE on this data set is competitive with that of DML and Causal Forest, as shown in Table 3. Given that Causal Forest and DML use hundreds of trees, PaCE, which uses only one regression tree, is still a great option if interpretability is desired.
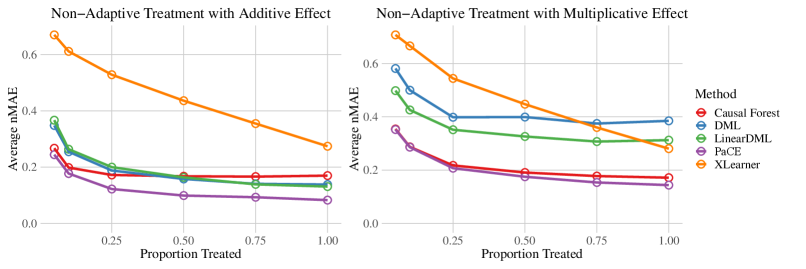
In Figure 1, we show the average nMAE as we vary the proportion of units treated. We only show the results for the SNAP experiments with a non-adaptive treatment pattern, and we refer to Table 3 and Table 4 in Appendix E for the results of additional experiments and for the standard deviations. We observe that while the performance of all methods improves as the proportion of treated entries increases, PaCE consistently achieves the best accuracy on this set of experiments.
5 Discussion and Future Work
This work introduces PaCE, a method designed for estimating heterogeneous treatment effects within panel data. Our technical contributions extend previous results on low-rank matrix recovery with a deterministic pattern of treated entries to allow for multiple treatments. We validate the ability of PaCE to obtain strong accuracy with a simple estimator on semi-synthetic datasets.
One interesting direction for future research is to investigate whether the estimates produced by PaCE are asymptotically normal around the true estimates, which would allow for the derivation of confidence intervals. Further computational testing could also be beneficial. Specifically, assessing the estimator’s performance across a broader array of treatment patterns and datasets would provide deeper insights into its adaptability and limitations. Expanding these tests to include multiple treatments will help in understanding the estimator’s effectiveness in more complex scenarios.
Acknowledgments and Disclosure of Funding
The authors are grateful to Tianyi Peng for valuable and insightful discussions. We acknowledge the MIT SuperCloud [28] and Lincoln Laboratory Supercomputing Center for providing HPC resources that have contributed to the research results reported within this paper. This work was supported by the National Science Foundation Graduate Research Fellowship under Grant No. 2141064. Any opinion, findings, and conclusions or recommendations expressed in this material are those of the authors(s) and do not necessarily reflect the views of the National Science Foundation.
References
- Abadie et al., [2010] Abadie, A., Diamond, A., and Hainmueller, J. (2010). Synthetic control methods for comparative case studies: Estimating the effect of california’s tobacco control program. Journal of the American statistical Association, 105(490):493–505.
- Abadie and Gardeazabal, [2003] Abadie, A. and Gardeazabal, J. (2003). The economic costs of conflict: A case study of the basque country. American economic review, 93(1):113–132.
- Abbe et al., [2020] Abbe, E., Fan, J., Wang, K., and Zhong, Y. (2020). Entrywise eigenvector analysis of random matrices with low expected rank. Annals of statistics, 48(3):1452.
- Athey et al., [2021] Athey, S., Bayati, M., Doudchenko, N., Imbens, G., and Khosravi, K. (2021). Matrix completion methods for causal panel data models. Journal of the American Statistical Association, 116(536):1716–1730.
- Athey and Imbens, [2016] Athey, S. and Imbens, G. (2016). Recursive partitioning for heterogeneous causal effects. Proceedings of the National Academy of Sciences, 113(27):7353–7360.
- Athey et al., [2019] Athey, S., Tibshirani, J., and Wager, S. (2019). Generalized random forests. The Annals of Statistics, 47(3):1148–1178.
- Bai and Ng, [2021] Bai, J. and Ng, S. (2021). Matrix completion, counterfactuals, and factor analysis of missing data. Journal of the American Statistical Association, 116(536):1746–1763.
- Breiman, [2001] Breiman, L. (2001). Random forests. Machine learning, 45:5–32.
- Cai et al., [2010] Cai, J.-F., Candès, E. J., and Shen, Z. (2010). A singular value thresholding algorithm for matrix completion. SIAM Journal on optimization, 20(4):1956–1982.
- Chatterjee, [2020] Chatterjee, S. (2020). A deterministic theory of low rank matrix completion. IEEE Transactions on Information Theory, 66(12):8046–8055.
- Chen et al., [2020] Chen, Y., Chi, Y., Fan, J., Ma, C., and Yan, Y. (2020). Noisy matrix completion: Understanding statistical guarantees for convex relaxation via nonconvex optimization. SIAM journal on optimization, 30(4):3098–3121.
- Chen et al., [2019] Chen, Y., Fan, J., Ma, C., and Yan, Y. (2019). Inference and uncertainty quantification for noisy matrix completion. Proceedings of the National Academy of Sciences, 116(46):22931–22937.
- Chen et al., [2021] Chen, Y., Fan, J., Ma, C., and Yan, Y. (2021). Bridging convex and nonconvex optimization in robust pca: Noise, outliers, and missing data. Annals of statistics, 49(5):2948.
- [14] Chernozhukov, V., Chetverikov, D., Demirer, M., Duflo, E., Hansen, C., Newey, W., and Robins, J. (2017a). Double/debiased machine learning for treatment and causal parameters. Technical report.
- [15] Chernozhukov, V., Goldman, M., Semenova, V., and Taddy, M. (2017b). Orthogonal machine learning for demand estimation: High dimensional causal inference in dynamic panels. arXiv, pages arXiv–1712.
- Devroye, [1977] Devroye, L. P. (1977). A uniform bound for the deviation of empirical distribution functions. Journal of Multivariate Analysis, 7(4):594–597.
- Farias et al., [2021] Farias, V., Li, A., and Peng, T. (2021). Learning treatment effects in panels with general intervention patterns. Advances in Neural Information Processing Systems, 34:14001–14013.
- Foster and Syrgkanis, [2023] Foster, D. J. and Syrgkanis, V. (2023). Orthogonal statistical learning. The Annals of Statistics, 51(3):879–908.
- Foucart et al., [2020] Foucart, S., Needell, D., Pathak, R., Plan, Y., and Wootters, M. (2020). Weighted matrix completion from non-random, non-uniform sampling patterns. IEEE Transactions on Information Theory, 67(2):1264–1290.
- Gobillon and Magnac, [2016] Gobillon, L. and Magnac, T. (2016). Regional policy evaluation: Interactive fixed effects and synthetic controls. Review of Economics and Statistics, 98(3):535–551.
- Imbens and Rubin, [2015] Imbens, G. W. and Rubin, D. B. (2015). Causal inference in statistics, social, and biomedical sciences. Cambridge university press.
- Klopp et al., [2017] Klopp, O., Lounici, K., and Tsybakov, A. B. (2017). Robust matrix completion. Probability Theory and Related Fields, 169:523–564.
- Künzel et al., [2019] Künzel, S. R., Sekhon, J. S., Bickel, P. J., and Yu, B. (2019). Metalearners for estimating heterogeneous treatment effects using machine learning. Proceedings of the national academy of sciences, 116(10):4156–4165.
- Liu et al., [2017] Liu, G., Liu, Q., and Yuan, X. (2017). A new theory for matrix completion. Advances in Neural Information Processing Systems, 30.
- Massachusetts Government, [2024] Massachusetts Government (2024). Department of transitional assistance caseload by zip code reports. https://www.mass.gov/lists/department-of-transitional-assistance-caseload-by-zip-code-reports. Accessed: 2024-05-09.
- Moon and Weidner, [2016] Moon, H. and Weidner, M. (2016). Linear regression for panel with unknown number of factors as interactive effects. Econometrica, à paraître.
- Nie and Wager, [2021] Nie, X. and Wager, S. (2021). Quasi-oracle estimation of heterogeneous treatment effects. Biometrika, 108(2):299–319.
- Reuther et al., [2018] Reuther, A., Kepner, J., Byun, C., Samsi, S., Arcand, W., Bestor, D., Bergeron, B., Gadepally, V., Houle, M., Hubbell, M., Jones, M., Klein, A., Milechin, L., Mullen, J., Prout, A., Rosa, A., Yee, C., and Michaleas, P. (2018). Interactive supercomputing on 40,000 cores for machine learning and data analysis. In 2018 IEEE High Performance extreme Computing Conference (HPEC), pages 1–6. IEEE.
- Su et al., [2009] Su, X., Tsai, C.-L., Wang, H., Nickerson, D. M., and Li, B. (2009). Subgroup analysis via recursive partitioning. Journal of Machine Learning Research, 10(2).
- United States Department of Agriculture, [2024] United States Department of Agriculture (2024). Supplemental Nutrition Assistance Program (SNAP). https://www.fns.usda.gov/snap/supplemental-nutrition-assistance-program. Accessed: May 15, 2024.
- U.S. Census Bureau, [2023] U.S. Census Bureau (2023). American Community Survey (ACS) 1-Year Data. https://www.census.gov/data/developers/data-sets/acs-1year.html. Accessed data from multiple years between 2005 and 2022. Accessed: 2024-05-09.
- Vershynin, [2018] Vershynin, R. (2018). High-dimensional probability: An introduction with applications in data science, volume 47. Cambridge university press.
- Wager and Athey, [2018] Wager, S. and Athey, S. (2018). Estimation and inference of heterogeneous treatment effects using random forests. Journal of the American Statistical Association, 113(523):1228–1242.
- Xiong et al., [2023] Xiong, R., Athey, S., Bayati, M., and Imbens, G. (2023). Optimal experimental design for staggered rollouts. Management Science.
- Xiong and Pelger, [2023] Xiong, R. and Pelger, M. (2023). Large dimensional latent factor modeling with missing observations and applications to causal inference. Journal of Econometrics, 233(1):271–301.
- Yu et al., [2015] Yu, Y., Wang, T., and Samworth, R. J. (2015). A useful variant of the davis–kahan theorem for statisticians. Biometrika, 102(2):315–323.
Appendix A Proofs for the approximation error
Proof of Theorem 3.2.
We define the diameter of a given set of points as the maximum distance between two points in the set :
Because the treatment effect function is Lipschitz continuous for every , with Lipschitz constant , it suffices to show that, for any leaf in , the set of points within that leaf has a diameter bounded above as follows:
In this proof we assume, without loss of generality, that all leaves are at depth exactly . If a leaf were instead even deeper in the tree, the diameter of the associated cluster would be even smaller. We begin by establishing a lower bound for the number of observations in any node of the tree . This is done by leveraging the fact that every node is at depth at most , the upper bound on the number of leaves , and the property of -regularity. Specifically, due to -regularity, we have . Hence,
Rearranging, we have the following for any node of the tree :
| (4) |
Next, for every covariate and any leaf , we aim to establish an upper bound for the length of along the -th coordinate, denoted . This is defined as follows:
Utilizing the lower bound in 3.1, the volume of the rectangular hull enclosing the points in a given node can be upper bounded as follows:
| (5) |
where the last inequality made use of (4). Given the -regularity of splits, we know that a child of node has at most observations. This implies that the volume of the rectangular hull enclosing the points removed by the split on node satisfies:
| (6) |
Putting (5) and (6) together, we have , which means that a split along a given covariate removes at least fraction of the length along that coordinate.
Because the tree is a fair-split tree, for every splits, at least one split is made on every covariate. Hence, the number of splits leading to node along each coordinate is at least .
As a result, for every , we have , which implies
which proves the desired bound. ∎
The following lemma is a generalization of the multivariate case of the Dvoretzky–Kiefer–Wolfowitz inequality. Specifically, it provides a bound on the maximum deviation of the empirical fraction of observations within a hyper-rectangle from its expected value. It will be used in the proof of Lemma A.2.
Lemma A.1.
Let be a -dimensional random vector with pdf . Let be an i.i.d. sequence of -dimensional vectors drawn from this distribution. For any , define
and
Then, for any , we have both of the following bounds:
Proof.
We use ideas from the proof of the main theorem in [16] and their notation. Because the i.i.d. samples are drawn from a distribution with a density function, on an almost sure event , they do not share any component in common. For , let , and let denote the set of random vectors that are obtained by considering all vectors of the form , where .
Because is a staircase function with flat levels everywhere except at points in , and is monotonic, is maximized when and approach vectors that are in . Under the event , we have
where the is due to the fact that, for any there may be up to different points in that share a component with or under the event . These points lie on the perimeter of the hyper-rectangle between and and could be included or excluded from the count for depending on whether approaches (and approaches ) from the inside or outside of the hyper-rectangle.
Now, it remains to upper bound the right hand side of the above inequality. For any pair of indices , there exists a subset of indices , corresponding to samples of that have at least one component in common with either or . Hence, the samples indexed by are not independent from both and . In order to apply Hoeffding’s inequality to the samples, we sample additional i.i.d. random vectors from the same distribution. These serve to ‘substitute’ those samples for which . Under , the number of indices in satisfies , and we have
The first inequality is due to the triangle inequality, and the second inequality follows because .
By the independence of both and with for , we apply Hoeffding’s inequality conditioned on the realizations of and to establish the following upper bound:
Applying a Union Bound over all , we obtain
This proves our first bound. To show the second bound, we note that the first line of the above inequality can be rewritten as
∎
Lemma A.2.
For large enough and , the covariates for and satisfy 3.1 with probability at least if, for any nonnegative integer , , and that add up to , every is the concatenation of vectors , which are independently generated as follows:
-
1.
Covariates varying by unit and time: Each is i.i.d., sampled from a distribution on with density uniformly lower bounded by and upper bounded by .
-
2.
Covariates varying only across units: Draw i.i.d. samples from a distribution on , bounded in density between and . These make up for , with arbitrary ordering. For every and , we have .
-
3.
Covariates varying only over time: Draw i.i.d. samples from a distribution on with the same density bounds. These form for , with arbitrary ordering. For every and , we have .
Proof.
The proof of the lemma proceeds as follows. We first formally define an event , which intuitively states that the maximum deviation between the fraction of samples falling within a specified interval and its expected value is bounded. Our second step is to show that the event occurs with high probability, and our final step is to show that under the event , 3.1 is satisfied.
We begin by defining our notation. For any random vector , we define as the empirical fraction of observations that fall within a specified interval , with having the same dimension as . The expected value of this quantity is denoted . Note that we have
Defining event . Now we will formally define , which is the intersection of three events . The events (resp. ) is the event that maximum deviation between the fraction of samples from random variable (resp. ) falling within an interval and its expected value is bounded. To simplify our notation, we let . Mathematically,
We will now turn to defining event , which intuitively bounds the deviation for the samples. In the event , rather than considering all of the samples of , we are only considering the samples of for which the corresponding and samples satisfy given constraints. That is, is the event that for any constraints on and , the maximum deviation between the following is bounded: 1) the proportion of samples with and satisfying the constraint, that have fall within a specified interval and 2) the expected fraction of samples falling within a specified interval. We will define the event formally below.
To define event , we begin by defining (resp. ), which is the set of all possible subsets of units (resp. time periods) selected by some constraint on (resp. ). Given the random variables for , we denote by all vectors formed by selecting its -th coordinate (for each ) from this set of observed values: . We similarly define using the variables for . Next, for any choice of indices such that , we denote by the subset of units that lie in the hyper-rectangle defined by and , that is
We define similarly, for any with . Finally, and is similarly defined. We are now ready to define the last event:
Bounding the probability of event . By Lemma A.1, we directly have
We now show that occurs with high probability. Note that conditioned on the realizations of and for and , and for any choice of unit and time period subsets and , all the random variables for are still i.i.d. according to the distribution since they are sampled independently from samples of and . As a result, we can apply Lemma A.1 to obtain
with probability at least for any given and and for any realization of the random variables for and for . Taking the union bound, over all choices of indices and then shows that
In particular, the same lower bound still holds for after taking the expectation over the samples from and . Putting all the probabilistic bounds together, we obtain
Plugging in , this event has probability at least .
3.1 is satisfied under event . We suppose that event holds for the rest of this proof. Consider an arbitrary hyper-rectangle in with lower and upper corners and , where . For convenience, we decompose into three distinct vectors: , , and , such that the concatenation of these three vectors forms . Similarly, is decomposed into vectors , , and . Our goal is to bound the number of observations that simultaneously satisfy the constraints:
First, the set of units that satisfies the constraint is included within the considered sets . Similarly, the set of time periods satisfying the constraint is also in . As a result, because is satisfied, we have
Multiplying both sides by , we have
| (7) |
We then use the events and to bound the number of units and times satisfying their respective constraints:
| (8) |
Now let . Provided that and are large enough such that , inequalities (7) and (8) imply
| (9) |
Because of the assumed density bounds on , , and , we have
Combining this with (9) completes the proof. ∎
Appendix B Proof of Lemma 2.1
Lemma B.1.
Define the matrix subspace as follows:
The projection onto its orthogonal space is
Proof.
For a given matrix , we define . To show that , it suffices to show that and .
First, note that and because of the construction of . This implies that for any matrices and , we have . Next, we note that
As a result, we also have for all . This ends the proof that .
Next, we compute
Hence, , which concludes the proof of the lemma. ∎
Proof of Lemma 2.1..
It is known [9] that the set of subgradients of the nuclear norm of an arbitrary matrix with SVD is
Thus, the first-order optimality conditions of (2) are
| (10a) | ||||
| (10b) | ||||
| (10c) | ||||
| (10d) | ||||
| (10e) | ||||
| (10f) | ||||
By the definition of our model, we have We plug this into equation (10b):
We apply to both sides, where the formula for the projection is given in Lemma B.1:
The last line makes use of the following claim:
Claim B.2.
.
To compute , we right-multiply (10b) by . We note that by (10f), we have . Hence, we find
where is due to B.2. As a result, we can conclude that .
Substituting into (11), we obtain for all :
| (12) |
Rearranging, we have
This is equivalent to the error decomposition in the statement of the lemma, completing the proof. ∎
Proof of B.2.
Suppose for contradiction that . Then, there is a solution that for which the objective is lower, contradicting the optimality of . That solution can be constructed as follows. Define to be the matrix resulting from projecting each column of onto the space orthogonal to the vector . That is, the -th column of is . Let be the vector such that . The solution achieves lower objective value because the value of the expression in the Frobenius norm remains unchanged, but . The inequality is due to the fact that matrix is still an orthogonal matrix, but its columns have norm that is at most 1, and at least one of its columns has norm strictly less than 1. ∎
Appendix C Proof of Theorem 3.5
We aim to bound . Throughout this section, we assume that the assumptions made in the statement of Theorem 3.5 are satisfied. To simplify notation, we define . We have
| (13) | ||||
where is due to the error decomposition in Lemma 2.1 and the definition of .
Hence, we aim to upper bound and and lower bound . The main challenge lies in upper bounding . In fact, the desired bounds for and (presented in the following lemma) are obtained during the process of bounding .
Lemma C.1.
Let and be defined as in Lemma 2.1. We have . Furthermore, we have the following for sufficiently large :
The proof of the above lemma is provided in Section D.6.
We now discuss the strategy for bounding . In order to control , we aim to show that the true counterfactual matrix has tangent space close to that of . Because we introduced in the convex formulation, which centers the rows of without penalization from the nuclear norm term, we will focus on the projection of that has rows with mean zero, . Recall that is its SVD, and define and . We similarly define these quantities for : and . We aim to show that we have . This is stated formally in Lemma C.2, which requires introducing a few additional notations first.
Let denote the convex function that we are optimizing in (2). Recall that is a global optimum of function . Following the main proof idea in [17], we define a non-convex proxy function , which is similar to , except is split into two variables and expressed as .
Our analysis will relate to a specific local optimum of , which we will show is close to . The local optimum of considered is the limit of the gradient flow of , initiated at , formally defined by the following differential equation:
| (14) |
We define as the rotation matrix that optimally aligns with . That is, letting denote the set of orthogonal matrices, is formally defined as follows:
Define to be the vertical concatenation of matrices and . That is, . We are now ready to present Lemma C.2.
Lemma C.2.
For sufficiently large , the gradient flow of , starting from , converges to such that and for some rotation matrix . Furthermore, , where
Let us derive an upper bound on . Because and , we can conclude that . Thus, we can upper bound as follows:
| (15) |
Using (15) and the assumption provided in the theorem, we can further upper bound as follows:
| (16) |
With Lemma C.2 and the bound on , we can complete the proof of the theorem as follows.
where , and the last line comes from the closed form of the projection derived in Lemma B.1. We can use the fact that from B.2 to simplify the expression. Note that with , simply evaluates to .
where the last step is due to the fact that because .
Finally, let be the limit of the gradient flow of starting from . By Lemma C.2, we have and for some rotation matrix . This, combined with the definition of , implies for any and . Hence,
| (17) | ||||
where the last step is due to the fact that
Now that we have bounded , , and , we can plug these bounds into (13) to complete the proof of the theorem.
Appendix D Proof of Lemma C.2
Throughout this section, we assume that the assumptions made in the statement of Theorem 3.5 are satisfied. The proof of Lemma C.2 is completed by combining the results of the following two lemmas.
Lemma D.1.
Any point on the gradient flow of starting from satisfies .
Lemma D.2.
The limit of the gradient flow of starting from satisfies and for some rotation matrix .
We note our methodology differs from that of [17]. Instead of analyzing a gradient descent algorithm, we analyze the gradient flow of the function . This allows us to simplify the analysis by avoiding error terms due to the discretization of gradient descent.
In this section, we start by deriving the gradient of the function and examining some properties of its gradient flow in Section D.1. Then, we prove some technical lemmas. We extend 3.3 to a broader subset of matrices within the set in Section D.2, and establish bounds on the noise in Section D.3. Finally, we complete the proofs of Lemma D.1 in Section D.4 and Lemma D.2 in Section D.5.
D.1 The gradient of the function
Before we prove Lemma D.1, we need to derive the gradient of the function .
Define to be the projection operator that projects onto the subspace . Note that in the definition of , the quantities and are chosen to minimize the distance between and this subspace, measured in terms of Euclidean norm. Hence, we can view and as coordinates of the projection of onto this subspace. This observation gives us the following equivalent definition of :
Consider a single entry of the matrix : . Note that the expression inside the Frobenius norm is linear in . Hence, we can rewrite as follows:
for some matrices and that do not depend on (but may depend on other entries of , and ).
Now we take the partial derivative of with respect to . Let be the matrix where all elements are zero except for the element in the -th row and -th column, which is 1. Then,
where is due to the fact that and were defined such that Hence,
where . We will write and to represent and below for notational simplicity.
Using , we can simplify the gradient as follows:
Because and are coordinates of the projection of onto the subspace , we have
Additionally, because , the right hand side quantity is also in the subspace , so we have
Subtracting the two equations above, we have
| (18) |
Using (18), we can rewrite
Similarly, we can derive
D.1.1 Properties of the gradient flow
We now prove some properties of the gradient flow of the function starting from the point . For simplicity of notation, we define
so we can simplify our gradients as follows:
| (19) |
Lemma D.3.
Every point on the gradient flow of function starting from the point satisfies
Proof.
Note that at the starting point , we have that as desired.
Next, we examine the change in the value as we move along the gradient flow defined by (14). For convenience, we omit the superscript in and . Using (14), we have
The derivative of is
showing that . As a result, recalling that , we can solve the differential equation to obtain for all . ∎
Lemma D.4.
Every point on the gradient flow of function starting from the point satisfies Furthermore, if is the SVD of , then
Proof.
Using (because ), we have that
which can only happen if . This implies that .
Using the same approach as the proof of Lemma D.3, we examine the change in the value of as we move along the gradient flow defined by (14). We omit the superscript in for notational convenience. Using (14), we have . Now we compute the derivative of :
The equality follows because is the projection onto a space orthogonal to , effectively centering its rows. Because has zero-mean rows, .
Note that . Solving the differential equation, we have for all . Using the same logic we used to show , we have that implies . ∎
D.2 Extending assumptions to
We prove a lemma that extends Assumptions 3.3(a), 3.3(b), and 3.3(c) to a broader subset of matrices within the set , thereby expanding the applicability of the original assumptions.
We’ll begin by proving a useful lemma that provides bounds for the singular values of matrices in the set . We show these values are within a constant factor of the singular value range of and , spanning from to .
Lemma D.5.
For large enough and , we have the following for any :
Proof.
The singular values of a matrix are not changed by right-multiplying by an orthogonal matrix. Hence, without loss of generality, we suppose that are rotated such that they are optimally aligned with ; in other words, . Then, gives us
where the last step is due to (16).
Then by Weyl’s inequality for singular values, for any , we have
We also have
The proof for is identical. ∎
Now, we present the lemma which extends 3.3 to a broader subset of matrices in .
Lemma D.6.
Suppose that and that there exists a rotation matrix such that is along the gradient flow of function starting from the point . Let denote the values that minimize . Let be the SVD of . Let be the span of the tangent space of , and denote by the span of and . Define as the vector with components Define to be the matrix with entries .
Assume Item 3.3(b) holds, then for large enough ,
| (23) |
Assume Item 3.3(c) holds, then for large enough ,
| (24) |
Proof of Lemma D.6..
We will make use of the following claim throughout this proof:
Claim D.7.
The proof of (20) and (21) follow the exact same logic as the proof of (68) and (69) in the proof of Lemma 13 in [17].
Proof of (22). We use Lemma B.1 to compute the projections of the treatment matrices. Let and let . By Lemma D.4, we have . Hence, , which allows us to simplify as follows:
where is due to , the fact that projection matrices and have Frobenius norm at most 1. In particular for step , we note that the rank of the matrices inside the nuclear norm is because , , , and are all rank matrices, and we have that and .
Proof of (24). Define such that for . We upper bound the magnitude of the entries of . For any and , we have
| (25) | ||||
The equality is due to the fact that for any projection operator and matrices and , we have , and is due to the Cauchy–Schwarz inequality and the fact that the , and follows from D.7.
By Weyl’s inequality, we have Now we upper bound the second term as follows:
| (26) |
Putting everything together, for large enough ,
Proof of (23). We wish to bound This quantity can be restructured as
| (27) |
where and are defined just above 3.3, and and are defined as follows:
We bound these two quantities as follows.
Claim D.8.
We have that and .
To bound , we consider the following additional observations. Firstly, we have . This follows from the fact that , and is a vector of length (where ) with entries that do not exceed 1. Moreover, we have because for every , has Frobenius norm (and hence spectral norm) at most 1. Now, we are ready to plug all of this into (27) to bound as follows.
where is due to Item 3.3(b). ∎
Proof of D.7.
First, we note that we have
where is bounded by Lemma D.5. Hence, we can make use of Theorem 2 from [36], combined with the symmetric dilation trick from section C.3.2 of [3], to obtain the following. There exists an orthogonal matrix such that
Now we can obtained the desired bound as follows:
We can similarly bound both and . ∎
Proof of D.8.
can be simply bounded as follows:
where the last bound was shown in 25. Because , we have the desired bound for .
It remains to bound :
Bounding . Applying Assumption 3.3(c), we can bound as follows:
where the last step makes use of D.7.
Bounding . Because , we can write
Note that this quantity is well-defined because
where the last bound is due to (26) and Item 3.3(c). Now, we have
We use this to bound . Using (26) and Item 3.3(c), and the fact that because it is a vector of length with all components less than or equal to 1, we have
∎
D.3 Discussion of
Recall that the matrix consists of two components . is a noise matrix, and is the matrix of the approximation error. Refer to 3.4 for our assumptions on and .
We need to ensure that the error does not significantly interfere with the recovery of the treatment effects. That is, we need to ensure that is not confounded with the treatment matrices for . This condition is formalized and established in the following lemma.
Lemma D.9.
Let be along the gradient flow of function starting from the point , and let denote the values that minimize . Let be the span of the tangent space of and . Then, we have
Proof of Lemma D.9.
We now argue that the assumptions on the noise matrix from 3.4 are mild. The following lemma shows that under standard sub-Gaussianity assumptions, these are satisfied with very high probability.
Lemma D.10.
Suppose that the entries of are independent, zero-mean, sub-Gaussian random variables, and the sub-Gaussian norm of each entry is bounded by , and is independent from for . Then, for sufficiently large, with probability at least , we have
Proof of Lemma D.10.
We start by proving that with probability at least , we have . We use the following result bounding the norm of matrices with sub-Gaussian entries.
Theorem D.11 (Theorem 4.4.5, [32]).
Let be an random matrix whose entries are independent, mean zero, sub-Gaussian random variables with sub-Gaussian norm bounded by . Then, for any , we have
with probability at least .
As a result of the above theorem, recalling that is a matrix with and using , we have with probability at least .
We next turn to the second claim. The general version of Hoeffding’s inequality states that: for zero-mean independent sub-Gaussian random variables , we have
for some absolute constant . Hence, for any :
Applying the Union Bound over all :
Applying the Union Bound shows that the two desired claims hold with probability at least for sufficiently large . ∎
D.4 Proof of Lemma D.1
If the gradient flow of started at never intersects the boundary of , then we are done. For the rest of the proof, we will suppose that such an intersection exists. Fix any point at the intersection of the boundary of and the gradient flow of . We aim to show that at this boundary point, the inner product of the normal vector to the region (pointing to the exterior of the region) and the gradient of is positive. This property implies that the gradient flow of , initiated from any point inside , cannot exit . Proving this characteristic is sufficient to prove Lemma D.1.
We denote by the rotation matrix that optimally aligns the fixed boundary point to . Consider
Note that differs from because is fixed to be the rotation matrix associated with a given point . and are tangent to each other at , so the normal vector to and are co-linear at . Thus, it suffices to show that the normal vector to at , and the gradient of at have positive inner product.
To simplify our notation, we define
Additionally, we define , , and .
The normal vector to at is simply the subgradient of at , which is . Hence, we aim to show that the following inner product is positive:
where we used the formula for the gradient of from Eq (19). In the remainder of this subsection, we will use the following shorthand notations for simplicity: we denote , , and as , , and respectively. The above inner product becomes:
By Item 3.4(a), we have . In particular,
where (i) is because by the Triangle Inequality, and gives , where the last step is due to the assumed bound on .
Recalling , we bound :
Finally, we will lower bound . For some with , we have the following:
where is due to the fact that and is already in the subspace by the definition of as the tangent space of ; is due to Lemma D.6. Note that Lemma D.6 applies because is the tangent space of , and was fixed to be on the gradient flow. Furthermore, we can bound as follows:
where makes use of Lemma D.5, and follows from the bound on from (15), and the last step follows from the bound on .
Now, we are ready to put everything together to bound the inner product:
Putting previous bounds together, we have
On the other hand, we can lower bound the positive term of using the following lemma.
Lemma D.12.
Consider a point on the gradient flow of function starting from the point , such that . Then,
By Lemma D.12 we have
We plug in because we assumed that is at the border of region . Hence,
Finally, for large enough ,
Proof of Lemma D.12.
D.5 Proof of Lemma D.2
Let denote the convex function that we are optimizing in (2). Recall that is a global optimum of function . In this subsection, we prove Lemma D.2, which relates to a local optimum of .
We begin by proving the following useful lemma, which is similar to Lemma 20 from [11], but allows to have different dimensions.
Lemma D.13.
Consider matrices and such that . There is an SVD of denoted by such that and for some rotation matrix .
Proof.
Let and be their respective SVDs, ordering the diagonal components of and by decreasing order. Then, implies and that the singular subspaces of and coincide. Hence, there exists an SVD decomposition of such that . Then, . This is an SVD of , with , , and . Substituting these quantities into the SVD of and , we complete the proof that and , where . ∎
Let represent the limit of the gradient flow of from the initial point . Let and be the values that minimize . Furthermore, let the SVD of be denoted by .
By Lemma D.3, we have that . Then, Lemma D.13 gives us
| (29) |
We claim that to prove Lemma D.2, it suffices to prove that . If we prove that , we would have by Lemma D.13 and for some rotation matrix . This proves Lemma D.2.
The proof that consists of two parts. We will first establish that is also an optimal point of by verifying the first order conditions of are satisfied. We will then show that has a unique optimal solution . Putting these two parts together establishes that .
D.5.1 First order conditions of are satisfied
We will first show that the following first order conditions of are satisfied at .
| (30a) | ||||
| (30b) | ||||
| (30c) | ||||
| (30d) | ||||
| (30e) | ||||
| (30f) | ||||
We select . Note that (30a) and (30f) are automatically satisfied given the definition of and , and (30b) is automatically satisfied by our choice of .
To show (30c) and (30d), we use the fact that :
Now, by Lemma D.13, we can decompose and where is a rotation matrix. Right-multiplying the above equations by gives
Rearranging, the first equation shows that and the second shows .
The last step of the proof is to verify 30e. Using (30c) and (30d), we have
where the last line is obtained by plugging in our chosen value of and using (29) to get rid of the term. Plugging in , we have
We will use substitution to get rid of the term. Because we have and
this implies that
Substituting this expression into our expression for , we have
where the term went away because by (29).
By Lemma D.4, we have . This allows us to simplify the closed form expression for the projection given in Lemma B.1: . Hence,
We can upper bound its spectral norm as follows:
Now, we bound each of these terms separately.
Bounding . By (29), we have and . Hence,
where follows from the bound on from (15), and the last step follows from the bound on .
Bounding . is bounded by Item 3.4(a) which gives .
Bounding . If satisfy (30a)–(30d) and (30f), then the following decomposition holds due to the same proof as in Lemma 2.1.
where is the matrix with entries and are vectors with components
Claim D.14.
We have
With the above claim, we are ready to bound .
Hence, we conclude that
for large enough and .
Proof of D.14..
Bounding . Using Lemma D.9, we have
Bounding . can be bounded by following the exact same steps as the bound of (17), replacing , , and with , , and , respectively. In particular, note that Lemma D.4 gives that along the gradient flow that ends at , which allows the same simplifications.
where the last step used the assumed bound on . ∎
D.5.2 Function has a unique minimizer
In this subsection, we aim to show that the convex function has a unique minimizer. Throughout the proof, we fix a global minimum of , such that , where is the limit of the gradient flow of starting from . We have already showed in Section D.5.1 that , satisfies all of the first order conditions of ; hence is indeed a minimizer of . First note that up to a bijective change in variables, minimizing is equivalent to minimizing the following function
Hence, it suffices to show that has a unique minimizer. This function is strictly convex in , because of the term . We can then fix to be the unique value of that minimizes . In particular, note that . It only remains to show that the following convex optimization problem
| (31) |
has a unique minimizer. By the definition of , a minimum of the right-hand side of (31) is attained for and (otherwise, wouldn’t be an optimum of ). Now consider any other optimal solution to the problem in (31), that is such that . Write the SVD . Recall that the subgradients of the nuclear norm are . By the convexity of the nuclear norm, we have
| (32) |
for any matrix with , and . Recall that is defined to be the tangent space of . Defining the SVD , we can take , which gives
| (33) |
We now use the following lemma.
Claim D.15.
Under the same assumptions as in Lemma D.6, we have
With this result, we have that if , then , which contradicts the definition of . Hence, which ends the proof that has a unique minimizer.
Proof of D.15.
Up to changing into , it suffices to show that for all non-zero , we have . First, using similar arguments as in (33) we show that for any matrices and such that with SVD , we have
Hence, . In particular, we can take and since they are orthogonal to each other due to the fact that . Then, we have
Next, by Lemma D.4 we have , so that . The two previous steps essentially show that we can ignore the terms of the form within . Formally, it suffices to show that for any non-zero , we have . We decompose such a matrix as . First, by (21) of Lemma D.6, we have that , which implies . Then, with , we have
where is due to the fact that and the fact that the Frobenius norm of a matrix, squared, is the sum of the squares of the singular values of that matrix; uses the identity .
D.6 Proof of Lemma C.1
See C.1
Proof.
By Lemma C.2, for sufficiently large , we can write where is the limit of the gradient flow of started at , and . Hence, the conditions for applying both Lemma D.6 and Lemma D.9 with , the tangent space of , are satisfied. By (24) from Lemma D.6, we have the desired bound on . Furthermore, we have
We aim to bound , where . We have
where is due to Von Neumann’s trace inequality, is due to (22) and Item 3.4(a), and is due to (15). Hence,
∎
Appendix E Details of Computational Experiments
In this section, we presents more details and results for Section 4. Our code and data are available at this GitHub repository.
Compute resources: Our experiments utilized a high-performance computing cluster, leveraging CPU-based nodes for all experimental runs. Our home directory within the cluster provides 10 TB of storage. Experiments were conducted on nodes equipped with Intel Xeon CPUs, configured with 5 CPUs and 20 GB of RAM. We utilized approximately 40 nodes operating in parallel to conduct 200 iterations of experiments for each parameter set. While a single experiment completes within minutes on a personal laptop, executing the full suite of experiments on the cluster required approximately one day.
Method implementations: Similar to the methodology outlined in the supplemental materials of [17], we implemented PaCE using an alternating minimization technique to solve the convex optimization problem. To tune the hyperparameter , we initially set it to a large value and gradually reduced it until the rank of reached a pre-defined rank . In all of our experiments, we fixed to 6. We note that we did not tune this pre-defined rank, and our method might achieve better performance with a different rank.
The following models from the Python econml package were implemented. The supervised learning models from sklearn were chosen for the parameters in our implementation:
-
•
DML and CausalForestDML:
-
–
model_y: GradientBoostingRegressor
-
–
model_t: GradientBoostingClassifier
-
–
model_final: LassoCV (for DML)
-
–
-
•
LinearDML:
-
–
model_y: RandomForestRegressor
-
–
model_t: RandomForestClassifier
-
–
-
•
XLearner and ForestDRLearner:
-
–
models/model_regression: GradientBoostingRegressor
-
–
propensity_model/model_propensity: GradientBoostingClassifier
-
–
Additionally, we implemented DRLearner from the Python econml package using the default parameters. We also implemented multi_arm_causal_forest from the grf package in R.
Finally, we implemented matrix completion with nuclear norm minimization (MCNNM), where the matrix of observed entries is completed using nuclear norm penalization. The regularization parameter for the nuclear norm term, , is chosen in the same way that it is chosen in our implementation of PaCE.
We note that LLMs facilitated our implementation of all these methods, the experiment and visualization code, and our data processing code.
Notes about the data: We imputed missing data values for 2020 by calculating the average values from 2019 and 2021. Furthermore, in the supplemental code and data provided [available at this GitHub repository], we redacted a covariate column ‘Snap_Percentage_Vulnerable’ that was used in our experiments because it was obtained using proprietary information.
Additional results: Table 2 presents the proportion of instances in which each method achieved the lowest normalized Mean Absolute Error (nMAE) across all of our experiments. It encompasses every method we benchmarked.
Table 3 and Table 4 detail the complete results for the average nMAE of each method, along with the corresponding standard deviations. Table 3 reports the nMAE values for estimating heterogeneous treatment effects across all observations. In contrast, Table 4 focuses on the nMAE values for treated observations only. Note that MCNNM only appears in Table 4, as this method does not directly give estimates of heterogeneous treatment effects for untreated observations.
In the following tables, the "All" column presents the result for all instances across all parameter settings. These settings include proportions of zip codes treated at 0.05, 0.25, 0.5, 0.75, and 1.0; either with adaptive or non-adaptive treatment application approaches; and under additive or multiplicative treatment effects. Each parameter set is tested in 200 instances, totaling 4000 instances reflected in each value within the "All" column. Subsequent columns detail outcomes when one parameter is held constant. Specifically, the "Adaptive" and "Effect" columns each summarize results from 2000 instances, while each result under the "Proportion treated" column corresponds to 800 instances. The standard deviations, shown in parentheses within Table 3 and Table 4, are calculated for each result by analyzing the variability among the instances that contribute to that particular data point.
| Adaptive | Proportion treated | Effect | |||||||||||
|---|---|---|---|---|---|---|---|---|---|---|---|---|---|
| All | N | Y | 0.05 | 0.25 | 0.5 | 0.75 | 1.0 | Add. | Mult. | ||||
| SNAP | |||||||||||||
| PaCE | 0.59 | 0.58 | 0.60 | 0.26 | 0.54 | 0.76 | 0.75 | 0.65 | 0.64 | 0.54 | |||
| Causal Forest | 0.16 | 0.17 | 0.16 | 0.14 | 0.17 | 0.16 | 0.14 | 0.21 | 0.02 | 0.30 | |||
| CausalForestDML | 0.00 | 0.00 | 0.00 | 0.00 | 0.00 | 0.00 | 0.00 | 0.00 | 0.00 | 0.00 | |||
| DML | 0.11 | 0.21 | 0.00 | 0.12 | 0.13 | 0.08 | 0.09 | 0.11 | 0.17 | 0.04 | |||
| DRLearner | 0.00 | 0.00 | 0.00 | 0.00 | 0.00 | 0.00 | 0.00 | 0.00 | 0.00 | 0.00 | |||
| ForestDRLearner | 0.00 | 0.00 | 0.00 | 0.00 | 0.00 | 0.00 | 0.00 | 0.00 | 0.00 | 0.00 | |||
| LinearDML | 0.14 | 0.04 | 0.24 | 0.48 | 0.15 | 0.01 | 0.02 | 0.04 | 0.17 | 0.11 | |||
| XLearner | 0.00 | 0.00 | 0.00 | 0.00 | 0.00 | 0.00 | 0.00 | 0.00 | 0.00 | 0.00 | |||
| State | |||||||||||||
| PaCE | 0.41 | 0.39 | 0.42 | 0.23 | 0.32 | 0.39 | 0.54 | 0.56 | 0.46 | 0.36 | |||
| Causal Forest | 0.05 | 0.09 | 0.01 | 0.06 | 0.04 | 0.04 | 0.05 | 0.04 | 0.04 | 0.05 | |||
| CausalForestDML | 0.07 | 0.07 | 0.07 | 0.03 | 0.07 | 0.10 | 0.07 | 0.08 | 0.06 | 0.09 | |||
| DML | 0.27 | 0.29 | 0.26 | 0.41 | 0.36 | 0.27 | 0.17 | 0.16 | 0.31 | 0.24 | |||
| DRLearner | 0.00 | 0.00 | 0.00 | 0.00 | 0.00 | 0.00 | 0.00 | 0.00 | 0.00 | 0.00 | |||
| ForestDRLearner | 0.01 | 0.01 | 0.01 | 0.00 | 0.00 | 0.00 | 0.01 | 0.02 | 0.00 | 0.01 | |||
| LinearDML | 0.02 | 0.01 | 0.04 | 0.02 | 0.06 | 0.01 | 0.01 | 0.02 | 0.02 | 0.02 | |||
| XLearner | 0.17 | 0.13 | 0.20 | 0.25 | 0.14 | 0.19 | 0.15 | 0.11 | 0.10 | 0.23 | |||
| County | |||||||||||||
| PaCE | 0.06 | 0.10 | 0.02 | 0.16 | 0.08 | 0.04 | 0.02 | 0.01 | 0.07 | 0.06 | |||
| Causal Forest | 0.29 | 0.38 | 0.20 | 0.25 | 0.28 | 0.31 | 0.31 | 0.30 | 0.23 | 0.34 | |||
| CausalForestDML | 0.04 | 0.05 | 0.03 | 0.00 | 0.01 | 0.03 | 0.05 | 0.11 | 0.03 | 0.05 | |||
| DML | 0.35 | 0.35 | 0.35 | 0.34 | 0.37 | 0.34 | 0.39 | 0.31 | 0.47 | 0.24 | |||
| DRLearner | 0.00 | 0.00 | 0.00 | 0.00 | 0.00 | 0.00 | 0.00 | 0.00 | 0.00 | 0.00 | |||
| ForestDRLearner | 0.01 | 0.00 | 0.01 | 0.00 | 0.00 | 0.00 | 0.00 | 0.02 | 0.00 | 0.01 | |||
| LinearDML | 0.20 | 0.04 | 0.35 | 0.22 | 0.22 | 0.21 | 0.16 | 0.17 | 0.19 | 0.20 | |||
| XLearner | 0.05 | 0.07 | 0.04 | 0.03 | 0.03 | 0.06 | 0.07 | 0.07 | 0.01 | 0.10 | |||
| Adaptive | Proportion treated | Treatment effect | |||||||||||
|---|---|---|---|---|---|---|---|---|---|---|---|---|---|
| All | N | Y | 0.05 | 0.25 | 0.5 | 0.75 | 1.0 | Add. | Mult. | ||||
| SNAP | |||||||||||||
| PaCE | 0.18 | 0.17 | 0.18 | 0.4 | 0.17 | 0.12 | 0.1 | 0.09 | 0.13 | 0.22 | |||
| (0.16) | (0.11) | (0.2) | (0.21) | (0.1) | (0.07) | (0.06) | (0.05) | (0.13) | (0.18) | ||||
| Causal Forest (R) | 0.21 | 0.21 | 0.21 | 0.42 | 0.2 | 0.17 | 0.13 | 0.12 | 0.18 | 0.23 | |||
| (0.15) | (0.07) | (0.19) | (0.19) | (0.06) | (0.04) | (0.04) | (0.06) | (0.12) | (0.17) | ||||
| CausalForestDML | 40.81 | 5.01 | 76.6 | 195.95 | 6.85 | 0.8 | 0.26 | 0.17 | 40.93 | 40.68 | |||
| (115.45) | (10.86) | (154.86) | (191.08) | (6.37) | (0.42) | (0.05) | (0.06) | (115.69) | (115.24) | ||||
| DML | 0.38 | 0.31 | 0.45 | 0.72 | 0.35 | 0.32 | 0.27 | 0.26 | 0.28 | 0.48 | |||
| (0.29) | (0.21) | (0.33) | (0.41) | (0.17) | (0.15) | (0.14) | (0.16) | (0.27) | (0.27) | ||||
| DRLearner | 1186.44 | 371.84 | 2001.03 | 107.4 | 1016.66 | 2277.78 | 2445.56 | 84.78 | 1095.4 | 1277.47 | |||
| (1764.1) | (462.49) | (2164.23) | (229.15) | (815.45) | (2036.92) | (2339.59) | (211.55) | (1597.24) | (1912.51) | ||||
| ForestDRLearner | 0.94 | 0.84 | 1.04 | 2.08 | 0.9 | 0.71 | 0.57 | 0.45 | 0.99 | 0.89 | |||
| (7.08) | (1.53) | (9.9) | (15.78) | (0.1) | (0.13) | (0.17) | (0.21) | (9.49) | (3.2) | ||||
| LinearDML | 0.25 | 0.28 | 0.21 | 0.34 | 0.25 | 0.25 | 0.2 | 0.19 | 0.15 | 0.34 | |||
| (0.16) | (0.16) | (0.16) | (0.23) | (0.13) | (0.12) | (0.13) | (0.14) | (0.1) | (0.16) | ||||
| XLearner | 0.51 | 0.46 | 0.56 | 0.89 | 0.55 | 0.47 | 0.36 | 0.27 | 0.5 | 0.52 | |||
| (0.25) | (0.17) | (0.3) | (0.29) | (0.05) | (0.04) | (0.02) | (0.02) | (0.23) | (0.27) | ||||
| State | |||||||||||||
| PaCE | 0.28 | 0.34 | 0.22 | 0.57 | 0.32 | 0.21 | 0.17 | 0.14 | 0.25 | 0.32 | |||
| (0.24) | (0.26) | (0.2) | (0.3) | (0.18) | (0.12) | (0.1) | (0.08) | (0.21) | (0.25) | ||||
| Causal Forest (R) | 0.33 | 0.39 | 0.28 | 0.6 | 0.35 | 0.29 | 0.23 | 0.19 | 0.3 | 0.36 | |||
| (0.22) | (0.24) | (0.18) | (0.27) | (0.16) | (0.11) | (0.08) | (0.08) | (0.19) | (0.24) | ||||
| CausalForestDML | 0.75 | 1.02 | 0.48 | 2.76 | 0.36 | 0.25 | 0.21 | 0.19 | 0.76 | 0.74 | |||
| (3.22) | (4.41) | (1.1) | (6.85) | (0.25) | (0.11) | (0.1) | (0.08) | (3.31) | (3.14) | ||||
| DML | 0.35 | 0.42 | 0.28 | 0.59 | 0.34 | 0.29 | 0.27 | 0.26 | 0.31 | 0.39 | |||
| (0.33) | (0.41) | (0.19) | (0.6) | (0.21) | (0.17) | (0.14) | (0.14) | (0.37) | (0.28) | ||||
| DRLearner | 929.38 | 520.49 | 1338.07 | 1466.8 | 2905.93 | 159.67 | 68.36 | 47.3 | 891.42 | 967.37 | |||
| (4601.05) | (3268.39) | (5597.16) | (5776.54) | (8056.84) | (898.43) | (348.15) | (677.07) | (4089.69) | (5062.03) | ||||
| ForestDRLearner | 60.29 | 119.37 | 1.24 | 299.72 | 0.87 | 0.4 | 0.28 | 0.26 | 52.15 | 68.43 | |||
| (629.42) | (886.43) | (2.42) | (1382.62) | (1.11) | (0.21) | (0.15) | (0.14) | (451.79) | (767.07) | ||||
| LinearDML | 0.86 | 1.34 | 0.39 | 2.72 | 0.59 | 0.4 | 0.33 | 0.29 | 0.85 | 0.88 | |||
| (1.56) | (2.06) | (0.36) | (2.74) | (0.41) | (0.22) | (0.16) | (0.13) | (1.63) | (1.48) | ||||
| XLearner | 0.29 | 0.37 | 0.22 | 0.53 | 0.31 | 0.23 | 0.2 | 0.19 | 0.27 | 0.31 | |||
| (0.19) | (0.2) | (0.14) | (0.25) | (0.13) | (0.1) | (0.08) | (0.06) | (0.16) | (0.2) | ||||
| County | |||||||||||||
| PaCE | 0.34 | 0.35 | 0.33 | 0.49 | 0.37 | 0.29 | 0.28 | 0.26 | 0.28 | 0.39 | |||
| (0.2) | (0.19) | (0.22) | (0.29) | (0.19) | (0.14) | (0.12) | (0.11) | (0.13) | (0.24) | ||||
| Causal Forest (R) | 0.26 | 0.26 | 0.27 | 0.43 | 0.3 | 0.22 | 0.2 | 0.18 | 0.22 | 0.31 | |||
| (0.17) | (0.13) | (0.21) | (0.23) | (0.17) | (0.12) | (0.1) | (0.08) | (0.12) | (0.21) | ||||
| CausalForestDML | 2.1 | 0.47 | 3.72 | 8.83 | 0.95 | 0.28 | 0.23 | 0.2 | 2.05 | 2.15 | |||
| (5.24) | (0.68) | (7.01) | (8.92) | (0.78) | (0.11) | (0.09) | (0.07) | (5.17) | (5.31) | ||||
| DML | 0.3 | 0.34 | 0.25 | 0.46 | 0.28 | 0.26 | 0.23 | 0.26 | 0.21 | 0.38 | |||
| (0.25) | (0.25) | (0.24) | (0.27) | (0.2) | (0.23) | (0.22) | (0.26) | (0.17) | (0.28) | ||||
| DRLearner | 717.31 | 260.77 | 1173.85 | 560.3 | 153.83 | 72.65 | 428.02 | 2371.74 | 396.35 | 1038.27 | |||
| (5046.04) | (834.88) | (7058.49) | (1091.51) | (664.27) | (462.94) | (827.06) | (11014.13) | (1118.57) | (7034.13) | ||||
| ForestDRLearner | 0.75 | 0.51 | 1 | 2.57 | 0.4 | 0.3 | 0.26 | 0.23 | 0.57 | 0.93 | |||
| (5.99) | (1.35) | (8.35) | (13.24) | (0.15) | (0.12) | (0.1) | (0.06) | (2.93) | (7.94) | ||||
| LinearDML | 0.36 | 0.47 | 0.24 | 0.61 | 0.34 | 0.29 | 0.26 | 0.28 | 0.28 | 0.44 | |||
| (0.32) | (0.36) | (0.24) | (0.42) | (0.23) | (0.27) | (0.25) | (0.27) | (0.25) | (0.37) | ||||
| XLearner | 0.32 | 0.33 | 0.32 | 0.5 | 0.36 | 0.29 | 0.25 | 0.23 | 0.29 | 0.36 | |||
| (0.14) | (0.13) | (0.16) | (0.17) | (0.11) | (0.09) | (0.07) | (0.04) | (0.09) | (0.18) | ||||
| Adaptive | Proportion treated | Treatment effect | |||||||||||
|---|---|---|---|---|---|---|---|---|---|---|---|---|---|
| All | N | Y | 0.05 | 0.25 | 0.5 | 0.75 | 1.0 | Add. | Mult. | ||||
| SNAP | |||||||||||||
| PaCE | 0.1 | 0.11 | 0.09 | 0.15 | 0.1 | 0.09 | 0.09 | 0.09 | 0.07 | 0.13 | |||
| (0.08) | (0.04) | (0.1) | (0.13) | (0.06) | (0.05) | (0.05) | (0.05) | (0.03) | (0.09) | ||||
| Causal Forest (R) | 0.13 | 0.18 | 0.07 | 0.18 | 0.13 | 0.12 | 0.11 | 0.1 | 0.11 | 0.14 | |||
| (0.08) | (0.04) | (0.07) | (0.11) | (0.07) | (0.07) | (0.06) | (0.06) | (0.07) | (0.09) | ||||
| CausalForestDML | 0.22 | 0.27 | 0.17 | 0.41 | 0.2 | 0.17 | 0.16 | 0.15 | 0.18 | 0.26 | |||
| (0.24) | (0.11) | (0.31) | (0.45) | (0.09) | (0.08) | (0.07) | (0.07) | (0.12) | (0.31) | ||||
| DML | 0.44 | 0.29 | 0.6 | 0.89 | 0.41 | 0.37 | 0.29 | 0.27 | 0.27 | 0.62 | |||
| (0.72) | (0.19) | (0.98) | (1.44) | (0.37) | (0.28) | (0.17) | (0.18) | (0.22) | (0.97) | ||||
| DRLearner | 2074.25 | 376.92 | 3771.58 | 170.11 | 2703.71 | 4134.22 | 3279.81 | 83.39 | 1405.57 | 2742.93 | |||
| (4283.12) | (461.16) | (5542.67) | (263) | (5417.88) | (5543.25) | (4232.75) | (203.48) | (2139.72) | (5587.94) | ||||
| ForestDRLearner | 4.86 | 1.19 | 8.54 | 20.94 | 1.39 | 0.88 | 0.63 | 0.47 | 4.08 | 5.64 | |||
| (98.58) | (1.92) | (139.32) | (219.79) | (0.89) | (0.45) | (0.31) | (0.26) | (103.28) | (93.67) | ||||
| LinearDML | 0.26 | 0.25 | 0.26 | 0.31 | 0.28 | 0.27 | 0.22 | 0.22 | 0.12 | 0.39 | |||
| (0.26) | (0.12) | (0.35) | (0.3) | (0.29) | (0.28) | (0.21) | (0.2) | (0.09) | (0.3) | ||||
| MCNNM | 0.19 | 0.24 | 0.14 | 0.27 | 0.18 | 0.17 | 0.16 | 0.16 | 0.16 | 0.21 | |||
| (0.18) | (0.05) | (0.24) | (0.34) | (0.1) | (0.09) | (0.08) | (0.08) | (0.09) | (0.23) | ||||
| XLearner | 0.92 | 0.44 | 1.41 | 2.67 | 0.75 | 0.54 | 0.38 | 0.28 | 0.58 | 1.27 | |||
| (2.77) | (0.19) | (3.85) | (5.81) | (0.62) | (0.35) | (0.15) | (0.07) | (0.49) | (3.85) | ||||
| State | |||||||||||||
| My Estimator | 0.21 | 0.23 | 0.19 | 0.36 | 0.24 | 0.17 | 0.15 | 0.13 | 0.18 | 0.24 | |||
| (0.17) | (0.19) | (0.15) | (0.27) | (0.14) | (0.09) | (0.08) | (0.07) | (0.13) | (0.2) | ||||
| Causal Forest (R) | 0.3 | 0.32 | 0.28 | 0.46 | 0.33 | 0.29 | 0.23 | 0.19 | 0.27 | 0.33 | |||
| (0.22) | (0.24) | (0.19) | (0.37) | (0.17) | (0.13) | (0.09) | (0.08) | (0.15) | (0.26) | ||||
| CausalForestDML | 0.26 | 0.33 | 0.2 | 0.43 | 0.27 | 0.22 | 0.21 | 0.19 | 0.24 | 0.28 | |||
| (0.24) | (0.31) | (0.12) | (0.46) | (0.13) | (0.1) | (0.09) | (0.08) | (0.16) | (0.3) | ||||
| DML | 0.34 | 0.38 | 0.29 | 0.51 | 0.34 | 0.29 | 0.27 | 0.26 | 0.3 | 0.37 | |||
| (0.23) | (0.25) | (0.2) | (0.34) | (0.21) | (0.17) | (0.14) | (0.14) | (0.2) | (0.25) | ||||
| DRLearner | 1704.15 | 791.94 | 2615.89 | 4387.86 | 3853.02 | 165.89 | 68.68 | 47.43 | 1413.19 | 1995.26 | |||
| (11821.06) | (5032.31) | (15890.26) | (23128.14) | (11970.8) | (1085.93) | (353.98) | (662.49) | (6457.8) | (15418.33) | ||||
| ForestDRLearner | 427.34 | 849.26 | 5.63 | 2134.78 | 1.45 | 0.46 | 0.29 | 0.26 | 329.6 | 525.13 | |||
| (4126.02) | (5805.96) | (17.91) | (9032.24) | (2.32) | (0.33) | (0.17) | (0.16) | (2885.66) | (5071.02) | ||||
| LinearDML | 0.43 | 0.52 | 0.35 | 0.81 | 0.42 | 0.35 | 0.31 | 0.28 | 0.39 | 0.48 | |||
| (0.53) | (0.65) | (0.36) | (1.06) | (0.24) | (0.17) | (0.14) | (0.12) | (0.27) | (0.7) | ||||
| MCNNM | 0.23 | 0.29 | 0.18 | 0.25 | 0.21 | 0.21 | 0.24 | 0.25 | 0.22 | 0.24 | |||
| (0.17) | (0.21) | (0.08) | (0.3) | (0.11) | (0.1) | (0.09) | (0.11) | (0.11) | (0.21) | ||||
| XLearner | 0.28 | 0.33 | 0.23 | 0.5 | 0.29 | 0.22 | 0.2 | 0.18 | 0.26 | 0.3 | |||
| (0.31) | (0.38) | (0.21) | (0.61) | (0.12) | (0.08) | (0.07) | (0.05) | (0.15) | (0.41) | ||||
| County | |||||||||||||
| PaCE | 0.31 | 0.29 | 0.33 | 0.44 | 0.34 | 0.27 | 0.26 | 0.26 | 0.23 | 0.39 | |||
| (0.34) | (0.13) | (0.46) | (0.6) | (0.36) | (0.19) | (0.13) | (0.11) | (0.09) | (0.46) | ||||
| Causal Forest (R) | 0.2 | 0.25 | 0.15 | 0.3 | 0.21 | 0.18 | 0.16 | 0.16 | 0.16 | 0.24 | |||
| (0.16) | (0.12) | (0.18) | (0.26) | (0.15) | (0.11) | (0.08) | (0.07) | (0.1) | (0.19) | ||||
| CausalForestDML | 0.28 | 0.3 | 0.26 | 0.51 | 0.29 | 0.22 | 0.19 | 0.18 | 0.22 | 0.34 | |||
| (0.35) | (0.18) | (0.46) | (0.69) | (0.21) | (0.12) | (0.09) | (0.07) | (0.11) | (0.48) | ||||
| DML | 0.3 | 0.33 | 0.27 | 0.41 | 0.27 | 0.26 | 0.24 | 0.31 | 0.19 | 0.41 | |||
| (0.34) | (0.24) | (0.41) | (0.39) | (0.26) | (0.26) | (0.24) | (0.45) | (0.15) | (0.42) | ||||
| DRLearner | 1183.28 | 278.38 | 2088.17 | 1010.99 | 160.94 | 69.94 | 564.55 | 4109.95 | 443.32 | 1923.23 | |||
| (10927.48) | (1008.75) | (15369.32) | (2371.12) | (956.66) | (448.59) | (1563.04) | (24023.26) | (1265.5) | (15367.99) | ||||
| ForestDRLearner | 1.57 | 1.14 | 1.99 | 6.58 | 0.54 | 0.3 | 0.22 | 0.19 | 1.06 | 2.08 | |||
| (12.1) | (2.9) | (16.86) | (26.48) | (0.41) | (0.17) | (0.1) | (0.08) | (5.01) | (16.35) | ||||
| LinearDML | 0.33 | 0.41 | 0.25 | 0.48 | 0.31 | 0.28 | 0.26 | 0.32 | 0.22 | 0.44 | |||
| (0.39) | (0.29) | (0.46) | (0.56) | (0.27) | (0.28) | (0.27) | (0.44) | (0.17) | (0.5) | ||||
| MCNNM | 0.56 | 0.49 | 0.62 | 0.73 | 0.58 | 0.51 | 0.49 | 0.48 | 0.45 | 0.67 | |||
| (0.63) | (0.12) | (0.88) | (1.21) | (0.57) | (0.33) | (0.19) | (0.14) | (0.11) | (0.87) | ||||
| XLearner | 0.36 | 0.32 | 0.4 | 0.67 | 0.39 | 0.29 | 0.24 | 0.22 | 0.28 | 0.44 | |||
| (0.52) | (0.14) | (0.72) | (1.04) | (0.34) | (0.17) | (0.09) | (0.06) | (0.12) | (0.72) | ||||