Guide Local Feature Matching by Overlap Estimation
Abstract
Local image feature matching under large appearance, viewpoint, and distance changes is challenging yet important. Conventional methods detect and match tentative local features across the whole images, with heuristic consistency checks to guarantee reliable matches. In this paper, we introduce a novel Overlap Estimation method conditioned on image pairs with TRansformer, named OETR, to constrain local feature matching in the commonly visible region. OETR performs overlap estimation in a two-step process of feature correlation and then overlap regression. As a preprocessing module, OETR can be plugged into any existing local feature detection and matching pipeline, to mitigate potential view angle or scale variance. Intensive experiments show that OETR can boost state-of-the-art local feature matching performance substantially, especially for image pairs with small shared regions. The code will be publicly available at https://github.com/AbyssGaze/OETR.


Introduction
Detecting precise locations for local features, then establishing their reliable correspondences across images are underpinning steps towards many computer vision tasks, such as Structure-from-Motion (SfM) (Schonberger and Frahm 2016; Wu 2013), visual tracking (Yan et al. 2021; Voigtlaender et al. 2020) and visual localization (Sarlin et al. 2019). By extension, feature matching enables real applications such as visual navigation of autonomous vehicles and portable augmented/mixed reality devices. However, under extreme appearance, viewpoint or scale changes in long-term conditions (Sattler et al. 2018), repeatable keypoints detection, and stable descriptor matching are very challenging and remain unsolved.
Traditionally, appearance, viewpoint, and scale invariance are parameterized by hand-crafted transformation and statistics of local feature patches (Lowe 2004; Bay, Tuytelaars, and Van Gool 2006). Recently, convolutional neural networks (CNNs) based local features (DeTone, Malisiewicz, and Rabinovich 2018a; Revaud et al. 2019; Tyszkiewicz, Fua, and Trulls 2020) with strong semantic representation and attention aided matching protocols (Wiles, Ehrhardt, and Zisserman 2021; Sarlin et al. 2019) have shown significant improvements over their hand-crafted counterparts under appearance changing conditions, such as day-night, weather, and seasonal variations. Nevertheless, detection from the deepest layer embedding high-level information often struggles to identify low-level structures (corners, edges, etc.) where keypoints are often located, leading to less accurate keypoints (Germain, Bourmaud, and Lepetit 2020). So recent methods (Luo et al. 2020) fuse earlier layers that preserve high-frequency local details to help retrieve accurate keypoints. However, corresponding descriptors are vulnerable to large view angle or scale change due to a limited receptive field that implies less semantic context. So, the performance is highly depend on complicated multi-scale feature interaction design which is not straightforward. Moreover, this dilemma becomes more severe when the commonly visible region between image pairs is limited, leading to extreme scale variations. As a result, finding stable correspondences between query and database images taken from scenes with small shared regions bottlenecks the performance of loop-closure in the context of SLAM, visual localization, or registering images to Structure-from-Motion (SfM) reconstructions.
In this paper, we refer to a straightforward yet effective preprocessing approach to guide feature matching by estimating overlap between image pairs. Based on overlap estimation, the scale for a shared scene can be aligned prior to feature detection and description, which satisfies the scale-invariant requirement for local features starting from SIFT (Lowe 2004). Meanwhile, similar to guided matching (Darmon, Aubry, and Monasse 2020), relying exclusively on local information to match images can be misleading especially in the case of scenes with repeated patterns. Our strong overlap constraint will generate disambiguated coarse prior, to prune possible outliers outside overlapped area. As shown in Fig. 1(a), overwhelming noisy and ambiguous feature pairs are introduced by SuperPoint detector and (DeTone, Malisiewicz, and Rabinovich 2018b) SuperGlue matcher (Sarlin et al. 2020) when the viewpoint changes. Typically, when reconstructing scenes from Internet photos, scale and viewpoint variations of the collected images will hinder stable feature matching thus degrading reconstruction performance.
To this end, it is important to guarantee a robust and precise overlap estimation, which however is not a well-studied topic. Related areas cover few-shot object detection (Fan et al. 2020), template tracking (Zhang et al. 2021, 2020), and most closely normalized surface overlap (NSO) presented by (Rau et al. 2020). Intuitively, estimating precise overlap bounding box between image pairs is more challenging, as it requires iterative and reciprocal validation to find shared regions from image pairs, with no initial template provided. Nevertheless, we borrow ideas from these well-studied tasks and propose a novel transformer-based correlation feature learning approach to regress precise overlap bounding boxes in image pairs.
To summarise, we make three contributions:
-
•
We propose an efficient overlap estimation method to guide local feature matching, compensating for potential mismatch in scales and viewing angles. We demonstrate overlap estimation can be plugged into any local feature matching pipeline, as a preprocessing module.
-
•
A carefully redesigned transformer encoder-decoder framework is adopted to estimate overlap bounding boxes in image pairs, within a lightweight multi-scale feature correlation then overlap regression process. Training can be supervised by a specifically designed symmetric center consistency loss.
-
•
Extensive experiments and analysis demonstrate the effectiveness of the proposed method, boosting the performance of both traditional and learning-based feature matching algorithms, especially for image pairs with the small commonly visible regions.
Related Works
Our overlap estimation is mainly intended to guide and constrain local feature matching while regressing overlap bounding box borrows ideas from object detection.
Local feature matching
SIFT (Lowe 2004) and ORB (Rublee et al. 2011) are arguably the most renowned hand-crafted local features, facilitating many downstream computer vision tasks. Reliable local feature is achieved by hand-designed patch descriptor according to gradient-based statistics. Borrowing semantic representation ability from convolution neural networks (CNNs), robustness of local features on large appearance, scale and viewpoint change can be improved by a large margin with learning-based method (Yi et al. 2016; DeTone, Malisiewicz, and Rabinovich 2018b; Dusmanu et al. 2019; Revaud et al. 2019; Luo et al. 2019, 2020; Tyszkiewicz, Fua, and Trulls 2020). SuperGlue (Sarlin et al. 2020) proposes a GNN based approach for local feature matching, which builds a matching matrix from two sets of keypoints with descriptors and positions. (Wiles, Ehrhardt, and Zisserman 2021) proposed spatial attention mechanism for conditioning the learned features on both images under large viewpoint change. Our work is inspired by SuperGlue (Sarlin et al. 2020) and CoAM (Wiles, Ehrhardt, and Zisserman 2021) in terms of using self and cross attention in GNN for spatial-wise feature correlation. SuperGlue achieves impressive performance and sets the new state-of-the-art in local feature matching. Nevertheless, for existing local feature matching methods, our OETR can be utilized as a preprocessing module to constrain keypoint detection and descriptor matching within overlapped area.
Besides salient keypoint detection and discriminative descriptor learning, the classical image matching pipeline performs correspondence pruning by the bidirectional ratio test (Lowe 2004). More elaborate techniques such as GMS (Bian et al. 2017) and LPM (Ma et al. 2019) remove ambiguous matches based on the observation that matches should be consistent within close neighboring areas. Geometric verification is then performed in a RANSAC, PROSAC (Chum and Matas 2005) or recent neural guidance RANSAC (Brachmann and Rother 2019) based scope, to ensure epipolar geometry constraint. These methods adopt a hypothesize-and-verify approach and attempt to obtain the smallest possible outlier-free subset to estimate a provided parametric model by resampling. On the contrary, our OETR leverage overlaps constraints before matching and can help to identify correct matches.
Overlap Estimation
(Rau et al. 2020) propose a box embedding to approximate normalized surface overlap (NSO) asymmetrically. NSO is defined as the percentage of commonly visible pixels over each image, for image retrieval or pre-scale whole image accordingly for better local feature matching. By zooming in and cropping commonly visible regions around coarse matches, COTR (Jiang et al. 2021) achieves greater matching accuracy recursively. Their overlap estimation is not straightforwardly represented by a bounding box covering a commonly visible region. Instead, we hope local feature matching can benefit more from our precise overlap bounding box estimation.
Object Detection
Object detection aims at localizing bounding boxes and recognizing category labels for objects of interest in one image. Mainstream one-stage detectors rely on dense positional candidates enumerating feature map grid, such as anchors boxes (Liu et al. 2016; Lin et al. 2017b; Redmon and Farhadi 2017) and reference points (Tian et al. 2019), to predict final objects. As an extension, two-stage detectors (Ren et al. 2015) predict foreground proposal boxes from dense candidates. Recently, sparse candidates like learnable proposals (Sun et al. 2021b) or object queries (Carion et al. 2020a) have been adopted to guide detection and achieved promising performance. Comparably, overlap estimation is to localize the unique bounding box of common area in each image, which is conditioned on image pairs and with no prior instance of scene information. From dense to sparse, then from sparse to unique, our overlap estimation follows objection detection to guarantee precise overlap bounding box regression. Moreover, compared to visual object tracking (VOT) which localizes provided objects in sequential images (Yan et al. 2021), no initial template is available for overlap estimation, thus making the spatial relationships of overlapped area more complicated (Rau et al. 2020).
Method
In this section, we present the Overlap Estimation network with TRansformer (Vaswani et al. 2017), shorten as OETR. The task of overlap estimation conditioned on image pair is to predict one bounding box for each image, which tightly covers the commonly visible region as the mask shown in Fig. 1(b).
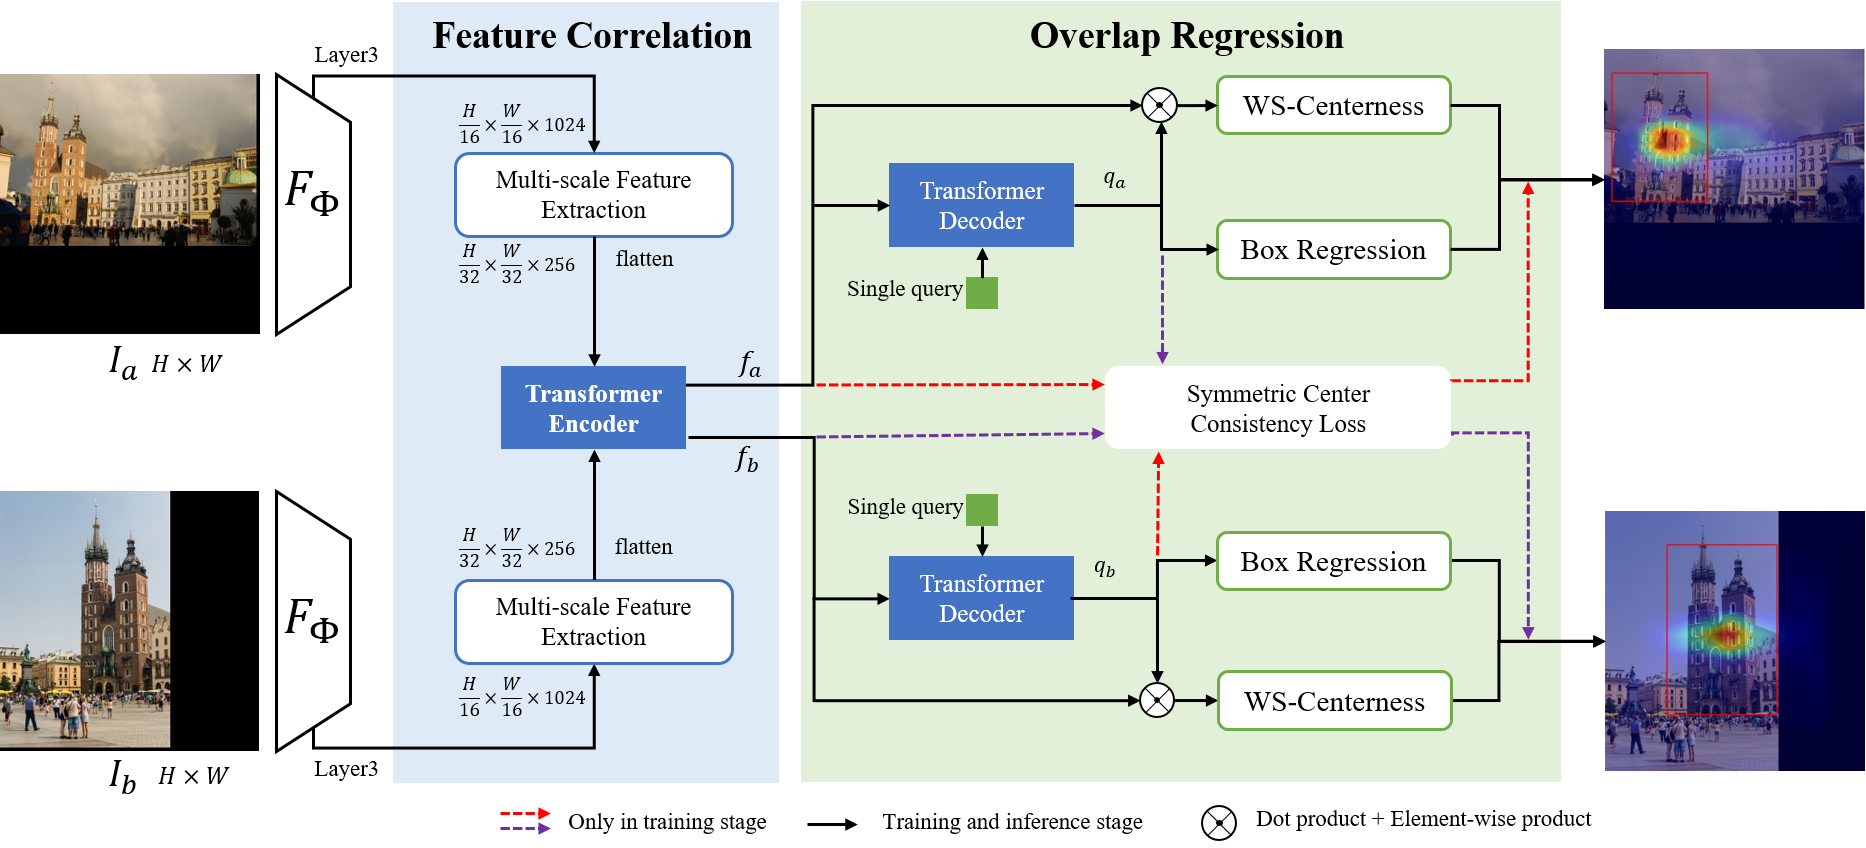
To our best knowledge, overlap estimation is not a well-studied problem. As shown in Fig. 2, OETR estimates overlap in two steps: correlating multi-scale CNN features then regressing overlap bounding box. We call them to feature correlation neck and overlap regression head respectively, analogous to objection detection convention (Ren et al. 2015). To remedy the potential scale variance from CNN features, an efficient multi-scale kernel operator is employed. The Transformer encoder performs feature correlation by self-attention and cross-attention of flattened multi-scale features from image pair. Inspired by DETR (Carion et al. 2020a) and FCOS (Tian et al. 2019), we cast the overlap estimation problem into identifying and localizing commonly visible regions in image pairs.
Feature Correlation
The feature correlation step consists of a multi-scale feature extraction from CNN backbone, and a transformer feature encoder.
Multi-scale Feature Extraction
Commonly used methods for multi-scale feature extraction are feature pyramid network (FPN) (Lin et al. 2017a) and its variants (Liu et al. 2018) (Kirillov et al. 2019), which output proportional size feature maps at multiple levels by different convolutional strides. However, feature correlation between multiple levels’ feature map is computationally intensive. Assuming correlating 4 layers (P2, P3, P4, P5) of FPN, 16 times cross feature map correlation are required. To this end, we adopt a lightweight Multi-Scale kernel Feature extractor (MSF) (Wang et al. 2021), as shown in Fig.3. MSF first employs three kernel operators in parallel on layer3 from ResNet50, with stride of 2. Three convoluted features are then concatenated in channel dimension, blending the output embedding with multi-scale feature patches whose receptive fields are more flexible. Meanwhile, we leverage a lower channel dimension for large kernels while a higher dimension for small kernels, to balance computational cost.

Transformer encoder
Considering that overlapped area shares common scene information between image pairs, final overlap bounding box in each image is conditioned on features from its own and paired image. To facilitate efficient feature interaction between image pairs, We inherit the core design of popular iterative self-attention and cross-attention (Sarlin et al. 2020; Sun et al. 2021a) and propose a lightweight linear transformer(Katharopoulos et al. 2020) encoder layer for message passing within and across image pairs.
Different from template matching methods (Fan et al. 2020; Zhang et al. 2021), image is not always part of image for overlap estimation problem. To embed variant spatial relationships of overlapped area from paired image with unpredictable scale, viewpoint or appearance changes, we directly flatten the multi-scale features from MSF, then complete the feature correlation by transformer encoder. Adapted from vanilla Transformer (Vaswani et al. 2017) with only self-attention layer, our Transformer encoder correlates features from paired image by iterative self-attention and cross-attention layers which are identical to that used by (Sarlin et al. 2020; Sun et al. 2021a). The detail components of Transformer encoder are presented in left side of Fig. 4. For multi-scale flattened feature from image , self-attention is focused on internal correlation , then cross-attention correlates features from . This message-passing operator is interleaved by 4 times, ensuring sufficient feature interaction between image pair. In order to make better use of the relative position relationship in spatial. Different from LoFTR(Sun et al. 2021a), we add positional encoding to and in every iteration.

Overlap Regression
For overlap estimation, only one bounding box covering a commonly visible region should be regressed. We borrow the idea from DETR (Carion et al. 2020b), which learns different spatial specializations for each object query, performs co-attention between object queries and encoded features with the Hungarian algorithm (Kuhn 1955) for prediction association. To guarantee unique overlap prediction, single learnable query is employed to reason its relation to the global image context. After feature correlation, and are fed into a transformer decoder with single query. The detail components of transformer decoder is illustrated in the right side of Fig. 4.
Overlap regression can be regarded as surrogate two sub-problems: overlapped area center localization and bounding box side offset regression, which is inspired by FCOS (Tian et al. 2019). FCOS introduces a lightweight center-ness branch to depict the distance of a location to the center of its corresponding bounding box, and a regression branch to predict the offsets from the center to four sides of the bounding box. The proposed overlap regression inherits FCOS’s design and takes decoded feature (or ) and correlated feature (or ) as inputs, as shown in the right side of Fig. 2. For WS-Centerness branch, the similarity between correlated feature and the decoded feature can be computed by dot-product operation. Next, the similarity scores are element-wisely multiplied with correlated features, to enhance attention on the overlapped areas while weakening attention on the non-overlapped areas.
The generated feature vector is reshaped to a feature map and fed into a fully convolutional network (FCN), generating center coordinate probability distribution . True centerness of the overlapped area is then obtained by computing the expectation of the center coordinate’s probability distribution as shown in Eq. 1, which is weighted-sum (WS) of center coordinate by center probability.
For the box regression branch, only decoder feature is utilized to regress a 4-dimensional vector , which is the offset from the overlapped area center to four sides of the bounding box. Final overlap bounding box is localized by the center location and predicted .
| (1) |
Symmetric Center Consistency Loss
Consistency loss is commonly employed in feature matching pipelines (Wang, Jabri, and Efros 2019). For overlap estimation, we hope a single query for each image should be close in feature space, as they represent the commonly visible regions. However, due to potential large appearance or viewpoint changes, sharing a common query for paired images is not sufficient. To provide consistency supervision, we introduce symmetric center consistency loss, which ensures forward-backward mapping of the overlapped area center to be spatially close. Given image pair and , the output (, ) of feature correlation is embedded with decoder output (, ) as shown in Fig. 2. We also embed (, ) to (, ) respectively, for center consistency. Finally, same as DETR (Carion et al. 2020b), L1 loss, and generalized IoU loss are introduced for box localization.
| (2) | |||
where and represent the groundtruth, prediction and symmetric consistency center position of overlap bounding box, respectively. Note that center position here refers to geometric center of bounding box, different with in Eq. 1. is a vector that defines groundtruth box center coordinates and its height and width relative to the image size. and represent the groundtruth and the predicted box respectively. and are hyper-parameters to balance losses.
Experiments
Implementation Details
Training.
We train our overlap estimation model OETR on MegaDepth (Li and Snavely 2018) dataset. Image pairs are randomly sampled offline, with overlap ratio in [0.1, 0.7]. According to IMC2021 (Jin et al. 2021) evaluation requirements, we remove overlapping scenes with IMC’s validation and test set from MegaDepth. Overlap bounding box groundtruth is calculated from provided depth, relative pose and intrinsics of image pairs. To enable batched training, input images are resized to have their longer side being 1200 while image ratio is kept, followed by padding to 1216 (can be divided by 32) for both sides. The loss weights and are set to respectively. The model is trained using AdamW with weight decay of and a batch size of 8. It converges after 48 hours of training on 2 NVIDIA-V100 GPUs with 35 epochs.
Inference.
In this section, we discuss how to apply OETR as the preprocessing module for local feature matching. As shown in Fig. 5, there are three stages: 1) Resized and padded image pair () is fed into OETR for overlap estimation. 2) Overlapped areas are cropped out and resized to mitigate potential scale mismatch. The resized ratio is the product of the origin image resize ratio and overlap scale ratio. The overlap scale ratio is calculated by:
| (3) |
where and are overlapping bounding boxes for image pair and , with their width and height as respectively. 3) Local feature matching is performed on cropped overlap aligned images. Finally, we warp keypoints and matches back to origin images and perform downstream tasks such as relative pose estimation.

Comparison with Existing Methods
We add our OETR as a preprocessing module with different feature extractors (SuperPoint (DeTone, Malisiewicz, and Rabinovich 2018a), D2-Net (Dusmanu et al. 2019), Disk (Tyszkiewicz, Fua, and Trulls 2020), R2D2 (Revaud et al. 2019) and matchers (SuperGlue (Sarlin et al. 2020), NN), and evaluate it on two benchmarks: MegaDepth (Li and Snavely 2018) and IMC2021 (Jin et al. 2021).

| GoogleUrban | PragueParks | Phototourism | ||||||||||||||||
|---|---|---|---|---|---|---|---|---|---|---|---|---|---|---|---|---|---|---|
| AUC | AUC | AUC | ||||||||||||||||
| Methods | @ | @ | @ | P | MS | mAA | @ | @ | @ | P | MS | mAA | @ | @ | @ | P | MS | mAA |
| D2-Net+NN | 2.34 | 5.06 | 9.96 | 54.13 | 2.35 | 5.52 | 27.67 | 42.29 | 54.58 | 48.6 | 2.06 | 45.45 | 11.79 | 20.6 | 31.01 | 58.9 | 2.77 | 22.36 |
| +OETR | 3.00 | 6.89 | 13.29 | 59.24 | 3.37 | 7.591 | 32.17 | 47.90 | 59.92 | 47.74 | 2.41 | 51.29 | 23.26 | 36.87 | 50.69 | 68.18 | 6.61 | 39.75 |
| DISK+NN | 7.76 | 14.62 | 23.99 | 76.50 | 5.27 | 15.93 | 35.20 | 52.98 | 65.74 | 43.48 | 4.43 | 56.697 | 33.07 | 49.32 | 64.03 | 83.71 | 13.13 | 52.94 |
| +OETR | 9.70 | 18.04 | 28.82 | 74.28 | 7.24 | 19.71 | 36.89 | 56.53 | 69.61 | 44.55 | 4.85 | 60.47 | 47.37 | 64.41 | 77.38 | 86.18 | 17.39 | 68.70 |
| SP+NN | 9.28 | 16.85 | 26.63 | 69.38 | 6.33 | 18.31 | 50.12 | 68.35 | 80.30 | 49.65 | 5.32 | 72.67 | 28.63 | 42.96 | 56.39 | 68.15 | 7.87 | 46.12 |
| +OETR | 9.35 | 17.88 | 28.92 | 70.90 | 9.33 | 19.50 | 53.89 | 72.66 | 84.48 | 48.40 | 7.61 | 77.30 | 41.12 | 57.89 | 71.98 | 74.74 | 15.88 | 61.90 |
| R2D2(MS)+NN | 12.96 | 24.54 | 38.69 | 66.70 | 4.15 | 26.62 | 55.14 | 75.15 | 86.93 | 47.85 | 7.42 | 80.10 | 43.39 | 61.88 | 76.56 | 74.07 | 7.02 | 66.22 |
| +OETR | 14.91 | 26.23 | 39.94 | 67.14 | 5.91 | 28.47 | 54.04 | 73.32 | 84.99 | 47.23 | 9.08 | 78.00 | 53.49 | 70.47 | 82.62 | 80.18 | 15.83 | 74.95 |
| SP+SG | 15.60 | 27.46 | 41.82 | 73.64 | 13.38 | 29.71 | 61.39 | 79.07 | 89.21 | 50.97 | 11.05 | 84.02 | 48.86 | 67.10 | 80.97 | 74.47 | 17.56 | 71.64 |
| +OETR | 16.82 | 29.56 | 44.26 | 75.50 | 19.36 | 32.09 | 60.14 | 78.43 | 88.71 | 49.35 | 14.06 | 83.46 | 55.74 | 72.19 | 84.02 | 79.59 | 29.50 | 76.66 |
| DISK+SG | 17.25 | 30.19 | 45.53 | 73.80 | 14.14 | 32.74 | 51.70 | 71.82 | 84.54 | 47.83 | 11.24 | 76.58 | 52.23 | 70.09 | 83.17 | 80.90 | 32.25 | 74.64 |
| +OETR | 19.77 | 32.67 | 47.17 | 74.28 | 19.64 | 35.35 | 52.43 | 72.18 | 84.57 | 47.80 | 11.29 | 76.93 | 59.91 | 75.53 | 86.16 | 83.51 | 38.18 | 79.99 |
| SP+SG* | 18.21 | 31.74 | 47.15 | 76.68 | 14.99 | 34.35 | 64.36 | 81.36 | 90.49 | 50.60 | 10.36 | 86.27 | 52.65 | 70.43 | 83.31 | 77.82 | 18.74 | 75.04 |
| +OETR | 19.28 | 32.99 | 48.57 | 77.61 | 20.79 | 35.80 | 64.72 | 81.12 | 90.33 | 50.62 | 10.46 | 86.15 | 59.75 | 75.46 | 86.08 | 82.37 | 31.00 | 80.01 |
Metrics
Following (Sarlin et al. 2020), we report the AUC of the pose error under thresholds (), where the pose error is set as the maximum angular error of relative rotation and translation. Following IMC2021 (Jin et al. 2021), we additionally use mAA (mean Average Accuracy) up to a 10-degree error threshold. In our evaluation protocol, the relative poses are recovered from the essential matrix, estimated from feature matching with RANSAC. We also report match precision(P) and matching score(MS) in normalized camera coordinates, with epipolar distance threshold of (DeTone, Malisiewicz, and Rabinovich 2018a; Dusmanu et al. 2019; Sarlin et al. 2020) .
IMC2021
IMC2021 is a benchmark dataset for local feature matching competition, whose goal is to encourage and highlight novel methods for image matching that deviate from and advance traditional formulations, with a focus on large-scale, wide-baseline matching for 3D reconstruction or pose estimation (Jin et al. 2021). There are three leaderboards: Phototourism, PragueParks, and GoogleUrban. They focus on different scenes but all measure the performance of real problems. The challenge features two tracks: stereo, and multi-view (SfM) and we focus on the stereo task. We summarize the results of IMC2021 validation datasets in Tab.1. Noted that the official training code of SuperGlue is not available and its public model (denoted as SG*) is trained on full MegaDepth dataset which has overlapping scenes with Phototourism. Instead, we retrain SuperGlue with different extractors (SuperPoint and DISK) on MegaDepth without the pretrained model and remove scenes sharing with IMC2021’s validation and test set.
As shown in Tab. 1, in Phototourism and GoogleUrban, matching performance is improved for all existing methods after adding OETR. However, in PragueParks, we observe a slight performance degradation for SP+SG(SG*) and R2D2(MS)+NN. Moreover, we claim that this is mainly due to unnoticeable scale differences in PragueParks, thus slightly inaccurate overlap bounding box estimation would prune correct matches, especially those near overlap border. For feature matching like SP+SG(SG*) or multi-scale R2D2 which show strong matching ability, performance can hardly be influenced by adding OETR for image pairs with nearly identical scales. This assumption can be further proved by following experiments on the scale-separated MegaDepth dataset.
MegaDepth
We split MegaDepth test set (with 10 scenes) into subsets according to the overlap scale ratio as in Eq. 3 for image pairs. We separate overlap scales into and combine as for image pairs with noticeable scale difference. Fig. 7 qualitatively shows the comparison when adding OETR before image matching.

We first compare the results of different feature extraction and matching algorithms on MegaDepth before and after adding OETR as the preprocessing module. OETR consistently outperforms the plain method as shown in Tab.2, especially for NN matching. For strong matching baseline SuperGlue, we also observe a noticeable performance improvement. As shown in Tab.3, the larger the scale variation between image pairs, the more obvious performance gain will be obtained by adding OETR. Artificially aligning the commonly visible region to a nearly identical scales can alleviate potential viewpoint mismatch. SG and SG* indicates our own trained model and open-sourced model respectively.
| Methods | AUC | P | MS | ||
|---|---|---|---|---|---|
| @ | @ | @ | |||
| DISK+NN | 1.92 | 3.01 | 4.22 | 40.45 | 0.22 |
| +OETR | 10.96 | 17.16 | 23.88 | 54.91 | 3.14 |
| SP+NN | 2.10 | 3.63 | 5.70 | 54.02 | 1.08 |
| +OETR | 14.21 | 23.43 | 33.29 | 69.14 | 6.08 |
| R2D2(MS)+NN | 12.59 | 22.16 | 32.96 | 66.78 | 2.97 |
| +OETR | 27.53 | 42.51 | 57.42 | 80.01 | 11.55 |
| DISK+SG | 16.03 | 26.07 | 37.14 | 72.49 | 8.42 |
| +OETR | 21.27 | 33.66 | 46.75 | 79.05 | 17.22 |
| SP+SG* | 24.61 | 38.67 | 53.49 | 82.40 | 11.53 |
| +OETR | 30.07 | 46.49 | 62.45 | 87.15 | 25.39 |
| Methods | Scales | AUC | P | MS | ||
|---|---|---|---|---|---|---|
| @ | @ | @ | ||||
| SP+SG* | [1,2) | 50.09 | 67.12 | 79.59 | 88.27 | 28.75 |
| +OETR | 49.76 | 67.42 | 80.02 | 89.80 | 41.16 | |
| SP+SG* | [2,3) | 41.55 | 58.90 | 73.36 | 85.31 | 17.42 |
| +OETR | 42.51 | 60.28 | 74.97 | 88.30 | 33.30 | |
| SP+SG* | [3,4) | 21.07 | 36.05 | 53.12 | 83.37 | 10.58 |
| +OETR | 27.06 | 44.63 | 61.47 | 87.33 | 26.57 | |
| SP+SG* | 11.30 | 21.17 | 34.09 | 78.54 | 6.60 | |
| +OETR | 20.43 | 34.72 | 49.89 | 84.96 | 19.09 | |
Ablation Study
In this section, we conduct ablation study to demonstrate the effectiveness of our design choice for OETR. We evaluate five different variants with results on MegaDepth subset, as shown in Tab. 4: 1) Substituting FCOS head (select locations fall into overlap bounding box as positive samples) for overlap regression results in a significant drop in AUC. 2) Removing the multi-scale feature extraction module results in a degraded pose estimation accuracy as expected. 3) Using the original FCOS center-ness branch as argmax indexing for a central location without weighted sum operation also leads to declined results. 4) Adding overlap consistency loss during training improves the performance.
| AUC | |||
|---|---|---|---|
| Method | @ | @ | @ |
| 1) replace head with FCOS | 28.39 | 44.24 | 59.99 |
| 2) remove multi-scale feature extraction | 28.84 | 44.23 | 59.58 |
| 3) remove weighted sum from WS-Centerness | 27.51 | 43.52 | 59.12 |
| 4) remove overlap consistency loss | 29.06 | 45.79 | 62.22 |
| OETR+SP+SG* | 30.07 | 46.49 | 62.45 |
Conclusions
This paper introduces a novel overlap estimation architecture OETR, with redesigned transformer encoder-decoder. As a preprocessing module, OETR constrains features within the overlapped areas so that ambiguous matches outside can be pruned. Crucially, benefiting from efficient multi-scale feature correlation, OETR mitigates possible scale variations between image pairs. Our experiments show that simply plugged into existing local features matching pipeline OETR boosts their performances substantially, especially for image pairs with the small commonly visible regions. We believe that OETR introduces a new perspective to guide local feature matching. Moreover, the proposed overlap estimation problem may be a promising research direction for potential applications other than local feature matching.
References
- Bay, Tuytelaars, and Van Gool (2006) Bay, H.; Tuytelaars, T.; and Van Gool, L. 2006. Surf: Speeded up robust features. In European conference on computer vision, 404–417. Springer.
- Bian et al. (2017) Bian, J.; Lin, W.-Y.; Matsushita, Y.; Yeung, S.-K.; Nguyen, T.-D.; and Cheng, M.-M. 2017. Gms: Grid-based motion statistics for fast, ultra-robust feature correspondence. In Proceedings of the IEEE conference on computer vision and pattern recognition, 4181–4190.
- Brachmann and Rother (2019) Brachmann, E.; and Rother, C. 2019. Neural-guided RANSAC: Learning where to sample model hypotheses. In Proceedings of the IEEE/CVF International Conference on Computer Vision, 4322–4331.
- Carion et al. (2020a) Carion, N.; Massa, F.; Synnaeve, G.; Usunier, N.; Kirillov, A.; and Zagoruyko, S. 2020a. End-to-end object detection with transformers. In European Conference on Computer Vision, 213–229. Springer.
- Carion et al. (2020b) Carion, N.; Massa, F.; Synnaeve, G.; Usunier, N.; Kirillov, A.; and Zagoruyko, S. 2020b. End-to-end object detection with transformers. In European Conference on Computer Vision, 213–229. Springer.
- Chum and Matas (2005) Chum, O.; and Matas, J. 2005. Matching with PROSAC-progressive sample consensus. In 2005 IEEE computer society conference on computer vision and pattern recognition, volume 1, 220–226. IEEE.
- Darmon, Aubry, and Monasse (2020) Darmon, F.; Aubry, M.; and Monasse, P. 2020. Learning to guide local feature matches. In 2020 International Conference on 3D Vision (3DV), 1127–1136. IEEE.
- DeTone, Malisiewicz, and Rabinovich (2018a) DeTone, D.; Malisiewicz, T.; and Rabinovich, A. 2018a. Superpoint: Self-supervised interest point detection and description. In Proceedings of the IEEE conference on computer vision and pattern recognition workshops, 224–236.
- DeTone, Malisiewicz, and Rabinovich (2018b) DeTone, D.; Malisiewicz, T.; and Rabinovich, A. 2018b. Superpoint: Self-supervised interest point detection and description. In Proceedings of the IEEE conference on computer vision and pattern recognition workshops, 224–236.
- Dusmanu et al. (2019) Dusmanu, M.; Rocco, I.; Pajdla, T.; Pollefeys, M.; Sivic, J.; Torii, A.; and Sattler, T. 2019. D2-net: A trainable cnn for joint description and detection of local features. In Proceedings of the ieee/cvf conference on computer vision and pattern recognition, 8092–8101.
- Fan et al. (2020) Fan, Q.; Zhuo, W.; Tang, C.-K.; and Tai, Y.-W. 2020. Few-shot object detection with attention-RPN and multi-relation detector. In Proceedings of the IEEE/CVF Conference on Computer Vision and Pattern Recognition, 4013–4022.
- Germain, Bourmaud, and Lepetit (2020) Germain, H.; Bourmaud, G.; and Lepetit, V. 2020. S2dnet: Learning accurate correspondences for sparse-to-dense feature matching. arXiv preprint arXiv:2004.01673.
- Jiang et al. (2021) Jiang, W.; Trulls, E.; Hosang, J.; Tagliasacchi, A.; and Yi, K. M. 2021. COTR: Correspondence Transformer for Matching Across Images. In Proceedings of the IEEE international conference on computer vision.
- Jin et al. (2021) Jin, Y.; Mishkin, D.; Mishchuk, A.; Matas, J.; Fua, P.; Yi, K. M.; and Trulls, E. 2021. Image matching across wide baselines: From paper to practice. International Journal of Computer Vision, 129(2): 517–547.
- Katharopoulos et al. (2020) Katharopoulos, A.; Vyas, A.; Pappas, N.; and Fleuret, F. 2020. Transformers are rnns: Fast autoregressive transformers with linear attention. In International Conference on Machine Learning, 5156–5165. PMLR.
- Kirillov et al. (2019) Kirillov, A.; Girshick, R.; He, K.; and Dollár, P. 2019. Panoptic feature pyramid networks. In Proceedings of the IEEE/CVF Conference on Computer Vision and Pattern Recognition, 6399–6408.
- Kuhn (1955) Kuhn, H. W. 1955. The Hungarian method for the assignment problem. Naval research logistics quarterly, 2(1-2): 83–97.
- Li and Snavely (2018) Li, Z.; and Snavely, N. 2018. Megadepth: Learning single-view depth prediction from internet photos. In Proceedings of the IEEE Conference on Computer Vision and Pattern Recognition, 2041–2050.
- Lin et al. (2017a) Lin, T.-Y.; Dollár, P.; Girshick, R.; He, K.; Hariharan, B.; and Belongie, S. 2017a. Feature pyramid networks for object detection. In Proceedings of the IEEE conference on computer vision and pattern recognition, 2117–2125.
- Lin et al. (2017b) Lin, T.-Y.; Goyal, P.; Girshick, R.; He, K.; and Dollár, P. 2017b. Focal loss for dense object detection. In Proceedings of the IEEE international conference on computer vision, 2980–2988.
- Liu et al. (2018) Liu, S.; Qi, L.; Qin, H.; Shi, J.; and Jia, J. 2018. Path aggregation network for instance segmentation. In Proceedings of the IEEE conference on computer vision and pattern recognition, 8759–8768.
- Liu et al. (2016) Liu, W.; Anguelov, D.; Erhan, D.; Szegedy, C.; Reed, S.; Fu, C.-Y.; and Berg, A. C. 2016. Ssd: Single shot multibox detector. In European conference on computer vision, 21–37. Springer.
- Lowe (2004) Lowe, D. G. 2004. Distinctive image features from scale-invariant keypoints. International journal of computer vision, 60(2): 91–110.
- Luo et al. (2019) Luo, Z.; Shen, T.; Zhou, L.; Zhang, J.; Yao, Y.; Li, S.; Fang, T.; and Quan, L. 2019. Contextdesc: Local descriptor augmentation with cross-modality context. In Proceedings of the IEEE/CVF Conference on Computer Vision and Pattern Recognition, 2527–2536.
- Luo et al. (2020) Luo, Z.; Zhou, L.; Bai, X.; Chen, H.; Zhang, J.; Yao, Y.; Li, S.; Fang, T.; and Quan, L. 2020. Aslfeat: Learning local features of accurate shape and localization. In Proceedings of the IEEE/CVF conference on computer vision and pattern recognition, 6589–6598.
- Ma et al. (2019) Ma, J.; Zhao, J.; Jiang, J.; Zhou, H.; and Guo, X. 2019. Locality preserving matching. International Journal of Computer Vision, 127(5): 512–531.
- Rau et al. (2020) Rau, A.; Garcia-Hernando, G.; Stoyanov, D.; Brostow, G. J.; and Turmukhambetov, D. 2020. Predicting Visual Overlap of Images Through Interpretable Non-Metric Box Embeddings. In European Conference on Computer Vision, 629–646. Springer.
- Redmon and Farhadi (2017) Redmon, J.; and Farhadi, A. 2017. YOLO9000: better, faster, stronger. In Proceedings of the IEEE conference on computer vision and pattern recognition, 7263–7271.
- Ren et al. (2015) Ren, S.; He, K.; Girshick, R.; and Sun, J. 2015. Faster r-cnn: Towards real-time object detection with region proposal networks. Advances in neural information processing systems, 28: 91–99.
- Revaud et al. (2019) Revaud, J.; Weinzaepfel, P.; De Souza, C.; Pion, N.; Csurka, G.; Cabon, Y.; and Humenberger, M. 2019. R2D2: repeatable and reliable detector and descriptor. Advances in neural information processing systems.
- Rublee et al. (2011) Rublee, E.; Rabaud, V.; Konolige, K.; and Bradski, G. 2011. ORB: An efficient alternative to SIFT or SURF. In 2011 International conference on computer vision, 2564–2571. Ieee.
- Sarlin et al. (2019) Sarlin, P.-E.; Cadena, C.; Siegwart, R.; and Dymczyk, M. 2019. From coarse to fine: Robust hierarchical localization at large scale. In Proceedings of the IEEE/CVF Conference on Computer Vision and Pattern Recognition, 12716–12725.
- Sarlin et al. (2020) Sarlin, P.-E.; DeTone, D.; Malisiewicz, T.; and Rabinovich, A. 2020. Superglue: Learning feature matching with graph neural networks. In Proceedings of the IEEE/CVF conference on computer vision and pattern recognition, 4938–4947.
- Sattler et al. (2018) Sattler, T.; Maddern, W.; Toft, C.; Torii, A.; Hammarstrand, L.; Stenborg, E.; Safari, D.; Okutomi, M.; Pollefeys, M.; Sivic, J.; et al. 2018. Benchmarking 6dof outdoor visual localization in changing conditions. In Proceedings of the IEEE Conference on Computer Vision and Pattern Recognition, 8601–8610.
- Schonberger and Frahm (2016) Schonberger, J. L.; and Frahm, J.-M. 2016. Structure-from-motion revisited. In Proceedings of the IEEE conference on computer vision and pattern recognition, 4104–4113.
- Sun et al. (2021a) Sun, J.; Shen, Z.; Wang, Y.; Bao, H.; and Zhou, X. 2021a. LoFTR: Detector-free local feature matching with transformers. In Proceedings of the IEEE/CVF Conference on Computer Vision and Pattern Recognition, 8922–8931.
- Sun et al. (2021b) Sun, P.; Zhang, R.; Jiang, Y.; Kong, T.; Xu, C.; Zhan, W.; Tomizuka, M.; Li, L.; Yuan, Z.; Wang, C.; et al. 2021b. Sparse r-cnn: End-to-end object detection with learnable proposals. In Proceedings of the IEEE/CVF Conference on Computer Vision and Pattern Recognition, 14454–14463.
- Tian et al. (2019) Tian, Z.; Shen, C.; Chen, H.; and He, T. 2019. Fcos: Fully convolutional one-stage object detection. In Proceedings of the IEEE/CVF international conference on computer vision, 9627–9636.
- Tyszkiewicz, Fua, and Trulls (2020) Tyszkiewicz, M. J.; Fua, P.; and Trulls, E. 2020. DISK: Learning local features with policy gradient. arXiv preprint arXiv:2006.13566.
- Vaswani et al. (2017) Vaswani, A.; Shazeer, N.; Parmar, N.; Uszkoreit, J.; Jones, L.; Gomez, A. N.; Kaiser, Ł.; and Polosukhin, I. 2017. Attention is all you need. In Advances in neural information processing systems, 5998–6008.
- Voigtlaender et al. (2020) Voigtlaender, P.; Luiten, J.; Torr, P. H.; and Leibe, B. 2020. Siam r-cnn: Visual tracking by re-detection. In Proceedings of the IEEE/CVF Conference on Computer Vision and Pattern Recognition, 6578–6588.
- Wang et al. (2021) Wang, W.; Yao, L.; Chen, L.; Cai, D.; He, X.; and Liu, W. 2021. CrossFormer: A Versatile Vision Transformer Based on Cross-scale Attention. arXiv preprint arXiv:2108.00154.
- Wang, Jabri, and Efros (2019) Wang, X.; Jabri, A.; and Efros, A. A. 2019. Learning correspondence from the cycle-consistency of time. In Proceedings of the IEEE/CVF Conference on Computer Vision and Pattern Recognition, 2566–2576.
- Wiles, Ehrhardt, and Zisserman (2021) Wiles, O.; Ehrhardt, S.; and Zisserman, A. 2021. Co-Attention for Conditioned Image Matching. In Proceedings of the IEEE/CVF Conference on Computer Vision and Pattern Recognition, 15920–15929.
- Wu (2013) Wu, C. 2013. Towards linear-time incremental structure from motion. In 2013 International Conference on 3D Vision-3DV 2013, 127–134. IEEE.
- Yan et al. (2021) Yan, B.; Peng, H.; Fu, J.; Wang, D.; and Lu, H. 2021. Learning spatio-temporal transformer for visual tracking. arXiv preprint arXiv:2103.17154.
- Yi et al. (2016) Yi, K. M.; Trulls, E.; Lepetit, V.; and Fua, P. 2016. Lift: Learned invariant feature transform. In European conference on computer vision, 467–483. Springer.
- Zhang et al. (2021) Zhang, Z.; Liu, Y.; Wang, X.; Li, B.; and Hu, W. 2021. Learn to match: Automatic matching network design for visual tracking. arXiv preprint arXiv:2108.00803.
- Zhang et al. (2020) Zhang, Z.; Peng, H.; Fu, J.; Li, B.; and Hu, W. 2020. Ocean: Object-aware anchor-free tracking. In Computer Vision–ECCV 2020: 16th European Conference, Glasgow, UK, August 23–28, 2020, Proceedings, Part XXI 16, 771–787. Springer.