GSDiff: Synthesizing Vector Floorplans via
Geometry-enhanced Structural Graph Generation
Abstract
Automating architectural floorplan design is vital for housing and interior design, offering a faster, cost-effective alternative to manual sketches by architects. However, existing methods, including rule-based and learning-based approaches, face challenges in design complexity and constrained generation with extensive post-processing, and tend to obvious geometric inconsistencies such as misalignment, overlap, and gaps. In this work, we propose a novel generative framework for vector floorplan design via structural graph generation, called GSDiff, focusing on wall junction generation and wall segment prediction to capture both geometric and semantic aspects of structural graphs. To improve the geometric rationality of generated structural graphs, we propose two innovative geometry enhancement methods. In wall junction generation, we propose a novel alignment loss function to improve geometric consistency. In wall segment prediction, we propose a random self-supervision method to enhance the model’s perception of the overall geometric structure, thereby promoting the generation of reasonable geometric structures. Employing the diffusion model and the Transformer model, as well as the geometry enhancement strategies, our framework can generate wall junctions, wall segments and room polygons with structural and semantic information, resulting in structural graphs that accurately represent floorplans. Extensive experiments show that the proposed method surpasses existing techniques, enabling free generation and constrained generation, marking a shift towards structure generation in architectural design. Code and data are available at https://github.com/SizheHu/GSDiff.
Introduction
Automatic design of architectural floorplans has garnered widespread attention, as detailed architectural blueprints are crucial for constructing residences and designing interior scenes. Recent years have seen significant advancements in the automated floorplan generation. Existing methods can be broadly categorized into rule-based and learning-based approaches. The former (Merrell, Schkufza, and Koltun 2010; Liu et al. 2013; Laignel et al. 2021; Shekhawat et al. 2021), relying on specific user requirements and expert knowledge, typically optimize based on various explicit rules as constraints. This process is often sensitive to the modeling of constraints and the selection of parameters. The latter (Hu et al. 2020; Chaillou 2020; Nauata et al. 2021; Para et al. 2021), using deep neural networks, learns implicit design rules from real floorplans. While addressing the shortcomings of rule-based methods, it also introduces new issues: (i) It is challenging to ensure that generated floorplans meet explicit constraints, such as pronounced misalignment; (ii) The generated results usually require heuristic post-processing to be converted into usable vector floorplans.
In this paper, we propose a novel framework called GSDiff to directly synthesize vector floorplans. The core idea is to view vector floorplan synthesis as structural graph generation and decouple it into two tasks: wall junction generation and wall segment prediction. We represent the floorplan as a structural graph (Sun et al. 2022), where nodes represent wall junctions and edges represent wall segments. Additionally, to capture the floorplan semantics, we consider room labels as one of the node attributes. We first use a generative model based on a diffusion model to generate graph nodes, and then a predictive model based on a Transformer is used to determine graph edges between generated nodes, resulting in a complete structural graph. To improve the design aesthetics, we also propose geometry-enhanced optimization techniques. During the node generation phase, we introduce a novel node alignment loss that optimizes the alignment error of nodes in mixed-base representations, which empowers the generative model to constrain node alignment. In the edge prediction phase, we employ an innovative edge perception enhancement strategy. This involves randomly interpolating a third point on the edges and self-supervising the model to predict the interpolation coefficients, which enhances the geometric perception ability of our edge prediction model, thereby improving the topological connectivity of structural graphs. Finally, vector floorplans can be directly extracted from the generated structural graphs.
Extensive evaluations show that our method has significant advantages over state-of-the-art techniques on all metrics, enabling free generation and constrained generation. Our contributions are as follows: (i) A novel framework for automatically generating diverse, high-quality vector floorplans with various constraints by transforming the problem into a structured graph generation process. (ii) An alignment error optimization strategy that improves node alignment for better node consistency in the node generation phase. (iii) An innovative edge perception enhancement strategy that improves the edge accuracy in the edge prediction phase.

Related work
Early works generate floorplans through rule-based floorplan optimization (Merrell, Schkufza, and Koltun 2010; Liu et al. 2013; Wu et al. 2018; Laignel et al. 2021; Wang and Zhang 2020; Shekhawat et al. 2021; Bisht et al. 2022). Due to the complexity of architectural design, deep learning methods have now become the mainstay of the field. Therefore, we focus on learning-based floorplan generation.
Imagery floorplan generation
Some deep learning methods generate imagery floorplans. RPLAN (Wu et al. 2019) proposes a two-stage method for floorplan generation that starts with predicting room locations and types, followed by detailing wall semantics and finalizing with vectorization to achieve the end floorplan. WallPlan (Sun et al. 2022) also converts floorplan generation as a graph generation task. However, it still generates floorplan images rather than vector formats via Convolutional Neural Networks (CNNs), therefore it can be categorized as an imagery generation. These methods cannot operate as true generative models as they generate specific outputs from given inputs. GAN-based floorplan generation (Chaillou 2020; Nauata et al. 2020, 2021) have gained traction for this purpose. However, these methods face challenges in generating structural elements, requiring complex post-processing to convert to vector formats. In contrast, our method not only can generate multiple results from the same input but also bypasses such limitations by directly generating vector floorplans, simplifying the process and enhancing output usability.
Vector floorplan generation
Vector floorplans are more widely used in practical applications. Graph2Plan (Hu et al. 2020) introduces a method to create floorplans from specified bubble diagrams. However, aligning the boxes with the semantic representations requires complex post-processing to obtain vector floorplans. (Para et al. 2021) conceptualizes the floorplan as a box set, followed by optimization for geometric shaping. This method sometimes faces unsuitable constraints for optimization. HouseDiffusion (Shabani, Hosseini, and Furukawa 2023) represents an innovative application of diffusion models to floorplan generation, where floorplans are depicted as polygons with vertices categorizing rooms or doors. This method, however, encounters issues with room alignment, producing gaps or overlaps, and is limited by the necessity of specifying room categories and numbers up front. Our work distinguishes itself by avoiding the limitations of box-set representations and directly producing vector floorplans. Furthermore, by utilizing a generative model, our method possesses the ability to generate diverse results from the same input, while Graph2Plan can only produce a single output.
Diffusion Model
Diffusion models are a class of generative models to reverse the noise addition process, thereby enabling the generation of data that mimics the original distribution from Gaussian noise. A standard diffusion model generally contains the forward and backward processes (Ho, Jain, and Abbeel 2020). Diffusion models have made remarkable progress across various generation tasks, including image generation (Nichol et al. 2021; Ho et al. 2022; Rombach et al. 2022; Saharia et al. 2022), point cloud generation (Nichol et al. 2022), and 3D model generation (Poole et al. 2022; Liu et al. 2023). Our framework is centered on the diffusion model, and extends the capabilities of diffusion modeling for generating floorplans, enhancing the flexibility of the model to generate a wider variety of floorplans without the need for predefined room categories or quantities.
Method

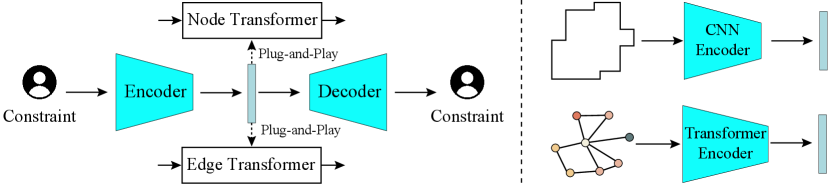
We convert floorplan generation into graph generation, by representing the vector floorplan as a structural graph . Directly generating structural graphs is pretty complex. To this end, we propose a novel generation framework GSDiff (Figure 1) to decouple the structure graph generation into two stages: node generation and edge prediction, i.e., , which results in the complete structural graph. Finally, all minimal polygonal loops of the structural graph are extracted as rooms to obtain the final vector floorplan. GSDiff takes design constraints, such as floorplan boundaries, as input and produces high-quality vector floorplans. For simplicity, we first introduce unconstrained generation and more details about constrained generation will be presented later.
Floorplan representation
We represent the vector floorplan as a structural graph (Figure 1 (a)): wall junctions are abstracted as nodes, and wall segments as edges. , where is the node set, and is the edge set. , where is the positional coordinate in the range of . denotes the semantics of all rooms that surround , where for absence and for presence of the specific room category, and is the number of room categories, which is (Living room, Bedroom, Kitchen, Bathroom, Balcony, Storage, External area) in our experiments. Let represent all polygonal loops of rooms, each loop is defined by a sequence of graph nodes. The room category of is the shared room category of all graph nodes forming that room. Different from (Sun et al. 2022), we set a fixed node number by considering background nodes, which is determined by the maximum number of nodes in floorplans in our dataset. Background nodes are filtered out by assigning a background attribute for each node, denoted as , where 0 denotes the junction node and 1 for the background node. Vector floorplans have a multi-level structure. Spatially, 0D wall junctions form 1D wall segments, which close into 2D rooms. Semantically, each wall junction that forms a room has the same room semantics. Therefore, generating all 0D wall junctions basically determines the whole floorplan structure.
Node Generation
We adopt a diffusion model (Ho, Jain, and Abbeel 2020) based network architecture to generate nodes (Figure 2).
Network architecture
Our forward process incrementally adds noise to an original data sample over steps, resulting in a sample resembling Gaussian noise. Our reverse process is a Transformer (Vaswani et al. 2017) based neural network, which takes the noisy node set at time and outputs the predicted noise at time ( represents the parameters of Transformer), therefore inferring the noisy node set at time . When the time step reaches 0, the node generation process terminates. Given a noisy node set at time . We initialize the node embedding of node as
| (1) |
is the coordinate embedding, where is the positional encoding (Vaswani et al. 2017). is the embedding of using a fully connected layer. is the time embedding using a feed-forward neural network (FFN).
Loss function
The reconstruction loss is typically defined as the Mean Squared Error (MSE) for training:
| (2) |
Due to the probabilistic nature of neural networks, the generated nodes may not be perfectly aligned. We propose a new alignment loss that optimizes alignment errors. Unlike natural language or images, structural graphs have precise geometric relationships, like perfectly horizontal or vertical walls. Directly regressing real-valued coordinates often fails to capture this precision. Thus, we convert real values into binary representations for regression, which discretizes the continuous coordinate space for more precise learning. However, learning discrete representations accurately is challenging, as errors in higher-order bits can cause significant real-value errors. To address this, we propose mixing multiple radix representations. Real-valued representations can heavily penalize large errors but are lenient on small misalignments. Binary representations, though overly discrete and causing significant penalties for small misalignments, are ineffective for large errors. By “interpolating” various radix representations, we aim for a smooth transition that penalizes large errors appropriately while remaining sensitive to small misalignments, balancing both advantages for better performance. We aim to enhance node alignment by applying the above concepts to propose a novel alignment loss across multiple bases, including real, binary, quaternary, octal, and hexadecimal:
| (3) |
| (4) |
| (5) |
where is the -base representation, , , , , with indicating the maximum allowable distance under -base. is the node number, is the bit size. With , and . denotes the -th bit.
We combine the reconstruction loss and alignment loss:
| (6) |
We adopt time-related weighting scheme (Chen et al. 2024), assigning higher weights at smaller time step . More details can be found in the supplementary material.
Edge Prediction
We use a Transformer-based predictive model to determine graph edges between generated nodes (Figure 2).
Network architecture
For each candidate edge , the input embedding is obtained by fusing the embeddings of and :
| (7) |
The coordinate embedding and the semantic-background embedding are concatenated as the node embedding .
To enhance the model’s robustness, we introduce noise to the node features during the training phase. Specifically, for the normalized 2D coordinate of each node, we add truncated Gaussian noise , which sampled from Gaussian noise but is bounded at both ends. For the semantic attributes of the nodes, we randomly flip each bit in the multi-hot representation with a probability , simulating label noise. We set and .
Loss function
Edge prediction is essentially geometric inference, rich geometric information will be more helpful. However, the geometric information of an edge includes more than just its endpoints. To improve edge perception, we propose an edge perception enhancement strategy. Specifically, we add a random interpolation point and require the model to predict its interpolation coefficient, enhancing the model’s ability to infer intermediate edge structures. For each edge , the interpolation point’s coordinates and attributes are defined as:
| (8) |
where , is a random interpolation coefficient. The supervised loss for interpolation is:
| (9) |
where represents the model’s predicted interpolation coefficient. , if ; , if .
The enhanced edge feature includes the features of the two endpoints of an edge, as well as the random interpolation point. The final edge prediction loss for training is:
| (10) |
where is the Cross-entropy classification loss. More details are provided in the supplementary material.
Floorplan extraction
So far, we have obtained the structural graph . We can simply extract all minimal polygonal loops as rooms. Considering that the prediction based on neural networks might contain errors, leading to the absence of a category shared by all nodes, we select the most frequently occurring category as the room type. If multiple categories have the highest frequency, we consider factors such as the rarity of the category and determine the room type based on the following priority: Storage Bathroom Kitchen Bedroom Balcony Living room. An illustration is provided in the supplementary material.
Constrained Generation
The proposed framework supports constrained floorplan generation. To incorporate constraints into our framework, we introduce constraint encoders to guide the generation. We encode the constraints using an encoder specific to the constraint modality, and the encoded features serve as input to the decoder to model the conditions via cross-attention. To improve the encoding capability of constraint encoders, we train each encoder individually. Specifically, we use a “pre-training + fine-tuning” paradigm, where we first pre-train the constraint encoder on the synthetic constraint data, and then fine-tune the encoder on the real constraint data of the dataset to achieve better generalization. We train constraint encoders in the framework of autoencoder. Without loss of generality, we focus on the boundary-constrained generation and topology-constrained generation in this paper (Figure 3). See more details in the supplementary material.
Boundary-constrained generation
A boundary refers to the outer contour of a floorplan, typically represented as a polygon. To encode a boundary, we draw the boundary polygon on an image with a resolution of , converting the boundary polygon into an image. We then use a CNN-based encoder for encoding. Specifically, we modify U-Net (Ronneberger, Fischer, and Brox 2015) by removing skip connections and adding residual connections, as our boundary encoder. The encoder outputs a feature map of with channels. During the pre-training phase, we generate random polygons on the image and learn their encodings with a CNN-based autoencoder. In the fine-tuning phase, we train with real boundary data from the dataset. The boundary embeddings are fed to node and edge Transformers, ensuring that the boundary of the generated structural graph adheres to the given constraint of the boundary.

Topology-constrained generation
Floorplan topology is used to describe the connectivity between rooms. It is an undirected graph where each node represents a room, and each edge represents a connectivity between two rooms. We encode the topological graph with a Transformer, which outputs 256D embeddings of all rooms, constituting topological embeddings. During the pre-training phase, we randomly generate topological graphs and learn their embeddings using a Transformer-based autoencoder. During the fine-tuning phase, we train with real topological graph data. The topology embeddings are fed to node and edge Transformers, ensuring that the topology of the generated structural graph adheres to the given constraint of the topology.
Experiments
Our method is implemented using Pytorch and trained on an NVIDIA GeForce GTX 4090 GPU. To ensure the quality of training at each stage, we train each network separately, using the Adam optimizer (Kingma 2014) with an initial learning rate of . We have used the RPLAN dataset (Wu et al. 2019) for training and testing, which contains more than 80K residential floorplans with dense annotation. The sample size for validing and testing is 3,000 each and the rest is used for training. Creating a vector floorplan takes an average of 0.17 seconds without constraints, 0.67 seconds with boundary constraints, and 0.86 seconds with topological constraints. See more in the supplementary material.
Qualitative Evaluation
Unconstrained generation
Unconstrained generation means that diverse floorplans can be generated without any inputs. The unconstrained generation allows users to explore freely, potentially inspiring more creative and innovative designs. It is worth noting that less research work is currently focused on unconstrained floorplan generation. By tilting balcony walls in the dataset, our method can also generate floorplans with slanted walls. Thanks to our robust structural graph representation, alignment error optimization strategy, and edge perception enhancement strategy, we can generate diverse, high-quality, vector floorplans without any inputs (Figure 4). For more results, please refer to the supplementary materials.

Boundary-constrained generation
Both Graph2Plan and WallPlan can generate floorplans from boundaries, thus we compare our method against them. Figure 5 shows a comparison of floorplans generated by different methods. Graph2Plan is prone to generating issues such as unreasonable space divisions and areas, making these defects particularly noticeable as almost every sample exhibits significant flaws. Specifically, the second column features a huge balcony and tiny bedrooms, kitchen, and bathroom; the third column lacks a balcony; the fourth column has a bedroom accessible only through another bedroom on the right, and the fifth column includes an overly narrow balcony. WallPlan, although it produces fewer unreasonable shapes than Graph2Plan, some defects still persist. In the first column, the storage cabinet next to the bathroom should be against a wall, but it is located in the middle of the room; the second column has an unreasonable bathroom division, the third column has overly simplistic divisions, a huge bathroom, and a missing balcony; the fourth column has a super small, impractical bedroom, and the fifth column has a bathroom blocked by storage. The limitations of Graph2Plan and WallPlan are that they can only generate a single result for a specific input, and CNNs struggle to model long-range semantic relationships that involve the reasonableness of room layouts. In contrast, our model, benefiting from structural representation and attention mechanisms, can produce a variety of results that are closer to the fundamental facts of actual buildings.

Topology-constrained generation
We compare our method with House-GAN++ and HouseDiffusion, which can generate floorplans based on topology graph constraints. It’s noteworthy that HouseDiffusion requires the number of vertices for each room polygon to be pre-specified, hence we retrieve samples from the dataset as its input. Figure 6 shows a comparison of different methods. The principal issue with House-GAN++ lies in the peculiar room shapes, and jagged room boundaries are prevalent, leading to weaker visual aesthetics. Specifically, the overly small balcony at the top of the first column, the unreasonable arrangement between balconies and bedrooms in the second, third, and fourth columns, and the bedroom obstructed by the bathroom in the fifth column. And nearly every sample fails to meet the constraints. HouseDiffusion generates better quality compared to House-GAN++, yet it requires the number of vertices for each room polygon to be pre-specified as an extra “constraint”, limiting the diversity of room shapes. Moreover, limited by their binary coordinate optimization, there are issues with boundaries not aligning well, preventing the acquisition of a good wall structure. Many of their generated results fail to satisfy the room’s topological constraints. Specifically, the poorly shaped balconies in the first, third, and fourth columns, the bathroom in the middle of the house in the second column, and the kitchen in the fourth column that can only be entered from a bedroom. In contrast, our method can generate high-quality and diverse room boundaries, making the generated results more natural, aesthetically pleasing, and compliant with constraints.
Quantitative Evaluation
| Constraint | Method | # Param | FID | KID | GED | Living | Kitchen | Bedroom | Storage | Bathroom | Balcony |
|---|---|---|---|---|---|---|---|---|---|---|---|
| Topology | House-GAN++ | 2M | 48.40 | 54.66 | 3.9 | 0.860 | 1.300 | 0.984 | 1.151 | 1.378 | 1.037 |
| HouseDiffusion | 27M | 11.87 | 7.23 | 2.59 | 0.955 | 0.971 | 0.979 | 0.567 | 0.967 | 0.994 | |
| Ours (27M) | 27M | 6.64 | 1.62 | 0.57 | 0.977 | 0.981 | 0.989 | 0.817 | 0.954 | 0.966 | |
| Ours | 125M | 6.82 | 1.79 | 0.49 | 0.992 | 0.991 | 1.004 | 0.752 | 0.966 | 0.976 | |
| Boundary | Graph2Plan | 8M | 8.40 | 1.34 | - | 1.034 | 0.975 | 1.013 | 0.727 | 0.959 | 0.859 |
| WallPlan | 106M | 9.07 | 1.02 | - | 0.992 | 1.033 | 0.923 | 1.136 | 1.058 | 1.008 | |
| Ours (106M) | 106M | 7.83 | 0.51 | - | 1.000 | 0.954 | 1.007 | 0.500 | 0.964 | 0.977 | |
| Ours | 137M | 7.50 | 0.56 | - | 1.007 | 0.990 | 0.992 | 0.454 | 0.967 | 0.935 |
Distribution comparison
The distribution comparison is used to analyze the overall generation capability of a generative model by comparing the differences between the distributions of generated data and real data. We consider the following representative metrics: (1) FID (Fr’echet Inception Distance)(Heusel et al. 2017) is used to measure the quality and diversity of generated images by calculating the distribution distance between real and generated data in feature space; (2) KID (Kernel Inception Distance)(Bińkowski et al. 2018) uses kernel methods to calculate the maximum mean discrepancy in feature space and is generally considered to be more robust than FID. Table 1 shows the results of the distribution comparison. It’s worth mentioning that we found that the image metrics FID and KID are influenced by a combination of factors such as room type, area, room layout, wall shape, and alignment, which can measure the generation results on the whole, making them excellent indicators for floorplan generation. In the evaluation of boundary-constrained generation, we selected the intersection of the test sets of our model, Graph2Plan, and WallPlan (378 boundaries in total) as input constraints, generating one sample per boundary for each method (as Graph2Plan and WallPlan can only produce a single output). Table 1 shows that the visual, geometric, and other features of our generation results outperform Graph2Plan and WallPlan. For the evaluation of topology graph-constrained generation, we selected the intersection of the test sets of our model, House-GAN++, and HouseDiffusion (a total of 757 topology graphs) as input constraints, generating 757 * 5 samples for each method, calculating the results five times and taking the average. Table 1 indicates that our generation results maintain better geometric consistency, visual appeal, and better practicality. Additionally, for topology-constrained generation, we reference HouseDiffusion (Shabani, Hosseini, and Furukawa 2023), and introduce Graph Edit Distance (GED) (Abu-Aisheh et al. 2015) as an additional metric for evaluation. GED is a graph-matching approach that calculates the distance between the input bubble diagram and the one reconstructed from the generated floorplan. For GED of House-GAN++, we directly use the reported GED in their paper. Table 1 indicates that our generation results maintain better constraint satisfaction, which benefits from our structural representation. For the unconstrained generation of floorplans with slanted walls, FID=12.02, KID=9.98.
Statistics comparison
We also conducted a statistical analysis of the generated vector results to evaluate the quality of the generated floorplans in terms of practicality. We ran the test set five times for each method. For each method’s generated results, we calculated the amount of each type of room. We calculated the average values of these statistics and compared them with the corresponding statistics of the ground truth in the real dataset (the closer to 1, the better). The results, as shown in Table 1, indicate that our method has a clear advantage in practicality compared to state-of-the-art techniques. For most types of rooms (living room, kitchen, bedroom), the amount generated by our method is closer to the real dataset. Only the balcony, storage, and bathroom are closer to the dataset by House-GAN++ and HouseDiffusion, but the difference in closeness with ours is not significant. Moreover, for boundary constraints, our method also shows an advantage in bathrooms.
Ablation Study
| Method | FID | KID | FE(%) | AE |
|---|---|---|---|---|
| NodeNone + EdgeNone | 6.23 | 4.12 | 1.35 | 0.34 |
| NodeReal + EdgeNone | 6.18 | 4.16 | 1.32 | 0.29 |
| NodeBinary + EdgeNone | 5.90 | 4.03 | 1.28 | 0.33 |
| Node + EdgeNone | 4.96 | 2.92 | 1.15 | 0.23 |
| NodeNone + Edge | 5.72 | 3.74 | 1.13 | 0.33 |
| NodeReal + Edge | 5.84 | 3.93 | 1.11 | 0.29 |
| NodeBinary + Edge | 5.84 | 3.96 | 1.13 | 0.34 |
| Node + Edge (Ours) | 4.83 | 2.84 | 0.95 | 0.23 |
We introduce two geometric enhancement strategies: one for alignment enhancement that optimizes the alignment error of nodes in mixed-base representations, and the other for perception enhancement that enhances the geometric perception ability of our edge prediction. To evaluate these two strategies, we have conducted a series of ablation experiments (Table 2). In these experiments, NodeNone indicates no alignment enhancement for node generation, NodeReal indicates the only use of continuous real-valued alignment error optimization, NodeBinary indicates the only use of binary discrete alignment error optimization, EdgeNone indicates no perception enhancement for edge prediction, and Node and Edge is our full methods.
Our method (Node + Edge) outperforms the other ablation methods in terms of all evaluated metrics, demonstrating that our geometric enhancements effectively improve the quality of the generated floorplans. For FID and KID, our method achieved the lowest FID=4.83 and KID=2.84, indicating that the generated floorplans are more similar to the real data distribution. This demonstrates that both geometric alignment and edge perception enhancements contribute to higher visual fidelity and distribution alignment. FE is minimized with our method (0.95%), which means the structural integrity and accuracy of the generated floorplans are effectively improved. AE remains consistently low (0.23), highlighting that our method effectively maintains geometric consistency and precision in the generated floorplans.
Retrieval Analysis
To further evaluate the generalization ability of the model, we performed a comprehensive retrieval analysis of the generated floorplans against those in the training set. For each generated floorplan (3,000 in total), we compute the minimum Euclidean distance and Wasserstein distance in image space between it and all floorplans in the training set: if the training set sample corresponding to the minimum distance is visually similar to the generated floorplan, it indicates possible overfitting. The retrieval results show that there is a significant difference between the results we generate and those retrieved from the dataset, i.e., our model has good generalization performance. However, the distance values are not intuitive enough. To illustrate the difference intuitively, we provide several examples in Fig. 7 showing the closest match between the generated floorplans and the ones in the training set.

Discussion on Model Sizes
To ensure a fair comparison, we evaluated our method under equivalent model parameter sizes.
Topology-constrained generation
Our original model for topology-constrained generation has approximately 125 million parameters, while House-GAN++ and HouseDiffusion have about 2 million and 27 million parameters, respectively. To assess the impact of model size, we reduced our model’s parameter count to 27 million to match that of HouseDiffusion, retraining it with all other configurations unchanged. As shown in Figure 6 and Table 1, even with the same parameter size, our method still achieves superior performance. This indicates that the effectiveness of our method stems from its inherent advantages rather than a larger parameter count. Regarding House-GAN++, we could not adjust our model to match their 2 million parameters. However, House-GAN++ has inherent problems. See the supplementary material for details.
Boundary Constrained Generation
Our model has about 137 million parameters. In comparison, WallPlan has about 106 million parameters and Graph2Plan has about 8 million parameters. To evaluate the impact of model size, we reduce the number of parameters of our model to 106 million to match WallPlan and retrain it. As shown in Fig. 5 and Table 1, our method still achieves superior performance, which also shows that our method has its inherent advantages. Regarding Graph2Plan, we were unable to adjust the model to match their 8 million parameters. However, Graph2Plan has inherent problems. See the supplementary material for details.
Evaluation on Other Datasets
To further demonstrate the generalization and effectiveness of our model, we conducted experiments on the LIFULL dataset (LIFULL Co. 2016). We obtained the vectorized subset of LIFULL dataset via Raster-to-Graph (Hu et al. 2024), which contains 10,804 floorplans: 500 are used for validation, 500 for testing, and the rest for training. We trained our unconstrained model using the same configurations as with RPLAN, adjusting only the room categories to align with the 12 in LIFULL. Table 3 and Fig. 8 showcases the quantitative and qualitative results, respectively, demonstrating our method’s generalizability and effectiveness in diverse scenarios. However, as the Raster-to-Graph authors themselves mentioned, the annotation quality of the LIFULL vectorized dataset they extracted is weaker and the number is much smaller than that of RPLAN, which make the effect on LIFULL limited. Possible future works would include extending our method to the MSD (van Engelenburg et al. 2024) dataset, which contains a significant share of layouts of multi-apartment dwellings. MSD lacks vectorized structural graphs, and the presence of complex shapes of walls in the images makes vectorized structural graphs difficult to extract.
| Dataset | FID | KID | FE(%) | AE |
| LIFULL | 12.44 | 3.61 | 6.11 | 3.75 |

Conclusion
We introduce a novel vector floorplan generation framework, GSDiff, which converts the complex floorplan generation problem into a structural graph generation problem, further decoupled into node generation and edge prediction. Additionally, we incorporate geometric enhancements into the generation framework. By optimizing the node alignment error, we achieve better geometric consistency. Through edge perception enhancement, we improve the edge prediction ability, resulting in better geometric plausibility. Experiments have shown that GSDiff outperforms existing state-of-the-art methods.
However, GSDiff faces limitations, such as reliance on quality training data for learning complex node and edge dependencies and scalability challenges in larger projects. Future research directions include exploring semi-supervised learning to reduce data dependency, enhancing constraint handling for complex scenarios and improving scalability. These aim to broaden the framework’s capabilities and applicability in architectural design.
Acknowledgments
We would like to thank the anonymous reviewers for their constructive suggestions and comments. This work is supported by the National Natural Science Foundation of China (62102126, 62372153) and the Fundamental Research Funds for the Central Universities of China (JZ2023HGTB0269, JZ2022HGQA0163). In this paper, we used ”LIFULL HOME’S Dataset” provided by LIFULL Co., Ltd. via IDR Dataset Service of National Institute of Informatics.
References
- Abu-Aisheh et al. (2015) Abu-Aisheh, Z.; Raveaux, R.; Ramel, J.-Y.; and Martineau, P. 2015. An exact graph edit distance algorithm for solving pattern recognition problems. In 4th International Conference on Pattern Recognition Applications and Methods 2015.
- Bińkowski et al. (2018) Bińkowski, M.; Sutherland, D. J.; Arbel, M.; and Gretton, A. 2018. Demystifying mmd gans. arXiv preprint arXiv:1801.01401.
- Bisht et al. (2022) Bisht, S.; Shekhawat, K.; Upasani, N.; Jain, R. N.; Tiwaskar, R. J.; and Hebbar, C. 2022. Transforming an adjacency graph into dimensioned floorplan layouts. In Computer Graphics Forum, volume 41, 5–22. Wiley Online Library.
- Chaillou (2020) Chaillou, S. 2020. Archigan: Artificial intelligence x architecture. In Architectural intelligence: Selected papers from the 1st international conference on computational design and robotic fabrication (CDRF 2019), 117–127. Springer.
- Chen et al. (2024) Chen, J.; Zhang, R.; Zhou, Y.; and Chen, C. 2024. Towards Aligned Layout Generation via Diffusion Model with Aesthetic Constraints. arXiv preprint arXiv:2402.04754.
- Heusel et al. (2017) Heusel, M.; Ramsauer, H.; Unterthiner, T.; Nessler, B.; and Hochreiter, S. 2017. Gans trained by a two time-scale update rule converge to a local nash equilibrium. Advances in neural information processing systems, 30.
- Ho, Jain, and Abbeel (2020) Ho, J.; Jain, A.; and Abbeel, P. 2020. Denoising diffusion probabilistic models. Advances in neural information processing systems, 33: 6840–6851.
- Ho et al. (2022) Ho, J.; Saharia, C.; Chan, W.; Fleet, D. J.; Norouzi, M.; and Salimans, T. 2022. Cascaded diffusion models for high fidelity image generation. Journal of Machine Learning Research, 23(47): 1–33.
- Hu et al. (2020) Hu, R.; Huang, Z.; Tang, Y.; Van Kaick, O.; Zhang, H.; and Huang, H. 2020. Graph2plan: Learning floorplan generation from layout graphs. ACM Transactions on Graphics (TOG), 39(4): 118–1.
- Hu et al. (2024) Hu, S.; Wu, W.; Su, R.; Hou, W.; Zheng, L.; and Xu, B. 2024. Raster-to-Graph: Floorplan Recognition via Autoregressive Graph Prediction with an Attention Transformer. Computer Graphics Forum, 43(2): e15007.
- Kingma (2014) Kingma, D. 2014. Adam: a method for stochastic optimization. arXiv preprint arXiv:1412.6980.
- Laignel et al. (2021) Laignel, G.; Pozin, N.; Geffrier, X.; Delevaux, L.; Brun, F.; and Dolla, B. 2021. Floor plan generation through a mixed constraint programming-genetic optimization approach. Automation in Construction, 123: 103491.
- LIFULL Co. (2016) LIFULL Co., L. . 2016. LIFULL HOME’S High Resolution Floor Plan Image Data. Informatics Research Data Repository, National Institute of Informatics. (dataset). https://doi.org/10.32130/idr.6.2.
- Liu et al. (2013) Liu, H.; Yang, Y.-L.; AlHalawani, S.; and Mitra, N. J. 2013. Constraint-aware interior layout exploration for pre-cast concrete-based buildings. The Visual Computer, 29: 663–673.
- Liu et al. (2023) Liu, R.; Wu, R.; Van Hoorick, B.; Tokmakov, P.; Zakharov, S.; and Vondrick, C. 2023. Zero-1-to-3: Zero-shot one image to 3d object. In Proceedings of the IEEE/CVF International Conference on Computer Vision, 9298–9309.
- Merrell, Schkufza, and Koltun (2010) Merrell, P.; Schkufza, E.; and Koltun, V. 2010. Computer-generated residential building layouts. In ACM SIGGRAPH Asia 2010 papers, 1–12.
- Nauata et al. (2020) Nauata, N.; Chang, K.-H.; Cheng, C.-Y.; Mori, G.; and Furukawa, Y. 2020. House-gan: Relational generative adversarial networks for graph-constrained house layout generation. In Computer Vision–ECCV 2020: 16th European Conference, Glasgow, UK, August 23–28, 2020, Proceedings, Part I 16, 162–177. Springer.
- Nauata et al. (2021) Nauata, N.; Hosseini, S.; Chang, K.-H.; Chu, H.; Cheng, C.-Y.; and Furukawa, Y. 2021. House-gan++: Generative adversarial layout refinement network towards intelligent computational agent for professional architects. In Proceedings of the IEEE/CVF Conference on Computer Vision and Pattern Recognition, 13632–13641.
- Nichol et al. (2021) Nichol, A.; Dhariwal, P.; Ramesh, A.; Shyam, P.; Mishkin, P.; McGrew, B.; Sutskever, I.; and Chen, M. 2021. Glide: Towards photorealistic image generation and editing with text-guided diffusion models. arXiv preprint arXiv:2112.10741.
- Nichol et al. (2022) Nichol, A.; Jun, H.; Dhariwal, P.; Mishkin, P.; and Chen, M. 2022. Point-e: A system for generating 3d point clouds from complex prompts. arXiv preprint arXiv:2212.08751.
- Para et al. (2021) Para, W.; Guerrero, P.; Kelly, T.; Guibas, L. J.; and Wonka, P. 2021. Generative layout modeling using constraint graphs. In Proceedings of the IEEE/CVF international conference on computer vision, 6690–6700.
- Poole et al. (2022) Poole, B.; Jain, A.; Barron, J. T.; and Mildenhall, B. 2022. Dreamfusion: Text-to-3d using 2d diffusion. arXiv preprint arXiv:2209.14988.
- Rombach et al. (2022) Rombach, R.; Blattmann, A.; Lorenz, D.; Esser, P.; and Ommer, B. 2022. High-resolution image synthesis with latent diffusion models. In Proceedings of the IEEE/CVF conference on computer vision and pattern recognition, 10684–10695.
- Ronneberger, Fischer, and Brox (2015) Ronneberger, O.; Fischer, P.; and Brox, T. 2015. U-Net: Convolutional Networks for Biomedical Image Segmentation. In Navab, N.; Hornegger, J.; Wells, W. M.; and Frangi, A. F., eds., Medical Image Computing and Computer-Assisted Intervention – MICCAI 2015, 234–241. Cham: Springer International Publishing. ISBN 978-3-319-24574-4.
- Saharia et al. (2022) Saharia, C.; Chan, W.; Chang, H.; Lee, C.; Ho, J.; Salimans, T.; Fleet, D.; and Norouzi, M. 2022. Palette: Image-to-image diffusion models. In ACM SIGGRAPH 2022 conference proceedings, 1–10.
- Shabani, Hosseini, and Furukawa (2023) Shabani, M. A.; Hosseini, S.; and Furukawa, Y. 2023. Housediffusion: Vector floorplan generation via a diffusion model with discrete and continuous denoising. In Proceedings of the IEEE/CVF Conference on Computer Vision and Pattern Recognition, 5466–5475.
- Shekhawat et al. (2021) Shekhawat, K.; Upasani, N.; Bisht, S.; and Jain, R. N. 2021. A tool for computer-generated dimensioned floorplans based on given adjacencies. Automation in Construction, 127: 103718.
- Sun et al. (2022) Sun, J.; Wu, W.; Liu, L.; Min, W.; Zhang, G.; and Zheng, L. 2022. Wallplan: synthesizing floorplans by learning to generate wall graphs. ACM Transactions on Graphics (TOG), 41(4): 1–14.
- van Engelenburg et al. (2024) van Engelenburg, C.; Mostafavi, F.; Kuhn, E.; Jeon, Y.; Franzen, M.; Standfest, M.; van Gemert, J.; and Khademi, S. 2024. MSD: A Benchmark Dataset for Floor Plan Generation of Building Complexes. arXiv:2407.10121.
- Vaswani et al. (2017) Vaswani, A.; Shazeer, N.; Parmar, N.; Uszkoreit, J.; Jones, L.; Gomez, A. N.; Kaiser, L. u.; and Polosukhin, I. 2017. Attention is All you Need. In Guyon, I.; Luxburg, U. V.; Bengio, S.; Wallach, H.; Fergus, R.; Vishwanathan, S.; and Garnett, R., eds., Advances in Neural Information Processing Systems, volume 30. Curran Associates, Inc.
- Wang and Zhang (2020) Wang, X.-Y.; and Zhang, K. 2020. Generating layout designs from high-level specifications. Automation in Construction, 119: 103288.
- Wu et al. (2018) Wu, W.; Fan, L.; Liu, L.; and Wonka, P. 2018. Miqp-based layout design for building interiors. In Computer Graphics Forum, volume 37, 511–521. Wiley Online Library.
- Wu et al. (2019) Wu, W.; Fu, X.-M.; Tang, R.; Wang, Y.; Qi, Y.-H.; and Liu, L. 2019. Data-driven interior plan generation for residential buildings. ACM Transactions on Graphics (TOG), 38(6): 1–12.
Reproducibility Checklist
This paper:
Includes a conceptual outline and/or pseudocode description of AI methods introduced (yes)
Clearly delineates statements that are opinions, hypothesis, and speculation from objective facts and results (yes)
Provides well marked pedagogical references for less-familiare readers to gain background necessary to replicate the paper (yes)
Does this paper make theoretical contributions? (no)
Does this paper rely on one or more datasets? (yes)
If yes, please complete the list below.
A motivation is given for why the experiments are conducted on the selected datasets (yes)
All novel datasets introduced in this paper are included in a data appendix. (NA)
All novel datasets introduced in this paper will be made publicly available upon publication of the paper with a license that allows free usage for research purposes. (NA)
All datasets drawn from the existing literature (potentially including authors’ own previously published work) are accompanied by appropriate citations. (yes)
All datasets drawn from the existing literature (potentially including authors’ own previously published work) are publicly available. (yes)
All datasets that are not publicly available are described in detail, with explanation why publicly available alternatives are not scientifically satisficing. (NA)
Does this paper include computational experiments? (yes)
If yes, please complete the list below.
Any code required for pre-processing data is included in the appendix. (no).
All source code required for conducting and analyzing the experiments is included in a code appendix. (no)
All source code required for conducting and analyzing the experiments will be made publicly available upon publication of the paper with a license that allows free usage for research purposes. (yes)
All source code implementing new methods have comments detailing the implementation, with references to the paper where each step comes from (partial)
If an algorithm depends on randomness, then the method used for setting seeds is described in a way sufficient to allow replication of results. (NA)
This paper specifies the computing infrastructure used for running experiments (hardware and software), including GPU/CPU models; amount of memory; operating system; names and versions of relevant software libraries and frameworks. (yes)
This paper formally describes evaluation metrics used and explains the motivation for choosing these metrics. (yes)
This paper states the number of algorithm runs used to compute each reported result. (yes)
Analysis of experiments goes beyond single-dimensional summaries of performance (e.g., average; median) to include measures of variation, confidence, or other distributional information. (yes)
The significance of any improvement or decrease in performance is judged using appropriate statistical tests (e.g., Wilcoxon signed-rank). (no)
This paper lists all final (hyper-)parameters used for each model/algorithm in the paper’s experiments. (yes)
This paper states the number and range of values tried per (hyper-) parameter during development of the paper, along with the criterion used for selecting the final parameter setting. (yes)