[1]\fnmM. Sohel \surRahman
[1]\orgdivComputer Science and Engineering, \orgnameBangladesh University of Engineering and Technology, \orgaddress\streetWest Palashi, \cityDhaka, \postcode1205, \stateDhaka, \countryBangladesh
2]\orgdivIntegrative Physiology, \orgnameBaylor College of Medicine, \orgaddress\cityHouston, \stateTX, \countryUSA
GraphAge: Decoding Epigenetic Aging through Co-Methylation Network Analysis Using GNN and GNN explainer
GraphAge: Unleashing the power of Graph Neural Network to Decode Epigenetic Aging
Abstract
DNA methylation is a crucial epigenetic marker used in various clocks to predict epigenetic age. However, many existing clocks fail to account for crucial information about CpG sites and their interrelationships, such as co-methylation patterns. We present a novel approach to represent methylation data as a graph, using methylation values and relevant information about CpG sites as nodes, and relationships like co-methylation, same gene, and same chromosome as edges. We then use a Graph Neural Network (GNN) to predict age. Thus our model, GraphAge leverages both the structural and positional information for prediction as well as better interpretation. Although, we had to train in a constrained compute setting, GraphAge still showed competitive performance with a Mean Absolute Error (MAE) of 3.207 and a Mean Squared Error (MSE) of 25.277, slightly outperforming the current state of the art. Perhaps more importantly, we utilized GNN explainer for interpretation purposes and were able to unearth interesting insights (e.g., key CpG sites, pathways and their relationships through Methylation Regulated Networks in the context of aging), which were not possible to ‘decode’ without leveraging the unique capability of GraphAge to ‘encode’ various structural relationships. GraphAge has the potential to consume and utilize all relevant information (if available) about an individual that relates to the complex process of aging. So, in that sense it is one of its kind and can be seen as the first benchmark for a multimodal model which can incorporate all these information in order to close the gap in our understanding of the true nature of aging.
keywords:
Epigenetic Age, Methylation, Co-methylation, Graph Neural Network (GNN), GNN explainer1 Introduction
The pursuit of a cure for aging has fascinated humanity for centuries, symbolized by the mythical quests for the Fountain of Youth or Elixir of Life. In contemporary times, these quests have transformed into scientific endeavors, with researchers exploring the intricate biology of aging and the underlying mechanisms that drive it. Modern studies focus on understanding how molecular processes and/or elements, such as DNA methylation, Gene expression, Glycans, proteomics and other biomarkers, influence aging and longevity [1, 2]. All these are information stored in cells and aging is a result from the loss of regulatory information in cells, leading to the accumulation of epigenetic noise and cellular dysfunction [3]. But by deciphering these processes, scientists aim to uncover potential interventions that could delay or even reverse aspects of biological aging [4, 5].
This ongoing research into the epigenetic regulation of aging is not just a continuation of an age-old quest, but a sophisticated, data-driven effort to map the biological pathways that govern the aging process. Key to this exploration is the role of CpG sites and their influence on gene regulation through methylation patterns [6, 7, 8], which hold significant implications on our understanding of chronological age and healthspan [9, 10, 11, 12, 13].
Various approaches to modeling the aging process have been explored in the literature, including transcriptomic models [14, 15], which have demonstrated great generalizability. Glycans are also considered good biomarkers for age [16], and glycan clocks have shown some merit [17]. Proteomics clocks have also been utilized. These models represent interconnected information, but unfortunately, there is no unified dataset where all information of a single individual is present. Among all these approaches, epigenetic clocks have proven to be the most influential [1].
1.1 Prior Works
Early research has unveiled a profound link between DNA methylation and aging, highlighting its significant role in the aging process [18, 19]. This groundbreaking insight spurred researchers to develop the first epigenetic clock, a remarkable tool created using saliva samples in 2011 [20]. This innovation marked a pivotal moment in epigenetics. Subsequently, Hannum et al. [21] published their 71 site methylation clock trained on blood followed by Horvath’s seminal work on a pan-tissue epigenetic clock on 353 CpG sites, demonstrating that the chronological age of an organism can be estimated based on epigenetic modifications, particularly DNA methylation patterns. Unlike chronological age, which simply counts the number of years a person has lived, epigenetic age aims to reflect the biological condition of the body and its systems, potentially providing a more accurate indicator of aging and health status. Many subsequent studies have aimed to refine and enhance these predictions (e.g., [22, 23, 24]). Horvath’s model, using linear regression on DNA methylation data, provided a robust framework for estimating chronological ages with impressive accuracy [25].
In 2021, Galkin et. al. [22] introduced DeepMAge, a deep neural network model that improved prediction performance over Horvath’s original model, particularly in blood samples. They employed gradient-based feature selection followed by a sequential neural network with four hidden layers, each containing 512 neurons. They used pathway analysis on the 1000 selected CpG sites by feature selection. They also emphasized the need for multimodal dataset, a lacking that still prevails as of today. As will be clear later, despite the current lack of such comprehensive datasets, our proposed model shows promise as a multimodal model.
Similarly, Levy et. al. [23] achieved encouraging results in age prediction using a multi-layer perceptrons. Another significant development, AltumAge [26], employed multi-layer perceptron layers and experimented their model performance across multiple tissues. They further utilized SHAP (Shapley Additive Explanations) [27] to interpret the contributions of different CpG sites towards age prediction. AltumAge also used interaction scores obtained from SHAP to demonstrate relationships between hyper-and hypomethylating CpG sites. Note that, hypomethylation and hypermethylation of DNA refer to relatively less or more methylation than in some standard DNA. Additionally, they identified pathways involving their top CpG sites. Thus the authors attempted to interpret and explain the results instead of just using AltmAge as a black-box. As will be shown later we also take a big stride along this dimension and hence we use AltumAge as the current state of the art for benchmarking.
Ying et. al. [24] proposed using epigenome-wide Mendelian Randomization [28] (EWMR) on 420,509 CpG sites to identify the sites that are causal to twelve aging-related traits, and then running the selected sites through an elastic net regression [29] model. A notable concern raised by Ying et al. was that correlation, rather than causality, dominated the results due to the exclusive use of methylation data. Therefore, they focused on using other biological data about the CpG sites for feature selection to achieve a more biologically significant outcome. This brings up the question of whether we could have a generalized formulation that would incorporate any additional feature (e.g., the ones mentioned by Ying et. al.) in the model under consideration, assuming of course, that the data of all relevant sites are available. As will be clear later, our model, GraphAge, naturally lends itself to such a formulation.
Before concluding this section, a brief discussion on a related interesting concept, called co-methylation is in order. Affinito et al. [30] showed that co-methylation depends on spatial and structural information and is related to the nucleotide distance among CpG sites. The co-methylation of closer CpG sites have more influence than that of those that are further apart. Also, research findings indicate that after DNA replication, De Novo genes, depending on specific sites, may or may not exhibit the same methylation rates as their parents, suggesting that methylation is influenced by structural and positional information [31]. This has motivated the researchers to model co-methylation networks along with constructing models to predict aging. For example, Wu et al. [32] created a co-methylation network based on MeRIP-Seq data by taking correlations among all sites and visualizing it using Cytoscape [33].
1.2 Our Contributions
All previous clock models had fairly good accuracy but they did not adequately take into account crucial structural information and the dynamic interactions between CpG sites through co-methylation. This limits our understanding of interaction among these sites thereby preventing us from achieving a comprehensive interpretation. On the other hand, works that tried to model the co-methylation network did not take into account how CpG sites influence the aging process and which co-methylation edges/CpG sites are important to give a meaningful interpretation.
We propose to solve both the problems by utilizing all possible given information we currently have available regarding the CpG sites to formulate a graph where nodes encapsulate the information about CpG sites and edges represent all relationships among them thereby capturing the structure of co-methylation network. Then, we train it using the power of Graph Neural Networks, albeit in a resource constraint setting. Thus, we present the first age prediction model, GraphAge, that attempts to leverage all available structural information [34]. And despite our resource constraints, GraphAge was able to “come of age” by outperforming AltumAge in both dimensions of efficacy and interpretatbility. Notably, instead of a pan-tissue training approach, we opted for a tissue specific approach because gene expression follows a tissue specific pattern [35, 36]. For interpretation purposes, we leverage the Graph Neural Network Explainer [37].


2 Results and Discussions
2.1 A brief Methodical Overview
For the sake of better comprehension, here we give a brief overview of our methods (Fig. 1); the details can be found in Section 4. We constructed a graph where nodes are CpG sites and edges represent their relationships. We selected CpG sites common across all methylation data platforms, using structural information from NCBI GEO [38]. We transformed tabular methylation data into a graph, with node attributes including methylation beta values, CpG island information, base pair positions, and normalized distances from transcription start sites. Edge features included co-methylation values, same chromosome, and gene indicators. We applied universal, chromosome-specific, and distance-based thresholds for edge filtering, allowing more flexibility for closer CpG sites with lower co-methylation values [30]. Our model used a Principal Neighborhood Aggregation (PNA) [39] convolutional layer in a Graph Neural Network (GNN) followed by a fully connected layer for age prediction.
For interpreting the model, we used GNN explainer [37]. We averaged node and edge importance across age groups for a comprehensive understanding and visualized these using Graphviz [40]. Importance analysis involved averaging node attribute importance across samples and plotting temporal patterns. We performed Enrichr analysis [41, 42, 43] on hypo- and hypermethylating genes, and identified nodes with significant upward or downward trends using linear regression.


2.2 Model Performance
We trained GraphAge and, as has been mentioned above, compared it primarily with AltumAge [26] for the reasons already mentioned above. We first split the data into a training and test sets (see Section 4), then conducted a 5-fold cross-validation on the former, and subsequently, we tested the best model on the latter. Fig. 3 reports the model performances. GraphAge overall performance is quite competitive with AltumAge, showing in fact a slight improvement over the latter on the test set in our constrained compute setting (more on this later). In particular, the overall MAE (MSE) of GraphAge is 3̃.207 (2̃5.277) as opposed to 3̃.296 (2̃8.310) of AltumAge registering a modest improvement of 2.7% (10.71%) over the latter. Furthermore, we grouped all samples (in the test set) into age-specific groups and measured the model performance within each group. Fig. 3(b) and Fig. 3(a), illustrate the age error in different age (and sex) groups. We see similar but slightly higher values for MSE in female than male. The trend for MAE is similar across all age groups. A consistent observation across all models is a decline in performance with increasing age. For example, starting from an MSE of 1.53 in male babies aged 0, it grows incrementally to 10.24 for ages 0-20 and 21.95 for ages 20-45. This supports the claim that epigenetic noise increases as chronological age diverges from epigenetic age [3]. Fig. 3(d) demonstrates how both models predict epigenetic age in relation to true chronological age, showing that both are quite similar even in terms of age acceleration (i.e., the direction and value in which the predicted epigenetic age diverts from the chronological age.) on healthy datasets.
Additionally, as an interesting case study, we tested both GraphAge and AltumAge on unhealthy datasets, i.e., in this experiment, the unhealthy samples were considered as unseen test samples for both the models. While this analysis also revealed similar age acceleration across all age groups for both the models (Fig. 3(c)), there are indeed some interesting points that are worth-discussing as follows. For postmenopausal women with ovarian cancer, GraphAge shows, on average, a (slightly) higher age acceleration, i.e., more in the positive direction than AltumAge. To elaborate, for age group 45-55, AltumAge shows an age acceleration value of 0.670 while GraphAge registers a much higher value of 3.452 and for age group 55-65, the values are -2.821574 and -0.783119 respectively. So, for this disease, GraphAge in most cases predicts a higher age acceleration than AltumAge, which is expected in case of a disease (in general).
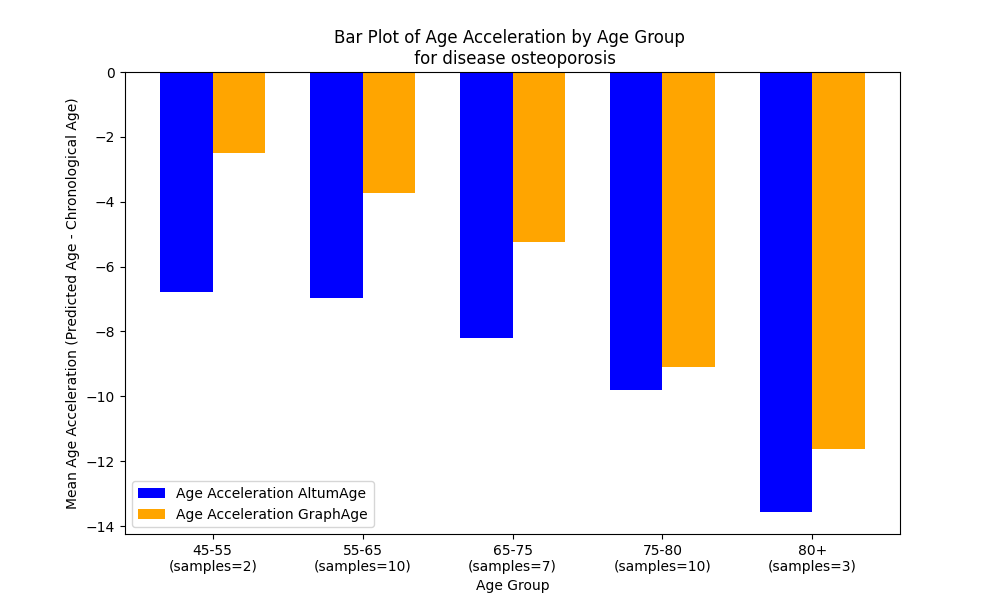
For the other two diseases, namely, schizophrenia and osteoporosis, a different phenomenon is noticed. In case of schizophrenia most samples are from age group 20-45. Here, the age acceleration values for both models are slightly negative: for AltumAge, it is -0.009141 and for GraphAge, -0.346602. This may be attributed to the fact that schizophrenia is a mental disorder and hence does not show much age acceleration. Finally for osteoporosis, for age group 45-55 (55-65), age acceleration values for AltumAge and GraphAge are -6.786402 (-6.978263) and -2.500751 (-3.728412), respectively. So, both models suggest a lack of age acceleration and GraphAge is more closer to zero. While this may sound surprising and counter-intuitive, this actually is inline with the current knowledgebase as no evidence for accelerated epigenetic age in blood of osteoporotic patients were found as reported in [44].
2.3 Resource Constraints
As has been alluded to above, we had to work in a resource constrained setting. To this end, Fig. 3(e) indicates that GraphAge performance is influenced by the threshold value (see Section 4) used to filter edges from the underlying graph. Lowering the threshold value, which includes more edges in the underlying graph structure, enhances performance, albeit at the cost of increased computational cost. Just to provide an idea, the time for training one epoch increases from 4̃ min to 8̃ min when we decrease the threshold value from 0.8 to 0.7. Informatively, as we work in a constrained computational setting, we could not continue lowering the threshold value beyond the value reported here. However, Fig. 3(e) promises further performance improvement if more computational power could be made available.
We further remark that, in parallel to performance improvement, the lowering of the threshold value also promises to provide more insightful interpretation as more edges are included in the underlying graph. As is evident from the Supplementary Materials (see Section Supplementary Materials), decreasing the threshold value from 0.75 to 0.70 increases the edges by 90% thereby potentially making the graph more informative.
2.4 Interpretation
2.4.1 Node Attributes Analysis
We identified important nodes, edges, and node attributes for each sample. Recall that, node attributes actually correspond to CpG Site information. We analyzed these important factors in detail as follows. First, we averaged the importance scores of node attributes across all samples to demonstrate our model’s positional awareness through its feature importance (Fig. 4(a)). From the mean importance, we can see that methylation is highly significant as expected. Additionally, the next base pair of all CpG sites, the characteristics of being in a CpG island (CPG_ISLAND) and the starting and ending position of the island (start_pos_of_ISLAND, end_pos_of_ISLAND) along with its length (CPG_ISLAND_LEN) are crucial factors according to our analysis. The association of CpG island with aging has also been found in various studies in the literature (e.g., [45, 46, 47]) and variations in the length thereof are shown to influence gene regulation complexity and evolutionary mechanisms [48], which in turn can influence aging [49, 14]. Relevantly, CpG islands are often located near the promoters of genes so their starting and ending positions are more informative [50].
Our analysis also reveals that the base pair adjacent to a CpG site (Next_Base_C, Next_Base_A and Next_Base_T) also plays a significant role in the aging process. This may be attributed to the fact that the flanking sequence (the sequence adjacent to a CpG site) can influence its likelihood of being methylated, suggesting that the surrounding sequence directly impacts methylation dynamics [51] and hence, aging. We additionally found that Cytosine (C) next to a CpG site (Next_Base_C) has a greater influence on aging than Adenine (A) or Thymine (T) (Next_Base_A, Next_Base_T). This seems interesting as Gao et. al. [52] recently showed that the enzyme DNMT3A (DNMT3B) prefers to methylate CpG sites followed by Cytosine or Thymine (Guanine or Adenine), with Cytosine (Guanine) being more influential than Thymine (Adenine). So, GraphAge was able to capture the importance of Cytosine next to a CpG site accurately. Informatively, the results reported in Fig. 4(a) is for threshold value 0.70. We also provided results with threshold value 0.75 in the Supplementary Materials Section (Fig. 9(a)).


+
2.4.2 Methylation Regulated Networks and subnetworks
We determined the importance of nodes and edges for each sample data point. We then divided the samples into age groups (the same age groups used during testing) and averaged the importance of the samples in each age group. We eliminated all nodes having zero importance and all low-importance edges (i.e., having scores less than 0.1). Following this procedure we identified subnetworks of important (connected) CpG sites, which we termed as Methylation Regulated Networks (MRN). The rationale behind this name is that methylation regulates gene expression, and these important sites work together through co-methylation, forming a network that contributes significantly to the aging process. We generated these graphs for all age groups and identified all subnetworks within the MRN that contain more than a specific number (in particular, 10) of CpG sites. Fig. 5(a) shows a single segment of our entire graph from age group 20-45 representing a MRN. All the MRNs and subnetworks in the MRN with more than 10 CpG_sites (segments) of each age group can be found at [53]. These MRNs (along with identified subnetworks therein) provide us with a clearer view to visually see the relationships among CpG sites for further meaningful analysis. A number of such analyses (non-exhaustive though) are reported in the rest of this section.


The directionality of the MRNs provides interesting insights (Fig. 6). For example, the methylation event from site cg04711324 to site cg27508071 seems to be important as it is influenced by subsequent changes in sites cg19250907, cg26511075 and others, creating a chain reaction. However, the reverse (cg04711324 to cg27508071) does not necessarily hold the same importance. This directional influence underlines the complexity and interconnected nature of methylation regulation within the network. Notably, other models in the literature, including AltumAge, are unable to capture this level of complexity and interconnected relationships.
2.4.3 Pathway analyses
We separated the genes of each MRN for each age group based on whether the nodes are hypo- or hypermethylating with the progression of age. We then performed pathway analysis using Enrichr [41, 42, 43] for these two types of genes separately. Fig. 5(b) and Fig. 5(c) present the pathway analysis of the hypermethylating and hypomethylating genes, respectively, from the subnetwork in Fig. 5(a). From Fig. 5(b), we can see that the genes under consideration belong to the Cardiac Muscle Contraction pathway, which is crucial for aging and becomes hypermethylating with the progression of age, thereby decreasing gene expression. This is interesting as vascular disease is influenced by hypermethylation [54, 55] and since cardiac muscle is known to change with aging [56].
A similar analysis reveals that the hypomethylating genes under consideration belong to the Ovarian Steroidogenesis pathway (Fig. 5(c)) thereby identifying it as a significant pathway in aging, which, with age, gets hypomethylating resulting in increased gene expression. This seems interesting as a recent study focused on children associated hypomethylation in several genes (e.g., CYP11A1, CYP19A1) with steroidogenesis [57]. An earlier study also associated aging-related DNA methylation (dominantly, hypomethylation) patterns in peripheral blood with ovarian cancer [58].
At this point a brief discussion on a unique analytical strength of GraphAge is in order. Other models like AltumAge can also conduct pathway analyses, albeit with an important distinction in respect to GraphAge as follows. In AltumAge, the pathways are selected based only on the ‘important’ CpG sites identified through some feature selection mechanism (e.g., SHAP values), without any consideration regarding relations/interactions among them. Unlike its competitors, GraphAge on the other hand has the capability to consider such interactions/relations in addition to considering the importance score of the CpG sites, which has been demonstrated here.
2.4.4 Analyzing aging-related pathways
We investigated three aging-related pathways, namely, SIRT, mTOR, and AMPK [59, 60, 61], which were also investigated in [26] while interpreting AltumAge. Surprisingly, AltumAge could not establish any particular relevance with respect to two of them, namely, mTOR and SIRT. GraphAge, however, was able to identify highly contributing genes from the mentioned pathways. Below we briefly report the findings.
- mTOR pathway.
-
For this analysis, We got the gene set for mTOR pathway from [62]. GraphAge identified a number of its CpG sites (e.g., CpG sites located in genes TSC1 and PDPK1) as important in different age groups. In particular, CpG site cg14444710, located in gene PDPK1, was found to have the highest importance score for Age group 0 (importance score: 0.528059; 98.70th percentile), Age group 0-20 (importance score: 0.503974; 97.98th percentile), and Age group 20-45 (importance score: 0.451429; 91.79th percentile).
Similarly, CpG site cg19393006, located in gene TSC1, was found to have the highest importance score for Age group 45-55 (importance score: 0.515012; 94.15th percentile), Age group 55-65 (importance score: 0.565572; 91.49th percentile), Age group 65-75 (importance score: 0.569637; 90.44th percentile), Age group 75-80 (importance score: 0.588715; 86.23rd percentile), and Age group 80+ (importance score: 0.60006; 86.11th percentile).
- SIRT pathway.
-
For SIRT, we identified the corresponding gene set from [63]. GraphAge identified a number of its CpG sites (e.g., CpG sites located in MAPK4 and RELA as the most dominating ones in this context) as important in different age groups. We found CpG site cg26946769, located in gene MAPK4, to have the highest importance score in Age group 0 (importance score: 0.484208; 96.40th percentile) and Age group 45-55 (importance score: 0.618472; 98.07th percentile). On the other hand, CpG site cg18746357, located in RELA, was found to have the highest importance score for Age group 0-20 (importance score: 0.470072; 93.85th percentile), Age group 20-45 (importance score: 0.51333; 96.98th percentile), Age group 55-65 (importance score: 0.671955; 99.27th percentile), Age group 65-75 (importance score: 0.688102; 99.02th percentile), Age group 75-80 (importance score: 0.688684; 97.08th percentile), and Age group 80+ (importance score: 0.698615; 97.92th percentile).
- AMPK pathway.
-
Recall that, both the models found the third pathway, namely, AMPK, relevant and important, albeit with different explanation. AltumAge identified CpG site cg22461835, located in ADRA1A, as important (through SHAP-based analysis). However, GraphAge differs with this finding as follows. We collected the gene set for AMPK from [64] and in our analysis, GraphAge identified other genes to be of significant relevance, e.g., GNAS, TBC1D1, LEP. In particular, CpG site cg25268451, located in gene GNAS, was found to have the highest value in importance for Age group 0 (importance score: 0.524305; 98.45th percentile) and CpG site cg25608041, located in TBC1D1, stood out in Age group 0-20 (importance score: 0.520926; 99.44th percentile). On the other hand, CpG site cg19594666, located in gene LEP, was found to have the highest value in importance for Age group 20-45 (importance score: 0.498691; 96.04th percentile), Age group 45-55 (importance score: 0.615761; 97.85th percentile), Age group 55-65 (importance score: 0.634677; 95.24th percentile), Age group 65-75 (importance score: 0.638405; 93.71th percentile), Age group 75-80 (importance score: 0.671997; 92.46th percentile), and Age group 80+ (importance score: 0.675434; 92.77th percentile).
- Genes in these pathways.
-
Before concluding this section, we briefly remark on some dominating genes (according to GraphAge interpretation) from these three pathways regarding their association with respect to aging. We observed in our analysis that TSC1 and PDPK1 were repeated more times than others for mTOR pathway, while RELA and LEP were repeated more times for the other two pathways. Now, TSC1 upregulation in senescent fibroblasts is associated with aging-related changes [65]. PDPK1 has been found highly relevant for human longevity [66]. On the other hand, in adult humans of different body weight, serum leptin (LEP) gradually declines during aging [67]. Finally, expression of NF-KB subunits (such as RELA) has been correlated with age in [68]. Also, we remark that, during the growth stage from 0 to 20 years, BC1D1, the most dominant one among the AMPK pathway genes (according to our analysis), plays a role in regulating cell growth and differentiation [69]. Further to above discussion, there are multiple studies on mice that linked these genes with aging (please refer to Section More on the identified genes of Supplementary Section for a brief discussion).
2.4.5 Temporal Analysis
We conducted temporal analyses along multiple dimensions and tried to unearth some important insights. Below we briefly present our findings.
- Analysis on Node Attributes.
-
We examined the importance of each node attribute throughout the aging process (Fig. 4(b)). We observe that the CpG related information (CPG_ISLAND, CPG_ISLAND_LEN, start_pos_of_ISLAND and end_pos_of_ISLAND) become increasingly important, particularly age 30 onward. This pattern is in line with the findings of different studies (e.g., [45, 46, 47]) in the literature that were carried out on ‘young’ subjects (e.g., age range 30 and above). A closer look in Fig. 4(b) in the region before age 30, reveals further interesting insight. During birth and infancy, various information about CpG Island also shows high importance. But subsequently, this changes, i.e., importance score slowly decreases, till the age is around 30. So, this age range of 5-30 could be investigated further, particularly from a biological point of view. Informatively, we notice the same pattern for flanking sequence, i.e., the sequence adjacent to a CpG site (Next_Base_A, Next_Base_T). Informatively, the results reported in Fig. 4(b) is for threshold value 0.70. We also provided results with threshold value 0.75 in the Supplementary Materials Section (Fig. 9(b)).
- Analysis on CpG sites and associated genes.
-
We conducted another temporal analysis on the importance of CpG sites (i.e., the nodes) and their associated genes, demonstrating how the role of each CpG site varies with age. Fig. 8(a) shows the top 10 CpG sites and their associated genes that exhibit an upward trend in importance, while Fig. 8(b) depicts the top 10 sites with a downward trend. As shown in Fig. 8(c), some CpG sites’ roles do not vary significantly with age.
- Analyzing hypomethylating genes.
-
We categorized the previously mentioned hypomethylating genes into two groups based on whether the importance score of the corresponding CpG sites are increasing or decreasing according to our temporal analysis and found some interesting insight. For example, our pathway analysis revealed that the importance of the JAK-STAT pathway is increasing (Fig. 8(d)) and that of the ovarian steroidogensis pathway is decreasing (Fig. 8(e)). Now, increasing JAK-STAT signaling in adulthood is known to increase levels of inflammatory cells in aging muscle tissue [70] and there are studies that have linked these two pathways together (e.g., [71, 72]). Also, recall that the ovarian steroidogenesis pathway was found as a significant pathway with respect to aging in our earlier analysis (Section 2.4.3). Thus our finding that for these two linked pathways that while one becomes more important the other becomes less, could be an interesting addition to the current knowledge base, which of course necessitates further biological validation.
- Analyzing hypermethylating genes.
-
We also repeat the above analysis for hypermethylating genes.In this case, for example, We found that the importance of Neuroactive Ligand-Receptor Interaction pathway is increasing (Fig. 8(f)) while that of the calcium signaling pathway is decreasing (Fig. 8(g)). Both of these pathways are shown to have association with aging (e.g., [73, 74]) and there are evidences in the literature regarding links between the two (e.g., [75, 76]).


2.4.6 Visualizing temporal aging signal
Before concluding this section a brief discussion on the visualization of the temporal signals is in order. We have integrated this “temporal aging signal” into our MRN images (e.g., Fig. 5(a) and Fig. 6) using color coding: green circles are used for increasing importance and yellow for decreasing importance. This visualization provides researchers with an intuitive understanding of how sites interact and influence each other’s importance. As illustrated in Fig. 5(a), many yellow-circled (decreasing importance) sites are directly connected to green-circled (increasing importance) sites, along with other annotations that help elucidate the complex relationships among different sites. While AltumAge also attempted a similar analysis by introducing interaction values (leveraging SHAP importance) to understand interactions, GraphAge, with its structural information provides a broader and more comprehensive view of these relationships through MRNs.
3 Conclusion
GraphAge has been able to predict age by utilizing all available information and leveraging the GNN explainer, we gained various insights into how CpG sites interact and how their importance change with the progression of age through the temporal analysis. We are able to identify pathways significant for aging. We also analysed the importance of some well known aging-related pathway gene in our model’s analysis. Moreover We observe how the importance of node attributes, such as, various biological information of CpG sites, influences the aging process. We also noted how their importance varies with age.
Currently, most research is fragmented in the sense that different types of clocks, such as, transcriptomic clock, epigentic clock etc. are using different phases of the same process as input. But creating proteins from gene expression regulated by methylation is a connected process. Thus, if all these information about an individual were available, we could utilize them leveraging the power of GraphAge to understand the inner mechanisms of this complex process comprehensively. So, GraphAge can potentially be the first benchmark for a multimodal model which can incorporate (and meaningfully handle) various information about CpG sites, gene expression, DNA sequence mutation etc. as nodes and interaction among these as edges. This could bring us closer to understanding the true nature of aging.
We also like to remark that our method of CpG site selection was based on AltumAge [26]. But these sites do not include any sites from X and Y chromosomes, inclusion whereof may unearth further insight, particularly with respect to sex. Also we would point out that our environment was very constraint so the peak of it’s potential was not achieved. Thus, if we can lift the restriction in both dimensions- compute power and data- GraphAge promises to unleash its true potential in taking us as close as we can get to the fountain of youth.
4 Methods
4.1 Data collection
Datasets from NCBI [77] and EBI [78] were used. Datasets were in two different databases - Gene Expression Omnibus (GEO) and Array Express. Because Gene expression patterns are tissue dependent, a tissue type (blood) was selected. They contain both healthy (3707) and unhealthy samples (624). Only healthy data points were used for model training and testing. Among the unhealthy samples, we have postmenopausal women with ovarian cancer (266), schizophrenia (326) and osteoporosis (32).
4.2 Data preprocessing
Missing values were imputed with K-nearest neighbors (with ). The dataset were created using two different technologies. Therefore, they were not compatible. To fix this issue, a normalization method called Beta-mixture quantile normalization (BMIQ) was used [79].
4.3 Experimental setup
We trained the model on healthy blood tissue datasets of 3707 samples where we first split the data into a test data of 756, i.e., 20% of the data and the rest where used for 5 fold cross validation. With the final model, we experimented to see the performance of the models in 8 age groups, namely, 0, 0-20, 20-45, 45-55, 55-65, 65-75, 75-80 and 80+ to examine how they performed in various phases of life. Middle ages were more segmented to see how changes occur in those phases of life.
4.4 Evaluation Metrics
As this is a regression task, we used Mean Absolute Error (MAE) and Mean Squared Error (MSE) as our main evaluation metric. MSE measures the average of the squares of the errors, giving more weight to larger errors and thus being useful for identifying models that produce significant errors. MAE measures the average magnitude of errors in a set of predictions, without considering their direction, providing a clear indication of the average error and being less sensitive to outliers compared to MSE. Based on prior literature, we also used another metric, age acceleration which is defined as predicted age minus the real age, to understand the direction and value in which the predicted epigenetic age diverts from chronological age.
4.5 Graph Construction
In our graph, nodes are the CpG sites and edges are their relationships. Following the structure of AltumAge [26], we selected CpG sites that were common across all types of methylation data platforms. The structural information for these CpG sites was obtained from the public website NCBI GEO’s supplementary file [38]. Since the information of distance and position is chromosome specific, CpG site information was prepared based on their chromosomal location, ensuring that their positional and distance information were chromosome-specific.
For our model, nodes in the graph included the following attributes:
-
•
Methylation beta values for each CpG site.
-
•
Boolean value for being inside a CpG island (CpG islands are long sequences of Cytosine and Guanine).
-
•
Length of the CpG island.
-
•
One-hot encoding of the next base pair (three such base pair information available).
-
•
Starting base pair position of the island if it is an island, else 0, normalized.
-
•
Ending base pair position of the island if it is an island, else 0, normalized.
-
•
Normalized distance from transcription start site; null values are given 1 to indicate they are the farthest.
-
•
Map_Info, which is the position of the CpG site for both island and non-island sites, is also normalized and added to the node attribute.
The most crucial part of the formulation is encoding the relationships among the edges. Edge features are:
-
•
Co-methylation value among two CpG sites, using methylation values of CpG sites from training data.
-
•
Boolean value if two CpG sites are on the same chromosome.
-
•
Boolean value if two CpG sites are of the same gene.
We applied three thresholds for edge filtering:
-
•
A universal threshold to filter all edges.
-
•
A lower threshold for edges on the same chromosome (Secondary Threshold). We have taken this to be 0.2 lower than the universal threshold.
-
•
A distance-based threshold within the same chromosome to allow even lower co-methylation edges to be included if they are closer (Tertiary Threshold). We have taken this to be 0.4 lower than the universal threshold.
The rationale behind using three thresholds is based on the influence of closer CpG sites, which tend to have a stronger effect on co-methylation [30]. The concept of distance is applicable only within the same chromosomes. This approach allows for more flexibility in selecting edges that are closer but may have slightly lower co-methylation values. These parameters must be chosen carefully, balancing speed and accuracy requirements.
4.6 Architecture and Training
Our model comprises of GNN layers followed by a fully connected layer. So after formulating the graph, we used DataLoaders from PyTorch[80] to create data loaders. The graph was fed into a Graph Neural Network (GNN) in a stochastic manner. We chose the Principal Neighborhood Aggregation (PNA) convolutional [39] layer for our GNN because of multiple aggregators to capture diverse aspects in graphs. After the GNN layer, the output was passed through a fully connected layer to obtain the final age prediction.
We used 5-fold cross-validation to find the best model and then tested the best model on an test dataset. For other models, we followed exactly the same procedure for a fair comparison.
4.7 Interpreting the Network
We used the GNN explainer [37] to interpret the model. Two types of explanations were generated:
-
•
Importance of each node attribute.
-
•
Importance of nodes and edges to identify connected subnetworks that work in conjunction.
GNN explainer gives us individual sample explanations which we save. We take these individual sample importance of each site and average them based on the age groups that we used for testing. We then create a graphical representation of the average node and edge importance for each age group. We also color-coded these subnetworks for visualization. Importantly, we generated individual explanations for each sample and averaged the explanations across certain age groups to provide a more comprehensive understanding.
4.8 Color Code for Graph
We employed vizgraph[40] for constructing visualizations:
-
•
Red node: hypomethylating CpG sites. With age, the methylation value decreases, and methylation upregulates gene expression.
-
•
Blue node: hypermethylating CpG sites. With age, the methylation value increases, and methylation downregulates gene expression.
-
•
Green circle around node: the importance of that particular CpG site increases with age.
-
•
Yellow circle around node: the importance of that particular CpG site decreases with age.
4.9 Graph Annotation
We annotated the graph for better understanding
4.9.1 Node annotation
The nodes contain:
-
•
CpG_site name
-
•
gene name
-
•
distance from Transcription start site
-
•
importance of the CpG_site from GNN explainer
-
•
hyper- or hypomethylation and it’s value
-
•
Chromosome number
4.9.2 Edge annotation
-
•
comethylation value
-
•
importance of the edge i.e. relationship from GNN explainer
4.10 Importance Analysis
After using the GNN explainer, we analyzed the importance of node attributes by averaging them across all samples. We also plotted the importance of these attributes over different age groups to observe their temporal patterns. For node and edge importance, we divided all samples into various age groups and averaged the importance within each group. We then eliminated nodes with zero importance and edges with low importance. The resulting subnetworks were visualized using Graphviz. We also created individual visualizations for subnetworks that contained a certain number of CpG sites. Additionally, we identified genes from these subnetworks and categorized them based on whether they were hypo- or hypermethylating. We performed Enrichr analysis [41, 42, 43] on these two groups of genes separately.
Furthermore, we used linear regression to find the slope of each node’s importance with respect to age. We identified the top 10 nodes with the most positive slopes as upward trending and the top 10 nodes with the most negative slopes as downward trending. Nodes with small slope values were considered to have no significant trend.
4.11 Code, Environment and Availability
We used kaggle free tier version using the GPU P100. We have used most implementation from pytorch geometric library [80]. All the datasets and other information are all present in the following notebooks.
Our code for predicting and compiling explanation: https://www.kaggle.com/code/sakibahmed91/graphage-final-version-for-result-and-explanation
For analysing the explanation : https://www.kaggle.com/code/salehsakibahmed/graph-age-exaplanation-analysis
All codes and result compilation are available here: https://github.com/bojack-horseman91/GraphAge
References
- \bibcommenthead
- Jylhävä et al. [2017] Jylhävä, J., Pedersen, N.L., Hägg, S.: Biological age predictors. EBioMedicine 21, 29–36 (2017)
- López-Otín et al. [2013] López-Otín, C., Blasco, M.A., Partridge, L., Serrano, M., Kroemer, G.: The hallmarks of aging. Cell 153(6), 1194–1217 (2013)
- Lu et al. [2023] Lu, Y.R., Tian, X., Sinclair, D.A.: The information theory of aging. Nature aging 3(12), 1486–1499 (2023)
- Tarkhov et al. [2022] Tarkhov, A.E., Denisov, K.A., Fedichev, P.O.: Aging clocks, entropy, and the limits of age-reversal. BioRxiv, 2022–02 (2022)
- Fahy et al. [2019] Fahy, G.M., Brooke, R.T., Watson, J.P., Good, Z., Vasanawala, S.S., Maecker, H., Leipold, M.D., Lin, D.T., Kobor, M.S., Horvath, S.: Reversal of epigenetic aging and immunosenescent trends in humans. Aging cell 18(6), 13028 (2019)
- Bell et al. [2011] Bell, J.T., Pai, A.A., Pickrell, J.K., Gaffney, D.J., Pique-Regi, R., Degner, J.F., Gilad, Y., Pritchard, J.K.: Dna methylation patterns associate with genetic and gene expression variation in hapmap cell lines. Genome biology 12, 1–13 (2011)
- Jaenisch and Bird [2003] Jaenisch, R., Bird, A.: Epigenetic regulation of gene expression: how the genome integrates intrinsic and environmental signals. Nature genetics 33(3), 245–254 (2003)
- Ladd-Acosta [2015] Ladd-Acosta, C.: Epigenetic signatures as biomarkers of exposure. Current environmental health reports 2, 117–125 (2015)
- Marsit [2015] Marsit, C.J.: Influence of environmental exposure on human epigenetic regulation. Journal of Experimental Biology 218(1), 71–79 (2015)
- Gomes and Pelosi [2013] Gomes, M.V.d.M., Pelosi, G.G.: Epigenetic vulnerability and the environmental influence on health. Experimental Biology and Medicine 238(8), 859–865 (2013)
- McKay and Mathers [2011] McKay, J.A., Mathers, J.C.: Diet induced epigenetic changes and their implications for health. Acta physiologica 202(2), 103–118 (2011)
- Godfrey et al. [2015] Godfrey, K.M., Costello, P.M., Lillycrop, K.A.: The developmental environment, epigenetic biomarkers and long-term health. Journal of developmental origins of health and disease 6(5), 399–406 (2015)
- Obata et al. [2015] Obata, Y., Furusawa, Y., Hase, K.: Epigenetic modifications of the immune system in health and disease. Immunology and cell biology 93(3), 226–232 (2015)
- Holzscheck et al. [2021] Holzscheck, N., Falckenhayn, C., Söhle, J., Kristof, B., Siegner, R., Werner, A., Schössow, J., Jürgens, C., Völzke, H., Wenck, H., et al.: Modeling transcriptomic age using knowledge-primed artificial neural networks. npj Aging and Mechanisms of Disease 7(1), 15 (2021)
- Peters et al. [2015] Peters, M.J., Joehanes, R., Pilling, L.C., Schurmann, C., Conneely, K.N., Powell, J., Reinmaa, E., Sutphin, G.L., Zhernakova, A., Schramm, K., et al.: The transcriptional landscape of age in human peripheral blood. Nature communications 6(1), 1–14 (2015)
- Krištić et al. [2014] Krištić, J., Vučković, F., Menni, C., Klarić, L., Keser, T., Beceheli, I., Pučić-Baković, M., Novokmet, M., Mangino, M., Thaqi, K., et al.: Glycans are a novel biomarker of chronological and biological ages. Journals of Gerontology Series A: Biomedical Sciences and Medical Sciences 69(7), 779–789 (2014)
- Mijakovac et al. [2022] Mijakovac, A., Frkatović, A., Hanić, M., Ivok, J., Martinić Kavur, M., Pučić-Baković, M., Spector, T., Zoldoš, V., Mangino, M., Lauc, G.: Heritability of the glycan clock of biological age. Frontiers in cell and developmental biology 10, 982609 (2022)
- Boks et al. [2009] Boks, M.P., Derks, E.M., Weisenberger, D.J., Strengman, E., Janson, E., Sommer, I.E., Kahn, R.S., Ophoff, R.A.: The relationship of dna methylation with age, gender and genotype in twins and healthy controls. PloS one 4(8), 6767 (2009)
- Richardson [2003] Richardson, B.: Impact of aging on dna methylation. Ageing research reviews 2(3), 245–261 (2003)
- Bocklandt et al. [2011] Bocklandt, S., Lin, W., Sehl, M.E., Sánchez, F.J., Sinsheimer, J.S., Horvath, S., Vilain, E.: Epigenetic predictor of age. PloS one 6(6), 14821 (2011)
- Hannum et al. [2013] Hannum, G., Guinney, J., Zhao, L., Zhang, L., Hughes, G., Sadda, S., Klotzle, B., Bibikova, M., Fan, J.-B., Gao, Y., et al.: Genome-wide methylation profiles reveal quantitative views of human aging rates. Molecular cell 49(2), 359–367 (2013)
- Galkin et al. [2021] Galkin, F., Mamoshina, P., Kochetov, K., Sidorenko, D., Zhavoronkov, A.: Deepmage: a methylation aging clock developed with deep learning. Aging and disease 12(5), 1252 (2021)
- Levy et al. [2020] Levy, J.J., Titus, A.J., Petersen, C.L., Chen, Y., Salas, L.A., Christensen, B.C.: Methylnet: an automated and modular deep learning approach for dna methylation analysis. BMC bioinformatics 21, 1–15 (2020)
- Ying et al. [2024] Ying, K., Liu, H., Tarkhov, A.E., Sadler, M.C., Lu, A.T., Moqri, M., Horvath, S., Kutalik, Z., Shen, X., Gladyshev, V.N.: Causality-enriched epigenetic age uncouples damage and adaptation. Nature aging 4(2), 231–246 (2024)
- Horvath [2013] Horvath, S.: Dna methylation data involving healthy (non-cancer) tissue (2013)
- Lapierre et al. [2022] Lapierre, L.R., Ritambhara, S., et al.: A pan-tissue dna-methylation epigenetic clock based on deep learning. NPJ Aging and Mechanisms of Disease 8(1) (2022)
- Lundberg and Lee [2017] Lundberg, S.M., Lee, S.-I.: A unified approach to interpreting model predictions. Advances in neural information processing systems 30 (2017)
- Relton and Davey Smith [2015] Relton, C.L., Davey Smith, G.: Mendelian randomization: applications and limitations in epigenetic studies. Taylor & Francis (2015)
- Zou and Hastie [2005] Zou, H., Hastie, T.: Regularization and variable selection via the elastic net. Journal of the Royal Statistical Society Series B: Statistical Methodology 67(2), 301–320 (2005)
- Affinito et al. [2020] Affinito, O., Palumbo, D., Fierro, A., Cuomo, M., De Riso, G., Monticelli, A., Miele, G., Chiariotti, L., Cocozza, S.: Nucleotide distance influences co-methylation between nearby cpg sites. Genomics 112(1), 144–150 (2020)
- Genereux et al. [2005] Genereux, D.P., Miner, B.E., Bergstrom, C.T., Laird, C.D.: A population-epigenetic model to infer site-specific methylation rates from double-stranded dna methylation patterns. Proceedings of the National Academy of Sciences 102(16), 5802–5807 (2005)
- Wu et al. [2019] Wu, X., Wei, Z., Chen, K., Zhang, Q., Su, J., Liu, H., Zhang, L., Meng, J.: m6acomet: large-scale functional prediction of individual m 6 a rna methylation sites from an rna co-methylation network. BMC bioinformatics 20, 1–12 (2019)
- Shannon et al. [2003] Shannon, P., Markiel, A., Ozier, O., Baliga, N.S., Wang, J.T., Ramage, D., Amin, N., Schwikowski, B., Ideker, T.: Cytoscape: a software environment for integrated models of biomolecular interaction networks. Genome research 13(11), 2498–2504 (2003)
- Zhou et al. [2020] Zhou, J., Cui, G., Hu, S., Zhang, Z., Yang, C., Liu, Z., Wang, L., Li, C., Sun, M.: Graph neural networks: A review of methods and applications. AI open 1, 57–81 (2020)
- Sonawane et al. [2017] Sonawane, A.R., Platig, J., Fagny, M., Chen, C.-Y., Paulson, J.N., Lopes-Ramos, C.M., DeMeo, D.L., Quackenbush, J., Glass, K., Kuijjer, M.L.: Understanding tissue-specific gene regulation. Cell reports 21(4), 1077–1088 (2017)
- Ong and Corces [2011] Ong, C.-T., Corces, V.G.: Enhancer function: new insights into the regulation of tissue-specific gene expression. Nature Reviews Genetics 12(4), 283–293 (2011)
- Ying et al. [2019] Ying, Z., Bourgeois, D., You, J., Zitnik, M., Leskovec, J.: Gnnexplainer: Generating explanations for graph neural networks. Advances in neural information processing systems 32 (2019)
- National Center for Biotechnology Information [2024] National Center for Biotechnology Information: NCBI GEO Dataset GPL8490. https://www.ncbi.nlm.nih.gov/geo/query/acc.cgi?acc=GPL8490. Accessed: 2024-07-18 (2024)
- Corso et al. [2020] Corso, G., Cavalleri, L., Beaini, D., Liò, P., Veličković, P.: Principal neighbourhood aggregation for graph nets. Advances in Neural Information Processing Systems 33, 13260–13271 (2020)
- Graphviz [2024] Graphviz: Graphviz. https://graphviz.org/. Accessed: 2024-07-18 (2024)
- Chen et al. [2013] Chen, E.Y., Tan, C.M., Kou, Y., Duan, Q., Wang, Z., Meirelles, G.V., Clark, N.R., Ma’ayan, A.: Enrichr: interactive and collaborative html5 gene list enrichment analysis tool. BMC bioinformatics 14, 1–14 (2013)
- Kuleshov et al. [2016] Kuleshov, M.V., Jones, M.R., Rouillard, A.D., Fernandez, N.F., Duan, Q., Wang, Z., Koplev, S., Jenkins, S.L., Jagodnik, K.M., Lachmann, A., et al.: Enrichr: a comprehensive gene set enrichment analysis web server 2016 update. Nucleic acids research 44(W1), 90–97 (2016)
- Xie et al. [2021] Xie, Z., Bailey, A., Kuleshov, M.V., Clarke, D.J., Evangelista, J.E., Jenkins, S.L., Lachmann, A., Wojciechowicz, M.L., Kropiwnicki, E., Jagodnik, K.M., et al.: Gene set knowledge discovery with enrichr. Current protocols 1(3), 90 (2021)
- NCBI GEO [2024] NCBI GEO: Gene Expression Omnibus: GSE99624. Accessed: 2024-07-27 (2024). https://www.ncbi.nlm.nih.gov/geo/query/acc.cgi?acc=GSE99624
- Issa [2000] Issa, J.: Cpg-island methylation in aging and cancer. Current topics in microbiology and immunology 249, 101–118 (2000)
- Toyota and Issa [1999] Toyota, M., Issa, J.-P.J.: Cpg island methylator phenotypes in aging and cancer. In: Seminars in Cancer Biology, vol. 9, pp. 349–357 (1999). Elsevier
- Christensen et al. [2009] Christensen, B.C., Houseman, E.A., Marsit, C.J., Zheng, S., Wrensch, M.R., Wiemels, J.L., Nelson, H.H., Karagas, M.R., Padbury, J.F., Bueno, R., et al.: Aging and environmental exposures alter tissue-specific dna methylation dependent upon cpg island context. PLoS genetics 5(8), 1000602 (2009)
- Elango and Yi [2011] Elango, N., Yi, S.V.: Functional relevance of cpg island length for regulation of gene expression. Genetics 187(4), 1077–1083 (2011)
- Perez-Gomez et al. [2020] Perez-Gomez, A., Buxbaum, J.N., Petrascheck, M.: The aging transcriptome: read between the lines. Current opinion in neurobiology 63, 170–175 (2020)
- Illingworth and Bird [2009] Illingworth, R.S., Bird, A.P.: Cpg islands–‘a rough guide’. FEBS letters 583(11), 1713–1720 (2009)
- Santoni [2021] Santoni, D.: The impact of flanking sequence features on dna cpg methylation. Computational Biology and Chemistry 92, 107480 (2021)
- Gao et al. [2020] Gao, L., Emperle, M., Guo, Y., Grimm, S.A., Ren, W., Adam, S., Uryu, H., Zhang, Z.-M., Chen, D., Yin, J., et al.: Comprehensive structure-function characterization of dnmt3b and dnmt3a reveals distinctive de novo dna methylation mechanisms. Nature communications 11(1), 3355 (2020)
- bojack horseman91 [2024] bojack-horseman91: GraphAge: Explanation Compilation. https://github.com/bojack-horseman91/GraphAge/tree/8f66381390c53f2c666843c7ad1c7b33eada41cd/Explanation%20compilation. Accessed: 2024-07-18 (2024)
- Xu et al. [2021] Xu, H., Li, S., Liu, Y.-S.: Roles and mechanisms of dna methylation in vascular aging and related diseases. Frontiers in Cell and Developmental Biology 9, 699374 (2021)
- Boovarahan et al. [2022] Boovarahan, S.R., Ali, N., AlAsmari, A.F., Alameen, A.A., Khan, R., Kurian, G.A.: Age-associated global dna hypermethylation augments the sensitivity of hearts towards ischemia-reperfusion injury. Frontiers in Genetics 13, 995887 (2022)
- Lakatta [1987] Lakatta, E.G.: Cardiac muscle changes in senescence. Annual review of physiology 49(1), 519–531 (1987)
- Vanhorebeek et al. [2023] Vanhorebeek, I., Coppens, G., Güiza, F., Derese, I., Wouters, P.J., Joosten, K.F., Verbruggen, S.C., Berghe, G.: Abnormal dna methylation within genes of the steroidogenesis pathway two years after paediatric critical illness and association with stunted growth in height further in time. Clinical Epigenetics 15(1), 116 (2023)
- Teschendorff et al. [2009] Teschendorff, A.E., Menon, U., Gentry-Maharaj, A., Ramus, S.J., Gayther, S.A., Apostolidou, S., Jones, A., Lechner, M., Beck, S., Jacobs, I.J., et al.: An epigenetic signature in peripheral blood predicts active ovarian cancer. PloS one 4(12), 8274 (2009)
- Zhao et al. [2020] Zhao, L., Cao, J., Hu, K., He, X., Yun, D., Tong, T., Han, L.: Sirtuins and their biological relevance in aging and age-related diseases. Aging and disease 11(4), 927 (2020)
- Weichhart [2018] Weichhart, T.: mtor as regulator of lifespan, aging, and cellular senescence: a mini-review. Gerontology 64(2), 127–134 (2018)
- Burkewitz et al. [2014] Burkewitz, K., Zhang, Y., Mair, W.B.: Ampk at the nexus of energetics and aging. Cell metabolism 20(1), 10–25 (2014)
- Laboratory [2024] Laboratory, M.: mTOR Signaling Pathway. Accessed: 2024-07-29. https://maayanlab.cloud/Harmonizome/gene_set/mTOR+signaling+pathway/PID+Pathways
- QIAGEN [2024a] QIAGEN: Sirtuin Signaling Pathway. Accessed: 2024-07-29 (2024). https://geneglobe.qiagen.com/us/knowledge/pathways/sirtuin-signaling-pathway
- QIAGEN [2024b] QIAGEN: AMPK Signaling Pathway. Accessed: 2024-07-29 (2024). https://geneglobe.qiagen.com/us/knowledge/pathways/ampk-signaling
- Fellows et al. [2012] Fellows, A.D., Holly, A.C., Pilling, L.C., Melzer, D., Harries, L.W.: Age related changes in mtor-related gene expression in two primary human cell lines. Healthy Aging Res 1(3) (2012)
- Serbezov et al. [2019] Serbezov, D., Balabanski, L., Karachanak-Yankova, S., Vazharova, R., Nesheva, D., Hammoudeh, Z., Staneva, R., Mihaylova, M., Damyanova, V., Antonova, O., et al.: Pool-seq study of bulgarian centenarians highlights the relevance for human longevity of gene expression pathways. J Aging Sci (Brussels, Belgium) 7, 208–921 (2019)
- Isidori et al. [2000] Isidori, A.M., Strollo, F., Morè, M., Caprio, M., Aversa, A., Moretti, C., Frajese, G., Riondino, G., Fabbri, A.: Leptin and aging: correlation with endocrine changes in male and female healthy adult populations of different body weights. The Journal of Clinical Endocrinology & Metabolism 85(5), 1954–1962 (2000)
- Helenius et al. [1996] Helenius, M., Hänninen, M., Lehtinen, S.K., Salminen, A.: Aging-induced up-regulation of nuclear binding activities of oxidative stress responsive nf-kb transcription factor in mouse cardiac muscle. Journal of molecular and cellular cardiology 28(3), 487–498 (1996)
- National Center for Biotechnology Information [2024] National Center for Biotechnology Information: LEP leptin [Homo sapiens (human)]. U.S. National Library of Medicine. Accessed: 2024-07-29 (2024)
- Price et al. [2014] Price, F.D., Von Maltzahn, J., Bentzinger, C.F., Dumont, N.A., Yin, H., Chang, N.C., Wilson, D.H., Frenette, J., Rudnicki, M.A.: Inhibition of jak-stat signaling stimulates adult satellite cell function. Nature medicine 20(10), 1174–1181 (2014)
- Zareifard et al. [2023] Zareifard, A., Beaudry, F., Ndiaye, K.: Janus kinase 3 phosphorylation and the jak/stat pathway are positively modulated by follicle-stimulating hormone (fsh) in bovine granulosa cells. BMC Molecular and Cell Biology 24(1), 21 (2023)
- Wang et al. [2023] Wang, H., Feng, X., Wang, T., Pan, J., Zheng, Z., Su, Y., Weng, H., Zhang, L., Chen, L., Zhou, L., et al.: Role and mechanism of the p-jak2/p-stat3 signaling pathway in follicular development in pcos rats. General and Comparative Endocrinology 330, 114138 (2023)
- Ge [2023] Ge, R.: Retinol metabolism and neuroactive ligand-receptor interactions are key pathways involved in skeletal muscle stem cells (muscs) aging. Current Research in Medical Sciences 2(4), 17–23 (2023)
- Berridge [2016] Berridge, M.J.: Vitamin d, reactive oxygen species and calcium signalling in ageing and disease. Philosophical Transactions of the Royal Society B: Biological Sciences 371(1700), 20150434 (2016)
- Zheng and Poo [2007] Zheng, J.Q., Poo, M.-m.: Calcium signaling in neuronal motility. Annu. Rev. Cell Dev. Biol. 23(1), 375–404 (2007)
- Fang et al. [2021] Fang, X., Zeng, X., Wang, M., Qin, L., Tan, C., Wu, J.: Enrichment analysis of differentially expressed genes in chronic heart failure. Annals of Palliative Medicine 10(8), 9049056–9049056 (2021)
- National Center for Biotechnology Information [2024] National Center for Biotechnology Information: NCBI. https://www.ncbi.nlm.nih.gov/. Accessed: 2024-07-18 (2024)
- European Bioinformatics Institute [2024] European Bioinformatics Institute: EBI. https://www.ebi.ac.uk/. Accessed: 2024-07-18 (2024)
- Teschendorff et al. [2013] Teschendorff, A.E., Marabita, F., Lechner, M., Bartlett, T., Tegner, J., Gomez-Cabrero, D., Beck, S.: A beta-mixture quantile normalization method for correcting probe design bias in illumina infinium 450 k dna methylation data. Bioinformatics 29(2), 189–196 (2013)
- PyTorch Geometric [2024] PyTorch Geometric: PyTorch Geometric Documentation. https://pytorch-geometric.readthedocs.io/en/latest/index.html. Accessed: 2024-07-18 (2024)
- NCBI [2023] NCBI: TSC1 tuberous sclerosis 1 [Homo sapiens (human)]. Accessed: 2024-07-28 (2023). https://www.ncbi.nlm.nih.gov/gene/7248#summary
- Rao et al. [2021] Rao, Y.-Q., Zhou, Y.-T., Zhou, W., Li, J.-K., Li, B., Li, J.: mtorc1 activation in chx10-specific tsc1 knockout mice accelerates retina aging and degeneration. Oxidative Medicine and Cellular Longevity 2021(1), 6715758 (2021)
- Zhang et al. [2017] Zhang, H.-M., Diaz, V., Walsh, M.E., Zhang, Y.: Moderate lifelong overexpression of tuberous sclerosis complex 1 (tsc1) improves health and survival in mice. Scientific reports 7(1), 834 (2017)
- Reddy et al. [2009] Reddy, P., Adhikari, D., Zheng, W., Liang, S., Hämäläinen, T., Tohonen, V., Ogawa, W., Noda, T., Volarevic, S., Huhtaniemi, I., et al.: Pdk1 signaling in oocytes controls reproductive aging and lifespan by manipulating the survival of primordial follicles. Human molecular genetics 18(15), 2813–2824 (2009)
- Balaskó et al. [2014] Balaskó, M., Soós, S., Székely, M., Pétervári, E.: Leptin and aging: Review and questions with particular emphasis on its role in the central regulation of energy balance. Journal of chemical neuroanatomy 61, 248–255 (2014)
Supplementary Materials
Effect of change of threshold for filtering edges
Our paper includes all results from using threshold 0.7 but in Fig. 9 we show the results for threshold 0.75, secondary_threshold 0.73 and tertiary_threshold of 0.71. One other difference is that the number of epoch to train GNN explainer in this case was 150 while in the explanation of threshold 0.7 epoch was 100 due to longer training time. As can be observed from the figure, particularly in contrast with Fig. 4(b), although node attribute importance remains quite similar the edge importance scores change. We can see from Fig. 10 that by decreasing the threshold from 0.75 to 0.7, on an average for each age group, we see an increase of 812.75 (90.162%) in the number of edges. So by decreasing the threshold we are encoding more interactions/relationships into the graph structure thereby increasing the potential for a more comprehensive understanding of the complexities of aging while decoding (i.e., interpreting) it. Table 1 provides a detailed comparison in terms of MAE among GraphAge, AltumAge, and Horvath’s model including results for multiple threshold values of GraphAge. Also, Table 2 presents a comparison between GraphAge and AltumAge in different age groups.


More on the identified genes
There are multiple studies in the literature on mice that linked the identified important genes with aging. TSC1, a tumor suppressor gene [81], is shown to be associated with accelerated retinal aging in knockout mice [82]. Moderate lifelong overexpression of TSC1 has been demonstrated to improve health and survival in mice [83]. PDPK1 signaling has great influence on determining the reproductive aging and the length of reproductive life in females [84]. On the other hand, aging affects leptin (LEP) actions differently. There is a decline in hypermetabolic responses but increased sensitivity in lean rats. Older rats are more prone to obesity-induced leptin resistance, while calorie restriction enhances leptin responsiveness, particularly in older rats [85].
More on the Dataset
These are all the dataset that we used in our entire process. For clarity of user we have added a small description for each of the dataset.
-
[label=]
-
•
E-GEOD-51388: Blood samples taken longitudinally from monozygotic twins. The platform used was Illumina’s Infinium 450k Human Methylation Beadchip.
-
•
E-GEOD-52588: Blood samples from subjects with or without Down syndrome. The platform used was Illumina’s Infinium 450k Human Methylation Beadchip.
-
•
E-GEOD-53128: Whole blood samples. The platform used was Illumina’s Infinium 450k Human Methylation Beadchip.
-
•
E-GEOD-53740: Blood samples from progressive supranuclear palsy patients, frontotemporal dementia patients, and healthy controls. The platform used was Illumina’s Infinium 450k Human Methylation Beadchip.
-
•
E-GEOD-54399: Cord blood and placenta. All ages were encoded as zero age. The platform used was Illumina’s Infinium 450k Human Methylation Beadchip.
-
•
E-GEOD-54690: Blood samples from subjects with or without dietary flavanol supplementation. The platform used was Illumina’s Infinium 450k Human Methylation Beadchip.
-
•
E-GEOD-56553: Peripheral mononuclear blood cells of asthmatic patients. The platform used was Illumina’s Infinium 450k Human Methylation Beadchip.
-
•
E-GEOD-57484: Whole blood samples from normal and obese children. The platform used was Illumina’s Infinium 27k Human Methylation Beadchip.
-
•
E-GEOD-58045: Whole blood samples. The platform used was Illumina’s Infinium 27k Human Methylation Beadchip.
-
•
E-GEOD-59509: Whole blood, saliva, menstrual blood, vaginal swab, and semen samples. The platform used was Illumina’s Infinium 450k Human Methylation Beadchip.
-
•
E-GEOD-59592: Blood from infants exposed to varying degrees of aflatoxin B1. The platform used was Illumina’s Infinium 450k Human Methylation Beadchip.
-
•
E-GEOD-62219: Longitudinal peripheral blood leukocyte samples from infants. The platform used was Illumina’s Infinium 450k Human Methylation Beadchip.
-
•
E-GEOD-64495: Whole blood from subjects with or without developmental disorder syndrome X. Non-healthy patient samples were separated for further analysis and not included in training, validation, or testing. The platform used was Illumina’s Infinium 450k Human Methylation Beadchip.
-
•
E-GEOD-64940: Cord blood samples from newborns. All samples were encoded as zero age. The platform used was Illumina’s Infinium 27k Human Methylation Beadchip.
-
•
E-GEOD-65638: Whole blood samples from twins. The platform used was Illumina’s Infinium 450k Human Methylation Beadchip.
-
•
E-GEOD-67444: Neonatal blood samples. All ages were encoded as zero age. The platform used was Illumina’s Infinium 450k Human Methylation Beadchip.
-
•
E-GEOD-67705: Blood samples from HIV+ and HIV- subjects. The platform used was Illumina’s Infinium 450k Human Methylation Beadchip.
-
•
E-GEOD-71245: Blood samples from different types of blood cells. The platform used was Illumina’s Infinium 450k Human Methylation Beadchip.
-
•
E-GEOD-71955: CD4+ and CD8+ T-cell samples from subjects with Graves’ disease or healthy controls. The platform used was Illumina’s Infinium 450k Human Methylation Beadchip.
-
•
E-GEOD-72338: Neutrophils and monocytes from patients with tuberculosis and household controls. The platform used was Illumina’s Infinium 450k Human Methylation Beadchip.
-
•
E-GEOD-77445: Whole blood samples from subjects with different stress levels. The platform used was Illumina’s Infinium 450k Human Methylation Beadchip.
-
•
E-GEOD-79056: Cord blood samples. The platform used was Illumina’s Infinium 450k Human Methylation Beadchip.
-
•
E-GEOD-83334: Whole blood and cord blood from newborns and infants measured longitudinally. The platform used was Illumina’s Infinium 450k Human Methylation Beadchip.
-
•
E-MTAB-2344: White blood cell samples in patients with stroke and/or obesity and healthy controls. The platform used was Illumina’s Infinium 27k Human Methylation Beadchip.
-
•
E-MTAB-2372: White blood cell samples from obese patients subject to two different diets. The platform used was Illumina’s Infinium 450k Human Methylation Beadchip.
-
•
GSE19711: Whole blood samples from patients with or without ovarian cancer. The platform used was Illumina’s Infinium 27k Human Methylation Beadchip.
-
•
GSE20236: Whole blood samples. The platform used was Illumina’s Infinium 27k Human Methylation Beadchip.
-
•
GSE20242: CD4+ T-cells and CD14+ monocytes samples. The platform used was Illumina’s Infinium 27k Human Methylation Beadchip.
-
•
GSE34257: Blood cord samples and whole blood samples from 9-month-old infants. The platform used was Illumina’s Infinium 27k Human Methylation Beadchip.
-
•
GSE36642: Blood mononuclear cell, human umbilical vascular endothelial cell, and placenta samples from monozygotic and dizygotic twins. The platform used was Illumina’s Infinium 27k Human Methylation Beadchip.
-
•
GSE37008: Peripheral blood mononuclear cell samples. The platform used was Illumina’s Infinium 27k Human Methylation Beadchip.
-
•
GSE41037: Whole blood samples in schizophrenia patients and healthy subjects. The platform used was Illumina’s Infinium 27k Human Methylation Beadchip.
-
•
GSE49904: Blood buffy coat samples. The platform used was Illumina’s Infinium 27k Human Methylation Beadchip.
-
•
GSE56606: CD14+ monocyte samples from monozygotic twins discordant for type 1 diabetes. The platform used was Illumina’s Infinium 27k Human Methylation Beadchip.
-
•
GSE57285: Whole blood samples from women with BRCA1 wild-type or mutants, and with or without breast cancer. The platform used was Illumina’s Infinium 27k Human Methylation Beadchip.
-
•
GSE69176: Umbilical cord blood samples from newborns. The platform used was Illumina’s Infinium 450k Human Methylation Beadchip.
-
•
GSE99624: Whole blood samples from osteoporotic and healthy control patients. The platform used was Illumina’s Infinium 450k Human Methylation Beadchip.
| Tissue name | AltumAge (trained on our dataset) | Horvath’s clock (trained on our dataset) | Horvath (off the shelf model) -used without training | AltumAge (off the shelf model) -used without training | GraphAge (Threshold: 0.80, Secondary: 0.79, Tertiary: 0.76) | GraphAge (Threshold: 0.75, Secondary: 0.74, Tertiary: 0.71) | GraphAge (Threshold: 0.7, Secondary: 0.68, Tertiary: 0.64) |
|---|---|---|---|---|---|---|---|
| Blood (Sample count: Train: 2361, Validation: 590, Test: 756) | 3.29 | 4.075 | 5.317 | 3.71 | 3.5 | 3.35 | 3.20 |
| Age Group | sex | GraphAge MAE | GraphAge MSE | number of samples | AltumAge MAE | AltumAge MSE |
|---|---|---|---|---|---|---|
| 0 | M | 0.20 | 1.53 | 83 | 0.31 | 4.18 |
| 0 | F | 0.19 | 0.54 | 68 | 0.25 | 0.72 |
| 0-20 | M | 1.79 | 10.24 | 34 | 1.76 | 6.28 |
| 0-20 | F | 2.60 | 15.64 | 38 | 2.56 | 14.00 |
| 20-45 | M | 3.20 | 21.95 | 101 | 3.30 | 26.15 |
| 20-45 | F | 3.36 | 21.02 | 109 | 4.06 | 29.30 |
| 45-55 | M | 3.32 | 17.04 | 24 | 2.97 | 15.58 |
| 45-55 | F | 3.89 | 24.94 | 63 | 4.04 | 31.63 |
| 55-65 | M | 4.16 | 28.12 | 19 | 5.21 | 40.36 |
| 55-65 | F | 4.44 | 43.95 | 101 | 4.54 | 49.29 |
| 65-75 | M | 6.76 | 68.39 | 16 | 6.16 | 48.58 |
| 65-75 | F | 5.49 | 53.09 | 70 | 4.42 | 49.49 |
| 75-80 | M | 5.74 | 38.40 | 2 | 7.78 | 65.97 |
| 75-80 | F | 6.34 | 50.69 | 18 | 6.67 | 55.30 |
| 80+ | M | 5.00 | 30.05 | 4 | 6.89 | 53.92 |
| 80+ | F | 9.48 | 103.70 | 6 | 10.26 | 121.50 |
| Variable | Short Description |
|---|---|
| CPG_ISLAND | Identifies whether a CpG site is located in a CpG Island. |
| CPG_ISLAND_LEN | Indicates the length of the island. |
| start_pos_of_ISLAND | Represents the start position of the CpG island. |
| end_pos_of_ISLAND | Represents the end position of the CpG island. |
| Dist_TSS | Information of Transcription Start Site (TSS) distance of all sites including Islands. |
| Map_Info | The exact position of all sites. |
| Next_Base_A | Next i.e. adjacent base pair after CpG site is A. |
| Next_Base_T | Next i.e. adjacent base pair after CpG site is T. |
| Next_Base_C | Next i.e. adjacent base pair after CpG site is C. |