Geometric and Dynamic Properties of Entangled Polymer Chains in Athermal Solvents: A Coarse-Grained Molecular Dynamics Study
Abstract
Abstract: We used a coarse-grained model to study the geometric and dynamic properties of flexible entangled polymer chains dissolved in explicit athermal solvents. Our simulations successfully reproduced the geometrical properties including the scaling relationships between mean-square end-to-end distance , chain entanglement lengths and concentration . Specifically, we find that , . Dynamically, our model confirmed the ratio of the dynamic critical entanglement and the geometric entanglement length is constant, with . To account for the local swelling effect for chains confined in athermal solvents, we treated the chains using the concept of blobs where each blob occupies a volume , with length . Direct MD simulations and scaling analysis showed that , . Using these together with the concentration dependent packing length , we obtained a modified the Lin-Noolandi ansatz for concentrated flexible polymer chains in athermal solvents: . We demonstrate this modified ansatz agrees well with our coarse-grained numerical simulations.
I i. INTRODUCTION
The dynamics of polymer systems are significantly affected by entanglement caused by topological constraints between chains [1, 2, 3, 4, 5]. Several models have been proposed to describe the dynamic properties of entangled polymer melts [6, 7, 8, 9, 10, 11]. However, there is a need to improve our understanding of polymers dissolved in athermal solvents regarding geometric and dynamics aspects. This is because the entanglement length and the local environment of the polymer chains will change due to the swelling effect caused by the athermal solvents in contrast to the pure melt. These effects, including the evolution of the entanglements and the local swelling of polymer chains by athermal solvents, are not readily observable experimentally, necessitating numerical simulations.
Various theoretical models have been proposed to quantify polymer entanglements. Geometric analyses by de Gennes, Kavassalis, and Richard P. Wool resulted in the scaling expression [12, 13, 14, 15, 16, 17, 18], where denotes the geometric entanglement length, represents the dynamical critical length of entanglement, and is the polymer concentration. In terms of dynamics, the Rouse model predicts that the relaxation time of the entangled system is proportional to the square of chain length when the chain length is lower than [19]. However, the Rouse model cannot be applied to solution systems due to the leakage assumption, which is not strictly satisfied. To address this issue, the Zimm model considers polymer chains and solvents as a whole [20, 21], and their motion satisfies the Stokes-Einstein relation [22]. The expression between relaxation time and chain length is obtained as , where is 0.588 in athermal solvents solution and is the monomer number of the polymer chain. When the chain exceeds , the long-lived entanglement effect occurs because of the topological constraints between chains. Edwards and de Gennes introduced the concept of a confining tube [23, 24], where the motion of the polymer chain is analogous to a snake wriggling inside a narrow tube, and deduced . The relaxation time acts as a bridge that relates the elastic response to the viscous response of entangled polymers. When , the polymer exhibits an elastic response to external forces, acting like a cross-linked network, while , the entanglements slip, resulting a viscous response. Regarding the elastic response of flexible polymer solutions, the Lin-Noolandi ansatz provides the relationship between the plateau modulus , and : , where is the Boltzmann constant, refers to temperature, and is the volume of a monomer [25, 26]. This relationship has not been verified for flexible polymers in athermal solvents where excluded volume effect may affect the chain stiffness.
In this study, we investigated the geometric and dynamic properties of flexible polymer chains dissolved in the explicit athermal solvents using large-scale MD simulations. To model the local swelling effects in such systems, we introduced the concept of swelling blobs and derived scaling relationships for the entanglement length , the packing length , the blob length and volume by combining MD simulation with the blobs scaling concept. We modified the Lin-Noolandi ansatz to incorporate the swelling blob scaling relationships, resulting a new scaling relationship: . The modified scaling relationship matches closely to that observed in experiments [26, 3].
II ii. SIMULATION METHOD
We modelled polymer chains using the bead-spring model [27], which assumes that the polymer chain is composed of sequentially connected beads (monomers). To enhance the simulation efficiency for large systems, our model only considers the repulsive non-bonded energy between monomers and the bonding energy connecting two adjacent monomers only. The chains are fully flexible so the the bending energy of two adjacent bonds is taken as zero. The nonbonded interaction between monomers is described by the purely repulsive Weeks-Chandler-Andersen (WCA) potential [28]:
where is the distance between two monomers, is the interaction strength, is the diameter of monomer. At high temperatures, the presence of attractive interactions between monomers has little effect on the dynamical properties of the polymer melts. Therefore, the WCA potential saves a large amount of computational time by retaining only repulsive interactions and achieves high accuracy. The finitely extensible nonlinear elastic (FENE) potential is used to simulate the bonding energy [29]:
where refers to the spring constant, and represent the bond length and the maximum bond length, respectively. The chains were modelled using an algorithm for self-avoidance walk (SAW), and our algorithm was modified so that each chain not only avoided itself but also avoided other chains.
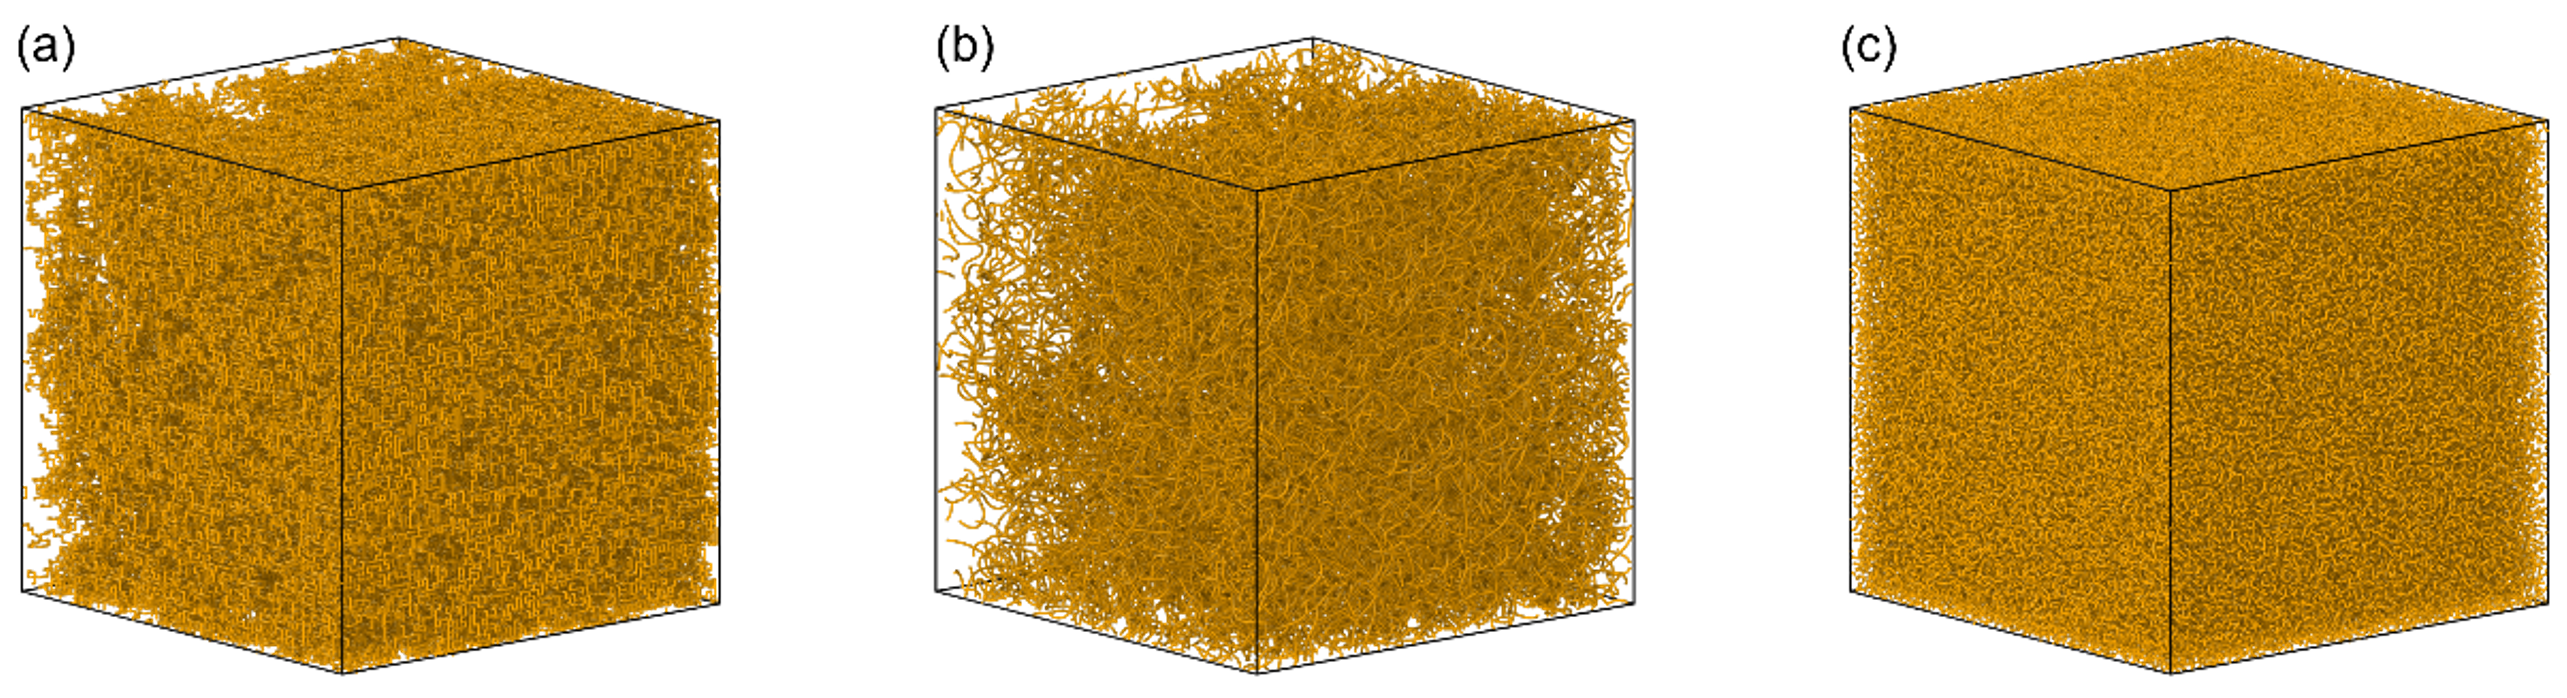
The modeling process is given in Fig. 1(a)-(c), after the construction of the initial model by the SAW method, a soft-core potential was used to avoid the singularity in the energy minimization process, making the energy surface smoother. Following the treatment of the soft potential, the full force field was applied to the system for the final energy minimization and system relaxation.To describe the solution of fully flexible chains in athermal solvents, we modelled the solution by taking the analogy with the Flory lattice model, i.e., each solvent molecule is treated as a lattice point, and a polymer chain of length is treated as a connection of lattice points [30, 31]. In other words, we modelled the solutions to satisfy the following conditions:
(3)
where , and refer to the interaction of monomer-monomer, monomer-solvent and solvent-solvent respectively, and describe the diameter of solvent beads and chain monomers. When equation (3) holds, the polymer chains can be fully swollen by the athermal solvents, and the chains in such system are expected to follow the scaling rule suggested by de Gennes [12].
Here, , and . As regards the FENE potential, we set and [10]. Since the periodic boundary condition is introduced in three dimensions, large-scale models are required so that the size of the box is greater than the root mean end-to-end distance of the polymer chain. With such a setup, the conformation of each chain will not be affected by the box boundaries, each of our models contains beads and the total number of beads exceeds . Number density is set to and temperature is , where is the Boltzmann constant. The Nosé-Hoover thermostat is used to control the temperature with a timestep of 1 in the NVT ensemble [32, 33], with simulation time up to 500 until chains are fully relaxed. All simulations were carried out using the Large-scale Atomic/Molecular Massively Parallel Simulator (LAMMPS) software [34].
III iii. RESULT AND DISCUSSION
III.1 A.Entanglement length and chain relaxation dynamics - Pure Melt System
Two length scales, a geometric entanglement length, , and a dynamic critical entanglement length, , are commonly used to describe entangled polymer melts [8]. The relationship between and has been studied by de Gennes, Kavassalis and Richard P. Wool, and a constant ratio between and has been estimated to be between 9/4 to 27/4 for isotropic melt of flexible polymer chains [12, 14, 17]. In this work, we hope to establish this constant ratio through molecular dynamics simulations and verify whether it holds for fully flexible chains in the pure melt and in athermal solvents.
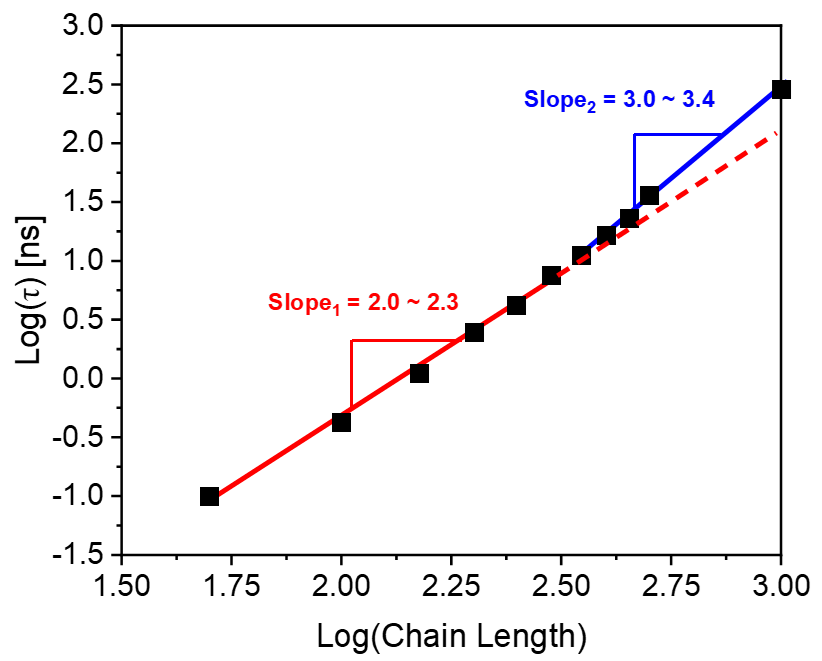
We generated models of monodisperse polymer melts with varying chain lengths, ranging from 100 to 1000 monomers per chain to cover the unentangled to entangled range. To determine the entanglement length, we used the Z1 method developed by Martin Kröger[35, 36, 37], which yielded a constant value of , consistent with the previous literatures [38, 39]. To calculate , we computed the relaxation time for each model by analyzing the autocorrelation function of the end-to-end vector. The resulting relaxation time is plotted in Fig. 2, with the red and blue lines representing the unentangled and entangled states, respectively. Our analysis reveals a critical chain length above which the proportionality constant between the logarithmic relaxation time of the melt and that of the chain length changes from to . The critical length was approximately 316 based on the figure, and the unentangled and entangled regions were consistent with the Rouse and tube models, respectively. Thus, the ratio of the critical dynamical entanglement length over that of the geometric entanglement length equals to 5.45. This result lies in the range of 9/4 to 27/4 as given by the geometric analysis of Wool [17].
III.2 B.Entanglement length and chain relaxation dynamics - Solution System
To ensure the accuracy of our simulation model for fully flexible polymer chains in athermal solvents, we first validated our coarse-grained model by simulating the scaling laws for the mean square end-to-end distance and the entanglement length at varying polymer volume fractions . The scaling law for at concentrations well above the over lapping concentration , proposed by de Gennes, is given by equation (4), as follows [40]:
(4)
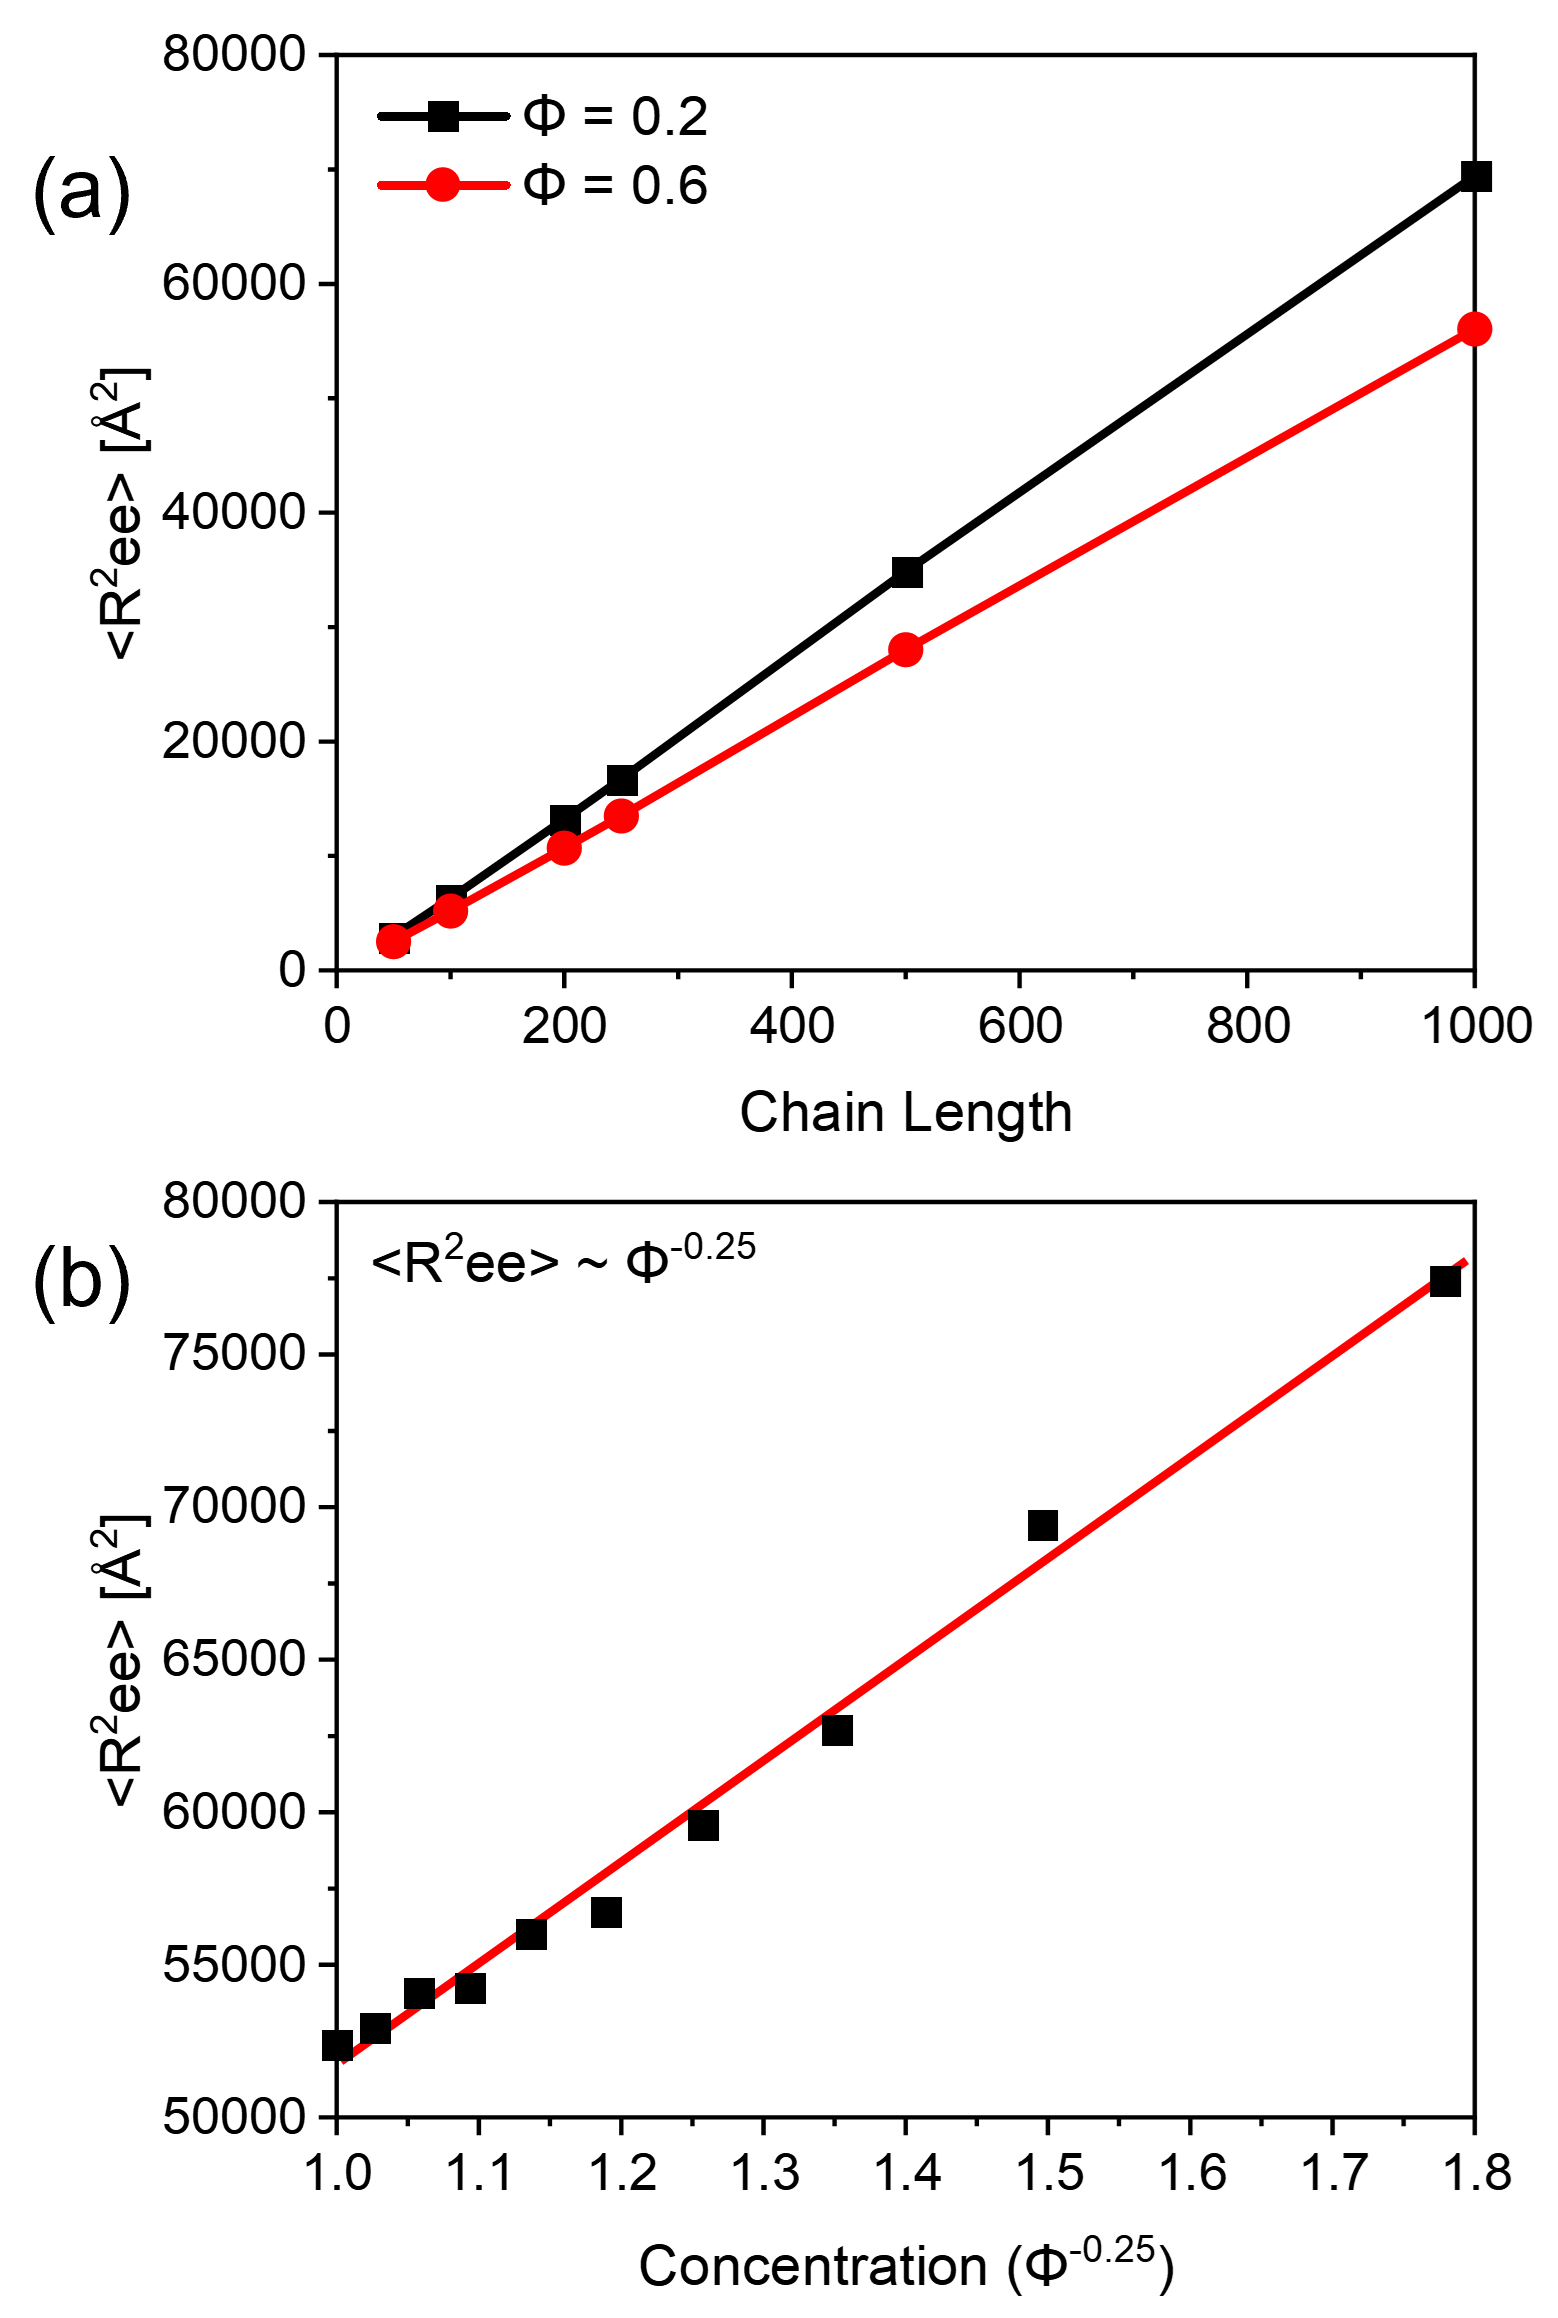
Here represents the polymer chain length and is the polymer volume fraction. We investigated the dependence of dependence of on chain length and polymer concentration by MD simulations. Six models of monodisperse polymer chains were generated at and ,with ” fixed polymer concentrations at = 0.2 and 0.6 for each model. Additionally, ten models of monodispersed polymer chains were generated at , but varying polymer volume fractions from 0.1 to 1.0 at constant intervals of 0.1 to explore concentration dependence. All simulation range corresponds to the heavily overlapped systems as they are well above the critical concentration for chain overlap, when . We plotted the calculated values of as a function of and , in Figures 3(a)-(b), respectively. The data points represent the simulation values, while the lines were obtained by linear fitting of equation (4). The excellent agreement between the calculated values to the fitted lines given by equation (4) shows that our model can successfully describe the concentrated polymer solutions in athermal solvents.
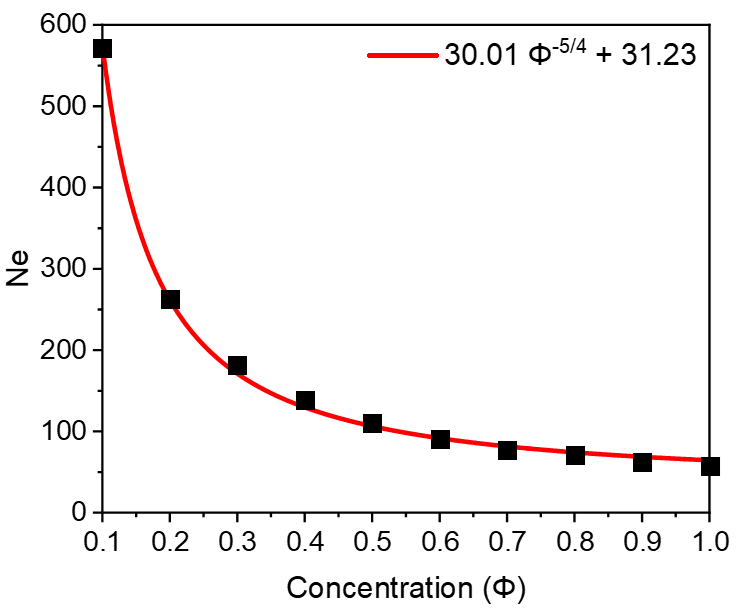
For the entanglement length, using the Z1 method, we calculated the entanglement length of models at different concentrations and plotted the results in Fig. 4. The data points represent the simulated results, and the continuous line represents the fitting of , where and are fitting constants. Whilst the scaling exponent agrees with the literature findings of for flexible polymer chains in good solvent systems [12], a non-zero constant was observed in this study. This is because that polymer chains are unentangled at concentrations below the overlapping concentration .
After demonstrating the accuracy of our coarse-grained models in predicting the geometric scaling laws for concentrated polymer solutions in athermal solvents, we proceeded to simulate the dynamic relaxation behavior of these polymer solutions of monodisperse polymer chains at . We computed the relaxation time constant by analyzing the auto-correlation function of the end-to-end vector. Fig. 5 (a) plots the simulated logarithmic relaxation time versus logarithmic polymer concentrations, with the scattered points representing the simulations and the continuous lines fitted by least square linear fitting. The best fit to the data shows a slope change at a critical concentration .
From the scaling relationship established in Fig. 4, we can deduce this corresponds to . Assuming this corresponds to the long-lived entanglement effect, we may deduce the dynamic critical entanglement length , giving a ratio of . This ratio is nearly the same as that simulated for the pure melt system presented in the previous section. Therefore, we may conclude that both the pure melt and fully flexible polymer chains in athermal solvents show similar ratios between geometric and dynamic entanglement lengths.
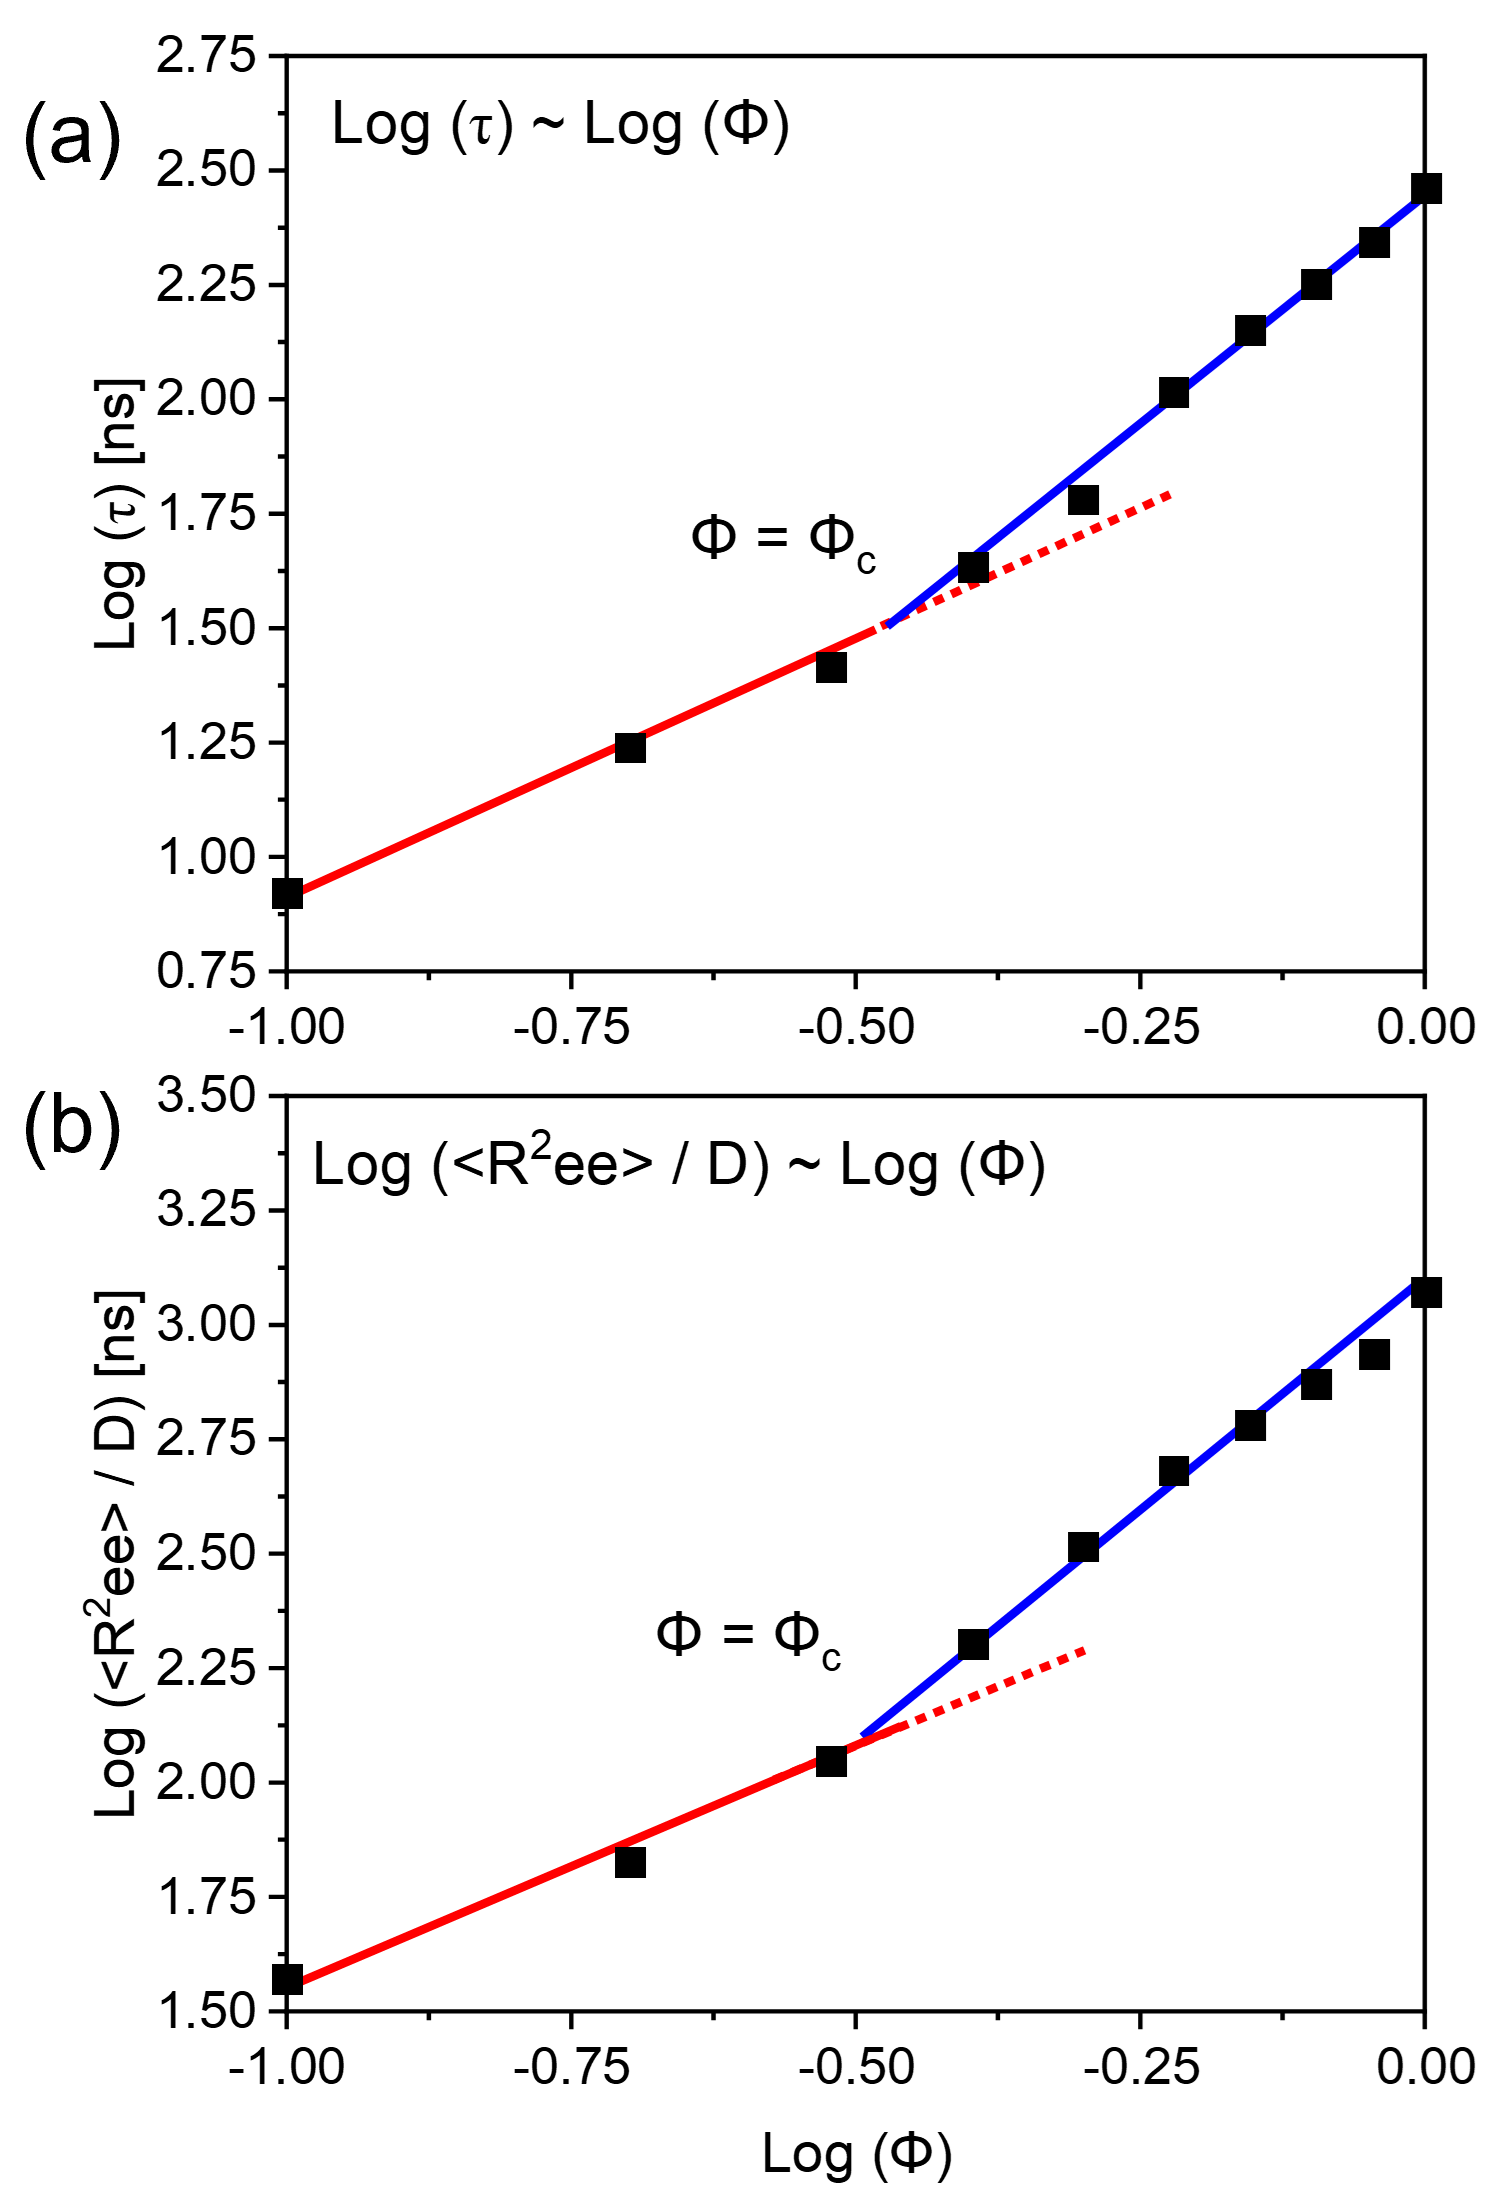
To further validate our analysis, we computed the relaxation time constant of the polymer solution by computing the diffusion time constant. The relaxation time corresponds to the time required for a polymer chain displacement over a length scale equals to that of the radius of gyration or mean end-to-end distance. The simulated results are plotted in Fig. 5(b). Like Fig. 5(a), the fitted lines also show a slope change at a critical concentration , and the values of the two slopes are identical to those in Fig. 5(a). This further shows the accuracy and the consistency of our simulation results.
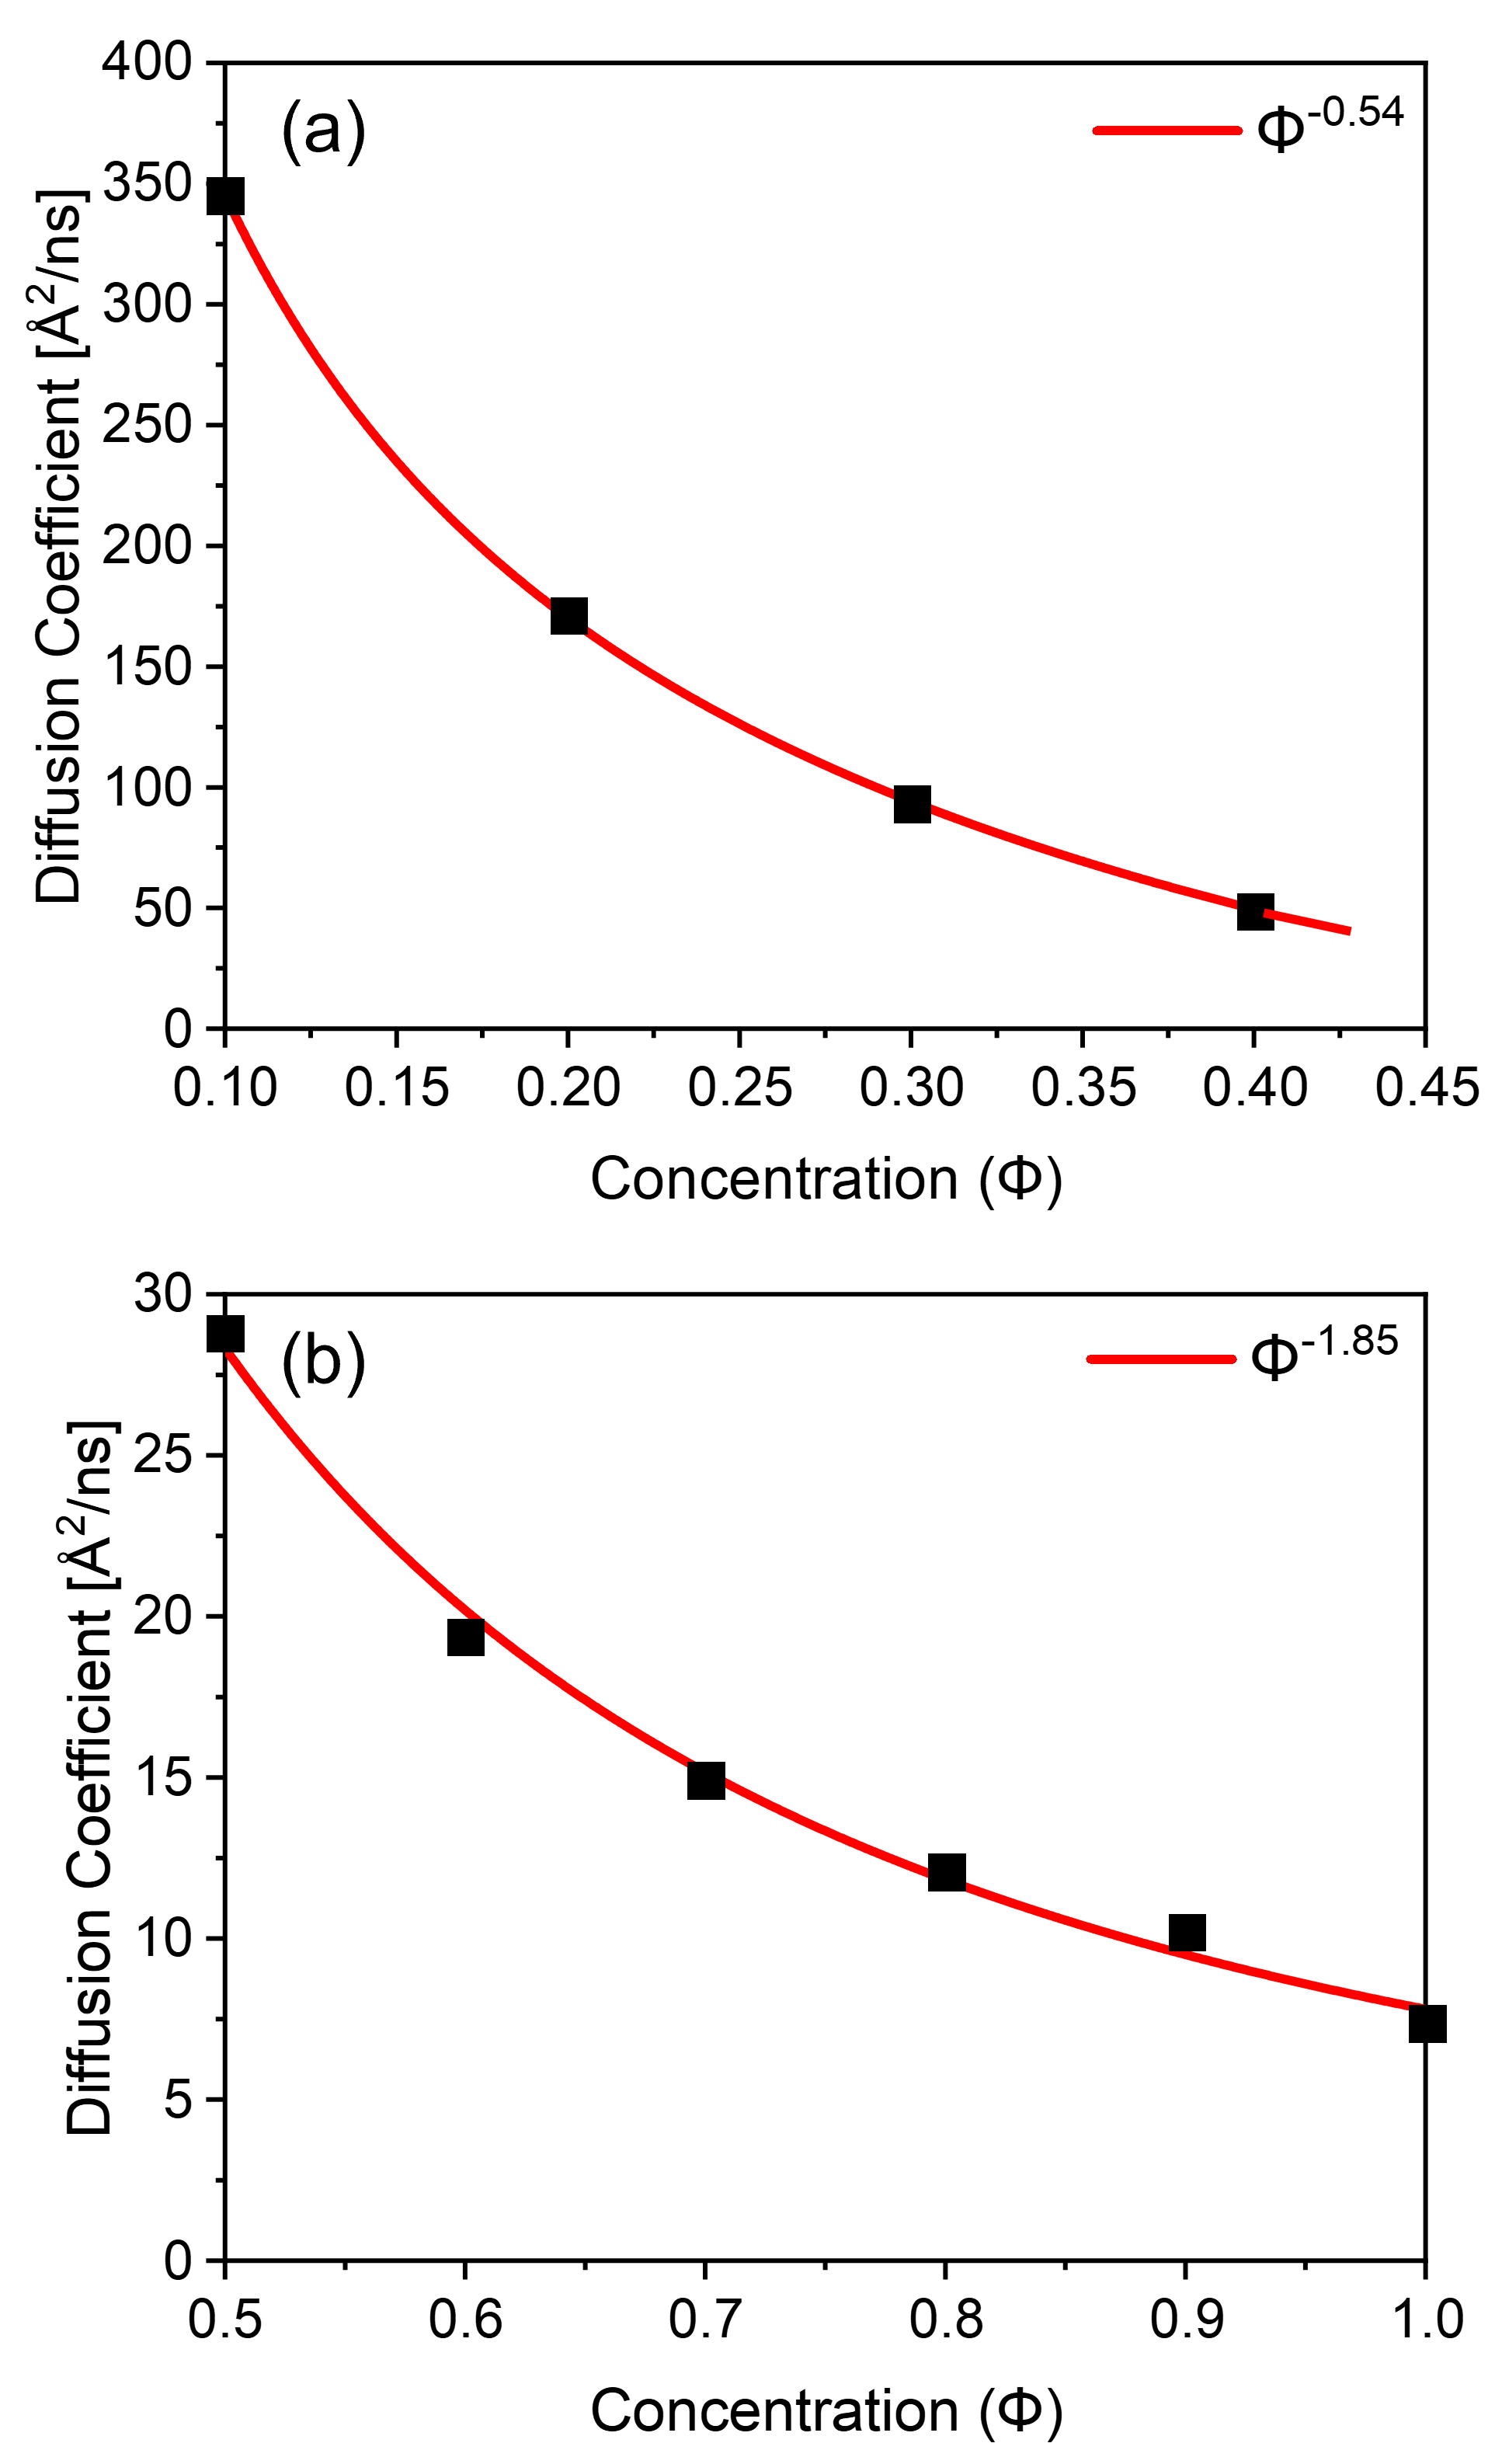
Figs. 6(a)-(b) illustrate the scaling relationships between diffusion coefficient and polymer concentration below and above the critical concentration for polymer chains in athermal solvents, respectively. These plots demonstrate excellent agreement between the calculated results and the literature scaling relations for unentangled and entangled polymer solutions [6, 7, 12], highlighting the ability of our model to accurately simulate the dynamics of polymer solutions. Our simulations of dynamic responses, in terms of scaling relations of diffusivity and relaxation time constant, have uncovered a new critical concentration , above which a long-lived entanglement effect becomes significant. Importantly, this critical concentration is significantly larger than the critical concentration for chain overlap. We propose that should be regarded as a new parameter to quantify the dynamical state of entangled polymers in athermal solvents.
III.3 C.Local Swelling Effect
Polymer chains in athermal solvents are strongly influenced both by the solvents and adjacent chains. The size of a target polymer chain becomes swelled by the solvents and follows the law of self-avoidance walk (SAW) in dilute solutions. In concentrated polymer solutions, the screening effect of proximity chains causes the chains to exhibit the Gaussian scaling in the whole. Such screening effect implicates that the swelling effects are limited to the local scale. The local environment of a chain can be described by packing length, which is defined by Milner as the closest distance between to backbone moieties on different strands. A larger packing length means there are more solvent molecules and fewer adjacent polymer chains around a target polymer chain. Milner’s definition enables the packing length to be readily evaluated from the radial distribution function (RDF), and accurate values of the packing lengths for flexible polymers of different architectures were obtained accordingly [41, 42]. The scaling relations between the packing length and polymer concentration can be derived following the analysis by Y.H. Lin, who stipulates that for all flexible polymers the number of entanglement strands coexisting in the volume penetrated by one entangled strands remains constant [25], i.e.,
(5)
Here is the packing length, and is the entanglement length. By substituting to equation (5), the packing length is shown to scale with the polymer concentration as follows:
(6)
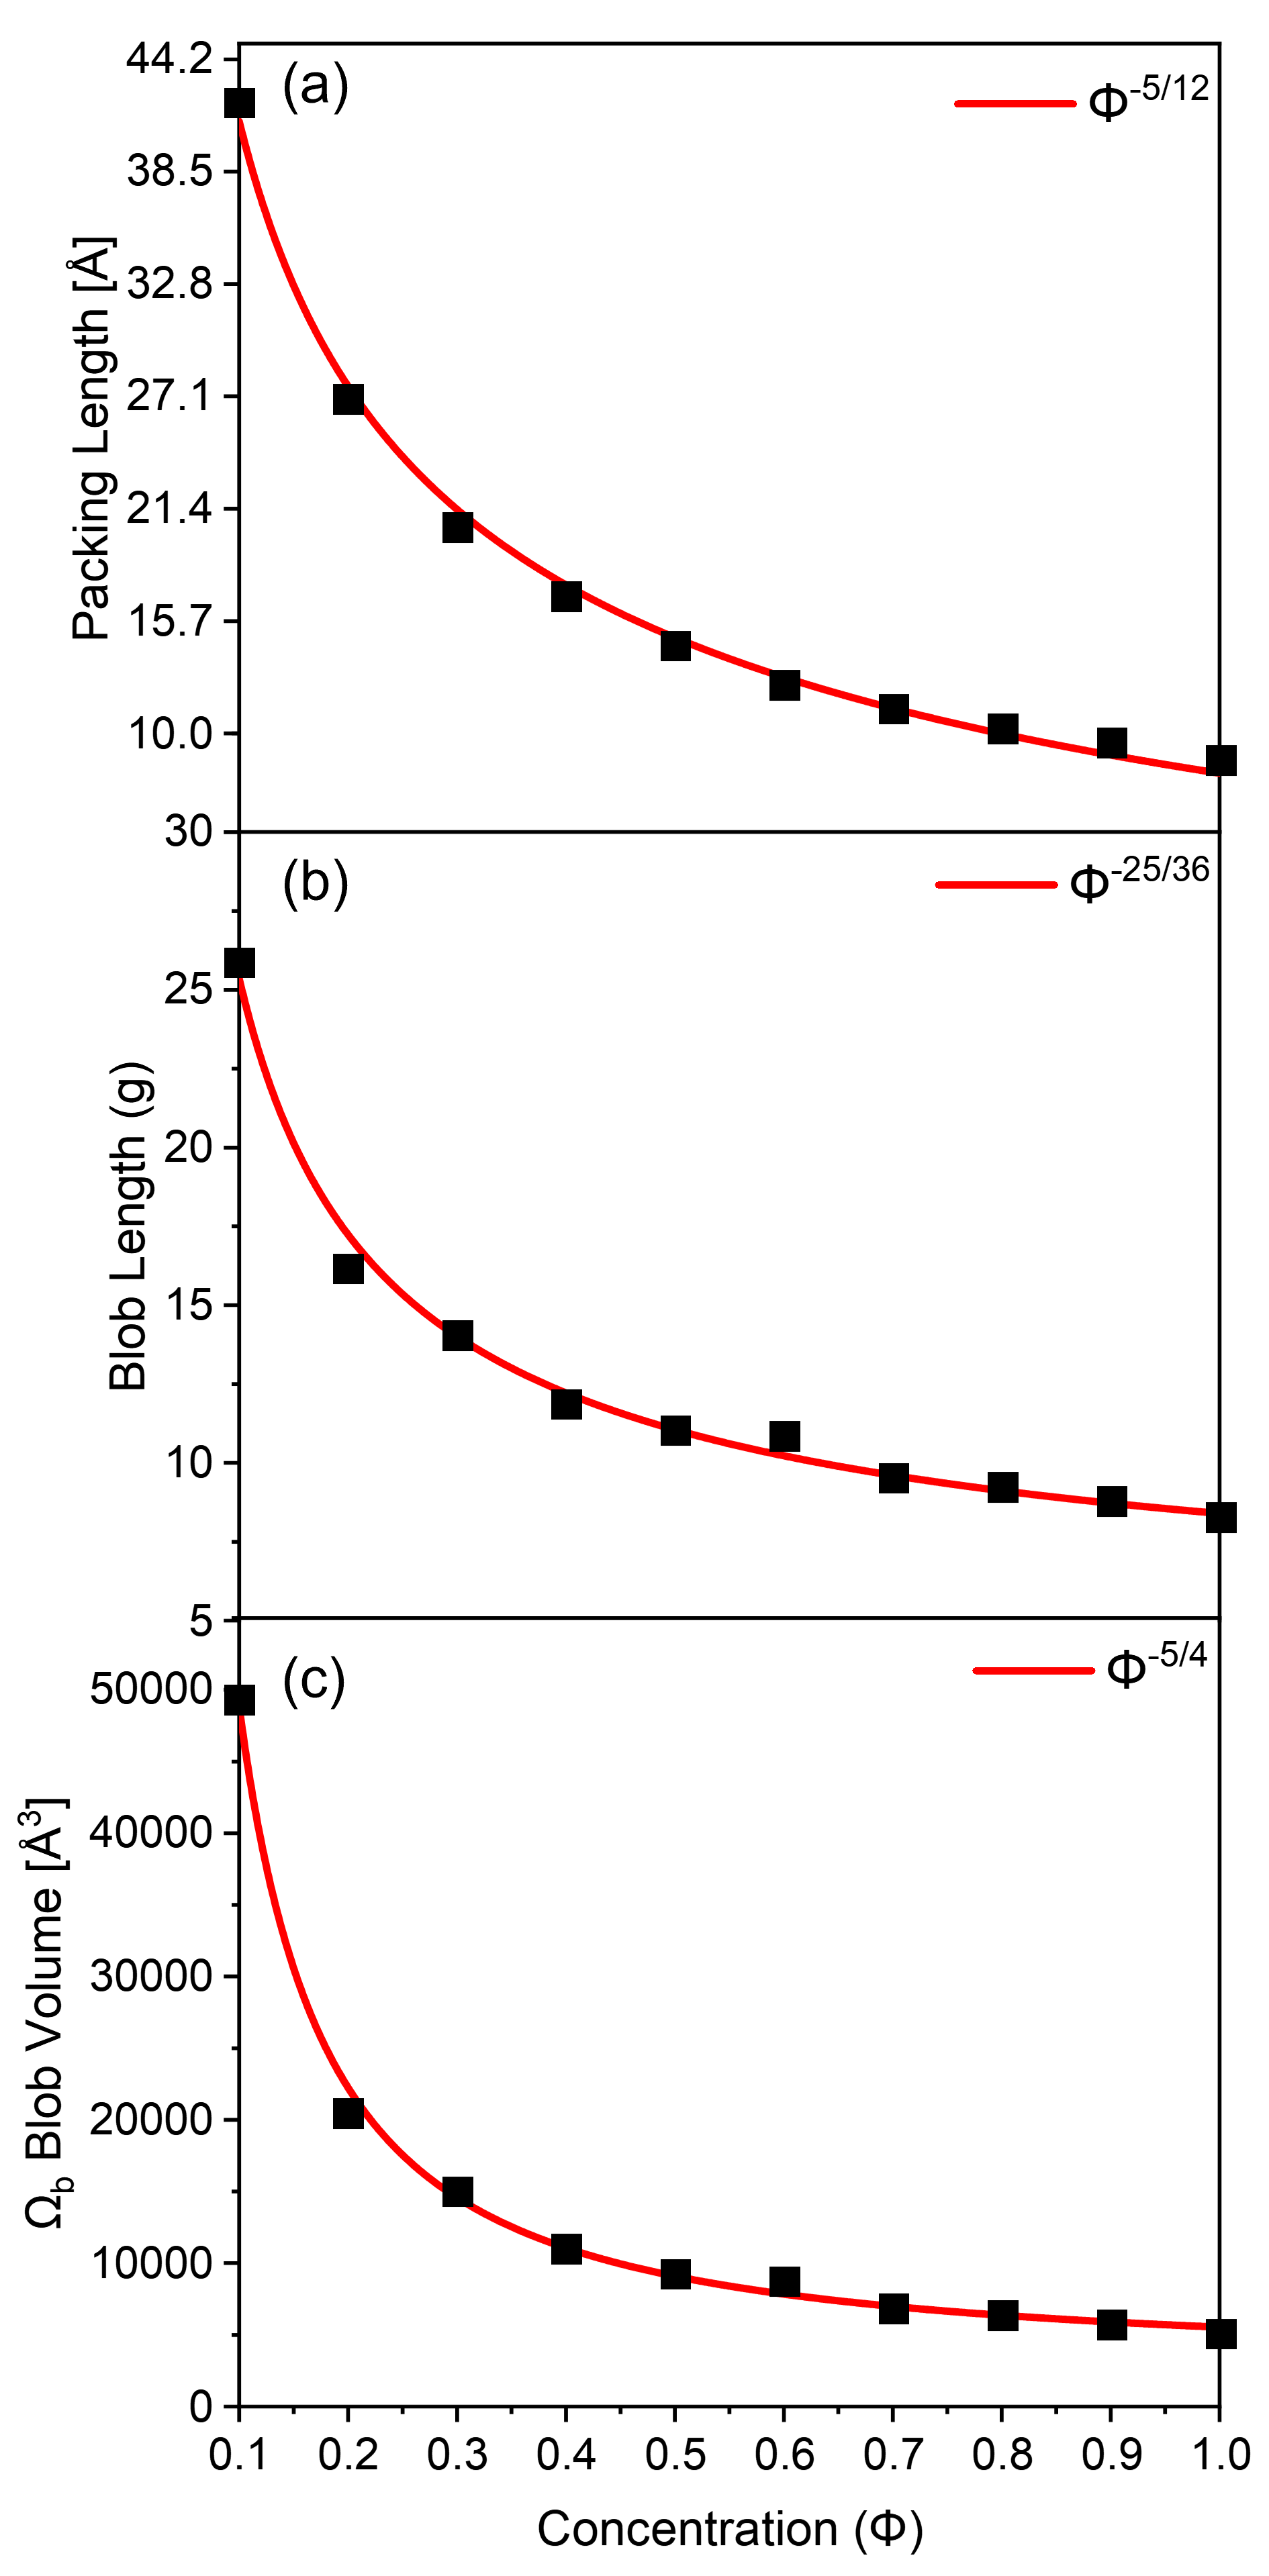
The packing length of polymer chains at different polymer concentrations was calculated using the radial distribution function (RDF) method proposed by Milner, and the result was plotted together with that predicted using equation (6) in Fig. 7(a). The agreement between the simulation and the scaling prediction is excellent.
To capture the local swelling effect in our model, we proposed a hypothesis that the polymer chain can be viewed as a series of connected swelling blobs, each with a diameter of and a length of . The length of each blob, , can be described by the correlation function of bond vectors. A larger corresponds to a stiffer chain, as it indicates a stronger correlation between bond vectors. We assumed that the correlation between chain segments in different blobs is lost due to the screening effect, while within a blob, the chain segment cannot effectively perceive the presence of other chains, resulting in swelling by the athermal solvents. By assuming the blob size scales linearly with the packing size , we find:
(7)
And the coil diameter scales with the correlation length by:
(8)
Combine equations (7) and (8), we arrived at the concentration scaling expression for the length as follows:
(9)
Thus, the blob volume is:
(10)
We plotted the scaling equations for and together with the simulated data in Figs. 7(b)-(c), and observed excellent agreement.

Our hypothesis, based on the swelling concept introduced previously, was that the elastic properties of the polymer chains could be altered, such that the plateau modulus of polymer chains in athermal solvents may not follow that by the classical Lin-Noolandi ansatz: . We have demonstrated that swelling of the chains inside the swelling blobs are stiffer as they exhibited larger correlation function . In the meantime, the local swelling also leads to the formation of larger blob volumes, which render the chains softer. By taking these two factors into account, we obtained a modified scaling equation for the plateau modulus as follows:
(11)
In addition, as described earlier (see Fig. 4), the scaling relation for should account for the non-entangling condition for dilute solutions, i.e., . Combining these together, we arrived at a new scaling expression for as . This expression agrees well with the previously reported experimental findings for concentrated polymer solutions in good solvent systems [15, 16, 3]. On the other hand, substitution of into the classical Lin-Noolandi ansatz, we found that the scaling relation for as . This unexpected scaling exponent differs from previous literature reports [26], we attribute the discrepancy to the non-negligible , which had been previously ignored.
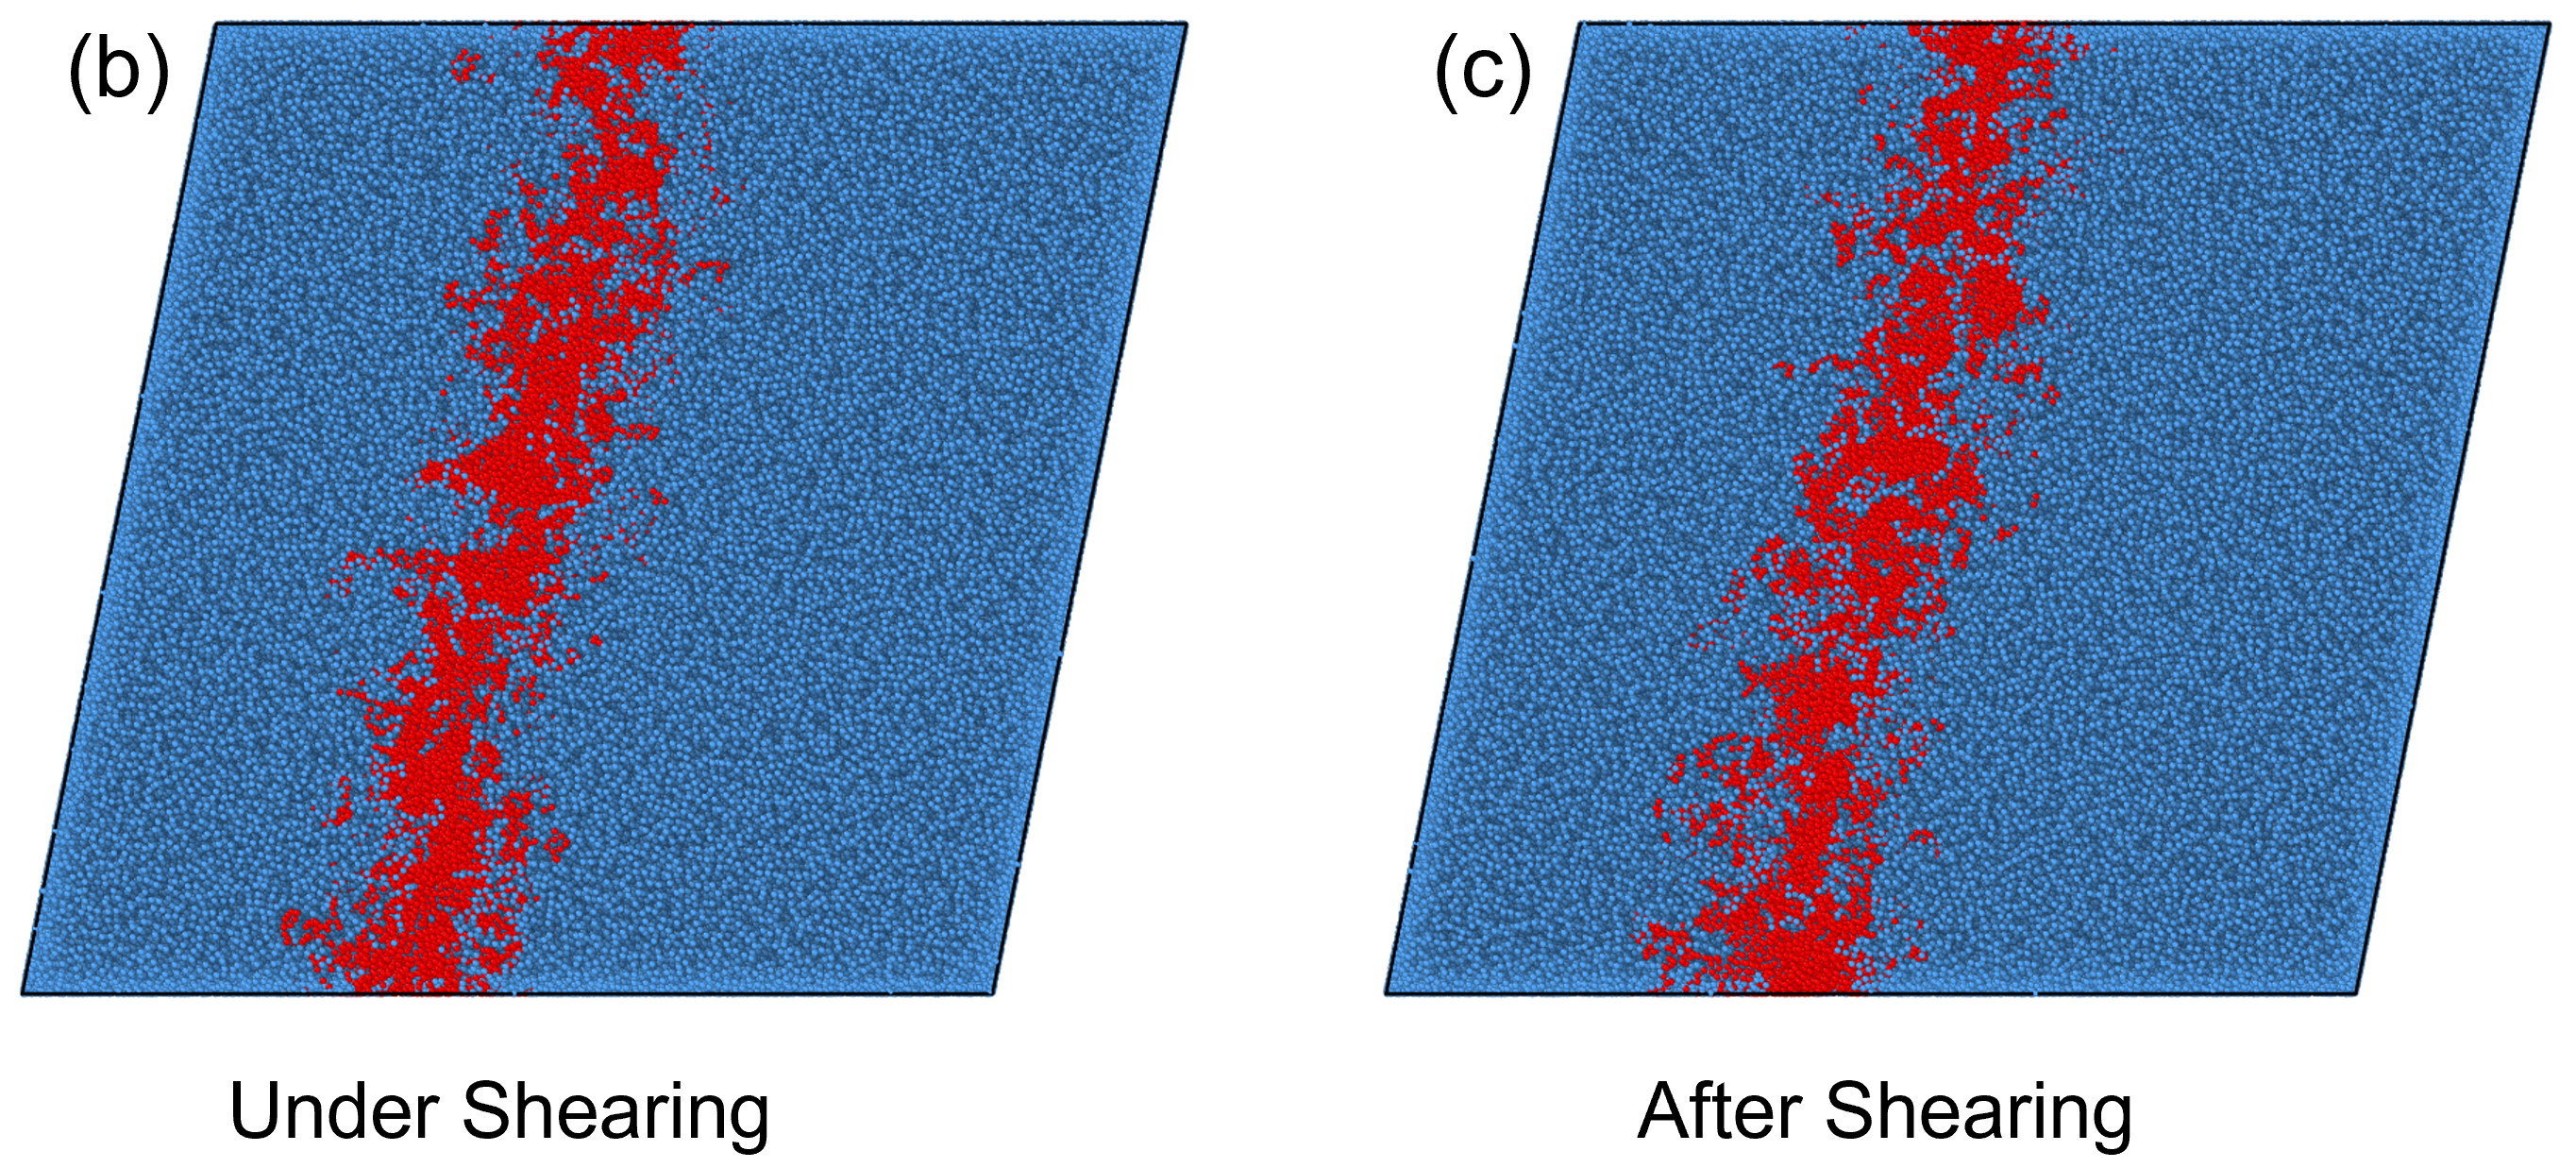
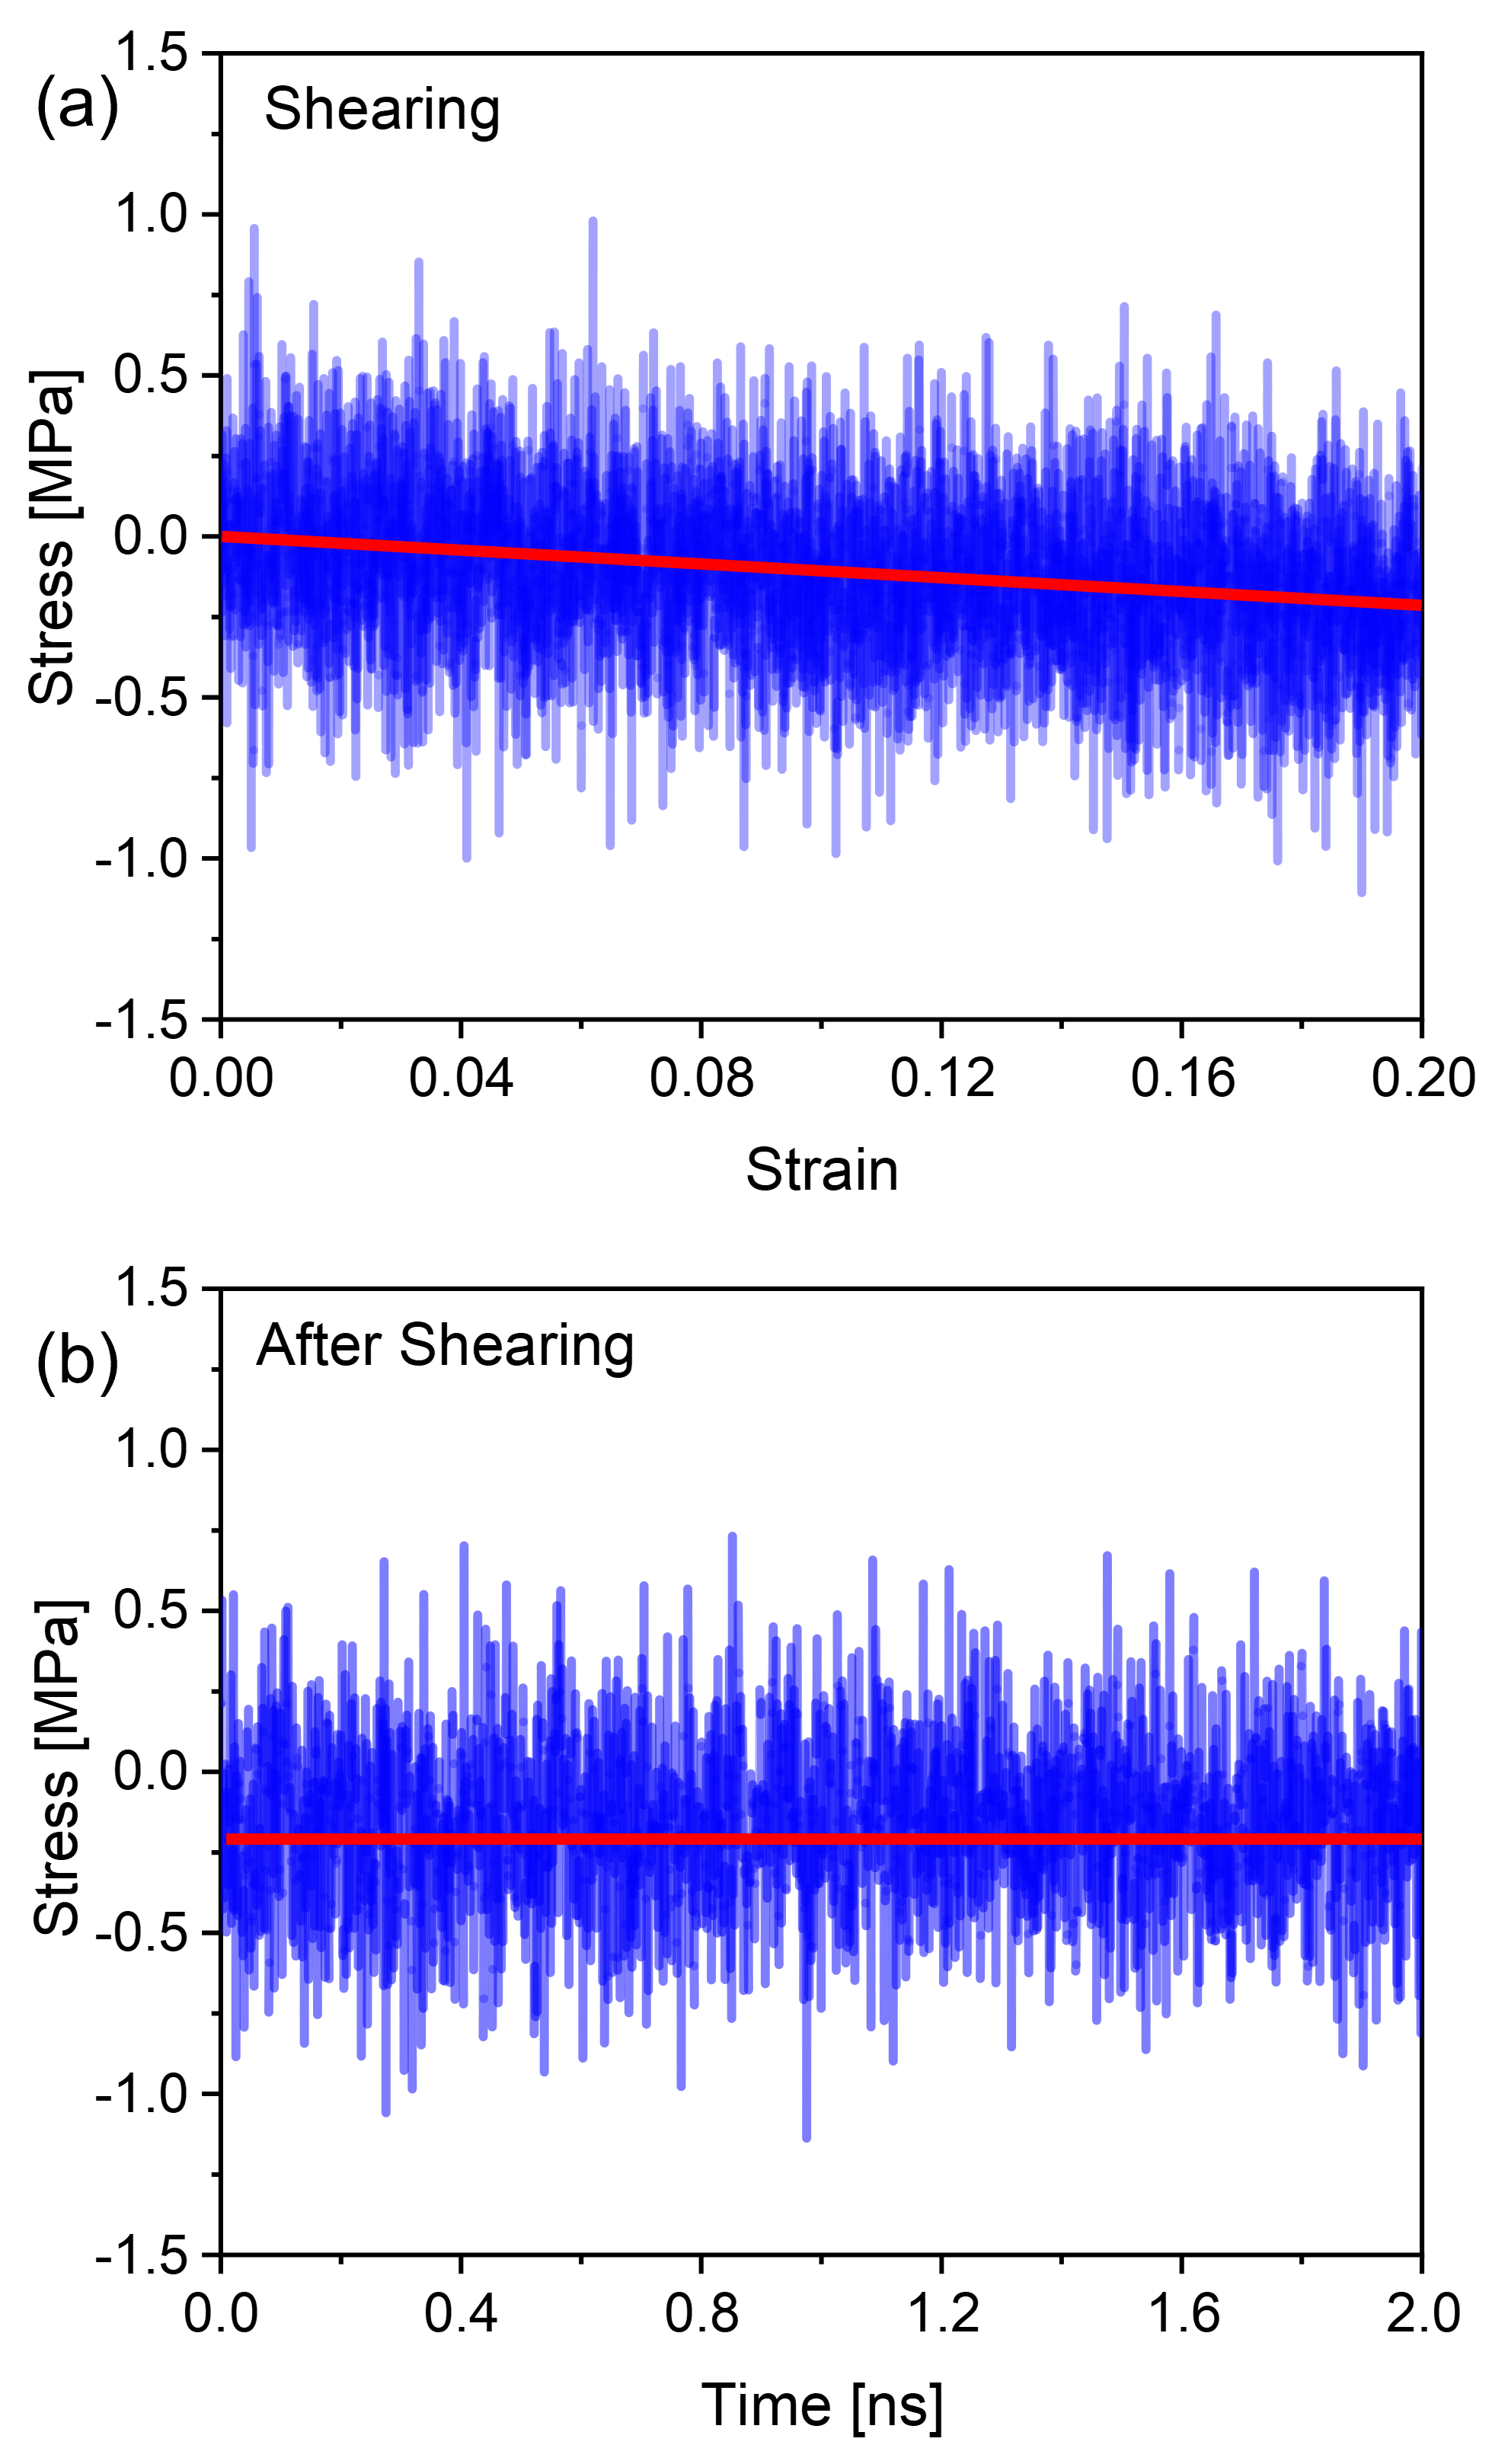
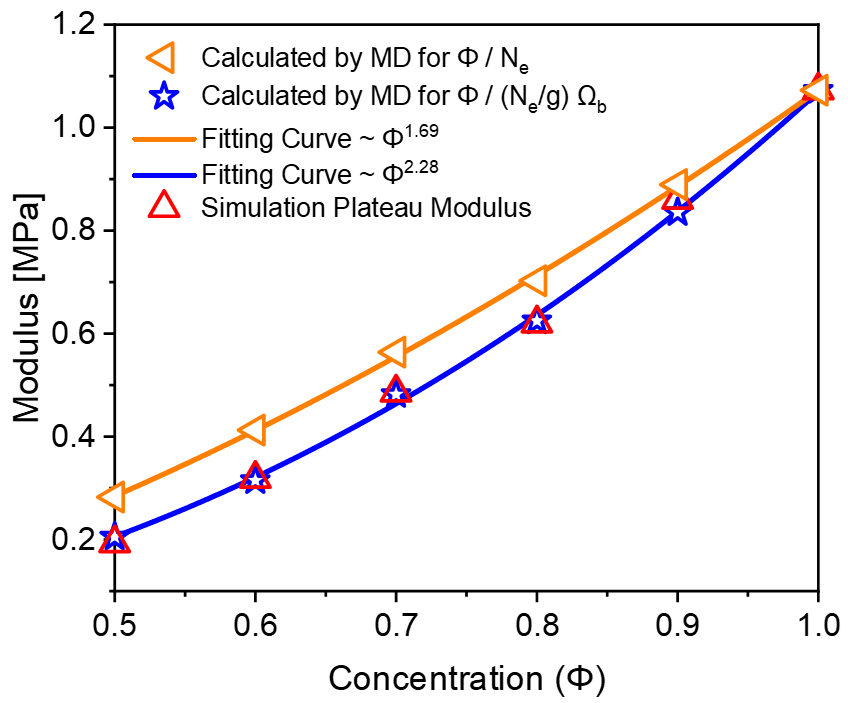
To investigate this numerically, we simulated the plateau moduli as a function of polymer concentration under simple shear deformation. Initially, we constructed a large-scale model box that was larger than the of the chains, as shown in Fig. 8(a), to ensure the conformation of the polymers was not restricted by size. To simulate the shear progress, we deformed the box under a stable velocity along the -direction[43, 44, 45, 46]. Figs. 8(b) shows the stress-strain relationship in shear process, for a better observation, the beads in the middle of the system were colored in red. It can be observed that the system exhibited a uniform velocity field, the maximum shear strain was set to 0.2. After the shearing deformation, the system was relaxed at the fixed maximum strain, seen in Fig. 8(c), the chains in the system did not recover during the relaxation process. To further ensure the deformation was elastic, the stress evolution of the system during and after shearing are plotted in Fig. 9(a)-(b). From Fig. 9(a), the stress is linearly dependent on strain in the process of shearing, while in Fig. 9(b), when the system is fixed at the maximum strain, no stress relaxation is observed. These results suggest that the system was elastically deformed under the shear deformation. We computed the plateau modulus of the polymer chains at concentrations where the long-lived entanglements are important, i.e., for [ = 0.5, 0.6, 0.7, 0.8, 0.9, 1.0], and plotted the data in Fig. 10 along with the classical Lin-Noolandi ansatz and equation (11).
The orange and blue data points respectively represent the modulus calculated from the MD simulation of classical Lin-Noolandi ansatz and equation (11), while the red triangles represent the simulated modulus values from the shear simulation. Orange and blue curves show the fitting results of and equation (11), resulting in and , respectively. Our results show the simulated values deviate from the classical Lin-Noolandi ansatz but matches well with equation (11). Both equation (11) and direct numerical modelling show excellent agreement with the concentration scaling law . This new scaling relationship matches well with the experimental results [14, 15, 16, 26, 3], suggesting that large-scale MD simulations are important to study the underlying mechanisms for entangled polymer systems.
IV iv. DISCUSSION
Our study demonstrates that our coarse-grained model can accurately describe the geometric scaling relationships for concentrated solutions of fully flexible polymer chains in athermal solvents. Through large-scale molecular dynamics simulations, we were able to verify and extend theories proposed by de Gennes, Kavasslis, Milner, etc. We also investigated the dynamic behavior of both pure melts and solutions, finding a consistent relationship between dynamic and geometric entanglement length. We identified a critical concentration above the crossover concentration which allows the solution to exhibit prolonged entanglement effects. Furthermore, a local swelling effect was discovered, using the concept of blob, we successfully correlated this local swelling with entanglement length , packing length , blob length and volume , and deduced the scaling relationships with concentration. As a result, we modified the Lin-Noolandi ansatz due to this local swelling effect.
We acknowledge that our coarse-grained model does not consider certain structural details of chains and solvents, and the drag effect and swelling mechanism remain unresolved issues. However, these limitations do not appear to affect our modelling capability, and further studies are needed to address these issues. Additionally, in this work, we focused only on the properties of flexible chains. We predict that there will be different dynamics in semi-flexible and stiff chains, and we plan to explore this issue in future work.
References
- Brown and Russell [1996] H. R. Brown and T. P. Russell, Entanglements at polymer surfaces and interfaces, Macromolecules 29, 798 (1996).
- Graessley [1971] W. W. Graessley, Linear viscoelasticity in entangling polymer systems, The Journal of Chemical Physics 54, 5143 (1971).
- Graessley [2005] W. W. Graessley, The entanglement concept in polymer rheology, The entanglement concept in polymer rheology , 1 (2005).
- Kong et al. [2021] D. C. Kong, M. H. Yang, X. S. Zhang, Z. C. Du, Q. Fu, X. Q. Gao, and J. W. Gong, Control of polymer properties by entanglement: a review, Macromolecular Materials and Engineering 306, 2100536 (2021).
- Likhtman and Ponmurugan [2014] A. E. Likhtman and M. Ponmurugan, Microscopic definition of polymer entanglements, Macromolecules 47, 1470 (2014).
- de Gennes [1990] de Gennes, Introduction to polymer dynamics (CUP Archive, 1990).
- Doi [2013] M. Doi, Soft matter physics (oxford university press, 2013).
- Fetters et al. [1999] L. J. Fetters, D. J. Lohse, S. T. Milner, and W. W. Graessley, Packing length influence in linear polymer melts on the entanglement, critical, and reptation molecular weights, Macromolecules 32, 6847 (1999).
- Ferry [1980] J. D. Ferry, Viscoelastic properties of polymers (John Wiley & Sons, 1980).
- Hoy and Kröger [2020] R. S. Hoy and M. Kröger, Unified analytic expressions for the entanglement length, tube diameter, and plateau modulus of polymer melts, Physical Review Letters 124, 147801 (2020).
- Dietz et al. [2022] J. D. Dietz, M. Kröger, and R. S. Hoy, Validation and refinement of unified analytic model for flexible and semiflexible polymer melt entanglement, Macromolecules 55, 3613 (2022).
- de Gennes [1979] de Gennes, Scaling concepts in polymer physics (Cornell university press, 1979).
- de Gennes [1976a] de Gennes, Dynamics of entangled polymer solutions. ii. inclusion of hydrodynamic interactions, Macromolecules 9, 594 (1976a).
- Kavassalis and Noolandi [1987] T. A. Kavassalis and J. Noolandi, New view of entanglements in dense polymer systems, Physical review letters 59, 2674 (1987).
- Kavassalis and Noolandi [1988] T. A. Kavassalis and J. Noolandi, A new theory of entanglements and dynamics in dense polymer systems, Macromolecules 21, 2869 (1988).
- Kavassalis and Noolandi [1989] T. A. Kavassalis and J. Noolandi, Entanglement scaling in polymer melts and solutions, Macromolecules 22, 2709 (1989).
- Wool [1993] R. P. Wool, Polymer entanglements, Macromolecules 26, 1564 (1993).
- Russell et al. [1993] T. Russell, V. Deline, W. Dozier, G. Felcher, G. Agrawal, R. Wool, and J. Mays, Direct observation of reptation at polymer interfaces, Nature 365, 235 (1993).
- de Gennes [1976b] de Gennes, Dynamics of entangled polymer solutions. i. the rouse model, Macromolecules 9, 587 (1976b).
- Zwanzig [1974] R. Zwanzig, Theoretical basis for the rouse-zimm model in polymer solution dynamics, The Journal of Chemical Physics 60, 2717 (1974).
- Zimm [1956] B. H. Zimm, Dynamics of polymer molecules in dilute solution: viscoelasticity, flow birefringence and dielectric loss, The journal of chemical physics 24, 269 (1956).
- Shearer and Hudson [2008] S. A. Shearer and J. R. Hudson, Fluid mechanics: stokes’ law and viscosity, Measurement Laboratory 3 (2008).
- Edwards [1967] S. Edwards, The statistical mechanics of polymerized material, Proceedings of the Physical Society 92, 9 (1967).
- de Gennes [1971] de Gennes, Reptation of a polymer chain in the presence of fixed obstacles, The journal of chemical physics 55, 572 (1971).
- Lin [1987] Y. Lin, Number of entanglement strands per cubed tube diameter, a fundamental aspect of topological universality in polymer viscoelasticity, Macromolecules 20, 3080 (1987).
- Milner [2020] S. T. Milner, Unified entanglement scaling for flexible, semiflexible, and stiff polymer melts and solutions, Macromolecules 53, 1314 (2020).
- Liu et al. [2008] B. Liu, J. Wang, X. Fan, Y. Kong, and H. Gao, An effective bead–spring model for polymer simulation, Journal of Computational Physics 227, 2794 (2008).
- Weeks et al. [1971] J. D. Weeks, D. Chandler, and H. C. Andersen, Role of repulsive forces in determining the equilibrium structure of simple liquids, The Journal of chemical physics 54, 5237 (1971).
- Kremer and Grest [1990] K. Kremer and G. S. Grest, Dynamics of entangled linear polymer melts: A molecular-dynamics simulation, The Journal of Chemical Physics 92, 5057 (1990).
- Sariban and Binder [1987] A. Sariban and K. Binder, Critical properties of the flory–huggins lattice model of polymer mixtures, The Journal of chemical physics 86, 5859 (1987).
- Sayegh and Vera [1980] S. Sayegh and J. Vera, Lattice-model expressions for the combinatotial entropy of liquid mixtures: a critical discussion, The Chemical Engineering Journal 19, 1 (1980).
- Evans and Holian [1985] D. J. Evans and B. L. Holian, The nose–hoover thermostat, The Journal of chemical physics 83, 4069 (1985).
- Nauchitel’ [1981] V. Nauchitel’, Energy distribution function for the nvt canonical ensemble, Molecular Physics 42, 1259 (1981).
- Plimpton [1995] S. Plimpton, Fast parallel algorithms for short-range molecular dynamics, Journal of computational physics 117, 1 (1995).
- Kröger [2005] M. Kröger, Shortest multiple disconnected path for the analysis of entanglements in two-and three-dimensional polymeric systems, Computer physics communications 168, 209 (2005).
- Hoy et al. [2009] R. S. Hoy, K. Foteinopoulou, and M. Kröger, Topological analysis of polymeric melts: Chain-length effects and fast-converging estimators for entanglement length, Physical Review E 80, 031803 (2009).
- Shanbhag and Kröger [2007] S. Shanbhag and M. Kröger, Primitive path networks generated by annealing and geometrical methods: Insights into differences, Macromolecules 40, 2897 (2007).
- Grest [2016] G. S. Grest, Communication: Polymer entanglement dynamics: Role of attractive interactions, The Journal of Chemical Physics 145, 141101 (2016).
- Cao and Likhtman [2015] J. Cao and A. E. Likhtman, Simulating startup shear of entangled polymer melts, ACS Macro Letters 4, 1376 (2015).
- Daoud et al. [1975] M. Daoud, J. Cotton, B. Farnoux, G. Jannink, G. Sarma, H. Benoit, C. Duplessix, C. Picot, and de Gennes, Solutions of flexible polymers. neutron experiments and interpretation, Macromolecules 8, 804 (1975).
- Milner [2005] S. Milner, Predicting the tube diameter in melts and solutions, Macromolecules 38, 4929 (2005).
- Bobbili and Milner [2021] S. V. Bobbili and S. T. Milner, Measuring packing length in simulations for different polymer architectures, Journal of Rheology 65, 1245 (2021).
- Cheal and Ness [2018] O. Cheal and C. Ness, Rheology of dense granular suspensions under extensional flow, Journal of rheology 62, 501 (2018).
- Fang et al. [2018] Q. Fang, Y. Tian, H. Wu, and J. Li, Revealing the deformation mechanism of amorphous polyethylene subjected to cycle loading via molecular dynamics simulations, RSC advances 8, 32377 (2018).
- Li et al. [2023] H. Li, R. Ma, W. Zhang, S. Hu, X. Zhao, L. Zhang, and Y. Gao, Stress overshoot behavior in polymer nanocomposites filled with spherical nanoparticles under steady shear flow via molecular dynamics simulation, Materials Today Communications 35, 105573 (2023).
- Bobbili and Milner [2020] S. V. Bobbili and S. T. Milner, Simulation study of entanglement in semiflexible polymer melts and solutions, Macromolecules 53, 3861 (2020).