This paper was converted on www.awesomepapers.org from LaTeX by an anonymous user.
Want to know more? Visit the Converter page.

Generalized correlation based Imaging for satellites

Matan Leibovich11footnotemark: 1, George Papanicolaou222Institute for Computational and Mathematical Engineering, Stanford University, Stanford, CA 94305.
  ([email protected])Department of Mathematics, Stanford University, Stanford, CA 94305. ([email protected])
, and Chrysoula Tsogka333Applied Math Unit, University of California, Merced, 5200 North Lake Road, Merced, CA 95343 ([email protected])
Abstract

We consider imaging of fast moving small objects in space, such as low earth orbit satellites. The imaging system consists of ground based, asynchronous sources of radiation and several passive receivers above the dense atmosphere. We use the cross correlation of the received signals to reduce distortions from ambient medium fluctuations. Imaging with correlations also has the advantage of not requiring any knowledge about the probing pulse and depends weakly on the emitter positions. We account for the target’s orbital velocity by introducing the necessary Doppler compensation. We show that over limited imaging regions, a constant Doppler factor can be used, resulting in an efficient data structure for the correlations of the recorded signals. We then investigate and analyze different imaging methods using the cross-correlation data structure. Specifically, we show that using a generalized two point migration of the cross correlation data, the top eigenvector of the migrated data matrix provides superior image resolution compared to the usual single-point migration scheme. We carry out a theoretical analysis that illustrates the role of the two point migration methods as well as that of the inverse aperture in improving resolution. Extensive numerical simulations support the theoretical results and assess the scope of the imaging methodology.

1 Introduction

The imaging of satellites in low earth orbit is motivated by the need to detect and closely track small debris (1-10cm) revolving around the earth at altitudes in the range of 200200km-20002000km, [21]. The amount of debris has been growing steadily in recent years, substantially increasing the risk of satellite damage from collisions [20, 14]. There are roughly 700,000700{,}000 debris of size larger than 11cm in Low Earth Orbit (LEO) and there is concern that future collisions may lead to a chain reaction that will generate an unacceptably risky environment [22],[15]. In this paper, we model the small fast moving debris as point-like reflectors moving with constant velocity, 𝐯𝐓\mathbf{v}_{\mathbf{T}}.

The recorded data are the scattered signals from a train of incident pulses emitted by transmitters located on the ground. The receivers are assumed to be located at a height of 15 km or more. They span an area of diameter aa, which acts as the physical aperture of the imaging system. In synthetic aperture radar (SAR), a single airborne transmit/receive element is moving and its trajectory defines the synthetically created aperture of the imaging system [7, 9]. In a similar way, the trajectory of the moving target defines an inverse synthetic aperture (iSAR) of length S|𝐯𝐓|S|\mathbf{v}_{\mathbf{T}}|, with SS denoting the total time of data acquisition. Other important parameters of the imaging system are the central frequency, fof_{o}, and the bandwidth, BB of the probing signals as well as the pulse repetition frequency. We consider here emitters operating at high frequency with a relatively large bandwidth, such as the X-Band (8-12 GHz) with a bandwidth of up to 600 MHz.

Correlation-based imaging uses the cross correlations of the recorded signals between pairs of receivers. The signals are also Doppler compensated and synchronized. However, in this case the synchronization does not require knowledge of the emitter locations since only time differences matter in cross correlations. In correlation-based imaging we also do not need to know the pulse profile or the emission times but we need to record an extended train of scattered pulses. We assume that recording is done at a sufficiently high sampling rate so that signals can be recorded with no loss of information [3, 1]. Correlation-based imaging has been shown to be more robust to ambient medium fluctuations such as atmospheric lensing [16] and aberrations [19]. This is true for receivers that are not located on the ground but are located above the turbulent atmosphere, on drones for example. Indeed, considering airborne receivers transforms the passive correlation-based problem to a virtual source array imaging problem that has been studied for stationary receiver arrays in [10, 11, 12]. The key idea is that passive correlation-based imaging becomes equivalent to having a virtual active array at the location of the passive receivers. By moving the receivers above the turbulent atmosphere, the atmospheric fluctuation effects on imaging are minimized and imaging resolution is as if we were in a homogeneous, fluctuation free medium.

Correlation-based imaging is, in addition, passive because it can be carried out using opportunistic emitters with largely unknown properties. In the imaging setting considered in this paper, opportunistic sources could be global navigation satellite systems (GNSS). This has been considered in [18] and it is shown that the main challenge in this case is the low signal-to-noise ratio because the scattered signals received at terrestrial receivers are very weak.

The use of correlation based imaging for satellites is considered in [8], where its resolution is analyzed and compared to matched-filter based imaging. Matched-filter imaging depends linearly on the measurements, but requires knowing the position of the emitters with high accuracy, as well as the emitted pulse trains. It also lacks the robustness to medium fluctuations, contrary to correlation based imaging. It is shown in [8] that under certain conditions matched-filter and correlation based imaging attain comparable resolutions, indicating that correlation based imaging is a good method for LEO satellite imaging. The imaging functions introduced in [8] are a generalization of the well known Kirchhoff migration (KM), which forms an image by superposing the recorded signals after translating them by the travel time to a search location in the image region.

As was noted in [8], the resolution analysis is limited to well separated point scatterers. While this is a suitable choice with a linear imaging method, where more complicated scenarios are considered as superpositions of the single target case, this is no longer so when dealing with correlations, especially when there is interference between neighboring targets. In correlation based imaging, the abilities to localize and separate targets need to be addressed separately. We show in this paper that the single point scatterer resolution results do not generalize to multiple closely spaced scatterers in a straightforward manner. Another key result of [8] is that the resolution of the target depends only weakly on the inverse synthetic aperture. This seems to be counter intuitive as the correlation data still contains a significant amount of information. These observations have motivated us to consider other possible extensions of the imaging function.

1.1 Main result

In this paper we present a generalization of the migration method for correlations, which is motivated by the structure of the data. We first define a correlation data structure, which compensates for the Doppler effect on the measurements. We then show that out of this data structure a natural migration scheme arises, which translates the data to two points rather than one. This is natural when considering data correlations, and a similar migration scheme was recently used in [4]. The result of this migration is not an image but rather a two-point interference pattern. We show that there are several possible ways to derive an image from the two-point interference pattern, with one in particular that we call the rank-1 image. This rank-1 image is the result of taking the first eigenvector of the interference pattern, and it provides superior resolution. We demonstrate its superiority both in terms of favorable mathematical properties, such as having an optimization interpretation, as well as by providing analytical explanations of its performance. This is the main result of the paper.

Numerical simulations confirm that the resolution of the rank-1 image is better than that of the previously used correlation based imaging function, and achieves resolution comparable to that of linear migration, while retaining the benefits of imaging with correlations rather than with the data directly. The method is stable with respect to additive noise and can be applied to many other imaging problems.

The rest of the paper is as follows. In Section 2 we briefly review the model for our data (further expanded in Appendix A), and introduce the cross-correlation data structure. In Section 3 we recast the problem in matrix form and introduce the interference pattern, and the possible extensions of KM to cross-correlation data, particularly the rank-1 image. In Section 4 we present numerical simulations which confirm the superior performance of the rank-1 image. We motivate the results by further simulations in Section 5, and analysis in Appendix B and Appendix C. We conclude with a summary and conclusions in Section 6.

2 Correlation based imaging of fast moving objects

In this section we present the general form of the recorded signals and then review the basic algorithms of correlation based imaging with Doppler effects. We also introduce a cross-correlation data structure that is more efficient for imaging, which will be used in subsequent sections for introducing new imaging methods and comparing them with existing methods.

2.1 Scattered signal model

We want to image a cluster of objects, moving in Keplerian low earth orbit at a high velocity 𝐯L\mathbf{v}_{L}, so that without rotation for all the objects we have

𝐱𝐓(s)=𝐱𝐓+𝐯𝐓s.\mathbf{x}_{\mathbf{T}}(s)=\mathbf{x}_{\mathbf{T}}+\mathbf{v}_{\mathbf{T}}s. (2.1)

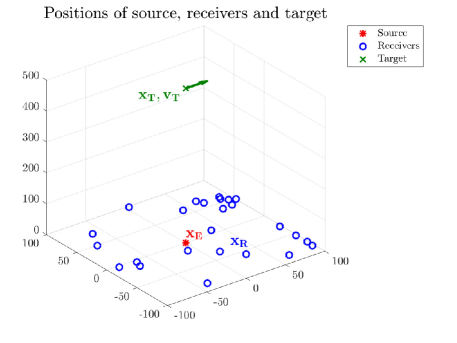
The data is the collection of signals recorded at ground based or at low elevation receivers, with positions 𝐱𝐑\mathbf{x}_{\mathbf{R}}. Successive pulses are emitted at a slow time ss by a source located at 𝐱𝐄\mathbf{x}_{\mathbf{E}} on the ground, as illustrated in Figure 1.

Refer to caption
Figure 1: iSAR imaging schematic. A network of receivers with positions 𝐱𝐑\mathbf{x}_{\mathbf{R}}, is randomly distributed over an area of 100 km ×\times 100 km at an altitude of 15 km. The source 𝐱𝐄\mathbf{x}_{\mathbf{E}} is on the ground, and the target 𝐱𝐓\mathbf{x}_{\mathbf{T}} is at 500 km elevation and moving at 77 km/s.

The receiver emits a series of pulses f(t)=cos(ωot)eB2t2/2f(t)=\cos(\omega_{o}t)e^{-B^{2}t^{2}/2}, at slow time intervals of Δs\Delta s, with a total aperture size SS, such that the recorded signal at the receiver location 𝐱𝐑\mathbf{x}_{\mathbf{R}} due to a pulse, f(s+t)f(s+t), emitted at slow time s[S/2,S/2]s\in[-S/2,S/2], is

u𝐑(s,t)=ρf′′(s+γ𝐑(𝐱𝐓(s),𝐱𝐄,𝐯𝐓)tt𝐑(𝐱𝐓(s),𝐱𝐄,𝐯𝐓))(4π|𝐱𝐓(s)𝐱𝐑|)2.u_{\mathbf{R}}(s,t)=-\rho\frac{f^{\prime\prime}(s+\gamma_{\mathbf{R}}(\mathbf{x}_{\mathbf{T}}(s),\mathbf{x}_{\mathbf{E}},\mathbf{v}_{\mathbf{T}})t-t_{\mathbf{R}}(\mathbf{x}_{\mathbf{T}}(s),\mathbf{x}_{\mathbf{E}},\mathbf{v}_{\mathbf{T}}))}{(4\pi|\mathbf{x}_{\mathbf{T}}(s)-\mathbf{x}_{\mathbf{R}}|)^{2}}. (2.2)

The derivation of (2.2) is in Appendix A. With c0c_{0} the speed of light, γ𝐑\gamma_{\mathbf{R}} is the Doppler scale correction factor and t𝐑t_{\mathbf{R}} is the signal travel time, which to first order in |𝐯𝐓|/c0|\mathbf{v}_{\mathbf{T}}|/c_{0} are given by

γ𝐑(𝐱𝐓,𝐱𝐄,𝐯𝐓)=1𝐯𝐓c0(𝐱𝐓𝐱𝐄|𝐱𝐓𝐱𝐄|+(𝐱𝐓𝐱𝐑|𝐱𝐓𝐱𝐑|),t𝐑(𝐱𝐓,𝐱𝐄,𝐯𝐓)=|𝐱𝐓𝐱𝐄|c0+|𝐱𝐓𝐱𝐑|c0γ𝐑(𝐱𝐓,𝐱𝐄,𝐯𝐓).\begin{split}&\gamma_{\mathbf{R}}(\mathbf{x}_{\mathbf{T}},\mathbf{x}_{\mathbf{E}},\mathbf{v}_{\mathbf{T}})=1-\frac{\mathbf{v}_{\mathbf{T}}}{c_{0}}\cdot\left(\frac{\mathbf{x}_{\mathbf{T}}-\mathbf{x}_{\mathbf{E}}}{|\mathbf{x}_{\mathbf{T}}-\mathbf{x}_{\mathbf{E}}|}+(\frac{\mathbf{x}_{\mathbf{T}}-\mathbf{x}_{\mathbf{R}}}{|\mathbf{x}_{\mathbf{T}}-\mathbf{x}_{\mathbf{R}}|}\right),\\ &t_{\mathbf{R}}(\mathbf{x}_{\mathbf{T}},\mathbf{x}_{\mathbf{E}},\mathbf{v}_{\mathbf{T}})=\frac{|\mathbf{x}_{\mathbf{T}}-\mathbf{x}_{\mathbf{E}}|}{c_{0}}+\frac{|\mathbf{x}_{\mathbf{T}}-\mathbf{x}_{\mathbf{R}}|}{c_{0}}\gamma_{\mathbf{R}}(\mathbf{x}_{\mathbf{T}},\mathbf{x}_{\mathbf{E}},\mathbf{v}_{\mathbf{T}}).\end{split} (2.3)

The formula (2.2) for the recorded data will be used in the theoretical resolution analysis.

An important consideration in the data recording process is the sampling frequency, which in currently available microwave acquisition systems is limited to about 2 GHz. Signals with higher carrier frequency need to be downramped before sampling, to avoid information loss. This is done with a heterodyne oscillator that shifts down the carrier frequency followed by low pass filtering. When using asynchronous emitters, the central frequency and bandwidth might not be known accurately. In that case the frequency of the oscillator and the sampling frequency need to be chosen so that loss of information is minimal.

2.2 Imaging with Doppler-scaled cross correlations

We use the cross correlations of the signals received at different receivers to image. In [8] the imaging function was defined via scaling and translating the signals at the receivers by different Doppler factors γ𝐑\gamma_{\mathbf{R}} for every point 𝐱,𝐯\mathbf{x},\mathbf{v} in the imaging domain

CC(𝐱,𝐯)=sj,𝐑,𝐑𝑑tu𝐑(sj,|𝐱𝐱𝐑|c0+tγ𝐑(𝐱,𝐱𝐄,𝐯))u𝐑(sj,|𝐱𝐱𝐑|c0+tγ𝐑(𝐱,𝐱𝐄,𝐯)).\mathcal{I}^{CC}(\mathbf{x},\mathbf{v})=\sum\limits_{s_{j},\mathbf{R},\mathbf{R}^{\prime}}\int dtu_{\mathbf{R}}\left(s_{j},\frac{|\mathbf{x}-\mathbf{x}_{\mathbf{R}}|}{c_{0}}+\frac{t}{\gamma_{\mathbf{R}}(\mathbf{x},\mathbf{x}_{\mathbf{E}},\mathbf{v})}\right)u_{\mathbf{R}^{\prime}}\left(s_{j},\frac{|\mathbf{x}-\mathbf{x}_{\mathbf{R}^{\prime}}|}{c_{0}}+\frac{t}{\gamma_{\mathbf{R^{\prime}}}(\mathbf{x},\mathbf{x}_{\mathbf{E}},\mathbf{v})}\right). (2.4)

This imaging function is a generalization of the regular Kirchhoff migration, which back propagates the recorded signals by the travel time to a specific search point in the image domain, but now at the level of cross correlations. The idea is that when migrating and correlating the data from the different receivers, the peaks of the signals sum coherently if a reflector exists at a point 𝐱\mathbf{x}, with velocity 𝐯\mathbf{v}, resulting in a peak for CC(𝐱,𝐯)\mathcal{I}^{CC}(\mathbf{x},\mathbf{v}) at that point. Since the rapid velocity affects the signal via γ𝐑\gamma_{\mathbf{R}}, the Doppler factor must be used when migrating the data. At low speeds and without the Doppler correction this imaging function reduces to the classical correlation based migration [13].

We assume here that the locations of the receivers 𝐱𝐑,𝐱𝐑\mathbf{x}_{\mathbf{R}},\mathbf{x}_{\mathbf{R}^{\prime}} are accurately known. The source location 𝐱𝐄\mathbf{x}_{\mathbf{E}} is also assumed to be known, but a lesser degree of accuracy is needed, since 𝐱𝐄\mathbf{x}_{\mathbf{E}} only affects γ𝐑\gamma_{\mathbf{R}} (see [8]). The formulation (2.4) is less advantageous for two reasons:

  1. 1.

    It is computationally ineffective to recompute the cross correlation for any point 𝐱\mathbf{x} in the imaging domain. It would be much more efficient to compute the cross correlations once for any triplet (sj,𝐑,𝐑)(s_{j},\mathbf{R},\mathbf{R}^{\prime}) as a function of τ\tau, the translation, and use that for imaging [13].

  2. 2.

    Important features in the image manifest themselves in the raw cross correlation data. In order to use the data intelligently one must define a data structure, as an intermediate step, before applying the imaging function.

We next define the Doppler-scaled cross correlation function C𝐑𝐑(s,τ)C_{\mathbf{R}\mathbf{R}^{\prime}}(s,\tau), and show how it can be used in the imaging problem.

2.3 Relative variation of the Doppler factor

In general, (2.3) shows that γ𝐑\gamma_{\mathbf{R}} is dependent on the target’s position and velocity. Having an accurate value for γ𝐑\gamma_{\mathbf{R}} is extremely important in calculating cross correlations, as small changes in the frequency support would greatly affect the outcome of the correlation integral and hence the resolution of the image. However, we can use prior information at our disposal to limit the image region. For example, 𝐯𝐓\mathbf{v}_{\mathbf{T}} can be estimated from the fact that the objects are assumed to be in a Keplerian orbit, i.e., |𝐯𝐓|2GMEarth𝐑𝐓|\mathbf{v}_{\mathbf{T}}|\approx\sqrt{\frac{2GM_{\text{Earth}}}{\mathbf{R}_{\mathbf{T}}}}. Accurate range measurements based on the signal’s bandwidth can be used to estimate 𝐑𝐓\mathbf{R}_{\mathbf{T}} and subsequently 𝐯𝐓\mathbf{v}_{\mathbf{T}}. Moreover, when forming an image we are usually interested in a limited search domain in space, based on auxiliary information. Of course γ𝐑\gamma_{\mathbf{R}} is a continuous function of 𝐱𝐓\mathbf{x}_{\mathbf{T}}, 𝐯𝐓\mathbf{v}_{\mathbf{T}}, such that if |𝐱𝐓𝐱0||\mathbf{x}_{\mathbf{T}}-\mathbf{x}_{0}|, |𝐯𝐓𝐯0||\mathbf{v}_{\mathbf{T}}-\mathbf{v}_{0}|, are small enough then

γ𝐑(𝐱𝐓,𝐱𝐄,𝐯𝐓)γ𝐑(𝐱𝟎,𝐱𝐄,𝐯0)1.\frac{\gamma_{\mathbf{R}}(\mathbf{x}_{\mathbf{T}},\mathbf{x}_{\mathbf{E}},\mathbf{v_{T}})}{\gamma_{\mathbf{R}}(\mathbf{x}_{\mathbf{0}},\mathbf{x}_{\mathbf{E}},\mathbf{v}_{0})}\approx 1. (2.5)

In our numerical simulations over an image window of size 1010m×10\times 10m×10\times 10m, γ𝐑\gamma_{\mathbf{R}} varies at most by 0.000010.00001%. For signals with our frequency support and time duration, γ𝐑\gamma_{\mathbf{R}} can be very well approximated by a constant in the imaging domain.

2.4 The cross-correlation data structure in iSAR

Relying upon the weak variation of γ𝐑\gamma_{\mathbf{R}}, we use a rescaled signal to image over the image window, rather than rescaling the signal for every point in the image window as was done in [8](eq. 3.6). Specifically, we construct C𝐑𝐑(s,τ)C_{\mathbf{RR}^{\prime}}(s,\tau) by scaling the signal received by a reference Doppler factor,

u~𝐑,𝐱0,𝐯0(s,t)=u𝐑(s,tγ𝐑(𝐱0,𝐱𝐄,𝐯𝟎)).\tilde{u}_{\mathbf{R},\mathbf{x}_{0},\mathbf{v}_{0}}(s,t)=u_{\mathbf{R}}\left(s,\frac{t}{\gamma_{\mathbf{R}}(\mathbf{x}_{0},\mathbf{x}_{\mathbf{E}},\mathbf{v_{0}})}\right). (2.6)

Note that for a reflector with a trajectory 𝐱𝐓,𝐯𝐓\mathbf{x}_{\mathbf{T}},\mathbf{v}_{\mathbf{T}}, the received signal has the form

u~𝐑,𝐱0,𝐯0(s,t)=ρf′′(s+γ𝐑(𝐱𝐓,𝐱𝐄,𝐯𝐓)γ𝐑(𝐱0,𝐱𝐄,𝐯𝟎)tt𝐑)(4π|𝐱𝐓𝐱𝐑|)2ρf′′(s+tt𝐑)(4π|𝐱𝐓𝐱𝐑|)2.\tilde{u}_{\mathbf{R},\mathbf{x}_{0},\mathbf{v}_{0}}(s,t)=-\rho\frac{f^{\prime\prime}(s+\frac{\gamma_{\mathbf{R}}(\mathbf{x}_{\mathbf{T}},\mathbf{x}_{\mathbf{E}},\mathbf{v_{T}})}{\gamma_{\mathbf{R}}(\mathbf{x}_{0},\mathbf{x}_{\mathbf{E}},\mathbf{v_{0}})}t-t_{\mathbf{R}})}{(4\pi|\mathbf{x}_{\mathbf{T}}-\mathbf{x}_{\mathbf{R}}|)^{2}}\approx-\rho\frac{f^{\prime\prime}(s+t-t_{\mathbf{R}})}{(4\pi|\mathbf{x}_{\mathbf{T}}-\mathbf{x}_{\mathbf{R}}|)^{2}}. (2.7)

We define the cross correlation function as well,

C𝐑𝐑(s,τ)=𝑑tu~𝐑,𝐱0,𝐯0(s,t+t𝐑(𝐱0+s𝐯0,𝐱𝐄,𝐯))u~𝐑,𝐱0,𝐯0(s,t+t𝐑(𝐱0+s𝐯0,𝐱𝐄,𝐯)+τ).\begin{split}C_{\mathbf{RR}^{\prime}}(s,\tau)=\int dt\tilde{u}_{\mathbf{R},\mathbf{x}_{0},\mathbf{v}_{0}}(s,t+t_{\mathbf{R}}(\mathbf{x}_{0}+s\mathbf{v}_{0},\mathbf{x}_{\mathbf{E}},\mathbf{v}))\tilde{u}_{\mathbf{R}^{\prime},\mathbf{x}_{0},\mathbf{v}_{0}}(s,t+t_{\mathbf{R}^{\prime}}(\mathbf{x}_{0}+s\mathbf{v}_{0},\mathbf{x}_{\mathbf{E}},\mathbf{v})+\tau).\end{split} (2.8)

Using (2.7), the imaging function (2.4) reduces to

CC(𝐱,𝐯)=s,𝐑,𝐑C𝐑𝐑(s,τs(𝐱,𝐯)),\mathcal{I}^{CC}(\mathbf{x},\mathbf{v})=\sum\limits_{s,\mathbf{R},\mathbf{R}^{\prime}}C_{\mathbf{RR}^{\prime}}(s,\tau^{s}(\mathbf{x},\mathbf{v})), (2.9)

where

τs(𝐱,𝐯)=t𝐑𝐱(s)t𝐑𝐱(s)Δτ𝐑𝐑s,𝐱(s)=𝐱+s𝐯,t𝐑𝐱(𝐱,𝐱𝐄,𝐯)=|𝐱𝐱𝐄|c0+|𝐱𝐱𝐑|c0γ𝐑(𝐱,𝐱𝐄,𝐯),Δτ𝐑𝐑s=t𝐑(𝐱0+s𝐯0,𝐱𝐄,𝐯)t𝐑(𝐱0+s𝐯0,𝐱𝐄,𝐯).\begin{split}&\tau^{s}(\mathbf{x},\mathbf{v})=t_{\mathbf{R^{\prime}}}^{\mathbf{x}(s)}-t_{\mathbf{R}}^{\mathbf{x}(s)}-\Delta\tau^{s}_{\mathbf{RR}^{\prime}},\quad\mathbf{x}(s)=\mathbf{x}+s\mathbf{v},\\ &t_{\mathbf{R}}^{\mathbf{x}}(\mathbf{x},\mathbf{x}_{\mathbf{E}},\mathbf{v})=\frac{|\mathbf{x}-\mathbf{x}_{\mathbf{E}}|}{c_{0}}+\frac{|\mathbf{x}-\mathbf{x}_{\mathbf{R}}|}{c_{0}}\gamma_{\mathbf{R}}(\mathbf{x},\mathbf{x}_{\mathbf{E}},\mathbf{v}),\\ &\Delta\tau^{s}_{\mathbf{RR^{\prime}}}=t_{\mathbf{R}^{\prime}}(\mathbf{x}_{0}+s\mathbf{v}_{0},\mathbf{x}_{\mathbf{E}},\mathbf{v})-t_{\mathbf{R}}(\mathbf{x}_{0}+s\mathbf{v}_{0},\mathbf{x}_{\mathbf{E}},\mathbf{v}).\end{split} (2.10)

Notice that t𝐑𝐱t^{\mathbf{x}}_{\mathbf{R}} is still dependent on γ𝐑(𝐱,𝐱𝐄,𝐯)\gamma_{\mathbf{R}}(\mathbf{x},\mathbf{x}_{\mathbf{E}},\mathbf{v}). The imaging function in (2.9) migrates the cross correlation data to a search point 𝐱\mathbf{x}, based on the expected travel time difference between the signals recorded at both receivers 𝐑,𝐑\mathbf{R},\mathbf{R}^{\prime}. This is possible because we have adequately scaled the fields with respect to a specific search region, such that C𝐑𝐑(s,τ)C_{\mathbf{R}\mathbf{R}^{\prime}}(s,\tau) is only dependent on travel time differences. Note also that the recorded signals are time shifted by the sum of the travel times from the source to the center of the image window plus the travel time from the center of the image window to the receiver. This ensures that C𝐑𝐑(s,τ)C_{\mathbf{RR}^{\prime}}(s,\tau) is supported around τ=0\tau=0.

The imaging function (2.9) is an extension of the classical Kirchhoff Migration (KM) imaging function in the linear case, where the travel times are used to migrate the field

KM(𝐱,𝐯)=s,𝐑u~𝐑,𝐱0,𝐯0(s,t𝐑𝐱(𝐱,𝐱𝐄,𝐯)).\mathcal{I}^{\text{KM}}(\mathbf{x},\mathbf{v})=\sum\limits_{s,\mathbf{R}}\tilde{u}_{\mathbf{R},\mathbf{x}_{0},\mathbf{v}_{0}}(s,t_{\mathbf{R}}^{\mathbf{x}}(\mathbf{x},\mathbf{x}_{\mathbf{E}},\mathbf{v})). (2.11)

Thus, we can break down the imaging problem into two separate steps:

  1. 1.

    In the first step, the trajectory and fast linear motion of the object is estimated and thereafter assumed known. The relevant imaging domain can then be taken to be small enough so that the approximation of the ratio (2.5) holds. We express the estimated motion of the center of the image window as 𝐱𝐋(s),(𝐱𝐋,𝐯𝐋)\mathbf{x}_{\mathbf{L}}(s),(\mathbf{x}_{\mathbf{L}},\mathbf{v}_{\mathbf{L}}), where

    𝐱𝐋(s)=𝐱𝐋+s𝐯𝐋.\mathbf{x}_{\mathbf{L}}(s)=\mathbf{x}_{\mathbf{L}}+s\mathbf{v}_{\mathbf{L}}. (2.12)

    Alternatively, we can use prior information about the trajectory to center the image window.

  2. 2.

    We then substitute in (2.8) 𝐱𝐋(s)\mathbf{x}_{\mathbf{L}}(s) for 𝐱0\mathbf{x}_{0} and 𝐯𝐋\mathbf{v}_{\mathbf{L}} for 𝐯0\mathbf{v}_{0} to compute the cross-correlation C𝐑𝐑(s,τ)C_{\mathbf{R}\mathbf{R}^{\prime}}(s,\tau).

3 Generalized migration schemes for correlation based imaging

The imaging function defined in (2.4) has been analyzed in [8], where its resolution was also compared to that of the matched filter imaging function. While Kirchhoff migration arises naturally in regular SAR/iSAR as the action of the adjoint forward operator applied to the recorded data, this is not necessarily a natural choice when the image is to be formed using correlations of the data. Moreover, as mentioned Section 1, unlike in classic KM the resolution only weakly depends on the synthetic aperture. Numerical simulations with correlation based imaging suggest deterioration of the resolution when multiple reflectors are not well separated, or when there is a contrast in the reflectivity, with strong and weak reflectors in the same image window. The two-point migration introduced below in Section 3.3 addresses these issues.

As a first step, we want to express the scaled cross correlation data structure C𝐑𝐑(s,τ)C_{\mathbf{RR^{\prime}}}(s,\tau) in (2.8) in terms of the medium reflectivity. We shall use that to introduce extensions of the migration imaging function to cross correlation data.

3.1 The model for the cross correlation data

Assume we have discretized the medium in a small image window relative to its moving center 𝐱𝐋(s)\mathbf{x}_{\mathbf{L}}(s), as in (2.12), with grid points 𝐲k\mathbf{y}_{k} and 𝐲k=0\mathbf{y}_{k}=0 corresponds to the center of the window. The unknown reflectivity is discretized by its values on this grid

ρk=ρ(𝐲k),k=1,,K.\rho_{k}=\rho(\mathbf{y}_{k}),\hskip 1.00006ptk=1,\dots,K.

The unknown reflectivity vector has dimension KK, which is the number of pixels in the image window. Most of these reflectivities are zero because there are usually few relatively strong reflectors that can be imaged, that is, we can estimate their location in the image window and their strength. We assume the image window is small enough so that the Doppler term γ𝐑\gamma_{\mathbf{R}} is constant over it, as explained in Section 2.

We saw in (2.7) that the signal recorded at receiver location 𝐱𝐑\mathbf{x}_{\mathbf{R}} can be written, after an appropriate scaling, as

u~𝐑,𝐱𝐋(s),𝐯𝐋(s,t)k=1Kρkf′′(s+t(t𝐑k(s)t𝐑(s)))(4π|𝐱𝐋(s)𝐱𝐑|)2,\tilde{u}_{\mathbf{R},\mathbf{x}_{\mathbf{L}}(s),\mathbf{v}_{\mathbf{L}}}(s,t)\approx-\sum\limits_{k=1}^{K}\rho_{k}\frac{f^{\prime\prime}(s+t-(t^{k}_{\mathbf{R}}(s)-t_{\mathbf{R}}(s)))}{(4\pi|\mathbf{x}_{\mathbf{L}(s)}-\mathbf{x}_{\mathbf{R}}|)^{2}}, (3.13)

where

t𝐑k(s)=t𝐑(𝐱𝐋(s)+𝐲k,𝐱𝐄,𝐯)=|𝐱𝐋(s)+𝐲k𝐱𝐄|c0+|𝐱𝐋(s)+𝐲k𝐱𝐑|c0γ𝐑(𝐱𝐋(s)+𝐲k,𝐱𝐄,𝐯),t𝐑(s)=t𝐑(𝐱𝐋(s),𝐱𝐄,𝐯).\begin{split}t_{\mathbf{R}}^{k}(s)&=t_{\mathbf{R}}(\mathbf{x}_{\mathbf{L}}(s)+\mathbf{y}_{k},\mathbf{x}_{\mathbf{E}},\mathbf{v})=\frac{|\mathbf{x}_{\mathbf{L}}(s)+\mathbf{y}_{k}-\mathbf{x}_{\mathbf{E}}|}{c_{0}}+\frac{|\mathbf{x}_{\mathbf{L}}(s)+\mathbf{y}_{k}-\mathbf{x}_{\mathbf{R}}|}{c_{0}}\gamma_{\mathbf{R}}(\mathbf{x}_{\mathbf{L}}(s)+\mathbf{y}_{k},\mathbf{x}_{\mathbf{E}},\mathbf{v}),\\ t_{\mathbf{R}}(s)&=t_{\mathbf{R}}(\mathbf{x}_{\mathbf{L}}(s),\mathbf{x}_{\mathbf{E}},\mathbf{v}).\end{split} (3.14)

In the frequency domain the recorded signal is

u^𝐑,𝐱L(s),𝐯L(s,ω)k=1Kρkω2f^(ω)(4π|𝐱𝐋(s)𝐱𝐑|)2eiω(t𝐑k(s)t𝐑(s))k=1Kω2f^(ω)(4π|𝐱𝐋(s)𝐱𝐑|)2A𝐑,k(s,ω)ρk,\widehat{u}_{\mathbf{R},\mathbf{x}_{L}(s),\mathbf{v}_{L}}(s,\omega)\approx\sum\limits_{k=1}^{K}\rho_{k}\omega^{2}\frac{\widehat{f}(\omega)}{(4\pi|\mathbf{x}_{\mathbf{L}}(s)-\mathbf{x}_{\mathbf{R}}|)^{2}}e^{i\omega(t_{\mathbf{R}}^{k}(s)-t_{\mathbf{R}}(s))}\equiv\sum\limits_{k=1}^{K}\frac{\omega^{2}\widehat{f}(\omega)}{(4\pi|\mathbf{x}_{\mathbf{L}}(s)-\mathbf{x}_{\mathbf{R}}|)^{2}}A_{\mathbf{R},k}(s,\omega)\rho_{k}, (3.15)

with

A𝐑,k(s,ω)=eiω(t𝐑k(s)t𝐑(s)).A_{\mathbf{R},k}(s,\omega)=e^{i\omega(t_{\mathbf{R}}^{k}(s)-t_{\mathbf{R}}(s))}. (3.16)

The phase A𝐑,k(s,ω)A_{\mathbf{R},k}(s,\omega) comes from the reduced travel time from the target to the receiver, relative to that of the image window center.

We assume the distance from the reflectors to the different receivers doesn’t vary greatly, hence we can approximate

ω2f^(ω)(4π|𝐱𝐋(s)𝐱𝐑|)2ξ(ω,s),\frac{\omega^{2}\widehat{f}(\omega)}{(4\pi|\mathbf{x}_{\mathbf{L}}(s)-\mathbf{x}_{\mathbf{R}}|)^{2}}\approx\xi(\omega,s), (3.17)

i.e, we neglect the dependence of the amplitude factor on a specific receiver. By using this approximation we compromise the accuracy in which the amplitude of the reflector is retrieved. However, for most applications, the support and the relative reflectivities of the scatterers are of the greatest importance. Using this notation, and the fact that correlation in time is equivalent to multiplication in frequency, we get that

C^𝐑𝐑(s,ω)=u^𝐑,𝐱L(s),𝐯L(s,ω)u^𝐑,𝐱L(s),𝐯L(s,ω)¯=|ξ(ω,s)|2k,k=1KA𝐑,k(s,ω)A𝐑,k(s,ω)¯ρkρk=|ξ(ω,s)|2k,k=1KA𝐑,k(s,ω)A𝐑,k(s,ω)¯ρkρk.\begin{split}\widehat{C}_{\mathbf{R}\mathbf{R}^{\prime}}(s,\omega)=&\widehat{u}_{\mathbf{R},\mathbf{x}_{L}(s),\mathbf{v}_{L}}(s,\omega)\overline{\widehat{u}_{\mathbf{R}^{\prime},\mathbf{x}_{L}(s),\mathbf{v}_{L}}(s,\omega)}=|\xi(\omega,s)|^{2}\sum\limits_{k,k^{\prime}=1}^{K}A_{\mathbf{R},k}(s,\omega)\overline{A_{\mathbf{R}^{\prime},k^{\prime}}(s,\omega)}\rho_{k}\rho_{k^{\prime}}\\ &=|\xi(\omega,s)|^{2}\sum\limits_{k,k^{\prime}=1}^{K}A_{\mathbf{R},k}(s,\omega)\overline{A_{\mathbf{R}^{\prime},k^{\prime}}(s,\omega)}\rho_{k}\rho_{k^{\prime}}.\end{split} (3.18)

3.2 Matrix formulation of the forward model

We introduce matrix notation that relates our model for reflectivities to the cross correlation data. Denote by 𝝆\boldsymbol{\rho} the unknown reflectivities in vector form

𝝆=[ρ1,,ρK]TK.\boldsymbol{\rho}=[\rho_{1},\dots,\rho_{K}]^{T}\in\mathbb{R}^{K}.

Denote 𝐀(s,ω)\mathbf{A}(s,\omega), our model for the migration matrix, has dimensions NR×KN_{R}\times K and entries A𝐑,k(s,ω)A_{\mathbf{R},k}(s,\omega). This matrix 𝐀(s,ω)\mathbf{A}(s,\omega) acts on the reflectivities and returns data. Denote the recorded signal data as an NRN_{R} vector vector 𝐮^R(s,ω)\widehat{\mathbf{u}}_{R}(s,\omega) whose entries are given by (3.15). The cross correlation data is also a matrix, of dimension NR×NRN_{R}\times N_{R}, 𝐂^(s,ω)\widehat{\mathbf{C}}(s,\omega) with entries C^𝐑𝐑(s,ω).\widehat{C}_{\mathbf{R}\mathbf{R}^{\prime}}(s,\omega).

Combining these, we have in matrix form the following model for the recorded signal data vector 𝐮^𝐑(s,ω)\widehat{\mathbf{u}}_{\mathbf{R}}(s,\omega) and cross correlation data matrix 𝐂^(s,ω)\widehat{\mathbf{C}}(s,\omega)

𝐮^𝐑(s,ω)=𝐀(s,ω)𝝆,\widehat{\mathbf{u}}_{\mathbf{R}}(s,\omega)=\mathbf{A}(s,\omega)\boldsymbol{\rho}, (3.19)
𝐂^(s,ω)=𝐮^𝐑(s,ω)𝐮^𝐑(s,ω)¯T=|ξ(ω,s)|2(𝐀(s,ω)𝝆)(𝐀(s,ω)𝝆)¯T=|ξ(ω,s)|2𝐀(s,ω)𝝆𝝆T𝐀(s,ω)¯T.\widehat{\mathbf{C}}(s,\omega)=\widehat{\mathbf{u}}_{\mathbf{R}}(s,\omega)\overline{\widehat{\mathbf{u}}_{\mathbf{R}}(s,\omega)}^{T}=|\xi(\omega,s)|^{2}(\mathbf{A}(s,\omega)\boldsymbol{\rho})\overline{(\mathbf{A}(s,\omega)\boldsymbol{\rho})}^{T}=|\xi(\omega,s)|^{2}\mathbf{A}(s,\omega)\boldsymbol{\rho}\boldsymbol{\rho}^{T}\overline{\mathbf{A}(s,\omega)}^{T}. (3.20)

We denote by 𝐗=𝝆𝝆T,Xkk=ρkρk\mathbf{X}=\boldsymbol{\rho}\boldsymbol{\rho}^{T},X_{kk^{\prime}}=\rho_{k}\rho_{k^{\prime}}, the outer product of reflectivities, then our model in matrix form is

𝐂^(s,ω)=|ξ(ω,s)|2𝐀(s,ω)𝐗𝐀(s,ω)¯T.\widehat{\mathbf{C}}(s,\omega)=|\xi(\omega,s)|^{2}\mathbf{A}(s,\omega)\mathbf{X}\overline{\mathbf{A}(s,\omega)}^{T}. (3.21)

The cross correlations depend on the reflectivities 𝝆\boldsymbol{\rho} through their outer product 𝐗=𝝆𝝆T\mathbf{X}=\boldsymbol{\rho}\boldsymbol{\rho}^{T}. As a result there can be several different extensions of Kirchhoff migration to cross correlations, which we investigate in the next section.

3.3 Imaging functions for cross correlation data

Given the data 𝐮^𝐑(s,ω)\widehat{\mathbf{u}}_{\mathbf{R}}(s,\omega) and the model 𝐮^𝐑(s,ω)=𝐀(s,ω)𝝆\widehat{\mathbf{u}}_{\mathbf{R}}(s,\omega)=\mathbf{A}(s,\omega)\boldsymbol{\rho}, Kirchhoff migration of the data 𝐮^𝐑(s,ω)\widehat{\mathbf{u}}_{\mathbf{R}}(s,\omega) is given by

𝝆~=s,ω𝐀(s,ω)¯T𝐮^𝐑(s,ω).\tilde{\boldsymbol{\rho}}=\sum\limits_{s,\omega}\overline{\mathbf{A}(s,\omega)}^{T}\widehat{\mathbf{u}}_{\mathbf{R}}(s,\omega). (3.22)

Identifying 𝝆~k=ρ~(𝐲k)\tilde{\boldsymbol{\rho}}_{k}=\tilde{\rho}(\mathbf{y}_{k}), (3.22) is a discretized version of the imaging function in (2.11), KM(𝐲k,𝐯𝐓)\mathcal{I}^{KM}(\mathbf{y}_{k},\mathbf{v}_{\mathbf{T}}).

Kirchhoff migration is usually derived by considering the solution of the ordinary least square (OLS) optimization problem. While the solution of OLS involves the pseudo-inverse of the forward matrix, it is common to approximate it as diagonal for imaging problems, which is well justified for separated targets. In that case, OLS and Kirchhoff migration yield the same support. Kirchhoff migration can also be interpreted as the solution of a different constrained optimization problem, related to the forward models of (3.19). Neglecting the scales ξ(ω,s)\xi(\omega,s), we can interpret migration as looking for the set of reflectivities that yield the set of signals most correlated with our measurements, under a norm constraint.

𝝆~=argmaxϱ2=cs,ω𝐀(s,ω)ϱ,𝐮^𝐑=argmaxϱ2=cϱ,s,ω𝐀(s,ω)¯T𝐮^𝐑𝝆^s,ω𝐀(s,ω)¯T𝐮^𝐑(s,ω).\begin{split}\tilde{\boldsymbol{\rho}}=\arg\max\limits_{\|\boldsymbol{\varrho}\|_{2}=c}\sum\limits_{s,\omega}\langle\mathbf{A}(s,\omega)\boldsymbol{\varrho},\widehat{\mathbf{u}}_{\mathbf{R}}\rangle=\arg\max\limits_{\|\boldsymbol{\varrho}\|_{2}=c}\langle\boldsymbol{\varrho},\sum\limits_{s,\omega}\overline{\mathbf{A}(s,\omega)}^{T}\widehat{\mathbf{u}}_{\mathbf{R}}\rangle\Rightarrow\widehat{\boldsymbol{\rho}}\propto\sum\limits_{s,\omega}\overline{\mathbf{A}(s,\omega)}^{T}\widehat{\mathbf{u}}_{\mathbf{R}}(s,\omega).\end{split} (3.23)

While the solution of OLS for the cross correlation model (3.21) involves writing 𝐂^(s,ω)\widehat{\mathbf{C}}(s,\omega) as a vector and the matrix multiplication operations as matrix-vector multiplication, (3.23) has a direct extension for the model of(3.21). With abuse of notation for matrices A,BA,B A,B=tr(BTA)\langle A,B\rangle=\text{tr}(B^{T}A). Neglecting the scales ξ(ω,s)\xi(\omega,s) again, we have

𝐗~=argmax𝐗2=cs,ω𝐀(s,ω)𝐗𝐀(s,ω)¯T,𝐂^𝐑𝐑(s,ω)=s,ω𝐗,𝐀(s,ω)¯T𝐂^𝐑𝐑(s,ω)𝐀(s,ω)=𝐗,s,ω𝐀(s,ω)¯T𝐂^𝐑𝐑(s,ω)𝐀(s,ω)𝐗~s,ω𝐀(s,ω)¯T𝐂^(s,ω)𝐀(s,ω).\begin{split}\tilde{\mathbf{X}}&=\arg\max\limits_{\|\mathbf{X}\|_{2}=c}\sum\limits_{s,\omega}\langle\mathbf{A}(s,\omega)\mathbf{X}\overline{\mathbf{A}(s,\omega)}^{T},\widehat{\mathbf{C}}_{\mathbf{R}\mathbf{R}^{\prime}}(s,\omega)\rangle=\sum\limits_{s,\omega}\langle\mathbf{X},\overline{\mathbf{A}(s,\omega)}^{T}\widehat{\mathbf{C}}_{\mathbf{R}\mathbf{R}^{\prime}}(s,\omega)\mathbf{A}(s,\omega)\rangle\\ &=\langle\mathbf{X},\sum\limits_{s,\omega}\overline{\mathbf{A}(s,\omega)}^{T}\widehat{\mathbf{C}}_{\mathbf{R}\mathbf{R}^{\prime}}(s,\omega)\mathbf{A}(s,\omega)\rangle\Rightarrow\tilde{\mathbf{X}}\propto\sum\limits_{s,\omega}\overline{\mathbf{A}(s,\omega)}^{T}\widehat{\mathbf{C}}(s,\omega)\mathbf{A}(s,\omega).\end{split} (3.24)

As a result, a natural extension of the migration of (3.22) for migrating cross correlations is the matrix 𝐗~\tilde{\mathbf{X}}

𝐗~=s,ω𝐀(s,ω)¯T𝐂^(s,ω)𝐀(s,ω),\tilde{\mathbf{X}}=\sum\limits_{s,\omega}\overline{\mathbf{A}(s,\omega)}^{T}\widehat{\mathbf{C}}(s,\omega)\mathbf{A}(s,\omega), (3.25)

with elements

X~kk=s,ω,𝐑,𝐑A¯𝐑,k(s,ω)C^𝐑,𝐑(s,ω)A𝐑,k(s,ω).\tilde{X}_{kk^{\prime}}=\sum\limits_{s,\omega,\mathbf{R},\mathbf{R}^{\prime}}\overline{A}_{\mathbf{R},k}(s,\omega)\widehat{C}_{\mathbf{R},\mathbf{R}^{\prime}}(s,\omega)A_{\mathbf{R}^{\prime},k^{\prime}}(s,\omega). (3.26)

As expected, the result of the migration is an estimation of 𝐗\mathbf{X} rather than 𝝆\boldsymbol{\rho}, as our model is quadratic with respect to the reflectivities. 𝐗~\tilde{\mathbf{X}} is a square matrix with dimensions K×KK\times K, where KK is the number of search points in the imaging domain. If points 𝐲k,𝐲k\mathbf{y}_{k},\mathbf{y}_{k^{\prime}} are associated with reflectivities ρk,ρk\rho_{k},\rho_{k^{\prime}}, we can think about 𝐗~\tilde{\mathbf{X}} as a two-variable generalized cross correlation imaging function

GCC(𝐲k,𝐲k)=X~kk.\mathcal{I}^{GCC}(\mathbf{y}_{k},\mathbf{y}_{k^{\prime}})=\tilde{X}_{kk^{\prime}}. (3.27)

Note that 𝐗~K×K\tilde{\mathbf{X}}\in\mathbb{C}^{K\times K} is Hermitian positive definite by definition. We next see how can an image be extracted from GCC\mathcal{I}^{GCC}.

3.4 Imaging with migrated cross correlation data

The imaging function (3.27) lacks a direct physical interpretation. It evaluates the outer product of reflectivities rather than the reflecitivities themselves. We shall see that several ways to extract 𝝆\boldsymbol{\rho} exist, not all equal in general.

If 𝐗~\tilde{\mathbf{X}} was exactly rank-1, i.e. 𝐗~=𝝆𝝆T\tilde{\mathbf{X}}=\boldsymbol{\rho}\boldsymbol{\rho}^{T}, there would be several ways to extract 𝝆\boldsymbol{\rho}.

  1. 1.

    |ρk|2=X~kk|\rho_{k}|^{2}=\tilde{X}_{kk}. This is equivalent to (2.9), since the diagonal terms recreate the image generate by migrating the data to the same point 𝐲k=𝐲k\mathbf{y}_{k}=\mathbf{y}_{k^{\prime}}

    s,ω,𝐑,𝐑A¯𝐑,k(s,ω)C^𝐑,𝐑(s,ω)A𝐑,k(s,ω)=s,𝐑,𝐑,ω𝐂^𝐑𝐑(s,ω)eiω(t𝐑k(s)t𝐑(s))eiω(t𝐑k(s)t𝐑(s))s,𝐑,𝐑𝐂𝐑𝐑(s,t𝐑k(s)t𝐑(s)(t𝐑k(s)t𝐑(s))).\begin{split}&\sum\limits_{s,\omega,\mathbf{R},\mathbf{R}^{\prime}}\overline{A}_{\mathbf{R},k}(s,\omega)\widehat{C}_{\mathbf{R},\mathbf{R}^{\prime}}(s,\omega)A_{\mathbf{R}^{\prime},k^{\prime}}(s,\omega)=\sum\limits_{s,\mathbf{R},\mathbf{R}^{\prime},\omega}\widehat{\mathbf{C}}_{\mathbf{R}\mathbf{R}^{\prime}}(s,\omega)e^{i\omega(t_{\mathbf{R}}^{k}(s)-t_{\mathbf{R}}(s))}e^{-i\omega(t_{\mathbf{R}^{\prime}}^{k}(s)-t_{\mathbf{R}^{\prime}}(s))}\\ &\propto\sum\limits_{s,\mathbf{R},\mathbf{R}^{\prime}}\mathbf{C}_{\mathbf{R}\mathbf{R}^{\prime}}(s,t_{\mathbf{R}}^{k}(s)-t_{\mathbf{R}}(s)-(t_{\mathbf{R}^{\prime}}^{k}(s)-t_{\mathbf{R}^{\prime}}(s))).\end{split} (3.28)

    In terms of (3.27) the image is evaluated by plugging in the same search point in both variables

    CC(𝐲k)=GCC(𝐲k,𝐲k).\mathcal{I}^{CC}(\mathbf{y}_{k})=\mathcal{I}^{GCC}(\mathbf{y}_{k},\mathbf{y}_{k}).
  2. 2.

    |ρk|2X~kkref,kref[1,,K]|\rho_{k}|^{2}\propto\tilde{X}_{kk_{\text{r}ef}},k_{\text{r}ef}\in[1,\dots,K]
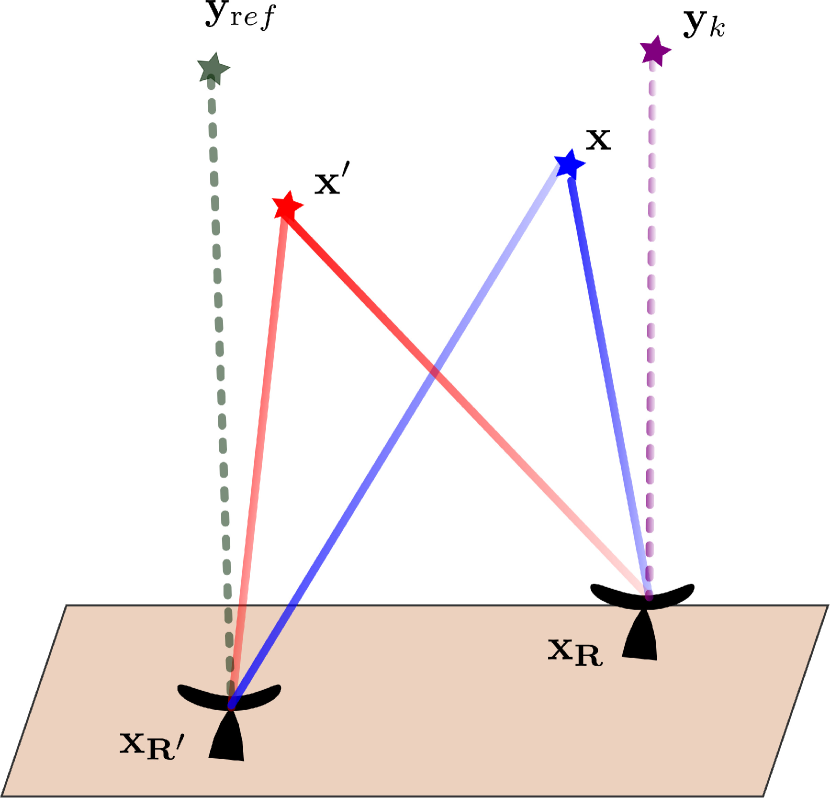
. This is equivalent to migrating the data to a reference point with respect to one of the receiver pairs and forming an image by migrating the other receiver to a search point. In terms of (3.27) the image is evaluated by plugging a reference term in the first variable and a search point in the other

    refCC(𝐲k)=GCC(𝐲k,𝐲ref).\mathcal{I}^{{\text{r}ef}CC}(\mathbf{y}_{k})=\mathcal{I}^{GCC}(\mathbf{y}_{k},\mathbf{y}_{\text{ref}}).
  3. 3.

    |ρk|2=|𝐯1(𝐗~)|k2|\rho_{k}|^{2}=|\mathbf{v}_{1}(\tilde{\mathbf{X}})|^{2}_{k}, i.e., calculate the top eigenvector of 𝐗~\tilde{\mathbf{X}}. In terms of (3.27) the image is evaluated by taking, 𝒱(𝐲k)\mathcal{V}(\mathbf{y}_{k}), the first eigenvector of GCC(𝐲k,𝐲k)\mathcal{I}^{GCC}(\mathbf{y}_{k},\mathbf{y}_{k^{\prime}}), thought of as a matrix

    R1CC(𝐲k)=𝒱(𝐲k).\mathcal{I}^{R1CC}(\mathbf{y}_{k})=\mathcal{V}(\mathbf{y}_{k}).

    We call this the rank-1 image.

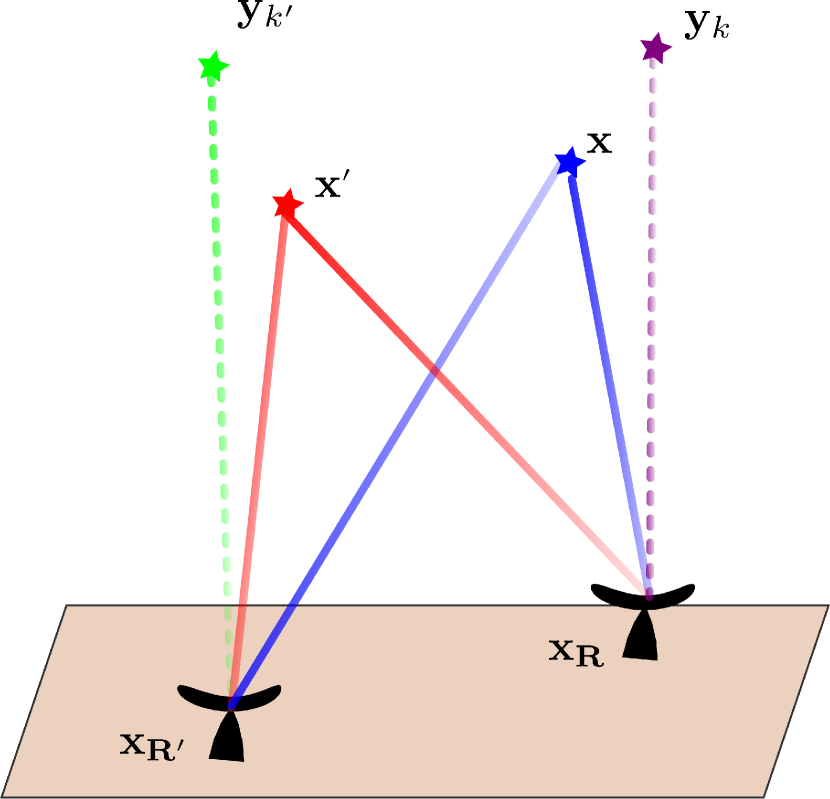
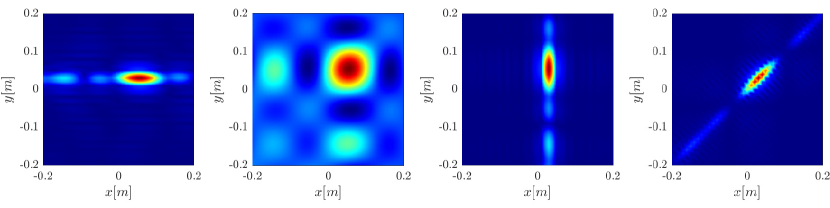
The different methods are illustrated in Figure 2.

Refer to caption
(a)
Refer to caption
(b)
Refer to caption
(c)
Figure 2: Illustration of different migration schemes. The cross correlated data of receiver pairs contain both signals generated by the same reflector and signals that were generate by different reflectors. The migration scheme determines how the data is to be treated. (a)(a) Single point migration: Only the signals that arrive at both receivers from the same reflector would be summed coherently. The result of the migration is GCC(𝐲k,𝐲k)=CC(𝐲k)\mathcal{I}^{GCC}(\mathbf{y}_{k},\mathbf{y}_{k})=\mathcal{I}^{CC}(\mathbf{y}_{k}); (b)(b) Reference point migration: One of the receiver pairs is always migrated to the same point- if a strong reflector exists there, one could expect strong signals when migrating with respect to the other receiver. The result of the migration is GCC(𝐲k,𝐲ref)=refCC(𝐲k)\mathcal{I}^{GCC}(\mathbf{y}_{k},\mathbf{y}_{\text{r}ef})=\mathcal{I}^{\text{ref}CC}(\mathbf{y}_{k}); (c)(c) Two point migration: Signals from all possible reflector pairs would summed coherently. The result of the migration is GCC(𝐲k,𝐲k)\mathcal{I}^{GCC}(\mathbf{y}_{k},\mathbf{y}_{k^{\prime}}). The rank-1 image R1CC(𝐲k)\mathcal{I}^{R1CC}(\mathbf{y}_{k}) is extracted through eigendecomposition.

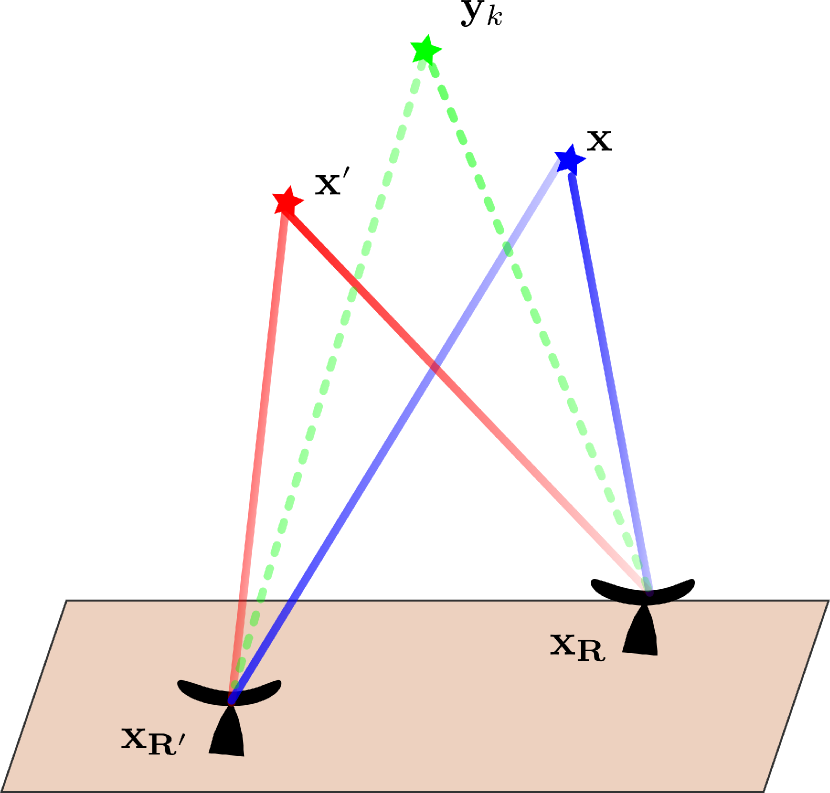
All of these methods reconstruct the reflectivity up to a global phase as expected. The first two methods have the advantage that they are only dependent on a small subdomain of the elements of 𝐗~\tilde{\mathbf{X}}. However, as mentioned in Section 2, they suffer from limitations in the achieved image resolution. The eigenvector on the other hand is a global method, relying on the entire cross correlation data to reconstruct the image.

A physical interpretation would be the following- a cluster of scatterers moving at the same speed would exhibit coherent correlations not only when correlating reflections from the same scatterer at different receivers, but also when correlating reflections from different scatterers at different receivers. Thus, the entire data can be used to estimate the most probable locations for the scatterers, given that the fields measured at both receivers were generated by the same set of scatterers. Note that single point migration can also not resolve any of the relative phases of the reflectors, while the eigenvector is only invariant with respect to a global phase.

The single point migration and two point migration are related by

𝐗~=𝐕𝚲𝐕¯TX~kk=i=1rλi|𝐯i(𝐗~)k|2,\tilde{\mathbf{X}}=\mathbf{V}\mathbf{\Lambda}\overline{\mathbf{V}}^{T}\Rightarrow\tilde{X}_{kk}=\sum\limits_{i=1}^{r}\lambda_{i}|\mathbf{v}_{i}(\tilde{\mathbf{X}})\hskip 0.09995pt_{k}|^{2}, (3.29)

with rr being the rank of 𝐗~\tilde{\mathbf{X}}. i.e., the single point migration is a weighted sum of all the eigenvectors, squared, by their respective eigenvalues. When there is a rapid decay in the singular values, we expect similar results for both migration methods. However, when this is not the case, we expect a different result, as we show through analysis and numerical simulations in Section 5.

3.5 The rank-1 imaging function

Based on the observations of the previous section we suggest the following imaging function

  1. 1.

    Backpropagate the cross correlation 𝐂^(s,ω)\widehat{\mathbf{C}}(s,\omega) to two different points using the operator 𝐀(s,ω)\mathbf{A}(s,\omega) to form the two-point image 𝐗~\tilde{\mathbf{X}}

    𝐗~=s,ω𝐀(s,ω)¯T𝐂^(s,ω)𝐀(s,ω).\tilde{\mathbf{X}}=\sum\limits_{s,\omega}\overline{\mathbf{A}(s,\omega)}^{T}\widehat{\mathbf{C}}(s,\omega)\mathbf{A}(s,\omega).
  2. 2.

    Take the rank-1 image to be the top eigenvector of 𝐗~\tilde{\mathbf{X}}

    R1CC(𝐱)=𝐯1(𝐗~)\mathcal{I}^{R1CC}(\mathbf{x})=\mathbf{v}_{1}(\tilde{\mathbf{X}})

We can reduce the cost of the algorithm by considering a rectangular 𝐗~\tilde{\mathbf{X}} rather than a square matrix. This means that when migrating we don’t use the same grid for both receivers. We replace our candidate image with the top left singular vector (for a tall matrix). As we show in Section 4, numerical simulations suggest that we can downsample one dimension by a factor of 10 and still retain the same resolution. There are several motivations to consider the rank-1 image:

  1. 1.

    Robustness to noise. Since the eigendecomposition uses the entire cross correlation data, it is less sensitive to additive noise or even incomplete data. One could use low-rank matrix completion algorithms to reconstruct the image.

  2. 2.

    Optimization interpretation. The top singular vector has an optimization interpretation: plug in the expression for 𝐂^\widehat{\mathbf{C}} in (3.20), then

    𝐗~=s,ω𝐀(s,ω)¯T𝐀(s,ω)𝝆𝝆¯T𝐀(s,ω)¯T𝐀(s,ω).\tilde{\mathbf{X}}=\sum\limits_{s,\omega}\overline{\mathbf{A}(s,\omega)}^{T}\mathbf{A}(s,\omega)\boldsymbol{\rho}\bar{\boldsymbol{\rho}}^{T}\overline{\mathbf{A}(s,\omega)}^{T}\mathbf{A}(s,\omega). (3.30)

    The top eigenvector can be expressed as the solution to an optimization problem. The top eigenvector solves:

    𝐯1(𝐗~)=argmaxϱ2=1ϱ¯T𝐗~ϱ=argmaxϱ2=1s,ωϱ¯T𝐀(s,ω)¯T𝐀(s,ω)𝝆𝝆¯T𝐀(s,ω)¯T𝐀(s,ω)ϱ=argmaxϱ2=1s,ω|𝐀(s,ω)ϱ,𝐀(s,ω)𝝆|2=argmaxϱ2=1s,ω|𝐀(s,ω)ϱ,𝐮^𝐑(s,ω)|2\begin{split}\mathbf{v}_{1}(\tilde{\mathbf{X}})=&\arg\max\limits_{\|\boldsymbol{\varrho}\|_{2}=1}\bar{\boldsymbol{\varrho}}^{T}\tilde{\mathbf{X}}\boldsymbol{\varrho}=\arg\max\limits_{\|\boldsymbol{\varrho}\|_{2}=1}\sum\limits_{s,\omega}\bar{\boldsymbol{\varrho}}^{T}\overline{\mathbf{A}(s,\omega)}^{T}\mathbf{A}(s,\omega)\boldsymbol{\rho}\bar{\boldsymbol{\rho}}^{T}\overline{\mathbf{A}(s,\omega)}^{T}\mathbf{A}(s,\omega)\boldsymbol{\varrho}\\ =&\arg\max\limits_{\|\boldsymbol{\varrho}\|_{2}=1}\sum\limits_{s,\omega}|\langle\mathbf{A}(s,\omega)\boldsymbol{\varrho},\mathbf{A}(s,\omega)\boldsymbol{\rho}\rangle|^{2}=\arg\max\limits_{\|\boldsymbol{\varrho}\|_{2}=1}\sum\limits_{s,\omega}|\langle\mathbf{A}(s,\omega)\boldsymbol{\varrho},\widehat{\mathbf{u}}_{\mathbf{R}}(s,\omega)\rangle|^{2}\end{split} (3.31)

    i.e, we are trying to find the ϱ\boldsymbol{\varrho} which is the most correlated with the observed field measurement, given our forward model. Notice that while similar to (3.23), this is a nonlinear optimization problem, and the absolute value in (3.31) removes the sensitivity to a global phase.

3.6 Performance of the rank-1 image

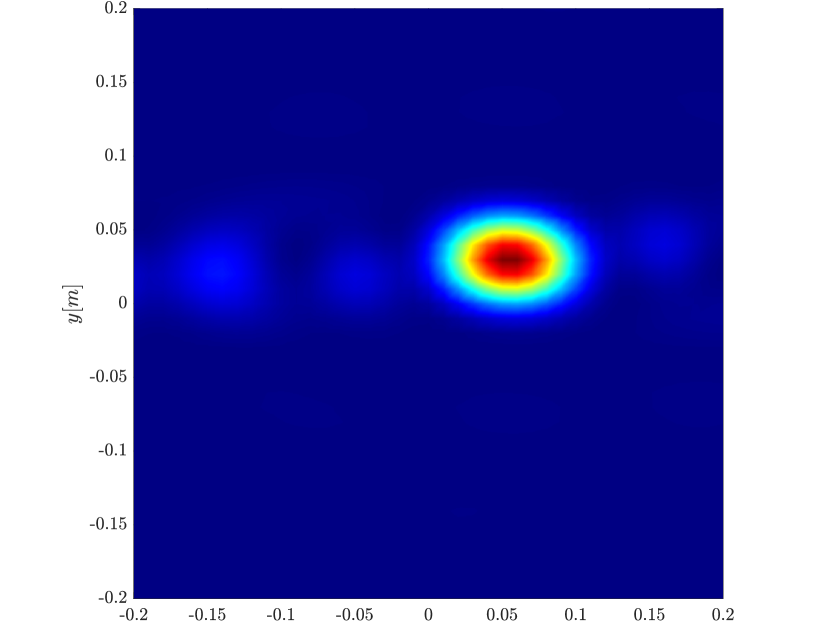
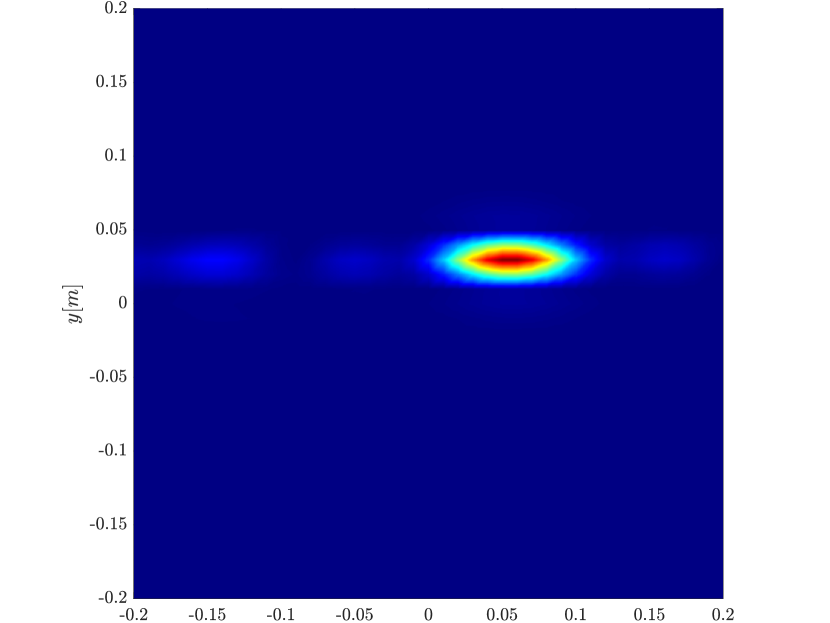
In Sections 4 and 5 we compare through simulations the performance of the two-point and single-point migration schemes for plane images, that is, images with a fixed zz coordinate (height), so that the image coordinate 𝐲k2\mathbf{y}_{k}\in\mathbb{R}^{2}. We show that as the synthetic aperture increases, the resolution of the rank-1 image tends to improve compared to the usual single point migration image. We explain this by analyzing the stationary points of the interference pattern 𝐗~\tilde{\mathbf{X}}, in Appendix B.

The main result in this appendix is that the synthetic aperture induces an anisotropy in the resolution of 𝐗~\tilde{\mathbf{X}} in the space 𝐲k×𝐲k4\mathbf{y}_{k}\times\mathbf{y}_{k^{\prime}}\in\mathbb{R}^{4}. For a small synthetic aperture, the width of the stationary point is approximately λH𝐓a\frac{\lambda H_{\mathbf{T}}}{a} in all directions, where λ=c0/f0\lambda=c_{0}/f_{0} is the wavelength of the carrier frequency, H𝐓H_{\mathbf{T}} is the height of the target (the average distance from the receivers), and aa is the diameter of the imaging array spanned by the receivers. This is consistent with the resolution analysis in [8], where it was evaluated for a relatively short synthetic aperture, so that the resolution is dominated by the size of the array of receivers.

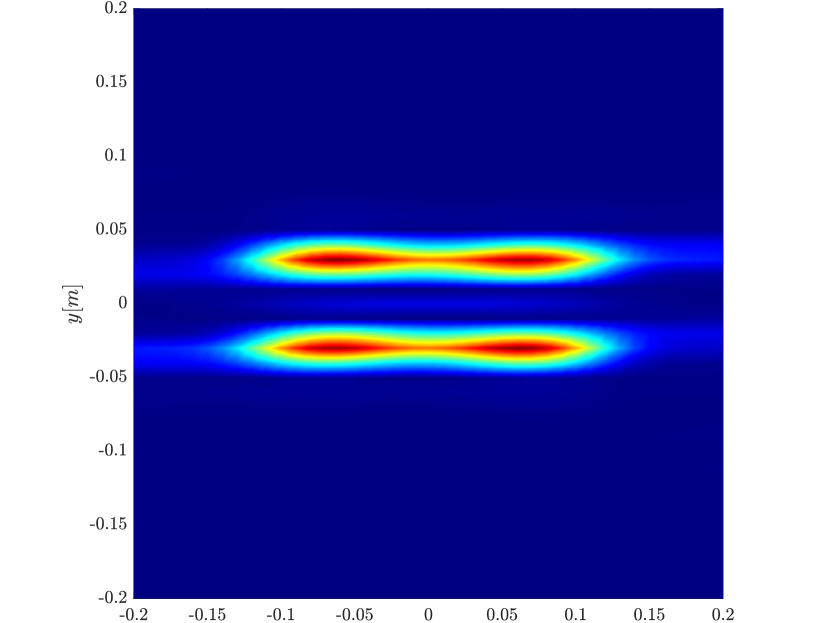
However, as the synthetic aperture grows larger and becomes comparable in size to the physical aperture, the anisotropy becomes significant. As a result, the stationary points have different widths in different directions. They exhibit the narrowest spot size in the direction 𝐲^k𝐯𝐓=𝐲^k𝐯𝐓\widehat{\mathbf{y}}_{k}\cdot\mathbf{v}_{\mathbf{T}}=-\widehat{\mathbf{y}}_{k^{\prime}}\cdot\mathbf{v}_{\mathbf{T}}, which is approximately λH𝐓𝐯𝐓S\frac{\lambda H_{\mathbf{T}}}{\mathbf{v}_{\mathbf{T}}S}, with 𝐯𝐓S\mathbf{v}_{\mathbf{T}}S the size of the synthetic aperture. The width is unchanged in 𝐲^k=𝐲^k\widehat{\mathbf{y}}_{k}=\widehat{\mathbf{y}}_{k^{\prime}}, which is the direction corresponding to the diagonal/single point migration (2.9). This is again consistent with the resolution analysis of [8], which suggests that the resolution of planar images is independent of the synthetic aperture size. Anisotropic localized kernels have eigenvectors whose width is smaller then the maximum width, as we show in Appendix C for several one dimensional cases. In the case of the point interference patters the width tends to the harmonic mean, which greaty improves on the maximal width. Thus, the top eigenvector R1CC(𝐲k)\mathcal{I}^{R1CC}(\mathbf{y}_{k}) can provide an image with better resolution. This is indeed the case, as illustrated in Figure 3. In numerical simulations, shown in Section 4, the resolution is comparable to the linear KM image.

In Section 4 we present extensive numerical simulations that confirm the superior performance of the rank-1 image with an increasing synthetic aperture size. Then, in Section 5 we further investigate the performance by considering the case of a single target. The numerical results are in accordance with the analysis of Appendix B and Appendix C.

Refer to caption
(a)
Refer to caption
(b)
Refer to caption
(c)
Refer to caption
(d)
Figure 3: Imaging a cluster composed of four scatterers. (a)(a) Single-point migration, (b)(b) rank-1 image, (c)(c) Linear KM. The synthetic aperture is 3000Δs3000\Delta s. We can see that there is a dramatic improvement in the resolution attained by the rank-1 image, which is comparable to the one obtained by KM (d)(d) Top 25 eigenvalues of 𝐗~\tilde{\mathbf{X}} for different synthetic aperture sizes, normalized such that the top eigenvalue is always 1. We can see that, as the synthetic aperture size increases, so does the number of significant eigenvalues.

4 Numerical simulations

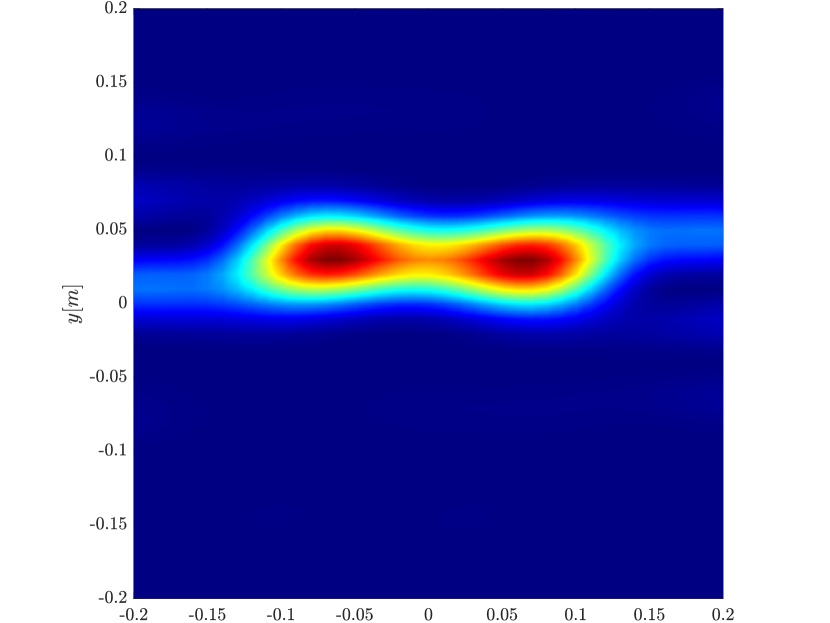
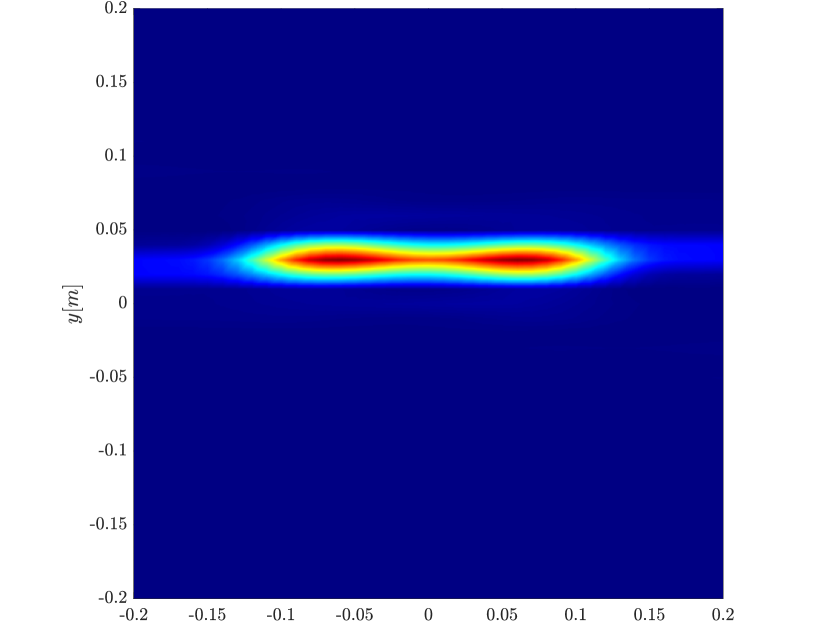
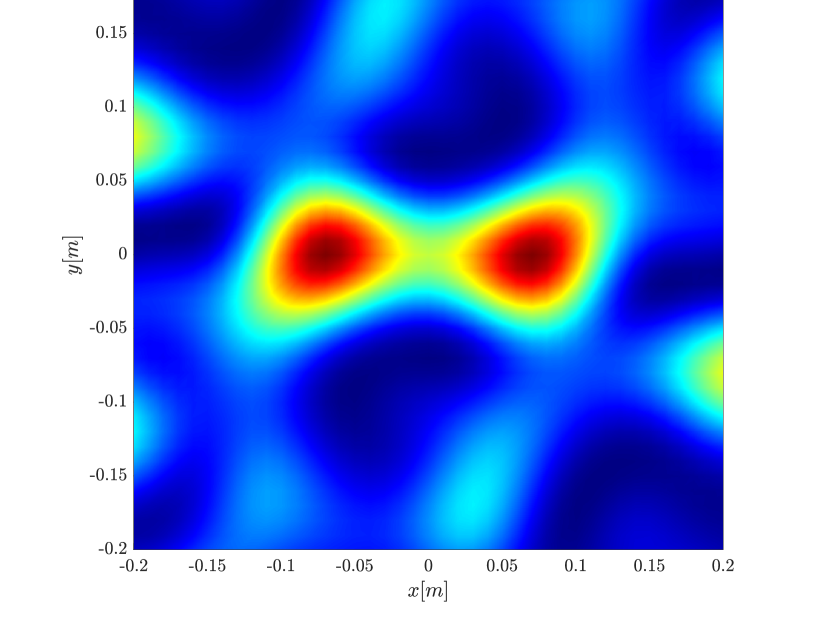
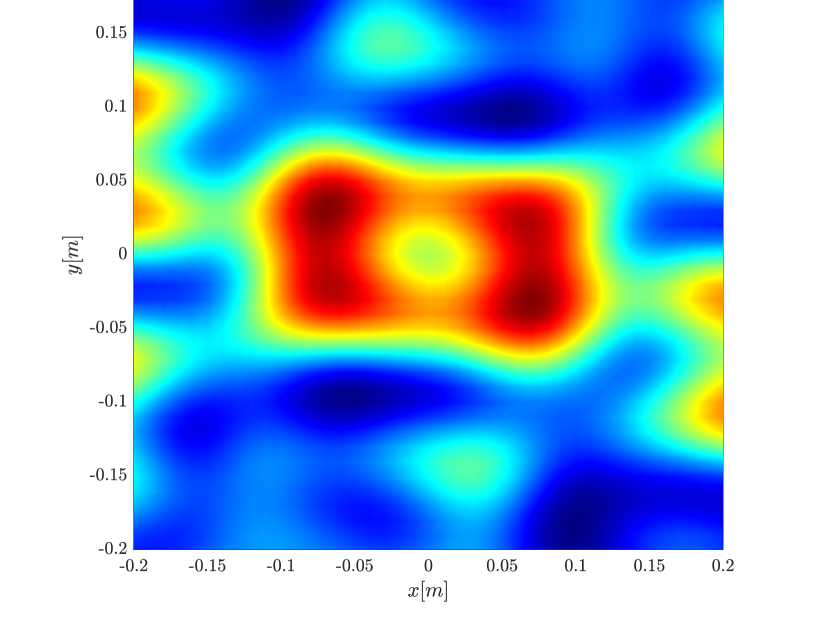
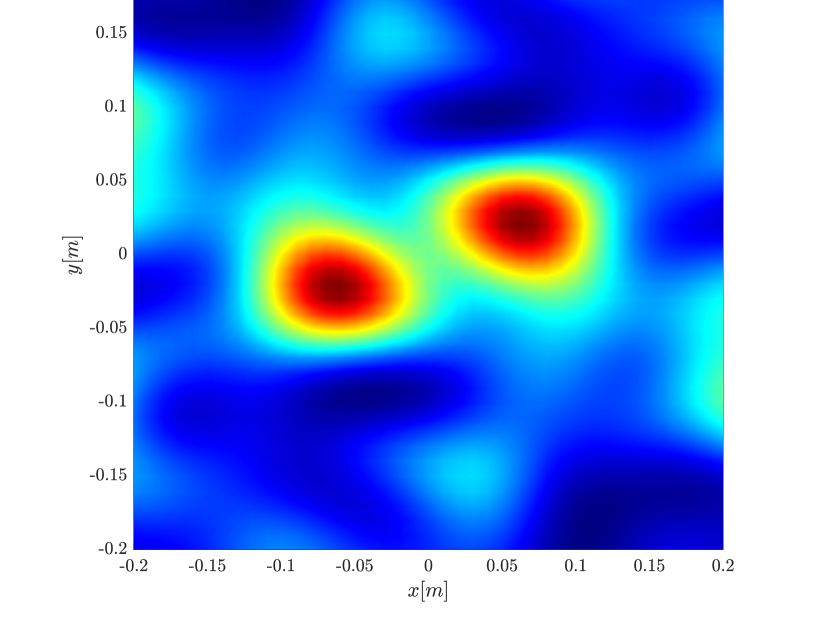
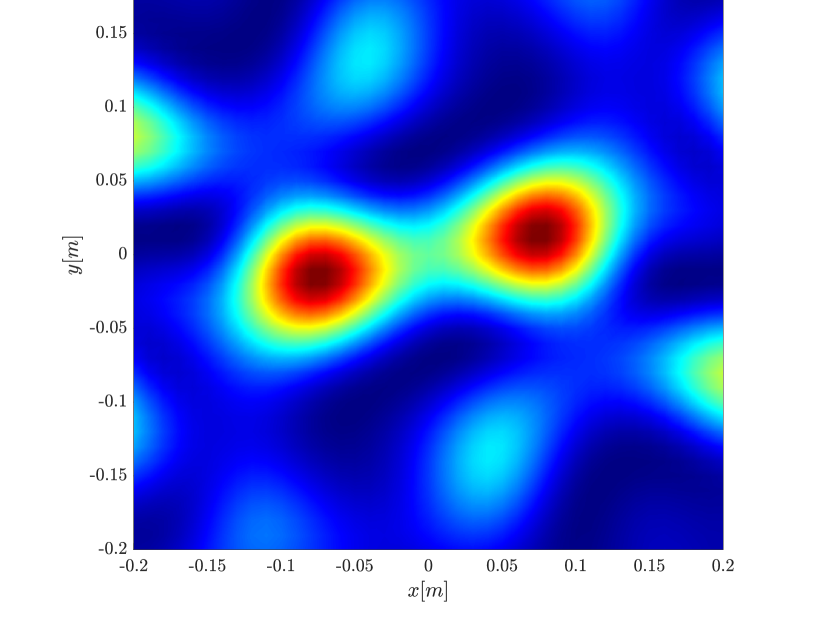
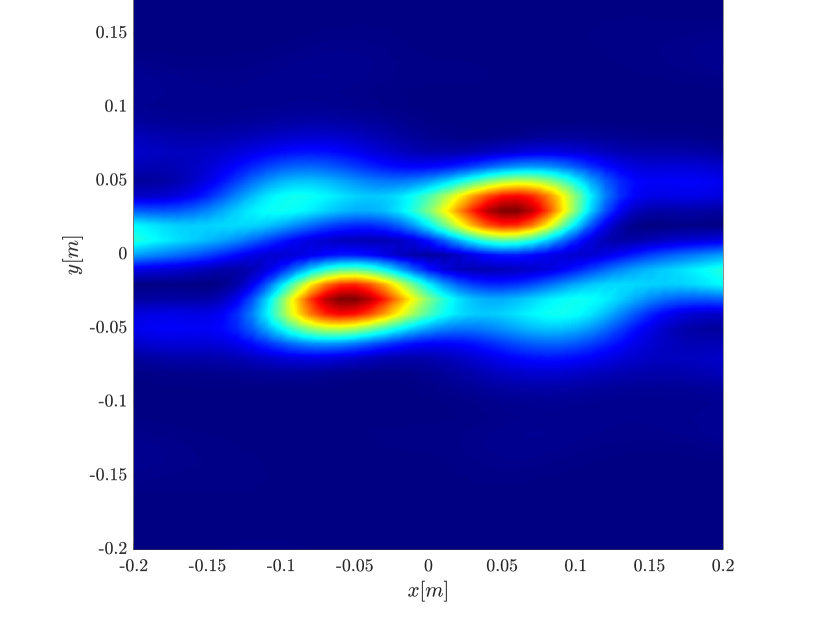
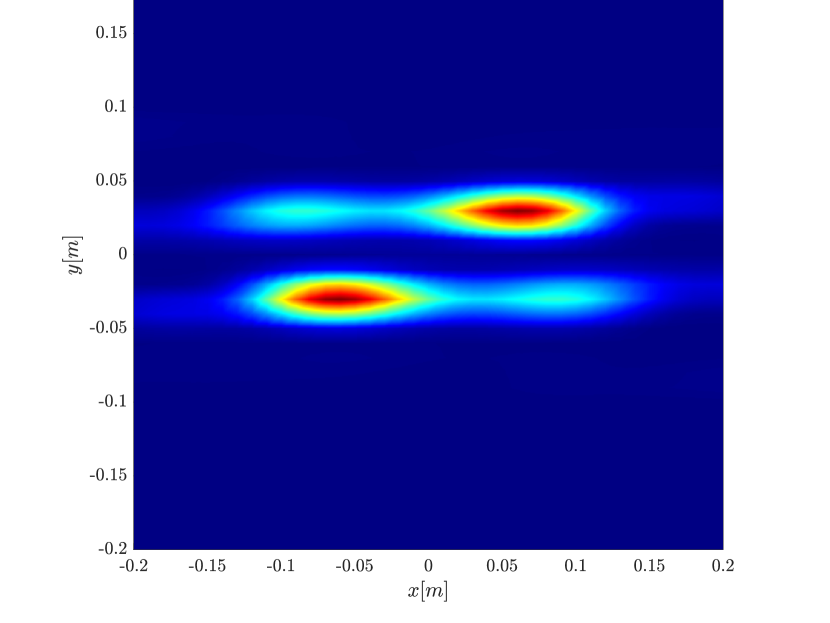
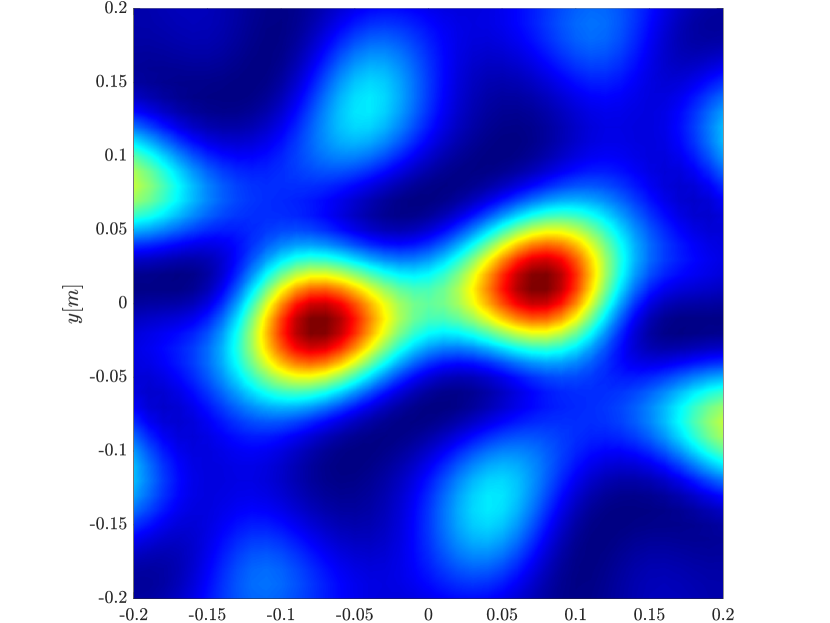
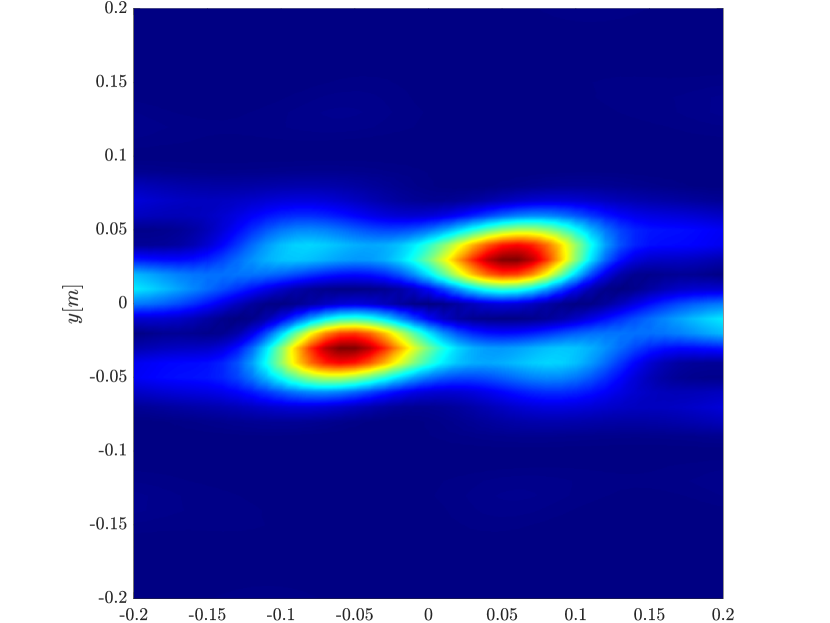
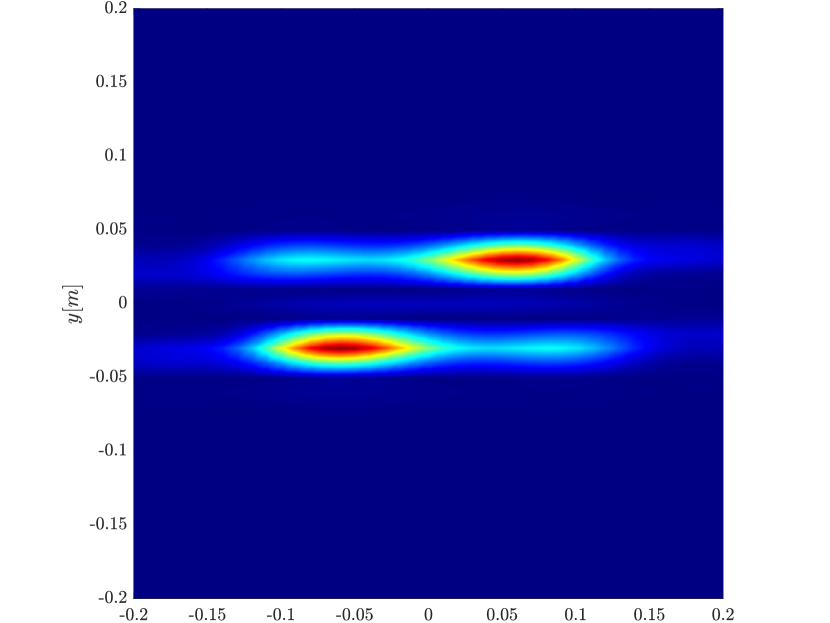
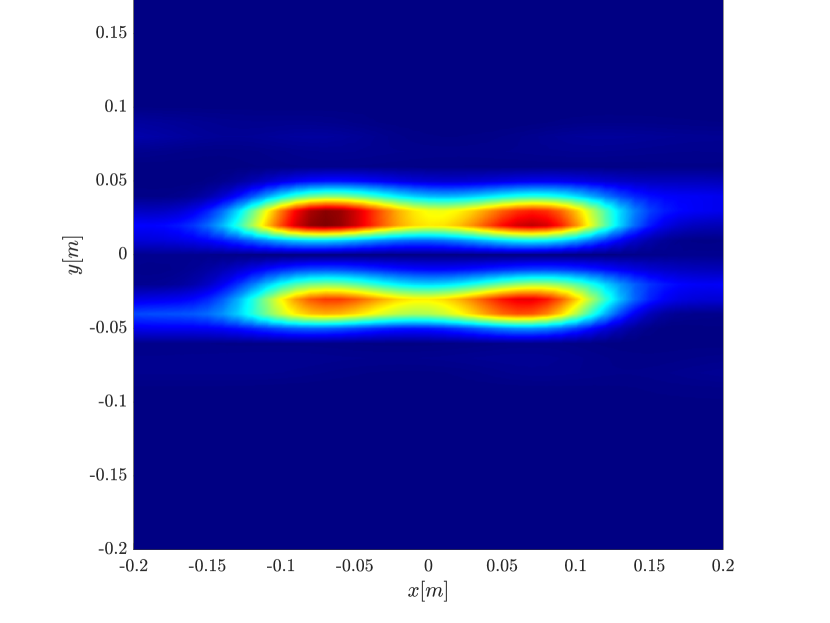
In this section we compare with numerical simulations the performance of the single point migration, the rank-1 image and the linear Kirchhoff migration. The object to be imaged is a cluster composed of either two or four point scatterers. The scatterers are at z=500z=500km height and they all move with the same linear speed. In the inertial frame of references the scatterers are in the xyx-y plane. The distance between the scatterers is 1111cm in the xx direction, and 66cm in the yy direction. We show reconstructions in the xyx-y plane at a fixed height zz equal to the true height of the scatterers.

We compute imaging results for different synthetic aperture sizes corresponding to 100 pulses (1.5 seconds), 1000 pulses (15 seconds) and 3000 pulses (45 seconds). The calculations were performed in the frequency domain using as sampling frequencies ωi=ω0+iB/30\omega_{i}=\omega_{0}+iB/30, i=90,89,,0,89,90i=-90,89,\dots,0,\ldots 89,90 with ω0=2πf0\omega_{0}=2\pi f_{0}, f0=9.6f_{0}=9.6GHz and B=300B=300MHz corresponding to half the bandwidth of the pulse f(t)f(t).

In the following figures we demonstrate the improvement in resolution and target separation when using the rank-1 image, compared to the classical single-point migration. The observed performance is further investigated in Section 5, and given an analytical explanation in Appendix B.

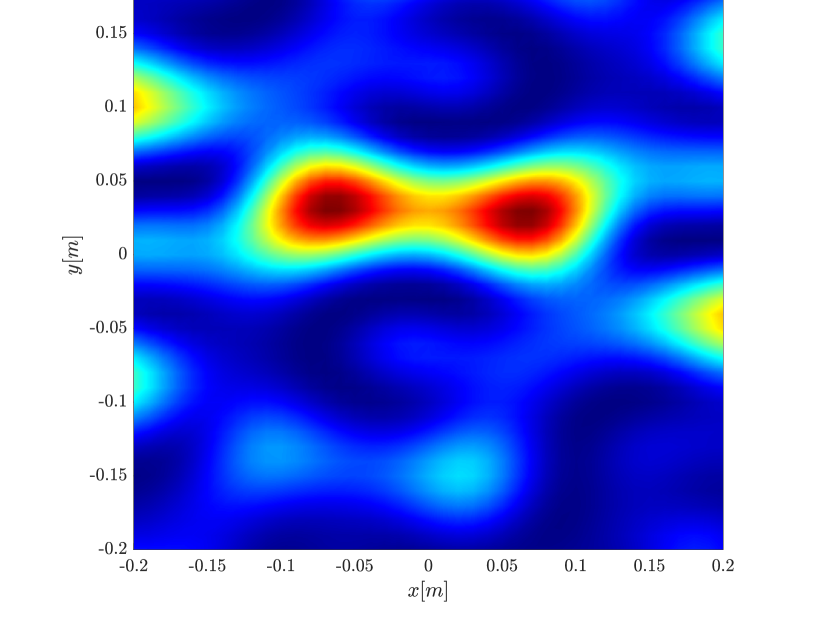
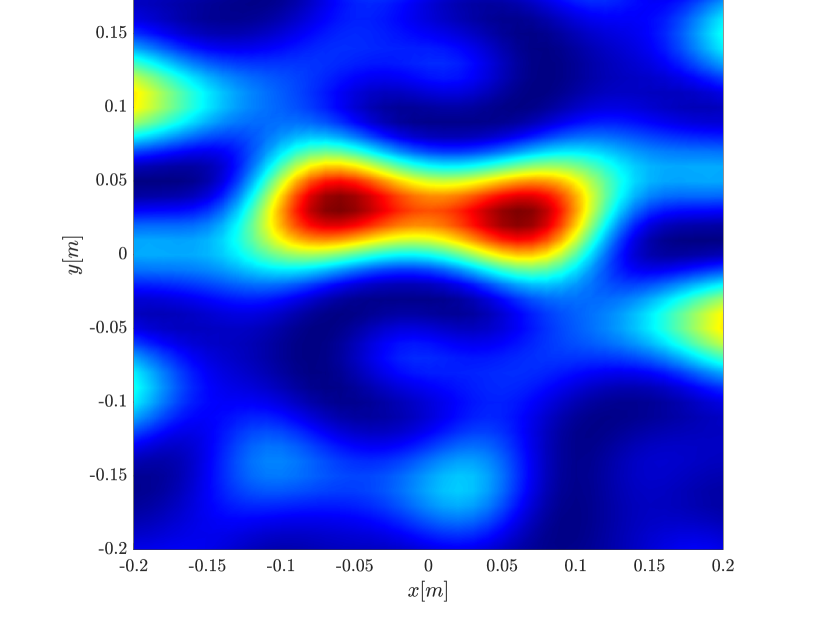
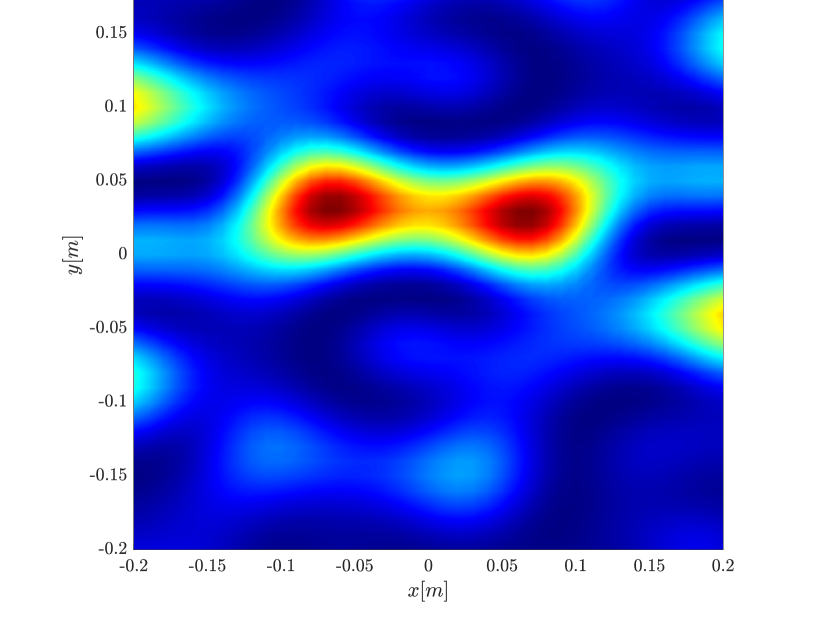
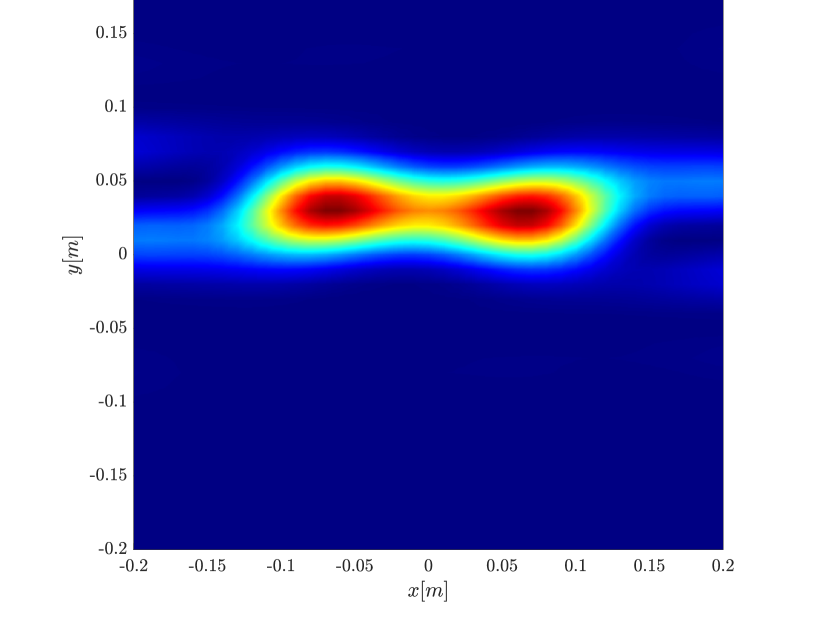
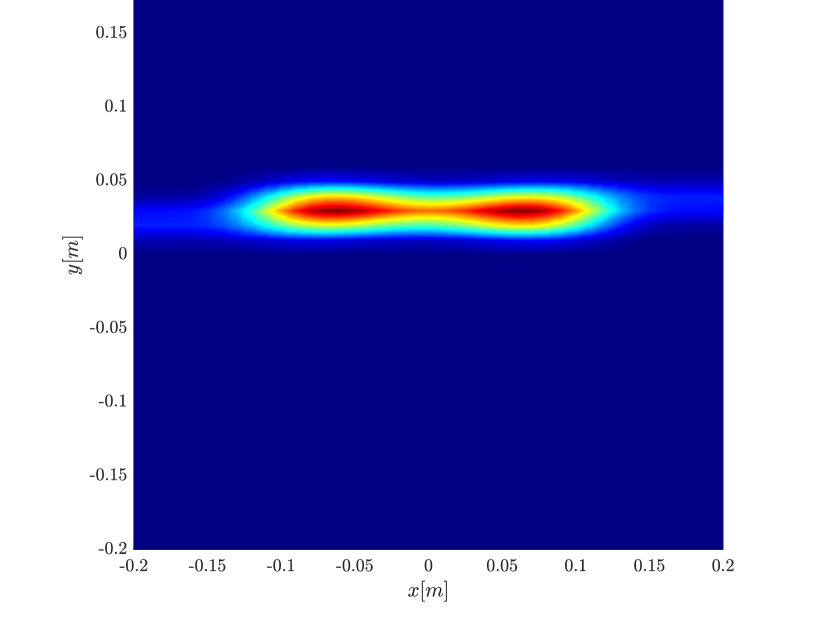
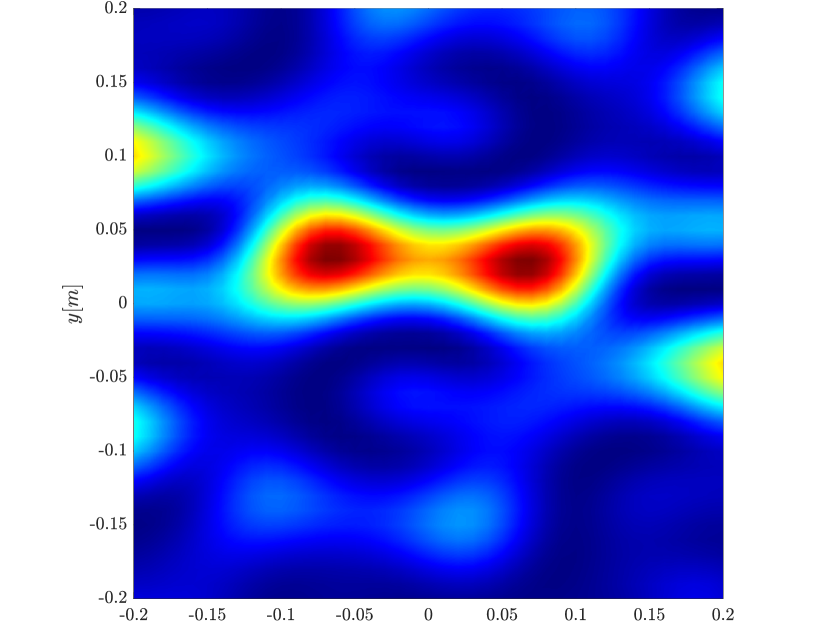
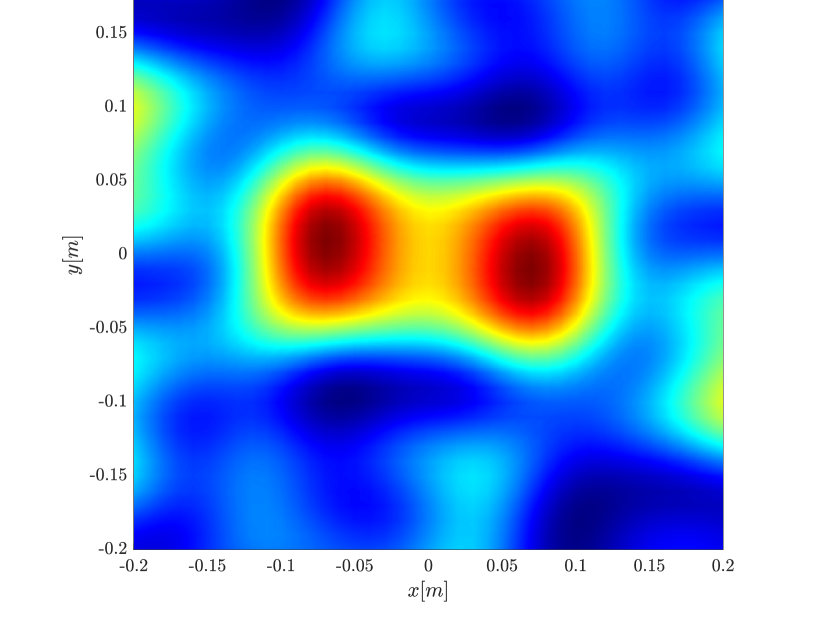
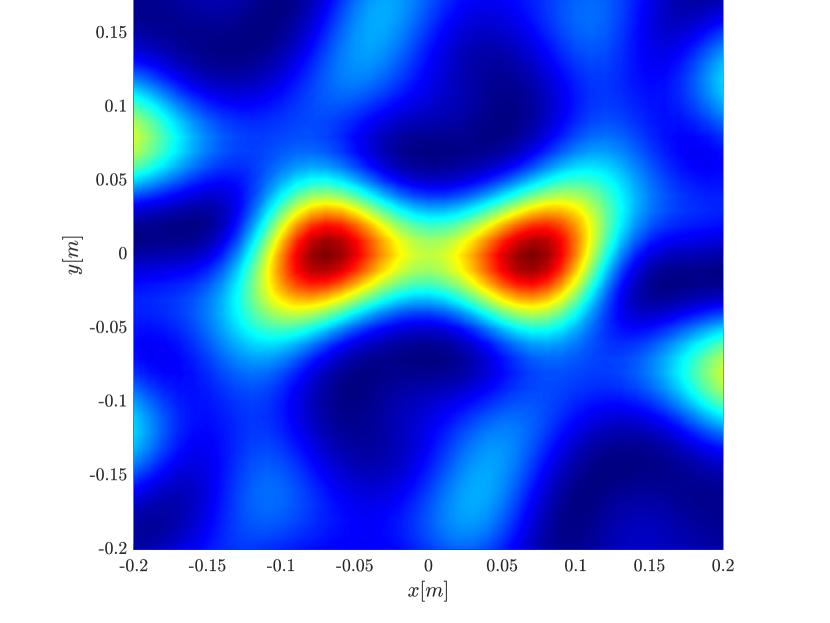
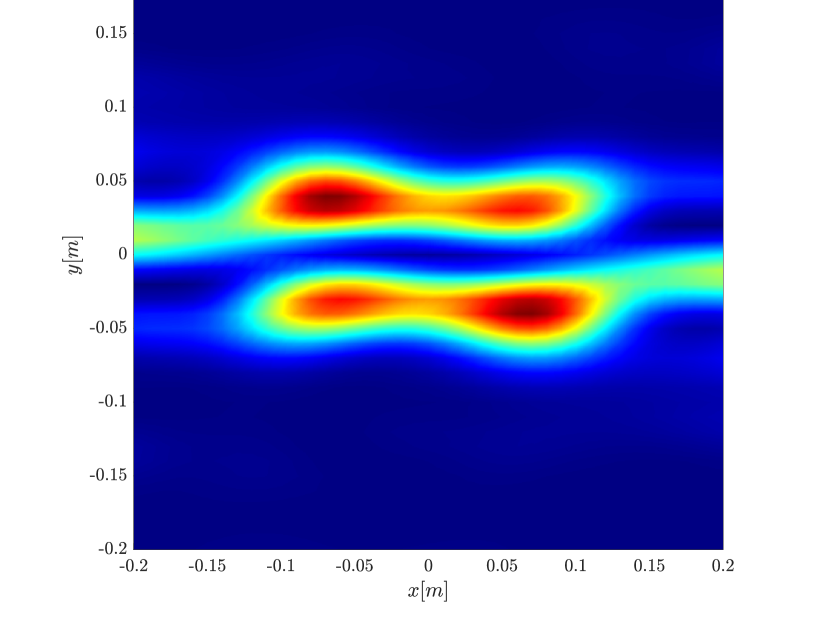
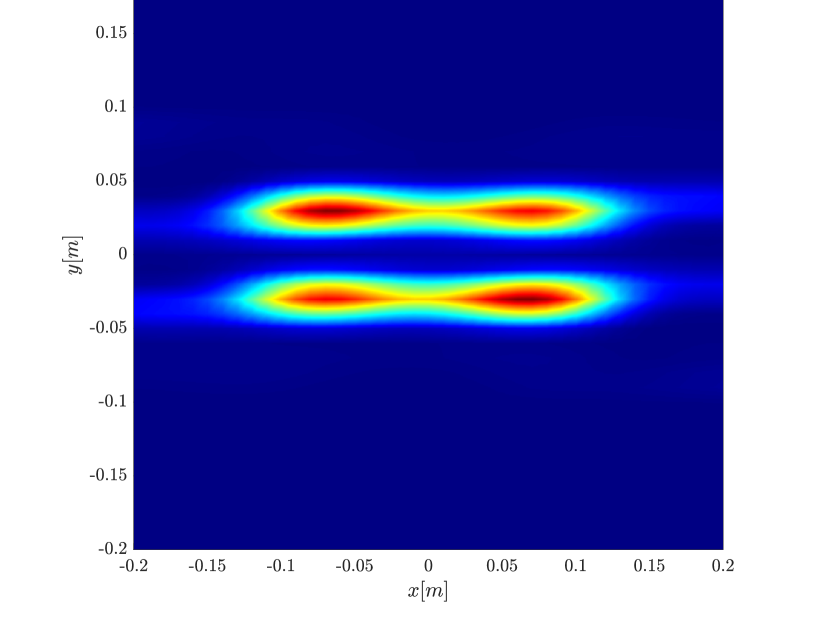
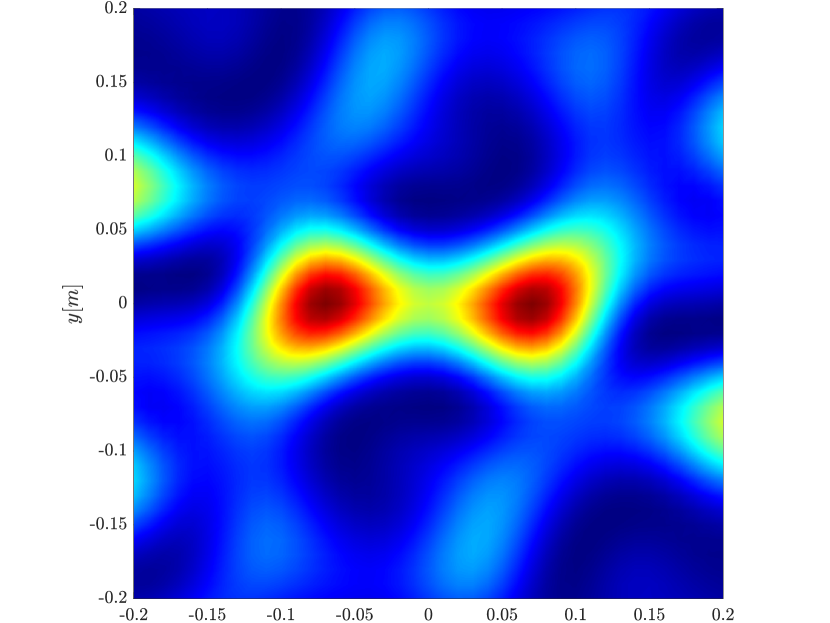
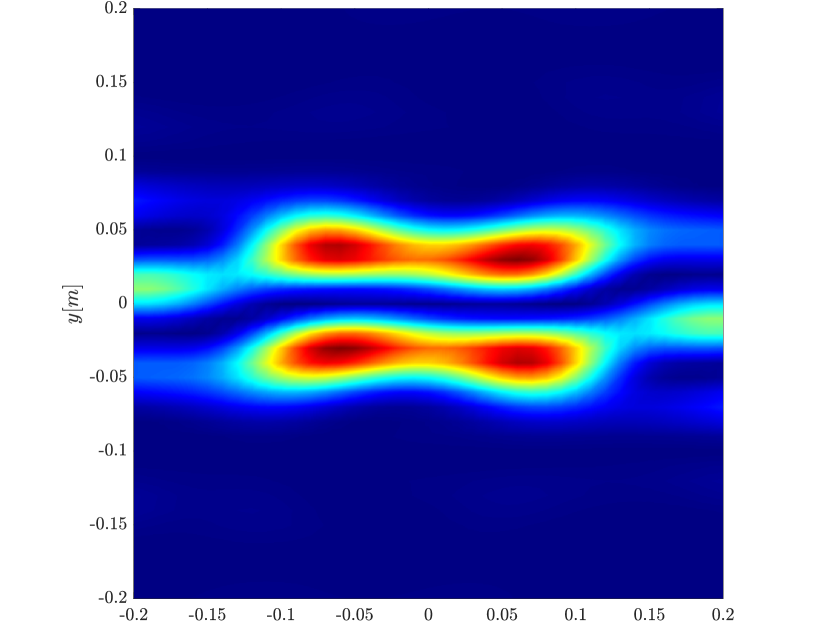
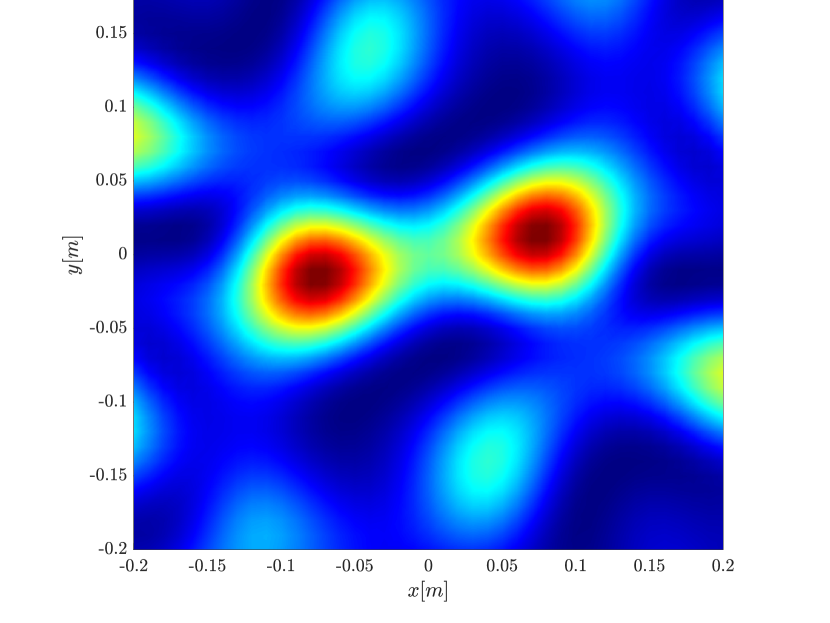
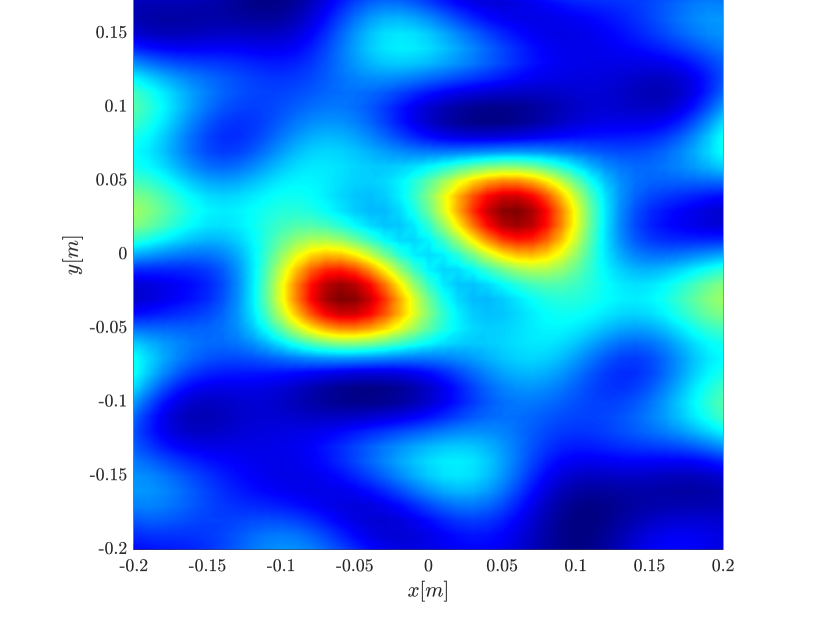
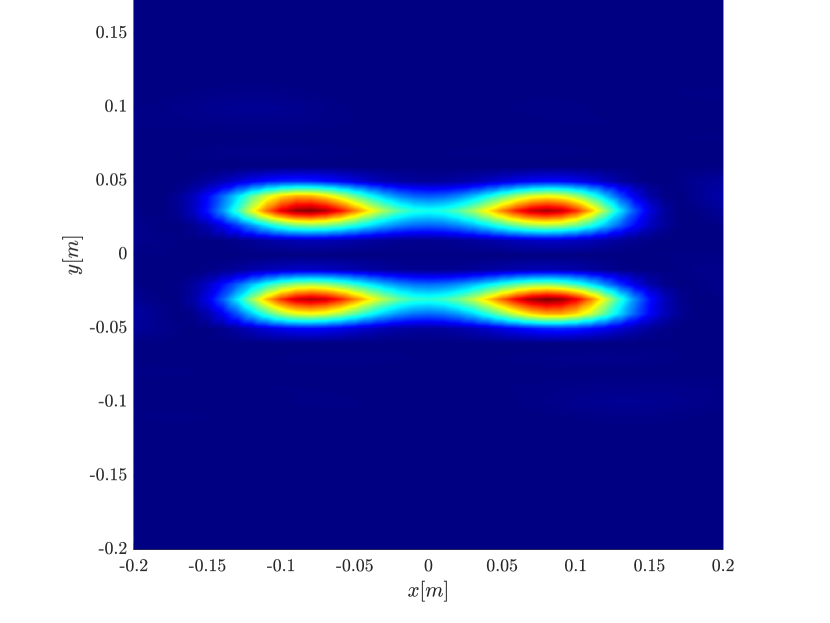
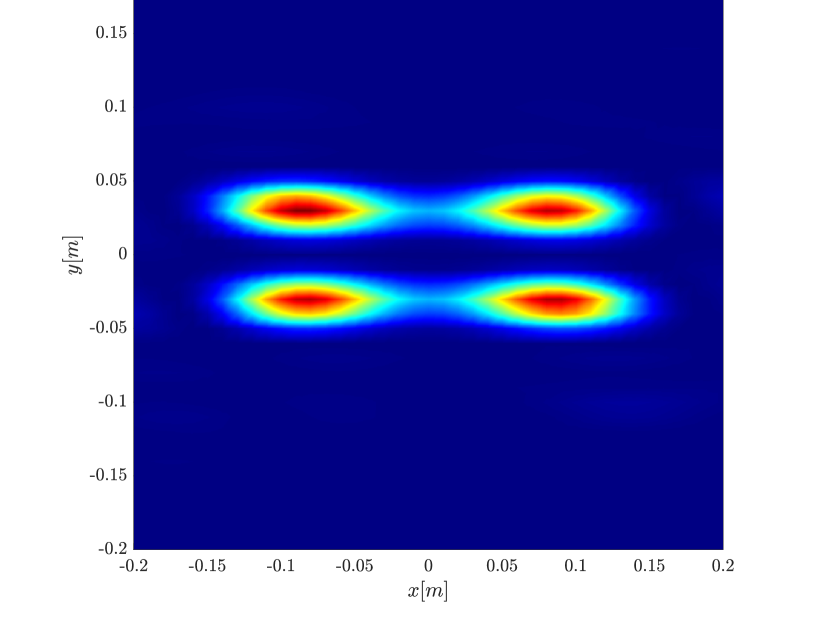
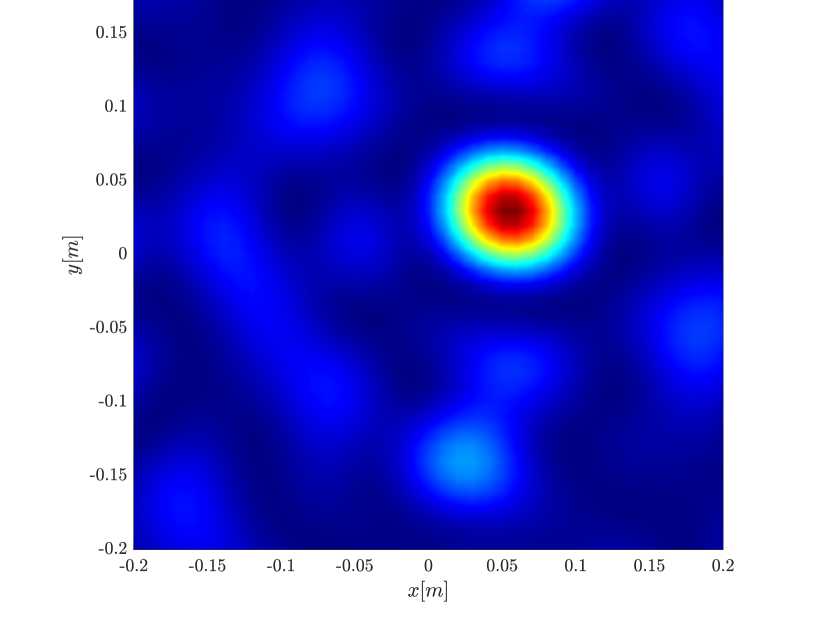
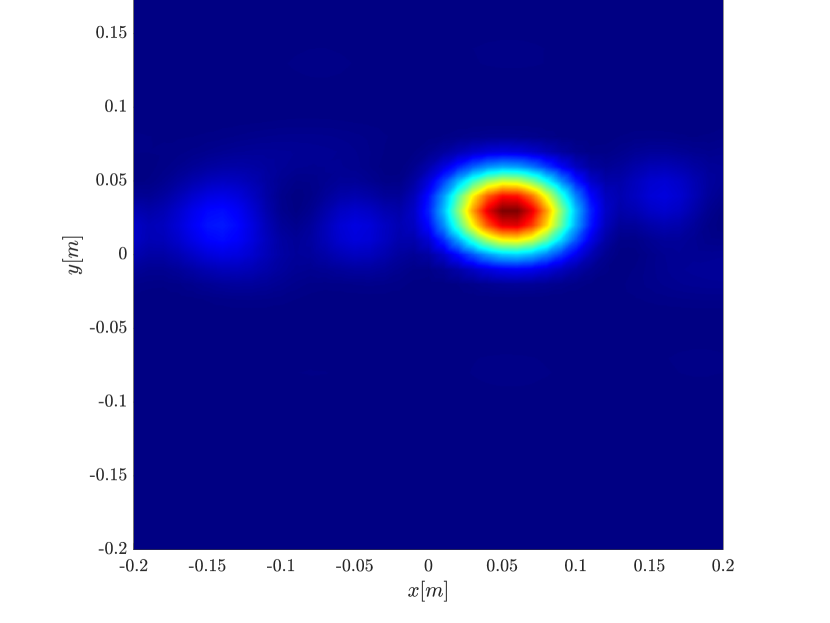
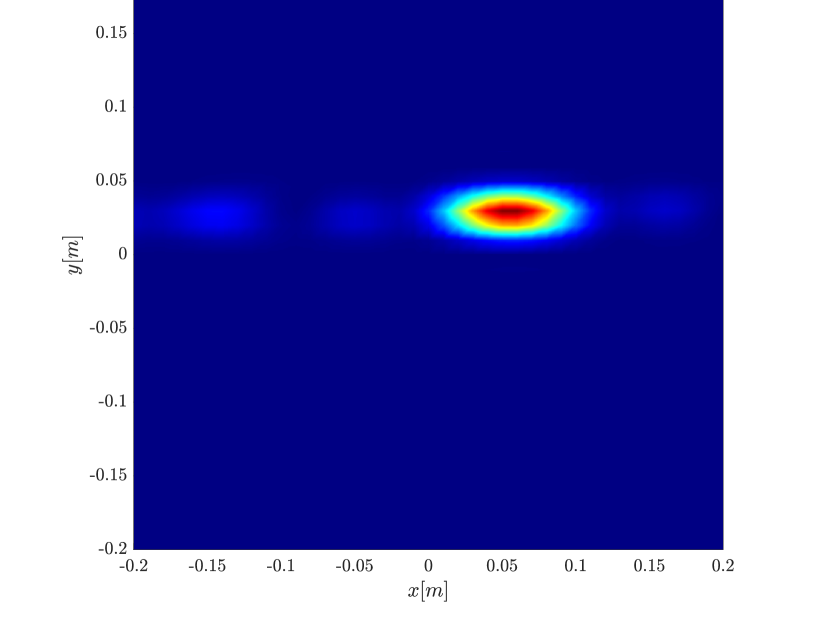
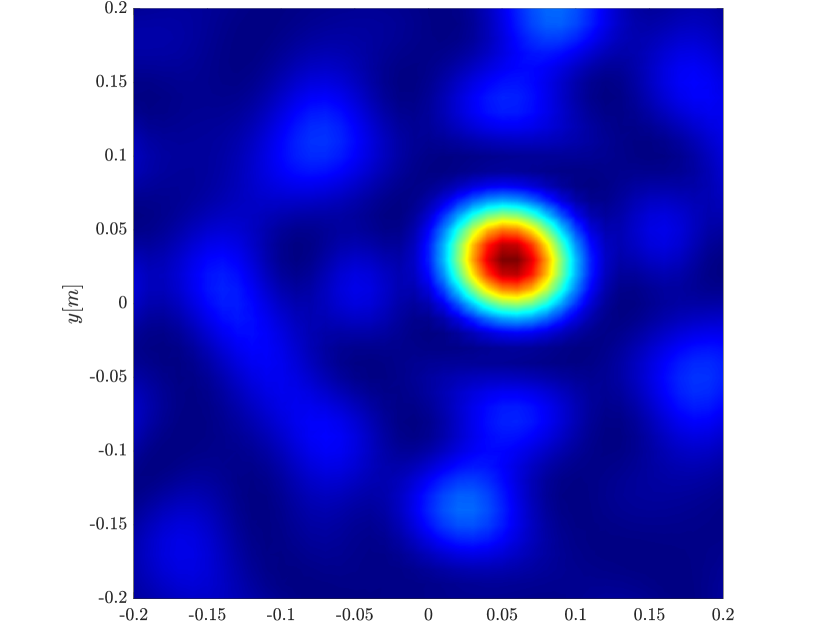
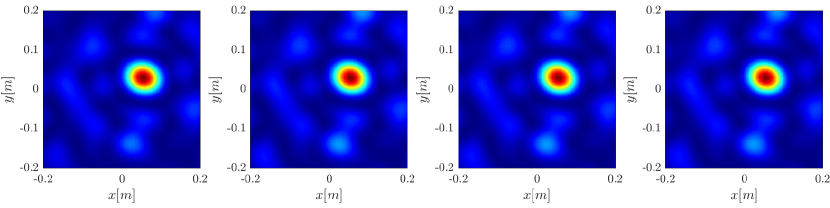
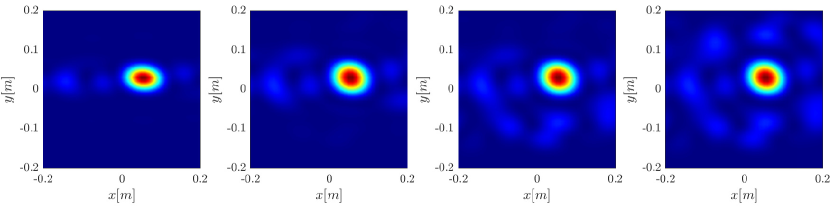
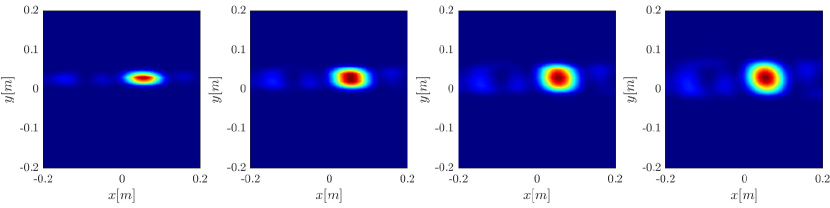
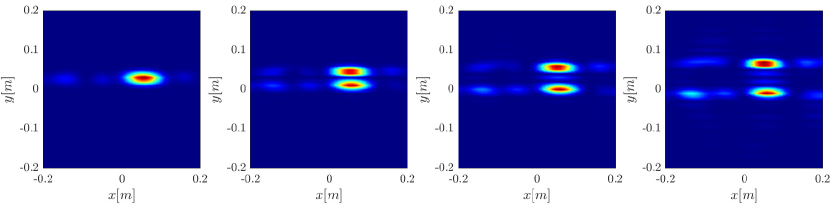
We first consider the two scatterer cluster illustrated in Figure 4. The scatterers are located at (±0.05,0.03)(\pm 0.05,0.03) with respect to the center of the image window. We observe that as the synthetic aperture increases there is a dramatic improvement in the resolution attained by the rank-1 image compared to the single point one, whose resolution does not significantly change as the synthetic aperture increases. Note that the resolution of the rank-1 image is comparable to that of the linear Kirchhoff migration.

Refer to caption
Refer to caption
Refer to caption
Refer to caption
Refer to caption
Refer to caption
Refer to caption
(a)
Refer to caption
(b)
Refer to caption
(c)
Figure 4: Comparison of single point migration (top row), rank-1 image (middle row), and linear Kirchhoff migration (bottom row), for increasing synthetic aperture size of (a)(a) 100Δs100\Delta s,(b)(b) 1000Δs1000\Delta s and (c)(c) 3000Δs3000\Delta s. We can see that as the synthetic aperture increases there is a dramatic improvement in the resolution attained by the rank-1 image compared to the single point one, whose resolution does not significantly change as the synthetic aperture increases. The resolution of the rank-1 image is comparable to the linear Kirchhoff migration.

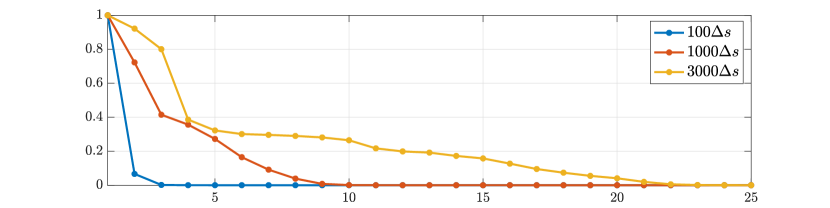
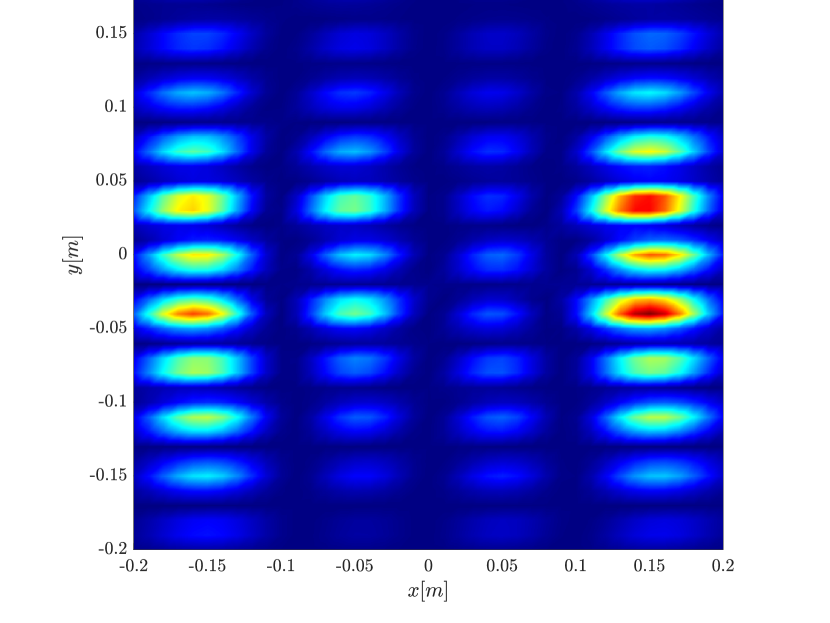
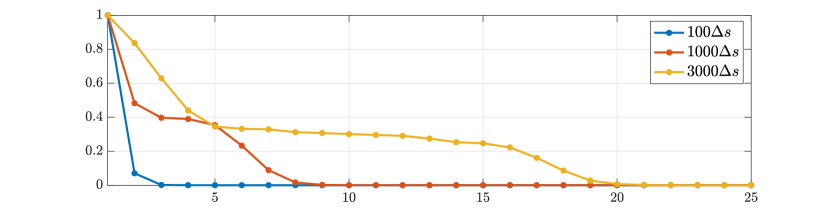
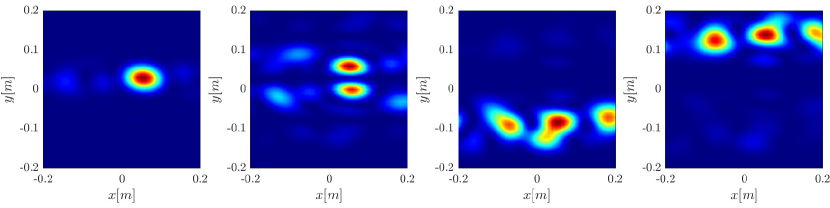
Next we consider the four scatterer cluster illustrated in Figure 5. The scatterers are located at (±0.05,±0.03)(\pm 0.05,\pm 0.03) with respect to the center of the image window. Again, the resolution of the rank-1 image improves significantly as the synthetic aperture increases while this is not the case for the single point migration. For all the synthetic apertures considered, the single point migration cannot resolve the scatterers in the yy-direction and provides a blurry image of the cluster of scatterers. As for Figure 4 the resolution of the rank-1 image is comparable to that of the linear Kirchhoff migration. The top 25 eigenvalues of 𝐗~\tilde{\mathbf{X}} for the different synthetic aperture sizes are shown in Figure 3-(d). We observe that, as the synthetic aperture size increases, so does the number of significant eigenvalues. That is due to the anisotropy in the resolution of the interference pattern 𝐗~\tilde{\mathbf{X}}. As mentioned in Section 3.6, in the direction 𝐲^k=𝐲^k\widehat{\mathbf{y}}_{k}=\widehat{\mathbf{y}}_{k^{\prime}} the resolution is λHTa\frac{\lambda H_{T}}{a} while it is λH𝐓𝐯𝐓S\frac{\lambda H_{\mathbf{T}}}{\mathbf{v}_{\mathbf{T}}S} in the direction 𝐲^k𝐯𝐓=𝐲^k𝐯𝐓\widehat{\mathbf{y}}_{k}\cdot\mathbf{v}_{\mathbf{T}}=-\widehat{\mathbf{y}}_{k^{\prime}}\cdot\mathbf{v}_{\mathbf{T}}. Therefore as the size of the synthetic aperture increases (𝐯𝐓S\mathbf{v}_{\mathbf{T}}S) the anisotropy becomes more significant. As a consequence the rank of 𝐗~\tilde{\mathbf{X}} increases and we expect a differentiation between the single-point migration and the rank-1 image. As we explain in Appendix C the rank-1 image provides a resolution which is in-between λHTa\frac{\lambda H_{T}}{a} and λH𝐓𝐯𝐓S\frac{\lambda H_{\mathbf{T}}}{\mathbf{v}_{\mathbf{T}}S}.

Refer to caption
Refer to caption
Refer to caption
Refer to caption
Refer to caption
Refer to caption
Refer to caption
(a)
Refer to caption
(b)
Refer to caption
(c)
Figure 5: Comparison of single point migration (top row), rank-1 image (middle row), and linear Kirchhoff migration (bottom row), for increasing synthetic aperture size of (a)(a) 100Δs100\Delta s,(b)(b) 1000Δs1000\Delta s and (c)(c) 3000Δs3000\Delta s. As for Figure 4 we observe a dramatic improvement in the resolution of the rank-1 image as the synthetic aperture increases.

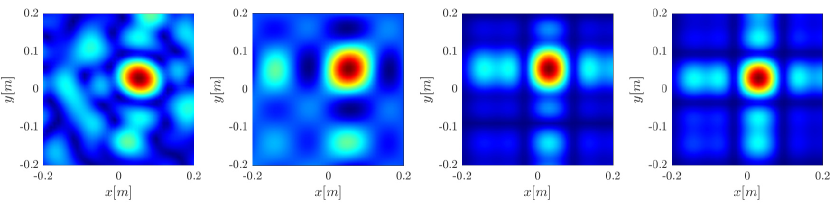
In Figure 6 we consider again the four scatterer cluster but now the scatterers have different reflectivity. Two of the scatterers are weaker having 8080% of the reflectivity of the other two. This translates to a ratio of 0.640.64 for ρi2\rho_{i}^{2}. In this case the single point migration reconstructs only the strong scatterers and those with a resolution that is significantly inferior of that of the rank-1 image. As before rank-1 image and linear KM provide similar results.

Refer to caption
Refer to caption
Refer to caption
Refer to caption
Refer to caption
Refer to caption
Refer to caption
(a)
Refer to caption
(b)
Refer to caption
(c)
Figure 6: Comparison of single point migration (top row), rank-1 image (middle row), and linear Kirchhoff migration (bottom row), for increasing synthetic aperture size of (a)(a) 100Δs100\Delta s,(b)(b) 1000Δs1000\Delta s and (c)(c) 3000Δs3000\Delta s. We can see that as the synthetic aperture increases there is a dramatic improvement in the resolution attained by the rank-1 image compared to the single point one, which is only marginally improved by the increased synthetic aperture.
Refer to caption
(a)
Refer to caption
(b)
Figure 7: Effect of downsampling: (a)(a) rank-1 image using from a square matrix X~\tilde{X} (b)(b) rank-1 image from a rectangular matrix with 10% of the columns chosen at random. We can see that the resolution remains the same.

To reduce the computational complexity of the rank-1 image, we can downsample the two-point migration with respect to one of its dimensions. In this case instead of computing the first eigenvector of the interference pattern 𝐗~\tilde{\mathbf{X}}, we compute its first singular vector. This downsampling does not affect the resolution of the rank-1 image. This is illustrated in Figure 7 where we see that the image retains its resolution even if one of the dimensions is downsampled by a factor of 10 (keeping 10% of the columns chosen at random), reducing the computational complexity by the same factor.

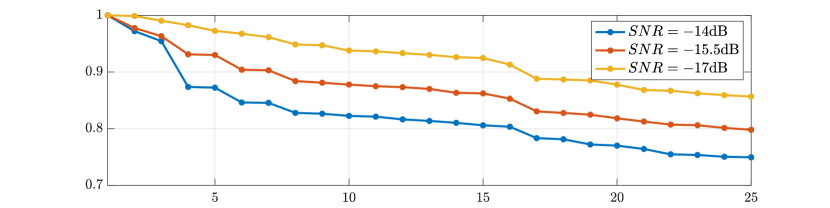
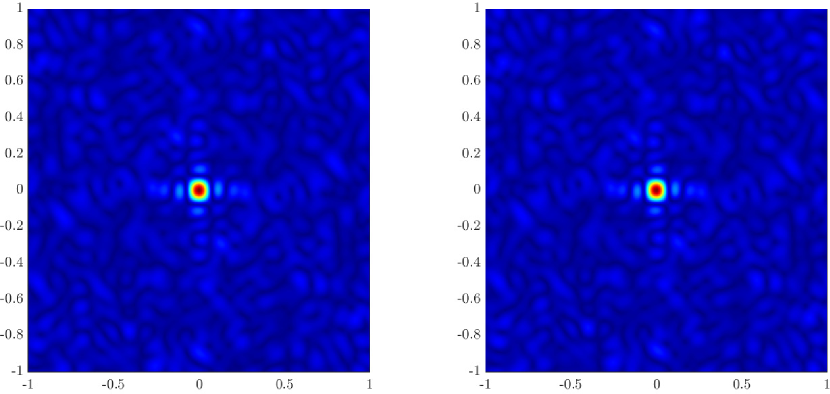
To investigate the robustness of the rank-1 image to noise we corrupt the data corresponding to Figure 5 with additive white Gaussian noise with varying noise levels. We see in Figure 8 that the rank-1 image remains stable down to a low signal to noise ratio (SNR) of 17-17dB. Below that point, as Figure 9 illustrates, the spectrum of the noise distorts that of the data.

Refer to caption
(a)
Refer to caption
(b)
Refer to caption
(c)
Figure 8: Effect of signal to noise ratio (SNR): We assume the measurements are corrupted by additive white Gaussian noise with varying noise level, and look at the rank-1 image. (a)(a) SNR =14=-14dB (b)(b) SNR =15.5=-15.5dB. (c)(c) SNR =17=-17dB. As the SNR reaches a critical value the top eigenvector is no longer robust to noise.
Refer to caption
Figure 9: Top 25 eigenvalues of 𝐗~\tilde{\mathbf{X}} for the reconstructions shown in Figure 8. The eigenvalues are normalized such that the top eigenvalue is always 1. We can see that as the noise level increase, the noise distorts the form of the spectrum.

5 Properties of the rank-1 imaging function

The results presented in Section 4 show that the performance of the rank-1 image is superior to the single point migration and comparable to the linear Kirchhoff migration. In order to better understand these results we consider in this section a simplified model problem with a single point scatterer. The results for this simplified case allow us to explain the improved performance of the rank-1 image and are consistent with our theoretical analysis in Appendix B.

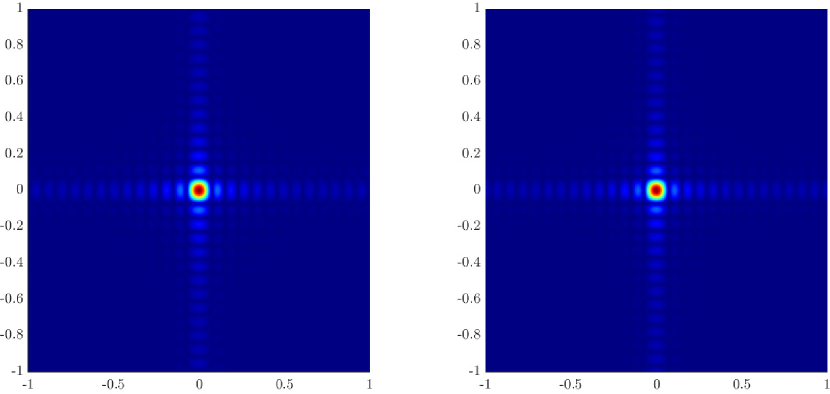
We first repeat the results of Figure 4 for a single scatterer, illustrated in Figure 10. We observe the same behavior, namely the resolution increases with the synthetic aperture size for the rank-1 image, greatly improving on the classical migration when the synthetic aperture is large enough.

Refer to caption
Refer to caption
Refer to caption
Refer to caption
Refer to caption
Refer to caption
Refer to caption
(a)
Refer to caption
(b)
Refer to caption
(c)
Figure 10: Comparison of single point migration (top row) rank-1 image (middle row) and linear Kirchhoff migration (bottom row), for increasing synthetic aperture size of (a)(a) 100Δs100\Delta s,(b)(b) 1000Δs1000\Delta s and (c)(c) 3000Δs3000\Delta s. We can see that as the synthetic aperture increases there is a dramatic improvement in the resolution attained by the rank-1 image compared to the single point one, which is only marginally improved by the increased synthetic aperture. The rank-1 image resolution is comparable to the Kirchhoff migration.

In order to further investigate the cause for the improved resolution we use (3.29), that is the single point migration is the weighted sum of all the eigenvectors of 𝐗~\tilde{\mathbf{X}} squared, weighted by their eigenvalue. We plot in Figure 11 the cumulative sum i=1mλi|𝐯i(𝐗~)k|2\sum\limits_{i=1}^{m}\lambda_{i}|\mathbf{v}_{i}(\tilde{\mathbf{X}})\hskip 0.09995pt_{k}|^{2}, for m=1,,4m=1,\dots,4 for the different inverse aperture sizes. The results motivate us to look into the eigenvalues of 𝐗~\tilde{\mathbf{X}} illustrated in Figure 12. We indeed see that as the inverse aperture increases, 𝐗~\tilde{\mathbf{X}}, has more significant eigenvalues.

Refer to caption
(a)
Refer to caption
(b)
Refer to caption
(c)
Figure 11: Comparison of the cumulative sum of weighted eigenvectors, i=1mλi|𝐯i(𝐗~)k|2\sum\limits_{i=1}^{m}\lambda_{i}|\mathbf{v}_{i}(\tilde{\mathbf{X}})\hskip 0.08995pt_{k}|^{2}, for m=1,,4m=1,\dots,4, for increasing synthetic aperture size of (a)(a) 100Δs100\Delta s,(b)(b) 1000Δs1000\Delta s and (c)(c) 3000Δs3000\Delta s. We can see that for small synthetic aperture size the image converges quickly to a stationary image which greatly resembles the single point migration result of Figure 10. This suggests a rapid decay in eigenvalues. As the inverse aperture size increases, the convergence is much slower, which indicates 𝐗~\tilde{\mathbf{X}} is far from being rank-1, suggesting a greater difference between the single point and the two-point migration schemes.
Refer to caption
Figure 12: Top 25 eigenvalues of 𝐗~\tilde{\mathbf{X}} for a single scatterer, for different synthetic aperture sizes, normalized such that the top eigenvalue is always 1. We can see that as the synthetic aperture size increases, so does the number of significant eigenvalues.

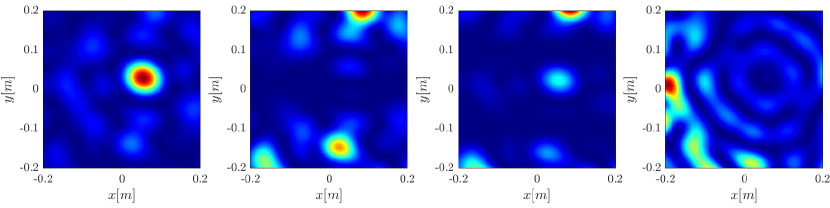
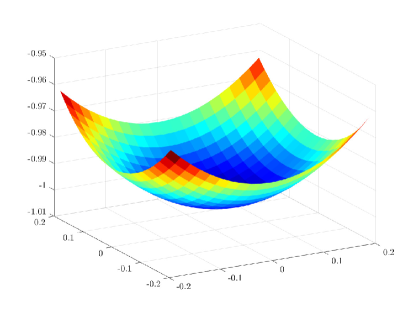
Stationary phase analysis of the two point migration function, carried out in Appendix B, suggest that the stationary points of (𝐲k,𝐲k)\mathcal{I}(\mathbf{y}_{k},\mathbf{y}_{k^{\prime}}) are all the points (𝐲k,𝐲k)=(𝐲it,𝐲jt)(\mathbf{y}_{k},\mathbf{y}_{k^{\prime}})=(\mathbf{y}^{t}_{i},\mathbf{y}^{t}_{j}), where 𝐲t\mathbf{y}^{t} is the collection of all scatterer locations. In the single scatterer case we would have only one stationary point. We analyze the behavior of 𝐗~\tilde{\mathbf{X}} around the stationary point, to see in greater detail the effect of the synthetic aperture. Since for a 2D imaging domain (𝐲k,𝐲k)\mathcal{I}(\mathbf{y}_{k},\mathbf{y}_{k^{\prime}}) would be four dimensional, we look at all the possible planar cross sections of (𝐲k,𝐲k)\mathcal{I}(\mathbf{y}_{k},\mathbf{y}_{k^{\prime}}) at the stationary point- 6 in total. Since 𝐗~\tilde{\mathbf{X}} is Hermitian, there are only 4 distinct cross sections (up to conjugation).

As illustrated in Figure 13, as the synthetic aperture size increases the stationary point becomes anisotropic in the sense the the main lobe has different width with respect to different directions. Specifically, the directions with the weakest decay are the ones for which 𝐲^k=𝐲^k\widehat{\mathbf{y}}_{k}=\widehat{\mathbf{y}}_{k^{\prime}}, that is also the direction along which the single point migration is computed. In Appendix B, we show by stationary phase analysis that this anisotropy is the result of the synthetic aperture, and indeed we expect anisotropy to increase with the size of the synthetic aperture. By taking the top eigenvector rather than the diagonal of 𝐗~\tilde{\mathbf{X}} we can gain from the anisotropy and reduce the spot size as we show in Appendix C.

Anisotropy is also related to the observed increase in rank. If the stationary point is isotropic, it is close to being separable with respect to the two indices, and hence having rank 1. Anisotropy ensures this is no longer the case.

Refer to caption
(a)
Refer to caption
(b)
Refer to caption
(c)
Figure 13: Cross -sections of 𝐗~\tilde{\mathbf{X}} around the stationary phase point 𝐲\mathbf{y} for different inverse aperture sizes. We use a verbose notation (yk,1,yk,2,yk,1,yk,2)\mathcal{I}(y_{k,1},y_{k,2},y_{k^{\prime},1},y_{k^{\prime},2}). They are ordered (left to right): (y1,y2,,),(,y2,,y2),(y1,,,y2),(y1,,y1,)\mathcal{I}(y_{1},y_{2},\cdot,\cdot),\mathcal{I}(\cdot,y_{2},\cdot,y_{2}),\mathcal{I}(y_{1},\cdot,\cdot,y_{2}),\mathcal{I}(y_{1},\cdot,y_{1},\cdot). The synthetic aperture size is (a)(a) 100Δs100\Delta s,(b)(b) 1000Δs1000\Delta s, (c)(c) 3000Δs3000\Delta s. We can see that as the synthetic aperture size increases the stationary point becomes anisotropic in the sense the the main lobe has different width with respect to different directions. Specifically the directions with the weakest decay are the ones for which 𝐲^k=𝐲^k\widehat{\mathbf{y}}_{k}=\widehat{\mathbf{y}}_{k^{\prime}}- see the diagonal of the second and third columns. This is the direction along which the single point migration is computed.

These results can also be interpreted in light of (3.31). We saw that the top eigenvector solves an optimization problem. The second eigenvector would solve the same optimization problem under the added constraint of orthogonality to the first eigenvector. As the first eigenvector becomes more localized, there might be higher modes who are localized as well, and whose eigenvalues do not decay rapidly. The orthogonality constraint means that they cannot have the same support as the first eigenvector. As a result summing them all would increase the spot size, which is the observed effect in the single point migration limit. This is indeed the case, as illustrated in Figure 14.

Refer to caption
(a)
Refer to caption
(b)
Refer to caption
(c)
Figure 14: Comparison of the first four eigenvectors, |𝐯i(𝐗~)k|2|\mathbf{v}_{i}(\tilde{\mathbf{X}})\hskip 0.08995pt_{k}|^{2}, for i=1,,4i=1,\dots,4, for increasing synthetic aperture (a)(a) 100Δs100\Delta s,(b)(b) 1000Δs1000\Delta s, (c)(c) 3000Δs3000\Delta s. We can see that as the first eigenvector becomes more localized, other localized eigenvectors appear, in tandem with a slower decay in the eigenvalues as illustrated in Figure 12. Thus, there is a greater difference in the resolutions achieved by single and two point migrations.

We close this section by summarizing our observations

  1. 1.

    For a point scatterer model, the interference pattern 𝐗~\tilde{\mathbf{X}} has localized stationary points at all the possible combinations (𝐲i,𝐲j)(\mathbf{y}_{i},\mathbf{y}_{j}) where 𝐲i,𝐲j\mathbf{y}_{i},\mathbf{y}_{j} are positions of the scatterers.

  2. 2.

    As the synthetic aperture increases the spot size around the stationary point develops an anisotropy. The directions of weakest decay are the ones that match the single point migration. This is shown both numerically and analytically in Appendix B.

  3. 3.

    The anisotropy causes the top eigenvector to be more localized, as the spot size is some mean of the spot width in the different directions, as shown in Appendix C.

  4. 4.

    Anisotropy also increases the rank, generating more significant localized eigenvectors, and hence accentuating the difference between the two point and single point migrations.

6 Summary and Conclusions

We have considered the problem of imaging small fast moving objects, such as satellites in low earth orbit, using several receivers flying above the turbulent atmosphere, and asynchronous sources located on the ground. The resolution of the imaging system depends on the aperture spanned by the receivers, the bandwidth and the central frequency of the probing signals, as well as the inverse synthetic aperture created by the fast moving objects. In Section 2 we have shown that by forming the cross-correlations of the recorded signals and compensating for the Doppler effect in small imaging windows, we can create a cross-correlation data structure C𝐑𝐑(s,τ)C_{\mathbf{R}\mathbf{R}^{\prime}}(s,\tau) that can be used for imaging. This data structure suggests a natural extension to linear Kirchhoff migration imaging, which is a two-point interference pattern GCC(𝐲k,𝐲k)\mathcal{I}^{GCC}(\mathbf{y}_{k},\mathbf{y}_{k^{\prime}}) defined by (3.27).

In Section 3 we have considered several ways of extracting an image from the interference pattern. The usual single point migration image CC(𝐲k)\mathcal{I}^{CC}(\mathbf{y}_{k}) is the diagonal GCC(𝐲k,𝐲k)\mathcal{I}^{GCC}(\mathbf{y}_{k},\mathbf{y}_{k}). The alternative that we have introduced here is the rank-1 image R1CC(𝐲k)\mathcal{I}^{R1CC}(\mathbf{y}_{k}), which is the first eigenvector of the interference pattern. This rank-1 image has superior resolution compared to the single point migration. The improvement in resolution can be explained by studying the structure of the stationary points of the interference pattern. We have shown in Appendix B and Appendix C that the inverse synthetic aperture induces anisotropy in the profile of the point spread function. The effect is weakest in the direction that corresponds to the single point migration image, causing the image resolution to depend weakly on the synthetic aperture size. Taking the leading eigenvector as the image exploits the anisotropy and provides a resolution comparable to the linear KM system, even when considering multiple closely spaced targets. This is supported by extensive numerical simulations in Sections 4 and 5. We have noted in Section 3.5 that the interference pattern GCC(𝐲k,𝐲k)\mathcal{I}^{GCC}(\mathbf{y}_{k},\mathbf{y}_{k^{\prime}}) need not be a square matrix, with numerical simulations suggesting that one dimension can be downsampled by a up to a factor of 10 while still retaining the same resolution. Instead of the eigenvector, one then uses the top singular vector as the rank-1 image. We have also shown in Section 4 the robustness of the algorithm to additive noise.

An important effect to be considered in future work is the rotation of the object, which is a more realistic scenario for satellites. Further work will involve a systematic study of the robustness of the proposed rank-1 image to measurement noise, as well as to the effects of atmospheric turbulence.

7 Acknowledgements

The work of M. Leibovich and G. Papanicolaou was partially supported by AFOSR FA9550-18-1-0519. The work of C. Tsogka was partially supported by AFOSR FA9550-17-1-0238 and AFOSR FA9550-18-1-0519.

Appendix A The direct and scattered waves

The derivation follows the one in [8]. We give it here for completeness. We assume a source located at 𝐱𝐄\mathbf{x}_{\mathbf{E}} emits a short pulse f(t)f(t) whose compact support is in (0,)(0,\infty) (or any interval of the form [T,],T<[-T,\infty],T<\infty)

Even though in electromagnetic waves solve a Maxwell’s equation rather than the wave equation, the scalar wave equation captures the main propagation and scattering effects which are of interest, neglecting polarization effects [6].

The scalar wave u(t,𝐱)u(t,\mathbf{x}) solves the wave equation excited by the source

1c2(t,𝐱)2ut2Δu=f(t)δ(𝐱𝐱𝐄).\frac{1}{c^{2}(t,\mathbf{x})}\frac{\partial^{2}u}{\partial t^{2}}-\Delta u=f(t)\delta(\mathbf{x}-\mathbf{x}_{\mathbf{E}}). (A.1)

The velocity model assumes a uniform background and a localized perturbation ϱ𝐓\varrho_{\mathbf{T}} centered at 𝐱𝐓(t)\mathbf{x}_{\mathbf{T}}(t). We use here the slow/fast time representation so that 𝐱𝐓(t)=𝐱𝐓+s𝐯𝐓+ts𝐯𝐓\mathbf{x}_{\mathbf{T}}(t)=\mathbf{x}_{\mathbf{T}}+s\mathbf{v}_{\mathbf{T}}+ts\mathbf{v}_{\mathbf{T}}, and the perturbation is

1c2(t,𝐱)=1c02(1+ϱT(𝐱𝐱𝐓(t))).\frac{1}{c^{2}(t,\mathbf{x})}=\frac{1}{c_{0}^{2}}\Big{(}1+\varrho_{T}\big{(}\mathbf{x}-\mathbf{x}_{\mathbf{T}}(t)\big{)}\Big{)}.

The scattered field, u(1)(t,𝐱)u^{(1)}(t,\mathbf{x}), is defined as the difference between the total field u(t,𝐱)u(t,\mathbf{x}), solution of (A.1) and the incident field u(0)(t,𝐱)u^{(0)}(t,\mathbf{x}).

u(1)(t,𝐱)=u(t,𝐱)u(0)(t,𝐱).u^{(1)}(t,\mathbf{x})=u(t,\mathbf{x})-u^{(0)}(t,\mathbf{x}). (A.2)

u(0)(t,𝐱)u^{(0)}(t,\mathbf{x}) solves the free space wave equation

1c022u(0)t2Δu(0)=f(t)δ(𝐱𝐱E).\frac{1}{c^{2}_{0}}\frac{\partial^{2}u^{(0)}}{\partial t^{2}}-\Delta u^{(0)}=f(t)\delta(\mathbf{x}-\mathbf{x}_{E}). (A.3)

The incident field has the form

u(0)(t,𝐱)=0t𝑑τf(τ)G(tτ,𝐱,𝐱𝐄),u^{(0)}(t,\mathbf{x})=\int_{0}^{t}d\tau f(\tau)G(t-\tau,\mathbf{x},\mathbf{x}_{\mathbf{E}}), (A.4)

where G(t,𝐱,𝐱)G(t,\mathbf{x},\mathbf{x}^{\prime}) is the free space Green’s function, given by

G(t,𝐱,𝐱)=δ(t|𝐱𝐱|c0)4π|𝐱𝐱|.G(t,\mathbf{x},\mathbf{x}^{\prime})=\frac{\delta\Big{(}t-\frac{|\mathbf{x}-\mathbf{x}^{\prime}|}{c_{0}}\Big{)}}{4\pi\left|\mathbf{x}-\mathbf{x}^{\prime}\right|}. (A.5)

Plugging in Green’s function in (A.4) we obtain,

u(0)(t,𝐱)=14π|𝐱𝐱𝐄|f(t|𝐱𝐱𝐄|c0).u^{(0)}(t,\mathbf{x})=\frac{1}{4\pi\left|\mathbf{x}-\mathbf{x}_{\mathbf{E}}\right|}f\Big{(}t-\frac{|\mathbf{x}-\mathbf{x}_{\mathbf{E}}|}{c_{0}}\Big{)}. (A.6)

Thus, the scattered field solves,

1c022u(1)t2Δu(1)=1c02ϱT(𝐱𝐱𝐓(t))2(u(0)+u(1))t2(t,𝐱),\frac{1}{c^{2}_{0}}\frac{\partial^{2}u^{(1)}}{\partial t^{2}}-\Delta u^{(1)}=-\frac{1}{c^{2}_{0}}\varrho_{T}(\mathbf{x}-\mathbf{x}_{\mathbf{T}}(t))\frac{\partial^{2}(u^{(0)}+u^{(1)})}{\partial t^{2}}(t,\mathbf{x}),

so that

u(1)(t,𝐱)=1c020t𝑑τ𝑑𝐲G(tτ,𝐱,𝐲)ϱT(𝐲𝐱𝐓(τ))2τ2(u(0)+u(1))(τ,𝐲).u^{(1)}(t,\mathbf{x})=-\frac{1}{c_{0}^{2}}\int_{0}^{t}d\tau\int d\mathbf{y}G(t-\tau,\mathbf{x},\mathbf{y})\varrho_{T}(\mathbf{y}-\mathbf{x}_{\mathbf{T}}(\tau))\frac{\partial^{2}}{\partial\tau^{2}}(u^{(0)}+u^{(1)})(\tau,\mathbf{y}).

In the Born approximation, we can neglect u(1)u^{(1)} as an effective source term in the integral, as its contributions would be quadratic in ϱT\varrho_{T}, assumed to be small, so that

u(1)(t,𝐱)=1c020t𝑑τ𝑑𝐲G(tτ,𝐱,𝐲)ϱT(𝐲𝐱𝐓(τ))2τ2u(0)(τ,𝐲).u^{(1)}(t,\mathbf{x})=-\frac{1}{c_{0}^{2}}\int_{0}^{t}d\tau\int d\mathbf{y}G(t-\tau,\mathbf{x},\mathbf{y})\varrho_{T}(\mathbf{y}-\mathbf{x}_{\mathbf{T}}(\tau))\frac{\partial^{2}}{\partial\tau^{2}}u^{(0)}(\tau,\mathbf{y}).

If ϱT(𝐱)=ρδ(𝐱)\varrho_{T}(\mathbf{x})=\rho\delta(\mathbf{x}), i.e. a point- like scatterer, we get

u(1)(t,𝐱)=ρc020t𝑑τG(tτ,𝐱,𝐱𝐓(τ))2τ2u(0)(τ,𝐲)𝐲=𝐱𝐓(τ).u^{(1)}(t,\mathbf{x})=-\frac{\rho}{c_{0}^{2}}\int_{0}^{t}d\tau G(t-\tau,\mathbf{x},\mathbf{x}_{\mathbf{T}}(\tau))\frac{\partial^{2}}{\partial\tau^{2}}u^{(0)}(\tau,\mathbf{y})\mid_{\mathbf{y}=\mathbf{x}_{\mathbf{T}}(\tau)}.

Substituting the expression of u(0)u^{(0)} and integrating by parts twice, we obtain:

u(1)(t,𝐱)=ρc020t𝑑τ0τ𝑑τf′′(τ)G(ττ,𝐱𝐓(τ),𝐱𝐄)G(tτ,𝐱,𝐱𝐓(τ)).u^{(1)}(t,\mathbf{x})=-\frac{\rho}{c_{0}^{2}}\int_{0}^{t}d\tau\int_{0}^{\tau}d\tau^{\prime}f^{\prime\prime}(\tau^{\prime})G(\tau-\tau^{\prime},\mathbf{x}_{\mathbf{T}}(\tau),\mathbf{x}_{\mathbf{E}})G(t-\tau,\mathbf{x},\mathbf{x}_{\mathbf{T}}(\tau)).

Therefore the scattered field recorded by the receiver at 𝐱=𝐱𝐑\mathbf{x}=\mathbf{x}_{\mathbf{R}}, when the target is at 𝐱𝐓(s)\mathbf{x}_{\mathbf{T}}(s), u𝐑(s,t)=u(1)(s+t,𝐱𝐑)u_{\mathbf{R}}(s,t)=u^{(1)}(s+t,\mathbf{x}_{\mathbf{R}}) has the form:

u𝐑(s,t)=ρc020t𝑑τ14π|𝐱𝐓(s+τ)𝐱𝐄|f′′(τ|𝐱𝐓(s+τ)𝐱𝐄|c0)14π|𝐱𝐑𝐱𝐓(s+τ)|δ(tτ|𝐱𝐑𝐱𝐓(s+τ)|co).u_{\mathbf{R}}(s,t)=-\frac{\rho}{c_{0}^{2}}\int_{0}^{t}d\tau\frac{1}{4\pi|\mathbf{x}_{\mathbf{T}}(s+\tau)-\mathbf{x}_{\mathbf{E}}|}{f}^{\prime\prime}\Big{(}\tau-\frac{|\mathbf{x}_{\mathbf{T}}(s+\tau)-\mathbf{x}_{\mathbf{E}}|}{c_{0}}\Big{)}\frac{1}{4\pi|\mathbf{x}_{\mathbf{R}}-\mathbf{x}_{\mathbf{T}}(s+\tau)|}\delta\Big{(}t-\tau-\frac{|\mathbf{x}_{\mathbf{R}}-\mathbf{x}_{\mathbf{T}}(s+\tau)|}{c_{o}}\Big{)}. (A.7)

Introduce

Φ(τ;t)=tτ|𝐱𝐓+s𝐯𝐓+τ𝐯𝐓𝐱𝐑|c0,\Phi(\tau;t)=t-\tau-\frac{\left|\mathbf{x}_{\mathbf{T}}+s\mathbf{v}_{\mathbf{T}}+\tau\mathbf{v}_{\mathbf{T}}-\mathbf{x}_{\mathbf{R}}\right|}{c_{0}},

then we have

δ[Φ(τ;t)]=iδ[ττi(t)]|τΦ(τi(t);t)|,Φ(τi(t);t)=0,τi(t)t.\delta\left[\Phi(\tau;t)\right]=\sum\limits_{i}\frac{\delta[\tau-\tau_{i}(t)]}{\left|\partial_{\tau}\Phi(\tau_{i}(t);t)\right|},\quad\Phi(\tau_{i}(t);t)=0,\tau_{i}(t)\leq t.

Denoting

D(t)=𝐱𝐓+s𝐯𝐓𝐱𝐑+t𝐯𝐓,{{\itbf D}}(t)=\mathbf{x}_{\mathbf{T}}+s\mathbf{v}_{\mathbf{T}}-\mathbf{x}_{\mathbf{R}}+t\mathbf{v}_{\mathbf{T}}, (A.8)

then we can write

Φ(τ;t)=tτ|D(t)(tτ)𝐯𝐓|c0.\Phi(\tau;t)=t-\tau-\frac{\left|{{\itbf D}}(t)-(t-\tau)\mathbf{v}_{\mathbf{T}}\right|}{c_{0}}. (A.9)

The unique zero of Φ(τ;t)\Phi(\tau;t) in (0,t)(0,t), can is a root of the quadratic equation

(tτ)2(1|𝐯𝐓|2c02)+2(tτ)𝐯𝐓c0D(t)c0|D(t)|2c02=0.\displaystyle(t-\tau)^{2}\left(1-\frac{|\mathbf{v}_{\mathbf{T}}|^{2}}{c_{0}^{2}}\right)+2(t-\tau)\frac{\mathbf{v}_{\mathbf{T}}}{c_{0}}\cdot\frac{{{\itbf D}}(t)}{c_{0}}-\frac{|{{\itbf D}}(t)|^{2}}{c_{0}^{2}}=0.

Which is given by

τ(t)=t|D(t)|c0(1|𝐯𝐓c0|2)[1|𝐯𝐓c0|2+(𝐯𝐓c0D(t)|D(t)|)2𝐯𝐓c0D(t)|D(t)|].\tau(t)=t-\frac{|{{\itbf D}}(t)|}{c_{0}\big{(}1-\big{|}\frac{\mathbf{v}_{\mathbf{T}}}{c_{0}}\big{|}^{2}\big{)}}\left[\sqrt{1-\left|\frac{\mathbf{v}_{\mathbf{T}}}{c_{0}}\right|^{2}+\left(\frac{\mathbf{v}_{\mathbf{T}}}{c_{0}}\cdot\frac{{{\itbf D}}(t)}{|{{\itbf D}}(t)|}\right)^{2}}-\frac{\mathbf{v}_{\mathbf{T}}}{c_{0}}\cdot\frac{{{\itbf D}}(t)}{|{{\itbf D}}(t)|}\right]. (A.10)

We also have

|τΦ(τ(t);t)|=|1+𝐯𝐓c0D(τ(t))|D(τ(t))||.\left|\partial_{\tau}\Phi(\tau(t);t)\right|=\left|1+\frac{\mathbf{v}_{\mathbf{T}}}{c_{0}}\cdot\frac{{{\itbf D}}(\tau(t))}{|{{\itbf D}}(\tau(t))|}\right|.

Hence, we obtain

u𝐑(s,t)=ρf′′(s+τ(t)|𝐱𝐓(τ(t))𝐱𝐄|c0)(4π)2c02|𝐱𝐓(τ(t))𝐱𝐄||𝐱𝐑𝐱𝐓(τ(t))||1+𝐯𝐓c0D(τ(t))|D(τ(t))||.u_{\mathbf{R}}(s,t)=-\frac{\rho f^{\prime\prime}\Big{(}s+\tau(t)-\frac{|\mathbf{x}_{\mathbf{T}}(\tau(t))-\mathbf{x}_{\mathbf{E}}|}{c_{0}}\Big{)}}{(4\pi)^{2}c_{0}^{2}|\mathbf{x}_{\mathbf{T}}(\tau(t))-\mathbf{x}_{\mathbf{E}}||\mathbf{x}_{\mathbf{R}}-\mathbf{x}_{\mathbf{T}}(\tau(t))|\left|1+\frac{\mathbf{v}_{\mathbf{T}}}{c_{0}}\cdot\frac{{{\itbf D}}(\tau(t))}{|{{\itbf D}}(\tau(t))|}\right|}. (A.11)

This is the Born approximation for the scattered field, which is essentially exact for well separated, localized and weak reflectors. The expressions in (2.2), (2.3) are derived by expanding τ(t)\tau(t) to first order, in |𝐯𝐓|/c0|\mathbf{v}_{\mathbf{T}}|/c_{0}. Thus

τ(t)|𝐱𝐓(τ(t))𝐱𝐄|c0γ𝐑(𝐱𝐓(s),𝐱𝐄,𝐯𝐓)tt𝐑(𝐱𝐓(s),𝐱𝐄,𝐯𝐓).\tau(t)-\frac{|\mathbf{x}_{\mathbf{T}}(\tau(t))-\mathbf{x}_{\mathbf{E}}|}{c_{0}}\approx\gamma_{\mathbf{R}}(\mathbf{x}_{\mathbf{T}}(s),\mathbf{x}_{\mathbf{E}},\mathbf{v}_{\mathbf{T}})t-t_{\mathbf{R}}(\mathbf{x}_{\mathbf{T}}(s),\mathbf{x}_{\mathbf{E}},\mathbf{v}_{\mathbf{T}}). (A.12)

Here γ𝐑(𝐱𝐓(s),𝐱𝐄,𝐯𝐓)\gamma_{\mathbf{R}}(\mathbf{x}_{\mathbf{T}}(s),\mathbf{x}_{\mathbf{E}},\mathbf{v}_{\mathbf{T}}) and t𝐑(𝐱𝐓(s),𝐱𝐄,𝐯𝐓)t_{\mathbf{R}}(\mathbf{x}_{\mathbf{T}}(s),\mathbf{x}_{\mathbf{E}},\mathbf{v}_{\mathbf{T}}) are given by (2.3).

Appendix B Approximate evaluation of the two point interference pattern

In this appendix we analyze the expression (3.26) of the two point interference pattern. The structure of the interference pattern plays a determining role in the resolution of the rank-1 image.

Assume the scatterers are located at 𝐲i,i=1,,M\mathbf{y}_{i},i=1,\dots,M with respect to the center of the image window 𝐱𝐓(s)\mathbf{x}_{\mathbf{T}}(s), that is,

𝐲i(s)=𝐱𝐓(s)+𝐲i\mathbf{y}_{i}(s)=\mathbf{x}_{\mathbf{T}}(s)+\mathbf{y}_{i}

and the reflectivities are ρi\rho_{i}. Then, (3.18) takes the form

C^𝐑𝐑(s,ω)|ξ(ω,s)|2i,j=1Mρiρjeiω(t𝐑i(s)t𝐑j(s)(t𝐑(s)t𝐑(s)))\widehat{C}_{\mathbf{R}\mathbf{R}^{\prime}}(s,\omega)\approx|\xi(\omega,s)|^{2}\sum\limits_{i,j=1}^{M}\rho_{i}\rho_{j}e^{i\omega(t_{\mathbf{R}}^{i}(s)-t_{\mathbf{R}^{\prime}}^{j}(s)-(t_{\mathbf{R}}(s)-t_{\mathbf{R}^{\prime}}(s)))} (B.1)

with

t𝐑i(s)=|𝐲i(s)𝐱𝐄|c0+|𝐲i(s)𝐱𝐑|c0γ𝐑(𝐲i(s),𝐱𝐄,𝐯T),t𝐑(s)=|𝐱𝐓(s)𝐱𝐄|c0+|𝐱𝐓(s)𝐱𝐑|c0γ𝐑(𝐱𝐓(s),𝐱𝐄,𝐯T).\begin{array}[]{ll}t_{\mathbf{R}}^{i}(s)&\displaystyle=\frac{|\mathbf{y}_{i}(s)-\mathbf{x}_{\mathbf{E}}|}{c_{0}}+\frac{|\mathbf{y}_{i}(s)-\mathbf{x}_{\mathbf{R}}|}{c_{0}}\gamma_{\mathbf{R}}(\mathbf{y}_{i}(s),\mathbf{x}_{\mathbf{E}},\mathbf{v}_{T}),\\[12.0pt] t_{\mathbf{R}}(s)&\displaystyle=\frac{|\mathbf{x}_{\mathbf{T}}(s)-\mathbf{x}_{\mathbf{E}}|}{c_{0}}+\frac{|\mathbf{x}_{\mathbf{T}}(s)-\mathbf{x}_{\mathbf{R}}|}{c_{0}}\gamma_{\mathbf{R}}(\mathbf{x}_{\mathbf{T}}(s),\mathbf{x}_{\mathbf{E}},\mathbf{v}_{T}).\end{array}

Let us define,

t𝐑𝐱(s)=|𝐱𝐓(s)+𝐱𝐱𝐄|c0+|𝐱𝐓(s)+𝐱𝐱𝐑|c0γ𝐑(𝐱𝐓(s),𝐱𝐄,𝐯T).\begin{split}t_{\mathbf{R}}^{\mathbf{x}}(s)=&\frac{|\mathbf{x}_{\mathbf{T}}(s)+\mathbf{x}-\mathbf{x}_{\mathbf{E}}|}{c_{0}}+\frac{|\mathbf{x}_{\mathbf{T}}(s)+\mathbf{x}-\mathbf{x}_{\mathbf{R}}|}{c_{0}}\gamma_{\mathbf{R}}(\mathbf{x}_{\mathbf{T}}(s),\mathbf{x}_{\mathbf{E}},\mathbf{v}_{T}).\\ \end{split} (B.2)

The two point migration translates the cross correlation data to a pair of points (𝐱,𝐲)(\mathbf{x},\mathbf{y}) in the image window, and then sums over all receiver pairs 𝐑,𝐑\mathbf{R},\mathbf{R}^{\prime}, pulses ss, and frequencies ω\omega. The interference pattern 𝐗~\tilde{\mathbf{X}} in (3.26) then has the form

𝐗~𝐱,𝐲=s,ω,𝐑,𝐑𝐂^𝐑𝐑(s,ω)eiω(t𝐑𝐱(s)t𝐑(s))eiω(t𝐑𝐲(s)t𝐑(s))s,ω,𝐑,𝐑|ξ(ω,s)|2i,j=1Mρiρjeiω(t𝐑𝐱(s)t𝐑i(s)(t𝐑𝐲(s)t𝐑j(s)))\begin{split}\tilde{\mathbf{X}}_{\mathbf{x},\mathbf{y}}&=\sum\limits_{s,\omega,\mathbf{R},\mathbf{R}^{\prime}}\widehat{\mathbf{C}}_{\mathbf{R}\mathbf{R}^{\prime}}(s,\omega)e^{i\omega(t_{\mathbf{R}}^{\mathbf{x}}(s)-t_{\mathbf{R}}(s))}e^{-i\omega(t_{\mathbf{R}^{\prime}}^{\mathbf{y}}(s)-t_{\mathbf{R}^{\prime}}(s))}\\ &\approx\sum\limits_{s,\omega,\mathbf{R},\mathbf{R}^{\prime}}|\xi(\omega,s)|^{2}\sum\limits_{i,j=1}^{M}\rho_{i}\rho_{j}e^{i\omega(t_{\mathbf{R}}^{\mathbf{x}}(s)-t_{\mathbf{R}}^{i}(s)-(t_{\mathbf{R}^{\prime}}^{\mathbf{y}}(s)-t_{\mathbf{R}^{\prime}}^{j}(s)))}\end{split} (B.3)

We approximate the sum over pulses and frequencies with integrals. The sum over receiver pairs is replaced by a double integral over the physical aperture spanned by the receivers. This is well justified if we assume that the receiver positions are uniformly distributed over an area of 200km×200km200\text{km}\times 200\text{km} as we do here. By making the change s,𝐑,𝐑𝑑s𝑑𝐱𝐑𝑑𝐱𝐑\sum\limits_{s,\mathbf{R},\mathbf{R}^{\prime}}\rightarrow\int ds\int d\mathbf{x}_{\mathbf{R}}\int d\mathbf{x}_{\mathbf{R}^{\prime}}, the interference pattern 𝐗~\tilde{\mathbf{X}} has the form

𝐗~𝐱,𝐲𝑑𝐱𝐑𝑑𝐱𝐑𝑑s𝑑ω|ξ(ω,s)|2i,j=1Mρiρjeiω(t𝐑𝐱(s)t𝐑i(s)(t𝐑𝐲(s)t𝐑j(s)))=i,j=1Mρiρj𝑑𝐱𝐑𝑑𝐱𝐑𝑑s𝑑ω|ξ(ω,s)|2eiω(t𝐑𝐱(s)t𝐑i(s)(t𝐑𝐲(s)t𝐑j(s)))=i,j=1Mρiρj𝑑ω𝑑s|ξ(ω,s)|2𝑑𝐱𝐑eiω(t𝐑𝐱(s)t𝐑i(s))𝑑𝐱𝐑eiω(t𝐑𝐲(s)t𝐑j(s))\begin{split}\tilde{\mathbf{X}}_{\mathbf{x},\mathbf{y}}&\approx\int d\mathbf{x}_{\mathbf{R}}d\mathbf{x}_{\mathbf{R}^{\prime}}dsd\omega|\xi(\omega,s)|^{2}\sum\limits_{i,j=1}^{M}\rho_{i}\rho_{j}e^{i\omega(t_{\mathbf{R}}^{\mathbf{x}}(s)-t_{\mathbf{R}}^{i}(s)-(t_{\mathbf{R}^{\prime}}^{\mathbf{y}}(s)-t_{\mathbf{R}^{\prime}}^{j}(s)))}\\ &=\sum\limits_{i,j=1}^{M}\rho_{i}\rho_{j}\int d\mathbf{x}_{\mathbf{R}}d\mathbf{x}_{\mathbf{R}^{\prime}}dsd\omega|\xi(\omega,s)|^{2}e^{i\omega(t_{\mathbf{R}}^{\mathbf{x}}(s)-t_{\mathbf{R}}^{i}(s)-(t_{\mathbf{R}^{\prime}}^{\mathbf{y}}(s)-t_{\mathbf{R}^{\prime}}^{j}(s)))}\\ &=\sum\limits_{i,j=1}^{M}\rho_{i}\rho_{j}\int d\omega\int ds|\xi(\omega,s)|^{2}\int d\mathbf{x}_{\mathbf{R}}e^{i\omega(t_{\mathbf{R}}^{\mathbf{x}}(s)-t_{\mathbf{R}}^{i}(s))}\int d\mathbf{x}_{\mathbf{R}^{\prime}}e^{-i\omega(t_{\mathbf{R}^{\prime}}^{\mathbf{y}}(s)-t_{\mathbf{R}^{\prime}}^{j}(s))}\end{split} (B.4)

We see that the integrals over the physical receiver aperture separate. We can approximate the travel time difference in the exponent using |𝐱𝐓(s)𝐱𝐄|,|𝐱𝐓(s)𝐱𝐑||𝐱|,|𝐲||\mathbf{x}_{\mathbf{T}}(s)-\mathbf{x}_{\mathbf{E}}|,|\mathbf{x}_{\mathbf{T}}(s)-\mathbf{x}_{\mathbf{R}}|\gg|\mathbf{x}|,|\mathbf{y}|. We have to first order

|𝐳+𝐰||𝐳|+𝐳|𝐳|𝐰+O(|𝐰|2).|\mathbf{z}+\mathbf{w}|\approx|\mathbf{z}|+\frac{\mathbf{z}}{|\mathbf{z}|}\cdot\mathbf{w}+O(|\mathbf{w}|^{2}).

Thus, also taking γ𝐑1\gamma_{\mathbf{R}}\approx 1, we can approximate the argument of the exponent as

t𝐑𝐱(s)t𝐑i(s)=|𝐱𝐓(s)+𝐱𝐱𝐄|c0+|𝐱𝐓(s)+𝐱𝐱𝐑|c0γ𝐑(𝐱𝐓(s)+𝐱,𝐱𝐄,𝐯T)|𝐱𝐓(s)+𝐲i𝐱𝐄|c0|𝐱𝐓(s)+𝐲i𝐱𝐑|c0γ𝐑(𝐱𝐓(s)+𝐲i,𝐱𝐄,𝐯T)1c0(𝐱𝐲i)𝐱𝐓(s)𝐱𝐄|𝐱𝐓(s)𝐱𝐄|+1c0(𝐱𝐲i)𝐱𝐓(s)𝐱𝐑|𝐱𝐓(s)𝐱𝐑|\begin{split}t_{\mathbf{R}}^{\mathbf{x}}(s)-t_{\mathbf{R}}^{i}(s)=&\frac{|\mathbf{x}_{\mathbf{T}}(s)+\mathbf{x}-\mathbf{x}_{\mathbf{E}}|}{c_{0}}+\frac{|\mathbf{x}_{\mathbf{T}}(s)+\mathbf{x}-\mathbf{x}_{\mathbf{R}}|}{c_{0}}\gamma_{\mathbf{R}}(\mathbf{x}_{\mathbf{T}}(s)+\mathbf{x},\mathbf{x}_{\mathbf{E}},\mathbf{v}_{T})\\ -&\frac{|\mathbf{x}_{\mathbf{T}}(s)+\mathbf{y}_{i}-\mathbf{x}_{\mathbf{E}}|}{c_{0}}-\frac{|\mathbf{x}_{\mathbf{T}}(s)+\mathbf{y}_{i}-\mathbf{x}_{\mathbf{R}}|}{c_{0}}\gamma_{\mathbf{R}}(\mathbf{x}_{\mathbf{T}}(s)+\mathbf{y}_{i},\mathbf{x}_{\mathbf{E}},\mathbf{v}_{T})\\ &\approx\frac{1}{c_{0}}(\mathbf{x}-\mathbf{y}_{i})\cdot\frac{\mathbf{x}_{\mathbf{T}}(s)-\mathbf{x}_{\mathbf{E}}}{|\mathbf{x}_{\mathbf{T}}(s)-\mathbf{x}_{\mathbf{E}}|}+\frac{1}{c_{0}}(\mathbf{x}-\mathbf{y}_{i})\cdot\frac{\mathbf{x}_{\mathbf{T}}(s)-\mathbf{x}_{\mathbf{R}}}{|\mathbf{x}_{\mathbf{T}}(s)-\mathbf{x}_{\mathbf{R}}|}\end{split} (B.5)

We can then write the integral over the physical aperture as

𝑑𝐱𝐑eiω(t𝐑𝐱(s)t𝐑i(s))𝑑𝐱𝐑eiω(1c0(𝐱𝐲i)𝐱𝐓(s)𝐱𝐄|𝐱𝐓(s)𝐱𝐄|+1c0(𝐱𝐲i)𝐱𝐓(s)𝐱𝐑|𝐱𝐓(s)𝐱𝐑|)=eiω(1c0(𝐱𝐲i)𝐱𝐓(s)𝐱𝐄|𝐱𝐓(s)𝐱𝐄|)𝑑𝐱𝐑eiω(1c0(𝐱𝐲i)𝐱𝐓(s)𝐱𝐑|𝐱𝐓(s)𝐱𝐑|)\begin{split}\int d\mathbf{x}_{\mathbf{R}}e^{i\omega(t_{\mathbf{R}}^{\mathbf{x}}(s)-t_{\mathbf{R}}^{i}(s))}&\approx\int d\mathbf{x}_{\mathbf{R}}e^{i\omega\left(\frac{1}{c_{0}}(\mathbf{x}-\mathbf{y}_{i})\cdot\frac{\mathbf{x}_{\mathbf{T}}(s)-\mathbf{x}_{\mathbf{E}}}{|\mathbf{x}_{\mathbf{T}}(s)-\mathbf{x}_{\mathbf{E}}|}+\frac{1}{c_{0}}(\mathbf{x}-\mathbf{y}_{i})\cdot\frac{\mathbf{x}_{\mathbf{T}}(s)-\mathbf{x}_{\mathbf{R}}}{|\mathbf{x}_{\mathbf{T}}(s)-\mathbf{x}_{\mathbf{R}}|}\right)}\\ &=e^{i\omega\left(\frac{1}{c_{0}}(\mathbf{x}-\mathbf{y}_{i})\cdot\frac{\mathbf{x}_{\mathbf{T}}(s)-\mathbf{x}_{\mathbf{E}}}{|\mathbf{x}_{\mathbf{T}}(s)-\mathbf{x}_{\mathbf{E}}|}\right)}\int d\mathbf{x}_{\mathbf{R}}e^{i\omega\left(\frac{1}{c_{0}}(\mathbf{x}-\mathbf{y}_{i})\cdot\frac{\mathbf{x}_{\mathbf{T}}(s)-\mathbf{x}_{\mathbf{R}}}{|\mathbf{x}_{\mathbf{T}}(s)-\mathbf{x}_{\mathbf{R}}|}\right)}\end{split} (B.6)

This is a classical result in array imaging [2]. The physical receiver array induces an integral over phases linear in the difference between the positions of the scatterer and the search point 𝐱𝐲i\mathbf{x}-\mathbf{y}_{i}. If we further define

𝐤𝐑=ωc0𝐱𝐓(s)𝐱𝐑|𝐱𝐓(s)𝐱𝐑|,|𝐤𝐑|=ωc0,\mathbf{k}_{\mathbf{R}}=\frac{\omega}{c_{0}}\frac{\mathbf{x}_{\mathbf{T}}(s)-\mathbf{x}_{\mathbf{R}}}{|\mathbf{x}_{\mathbf{T}}(s)-\mathbf{x}_{\mathbf{R}}|},\quad|\mathbf{k}_{\mathbf{R}}|=\frac{\omega}{c_{0}},

the integral is in fact one over a domain Ω\Omega in 𝐤\mathbf{k} space, which is a subdomain of the 2-sphere with radius ω/c0\omega/c_{0}, as illustrated in Figure 15,

eiω(1c0(𝐱𝐲i)𝐱𝐓(s)𝐱𝐄|𝐱𝐓(s)𝐱𝐄|)Ω𝑑𝐤𝐑|J|ei𝐤𝐑(𝐱𝐲i),ΩS2(ω/c0)\begin{split}e^{i\omega\left(\frac{1}{c_{0}}(\mathbf{x}-\mathbf{y}_{i})\cdot\frac{\mathbf{x}_{\mathbf{T}}(s)-\mathbf{x}_{\mathbf{E}}}{|\mathbf{x}_{\mathbf{T}}(s)-\mathbf{x}_{\mathbf{E}}|}\right)}\int\limits_{\Omega}d\mathbf{k}_{\mathbf{R}}|J|e^{i\mathbf{k}_{\mathbf{R}}\cdot(\mathbf{x}-\mathbf{y}_{i})},\quad\Omega\subset S^{2}(\omega/c_{0})\end{split} (B.7)

The Jacobian JJ and the integral can be evaluated in a more general setting using the Green-Helmholtz identity [13]. We can then write (B.4) as

i,j=1Mρiρj𝑑ω𝑑s|ξ(ω,s)|2eiω(1c0((𝐱𝐲i)(𝐲𝐲j))𝐱𝐓(s)𝐱𝐄|𝐱𝐓(s)𝐱𝐄|)Ω×Ω𝑑𝐤𝐑𝑑𝐤𝐑|J||J|ei(𝐤𝐑(𝐱𝐲i)𝐤𝐑(𝐲𝐲j))\sum\limits_{i,j=1}^{M}\rho_{i}\rho_{j}\int d\omega\int ds|\xi(\omega,s)|^{2}e^{i\omega\left(\frac{1}{c_{0}}((\mathbf{x}-\mathbf{y}_{i})-(\mathbf{y}-\mathbf{y}_{j}))\cdot\frac{\mathbf{x}_{\mathbf{T}}(s)-\mathbf{x}_{\mathbf{E}}}{|\mathbf{x}_{\mathbf{T}}(s)-\mathbf{x}_{\mathbf{E}}|}\right)}\int\limits_{\Omega\times\Omega}d\mathbf{k}_{\mathbf{R}}d\mathbf{k}_{\mathbf{R}^{\prime}}|J||J^{\prime}|e^{i\left(\mathbf{k}_{\mathbf{R}}\cdot(\mathbf{x}-\mathbf{y}_{i})-\mathbf{k}_{\mathbf{R}^{\prime}}\cdot(\mathbf{y}-\mathbf{y}_{j})\right)} (B.8)
Refer to caption
Figure 15: Example of 𝐤𝐑\mathbf{k}_{\mathbf{R}} - a sub domain of the unit sphere induced by the positions of the receivers on the ground.

Similar expressions have also been analyzed in [2]. As expected, the resolution is inversely proportional to the physical aperture size, and is bounded by λ/2\lambda/2.

We can make a further approximation to simplify the calculation in our case. Assume

|𝐱𝐓(s)𝐱𝐑|,|𝐱𝐓(s)𝐱𝐄|H𝐓,|\mathbf{x}_{\mathbf{T}}(s)-\mathbf{x}_{\mathbf{R}}|,|\mathbf{x}_{\mathbf{T}}(s)-\mathbf{x}_{\mathbf{E}}|\approx H_{\mathbf{T}},

where H𝐓H_{\mathbf{T}} is the height of the targets. This is well justified for uniformlly distributed ground receivers and an inverse aperture of a size comparable to the ground array (|𝐯TS|a|\mathbf{v}_{T}S|\gtrsim a, aa the diameter of the receiver array). In this approximation we also have that ξ(ω,s)ξ(ω)\xi(\omega,s)\approx\xi(\omega). Noting 𝐱𝐓(s)=𝐱𝐓+s𝐯𝐓\mathbf{x}_{\mathbf{T}}(s)=\mathbf{x}_{\mathbf{T}}+s\mathbf{v}_{\mathbf{T}}, we can rewrite the integral (B.8) as

i,j=1Mρiρjeiω1c0𝐱𝐓𝐱𝐄H𝐓((𝐱𝐲i)(𝐲𝐲j))𝑑ω|ξ(ω)|2×d𝐱𝐑eiωc0𝐱𝐓𝐱𝐑H𝐓(𝐱𝐲i)d𝐱𝐑eiωc0𝐱𝐓𝐱𝐑H𝐓(𝐲𝐲j)S/2S/2dsei2ωc0s𝐯𝐓H𝐓((𝐱𝐲i)(𝐲𝐲j))Ci,j=1Mρiρj𝑑ω|ξ(ω)|2(𝐱𝐲i)(𝐲𝐲j)sinc(ωc0S𝐯𝐓H𝐓((𝐱𝐲i)(𝐲𝐲j))).\begin{split}&\sum\limits_{i,j=1}^{M}\rho_{i}\rho_{j}e^{i\omega\frac{1}{c_{0}}\frac{\mathbf{x}_{\mathbf{T}}-\mathbf{x}_{\mathbf{E}}}{H_{\mathbf{T}}}\cdot\left((\mathbf{x}-\mathbf{y}_{i})-(\mathbf{y}-\mathbf{y}_{j})\right)}\int d\omega|\xi(\omega)|^{2}\\ &\times\int d\mathbf{x}_{\mathbf{R}}e^{i\frac{\omega}{c_{0}}\frac{\mathbf{x}_{\mathbf{T}}-\mathbf{x}_{\mathbf{R}}}{H_{\mathbf{T}}}\cdot(\mathbf{x}-\mathbf{y}_{i})}\int d\mathbf{x}_{\mathbf{R^{\prime}}}e^{-i\frac{\omega}{c_{0}}\frac{\mathbf{x}_{\mathbf{T}}-\mathbf{x}_{\mathbf{R^{\prime}}}}{H_{\mathbf{T}}}\cdot(\mathbf{y}-\mathbf{y}_{j})}\int\limits_{-S/2}^{S/2}dse^{i2\frac{\omega}{c_{0}}\frac{s\mathbf{v}_{\mathbf{T}}}{H_{\mathbf{T}}}\cdot\left((\mathbf{x}-\mathbf{y}_{i})-(\mathbf{y}-\mathbf{y}_{j})\right)}\\ &\approx C\sum\limits_{i,j=1}^{M}\rho_{i}\rho_{j}\int d\omega|\xi(\omega)|^{2}\mathcal{B}(\mathbf{x}-\mathbf{y}_{i})\mathcal{B}^{*}(\mathbf{y}-\mathbf{y}_{j})\hskip 1.00006pt\text{sinc}\left(\frac{\omega}{c_{0}}\frac{S\mathbf{v}_{\mathbf{T}}}{H_{\mathbf{T}}}\cdot\left((\mathbf{x}-\mathbf{y}_{i})-(\mathbf{y}-\mathbf{y}_{j})\right)\right).\end{split} (B.9)

If we assume a rectangular grid 𝐱𝐑=(x1,x2),xi[a/2,a/2]\mathbf{x}_{\mathbf{R}}=(x_{1},x_{2}),x_{i}\in[-a/2,a/2] then the point spread function is

(𝐱𝐲i)=𝑑𝐱𝐑eiωc0𝐱𝐓𝐱𝐑H𝐓(𝐱𝐲i)=a2eiωc0𝐱𝐓H𝐓(𝐱𝐲i)sinc(ωc0a2H𝐓(x1yi,1))sinc(ωc0a2H𝐓(x2yi,2))\mathcal{B}(\mathbf{x}-\mathbf{y}_{i})=\int d\mathbf{x}_{\mathbf{R}}e^{i\frac{\omega}{c_{0}}\frac{\mathbf{x}_{\mathbf{T}}-\mathbf{x}_{\mathbf{R}}}{H_{\mathbf{T}}}\cdot(\mathbf{x}-\mathbf{y}_{i})}=a^{2}e^{i\frac{\omega}{c_{0}}\frac{\mathbf{x}_{\mathbf{T}}}{H_{\mathbf{T}}}\cdot(\mathbf{x}-\mathbf{y}_{i})}\text{sinc}\left(\frac{\omega}{c_{0}}\frac{a}{2H_{\mathbf{T}}}(x_{1}-y_{i,1})\right)\text{sinc}\left(\frac{\omega}{c_{0}}\frac{a}{2H_{\mathbf{T}}}(x_{2}-y_{i,2})\right) (B.10)

As illustrated in figures 15-17, the approximations made above are well justified in the context of our numerical simulations.

Refer to caption
(a)
Refer to caption
(b)
Figure 16: (a)(a) Evaluation of the absolute value of (B.6), with exact expressions for t𝐑𝐱t_{\mathbf{R}}^{\mathbf{x}} (left), and calculation using the linear approximation of (B.10) (right). The 400 receivers are located on a Cartesian grid of size 200km×200km200\text{km}\times 200\text{km} with 10km spacing (b)(b) 1D cut of Figure 16(a). We can see that the linear approximation is well justified.
Refer to caption
(a)
Refer to caption
(b)
Figure 17: (a)(a)Evaluation of the absolute value of (B.6), with exact expressions for t𝐑𝐱t_{\mathbf{R}}^{\mathbf{x}} (left), and calculation using the linear approximation of (B.10) (right). The 400 receivers uniformly distributed in a square of size 200km×200km200\text{km}\times 200\text{km} with 10km spacing (b)(b) 1D cut of Figure 17(a). We can see that the linear approximation is well justified even when receivers are randomly distributed.

We see that (𝐱𝐲i)\mathcal{B}(\mathbf{x}-\mathbf{y}_{i}) is, as a function of 𝐱\mathbf{x}, localized around the scatterer location 𝐲i\mathbf{y}_{i}. Hence 𝐗~𝐱,𝐲\tilde{\mathbf{X}}_{\mathbf{x},\mathbf{y}} has peaks at points (𝐱,𝐲)=(𝐲i,𝐲j)4(\mathbf{x},\mathbf{y})=(\mathbf{y}_{i},\mathbf{y}_{j})\in\mathbb{R}^{4}, where 𝐲i,𝐲j\mathbf{y}_{i},\mathbf{y}_{j} are scatterer positions. (𝐱)\mathcal{B}(\mathbf{x}) has an effective resolution λH𝐓a\lambda\frac{H_{\mathbf{T}}}{a}. Recall that this is the classical cross range resolution obtained with an array of size aa, imaging a point at range H𝐓H_{\mathbf{T}}. On the other hand, the synthetic aperture produces the term sinc(ωc0𝐯𝐓H𝐓S((𝐱𝐲i)(𝐲𝐲j)))\text{sinc}\left(\frac{\omega}{c_{0}}\frac{\mathbf{v}_{\mathbf{T}}}{H_{\mathbf{T}}}S\cdot\left((\mathbf{x}-\mathbf{y}_{i})-(\mathbf{y}-\mathbf{y}_{j})\right)\right) in (B.9), which has resolution λH𝐓2𝐯𝐓S\lambda\frac{H_{\mathbf{T}}}{2\mathbf{v}_{\mathbf{T}}S}. For small SS the resolution is dominated by the size aa of the receiver array. However as the inverse aperture increases and becomes comparable to a/2a/2, anisotropy appears, as illustrated in Figure 13 in Section  5. The effect of the synthetic aperture is however not isotropic. Since the argument of the sinc is 𝐱𝐲i(𝐲𝐲j)\mathbf{x}-\mathbf{y}_{i}-(\mathbf{y}-\mathbf{y}_{j}), the direction in which the argument is constant will be unaffected, while the orthogonal direction experiences the strongest decay. We note again that the single point migration is equivalent to taking 𝐱=𝐲\mathbf{x}=\mathbf{y} with 𝐱𝐲=0\mathbf{x}-\mathbf{y}=0 and so its resolution does not benefit from the synthetic aperture.

We have thus shown that we can approximate the form of 𝐗~\tilde{\mathbf{X}} in (3.26) as a collection of localized peaks, located at pairs of scatterer positions. When considering the extended domain of the interference pattern the peaks exhibit anisotropy with principal widths that are aligned with the directions 𝐱+𝐲=constant\mathbf{x}+\mathbf{y}=\text{constant}, 𝐱𝐲=constant\mathbf{x}-\mathbf{y}=\text{constant}.

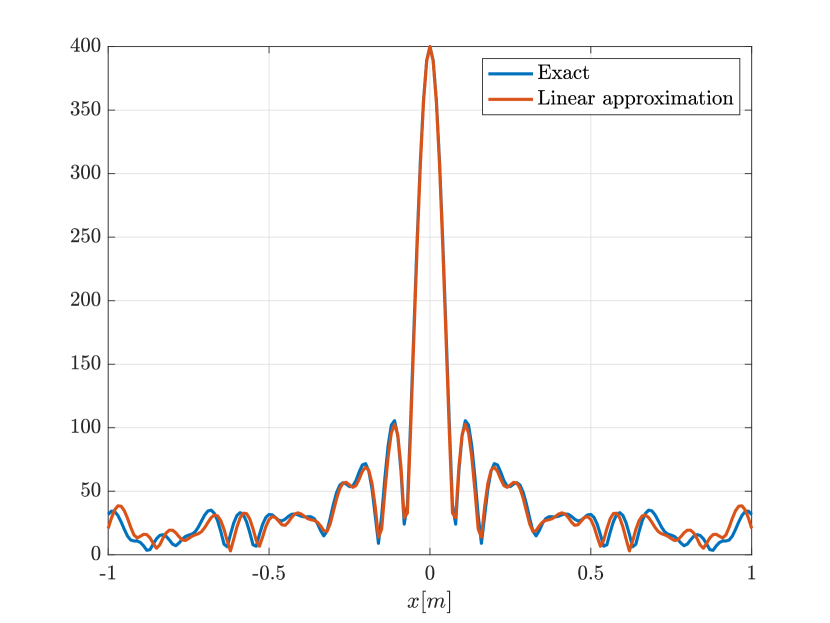
The rank-1 image takes as an alternative image the top eigenvector of 𝐗~\tilde{\mathbf{X}}. In Appendix  C, we analyze the top eigenfunction of kernels that have a similar anisotropic form, and show that in general the resolution of the eigenfunction is better than the maximal width associated with single point migration.

Appendix C Eigenfunction of localized kernels

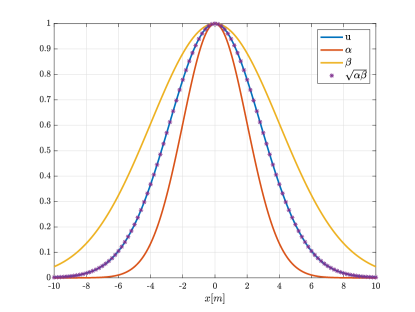
In this appendix we estimate the top eigenfunction of a localized anisotropic kernel in one dimension. This is the continuum limit of the results obtained in Appendix B, where it was shown that the peaks of the two point interference pattern are anisotropic. We evaluate the top eigenfunction, show it is localized, and get an estimate for its width in terms of the principal widths of the kernel. We show results in 1D, but they generalize to higher dimensions.

We saw in (B.9) that the peaks of the two point interference pattern have principal widths in the directions 𝐱+𝐲=constant\mathbf{x}+\mathbf{y}=\text{constant}, 𝐱𝐲=constant\mathbf{x}-\mathbf{y}=\text{constant}. Hence, we are interested in analyzing kernels of the form

𝒦(x,y)=i,j=1MρiρjK(xyi,yyj),K(x,y)=f(xyα)f(x+yβ),\mathcal{K}(x,y)=\sum\limits_{i,j=1}^{M}\rho_{i}\rho_{j}K(x-y_{i},y-y_{j}),\quad K(x,y)=f\left(\frac{x-y}{\alpha}\right)f\left(\frac{x+y}{\beta}\right),

where f(x)f(x) is localized around x=0x=0. This is an intermediate case between two extreme cases. If α=β\alpha=\beta, f(x)f(x) is approximately separable (indeed separable if f(x)f(x) is a Gaussian), and K(x,y)K(x,y) has rank 1 with eigenfunction f(xα)f\left(\frac{x}{\alpha}\right). On the other hand if either α,β\alpha,\beta\rightarrow\infty, K(x,y)K(x,y) would be a correlation/convolution kernel and will have full rank, with non localized eigenfunctions. We are thus interested in the intermediate case.

We specifically look at two cases for f(x)f(x)- we start with a Gaussian kernel for which an analytical solution exists, and then consider a more realistic sinc model. While the Gaussian case is given here for illustration purposes, it could represent a situation where the medium has random fluctuations [5].

We first analyze the eigenfunctions of K(x,y)K(x,y) in the two cases. We then show how the eigenfunction of 𝒦(x,y)\mathcal{K}(x,y) can be expressed using them.

C.1 Gaussian Kernel Approximation

Introduce the following Gaussian model for K(x,y)K(x,y),

K(x,y)=eα2(x+y)2β2(xy)2=eα(x+y2)2β(xy2)2,x,y.K(x,y)=e^{-\frac{\alpha}{2}(x+y)^{2}-\frac{\beta}{2}(x-y)^{2}}=e^{-\alpha(\frac{x+y}{\sqrt{2}})^{2}-\beta(\frac{x-y}{\sqrt{2}})^{2}},\quad x,y\in\mathbb{R}. (C.1)

And plug in a candidate eigenfunction u(y)=eγy2u(y)=e^{-\gamma y^{2}}. For uu to be an eigenfunction, it must satisfy

𝑑yK(x,y)u(y)=λuu(x).\int_{\mathbb{R}}dyK(x,y)u(y)=\lambda_{u}u(x). (C.2)

The exponential argument of K(x,y)u(y)K(x,y)u(y) has the form:

α2(x+y)2β2(xy)2γy2=α+β2x2α+β+2γ2y2+(αβ)xy.\begin{split}&-\frac{\alpha}{2}(x+y)^{2}-\frac{\beta}{2}(x-y)^{2}-\gamma y^{2}=-\frac{\alpha+\beta}{2}x^{2}-\frac{\alpha+\beta+2\gamma}{2}y^{2}+(\alpha-\beta)xy.\end{split} (C.3)

Denote z=α+β+2γ2z=\frac{\alpha+\beta+2\gamma}{2}, then we can rewrite the argument as

α+β2x2z(yαβ2zx)2+(αβ)24zx2.\begin{split}-\frac{\alpha+\beta}{2}x^{2}-z\left(y-\frac{\alpha-\beta}{2z}x\right)^{2}+\frac{(\alpha-\beta)^{2}}{4z}x^{2}.\end{split} (C.4)

Integrating over yy we get

𝑑yK(x,y)u(y)e(α+β2(αβ)24z)x2\int_{\mathbb{R}}dyK(x,y)u(y)\propto e^{-\left(\frac{\alpha+\beta}{2}-\frac{(\alpha-\beta)^{2}}{4z}\right)x^{2}} (C.5)

i.e. plugging in the value for zz, the equation for γ>0\gamma>0 is

γ=α+β2(αβ)22(α+β)+4γ2γ(α+β+2γ)=(α+β)2+2γ(α+β)(αβ)24γ2=4αβγ=αβ\begin{split}&\gamma=\frac{\alpha+\beta}{2}-\frac{(\alpha-\beta)^{2}}{2(\alpha+\beta)+4\gamma}\\ \Rightarrow&2\gamma(\alpha+\beta+2\gamma)=(\alpha+\beta)^{2}+2\gamma(\alpha+\beta)-(\alpha-\beta)^{2}\\ \Rightarrow&4\gamma^{2}=4\alpha\beta\Rightarrow\gamma=\sqrt{\alpha\beta}\end{split} (C.6)

The eigenfunction has a variance which is the geometric mean of the variances of the two principal axes.

Since K(x,y)K(x,y) has non-negative entries and its support is a non-disjoint set, we know by the Krein-Rutman theorem [17] (extension of the Perron-Frobenius theorem to Banach spaces) that its top eigenfunction can be chosen to be strictly non-negative, so we have indeed recovered the top eigenfunction.

Refer to caption
Figure 18: Comparison of the top singular value of the Gaussian kernel of form (C.1). We can see that indeed the eigenfunction is a Gaussian with variance which is a geometric mean of α,β\alpha,\beta.

C.2 Sinc kernel approximation

We now wish to approximate the kernel as a product of 2 sinc functions:

K(x,y)=sinc(α(xy))sinc(β(x+y)),α>β,x,y.K(x,y)=\text{sinc}(\alpha(x-y))\text{sinc}(\beta(x+y)),\quad\alpha>\beta,\quad x,y\in\mathbb{R}. (C.7)

This is a more realistic case since we saw that the behavior around the peaks of the two point interferece pattern can be approximated as a product of sinc functions. We’ll look for a candidate eigenfunction of the form u=sinc(γy)u=\text{sinc}(\gamma y). Numerical simulations suggest that while this is not an exact eigenfunction, it is close to one. Specifically, Kuλu+ϵ,ϵ21Ku\approx\lambda u+\epsilon,\|\epsilon\|_{2}\ll 1.

We are looking to estimate an integral of the form:

sin(α(xy))sin(β(x+y))sin(γy)α(xy)β(x+y)γy𝑑y\int_{\mathbb{R}}\frac{\sin(\alpha(x-y))\sin(\beta(x+y))\sin(\gamma y)}{\alpha(x-y)\beta(x+y)\gamma y}dy (C.8)

We first drop the constants from the denominator and use the following identity:

1(xy)(x+y)y=12x2[2y1x+y+1xy].\frac{1}{(x-y)(x+y)y}=\frac{1}{2x^{2}}\left[\frac{2}{y}-\frac{1}{x+y}+\frac{1}{x-y}\right]. (C.9)

Next we decompose the numerator using the following identity

sin(a)sin(b)sin(c)=14(sin(ab+c)sin(abc)sin(a+b+c)+sin(a+bc)).\sin(a)\sin(b)\sin(c)=\frac{1}{4}\left(\sin(a-b+c)-\sin(a-b-c)-\sin(a+b+c)+\sin(a+b-c)\right). (C.10)

Which yields in our case:

14[sin((αβ)x(α+βγ)y)sin((αβ)x(α+β+γ)y)sin((α+β)x(αβγ)y)+sin((α+β)x(αβ+γ)y)].\begin{split}\frac{1}{4}&[\sin((\alpha-\beta)x-(\alpha+\beta-\gamma)y)-\sin((\alpha-\beta)x-(\alpha+\beta+\gamma)y)\\ &-\sin((\alpha+\beta)x-(\alpha-\beta-\gamma)y)+\sin((\alpha+\beta)x-(\alpha-\beta+\gamma)y)].\end{split} (C.11)

We can combine all the terms in (C.9) to a single denominator zz using an appropriate variable transformation z=y,z=x+y,z=xyz=y,z=x+y,z=x-y.

This will give us the following numerator, up to a constant

[2sin((αβ)x(α+βγ)z)2sin((αβ)x(α+β+γ)z)2sin((α+β)x(αβγ)z)+2sin((α+β)x(αβ+γ)z)][sin((αβ)x(α+βγ)(zx))sin((αβ)x(α+β+γ)(zx))sin((α+β)x(αβγ)(zx)+sin((α+β)x(αβ+γ)(zx))]+[sin((αβ)x(α+βγ)(xz))sin((αβ)x(α+β+γ)(xz))sin((α+β)x(αβγ)(xz)+sin((α+β)x(αβ+γ)(xz))]\begin{split}&[2\sin((\alpha-\beta)x-(\alpha+\beta-\gamma)z)-2\sin((\alpha-\beta)x-(\alpha+\beta+\gamma)z)\\ &-2\sin((\alpha+\beta)x-(\alpha-\beta-\gamma)z)+2\sin((\alpha+\beta)x-(\alpha-\beta+\gamma)z)]\\ -&[\sin((\alpha-\beta)x-(\alpha+\beta-\gamma)(z-x))-\sin((\alpha-\beta)x-(\alpha+\beta+\gamma)(z-x))\\ &-\sin((\alpha+\beta)x-(\alpha-\beta-\gamma)(z-x)+\sin((\alpha+\beta)x-(\alpha-\beta+\gamma)(z-x))]\\ +&[\sin((\alpha-\beta)x-(\alpha+\beta-\gamma)(x-z))-\sin((\alpha-\beta)x-(\alpha+\beta+\gamma)(x-z))\\ &-\sin((\alpha+\beta)x-(\alpha-\beta-\gamma)(x-z)+\sin((\alpha+\beta)x-(\alpha-\beta+\gamma)(x-z))]\end{split} (C.12)

Which is up to a constant

[2sin((αβ)x(α+βγ)z)2sin((αβ)x(α+β+γ)z)2sin((α+β)x(αβγ)z)+2sin((α+β)x(αβ+γ)z)][sin((2αγ)x(α+βγ)z)sin((2α+γ)x(α+β+γ)z)sin((2αγ)x(αβγ)z)+sin((2α+γ)x(αβ+γ)z)]+[sin((2β+γ)x+(α+βγ)z)sin(2βγ)x+(α+β+γ)z)sin((2β+γ)x+(αβγ)z+sin((2βγ)x+(αβ+γ)z)]\begin{split}&[2\sin((\alpha-\beta)x-(\alpha+\beta-\gamma)z)-2\sin((\alpha-\beta)x-(\alpha+\beta+\gamma)z)\\ &-2\sin((\alpha+\beta)x-(\alpha-\beta-\gamma)z)+2\sin((\alpha+\beta)x-(\alpha-\beta+\gamma)z)]\\ -&[\sin((2\alpha-\gamma)x-(\alpha+\beta-\gamma)z)-\sin((2\alpha+\gamma)x-(\alpha+\beta+\gamma)z)\\ &-\sin((2\alpha-\gamma)x-(\alpha-\beta-\gamma)z)+\sin((2\alpha+\gamma)x-(\alpha-\beta+\gamma)z)]\\ +&[\sin((-2\beta+\gamma)x+(\alpha+\beta-\gamma)z)-\sin(-2\beta-\gamma)x+(\alpha+\beta+\gamma)z)\\ &-\sin((2\beta+\gamma)x+(\alpha-\beta-\gamma)z+\sin((2\beta-\gamma)x+(\alpha-\beta+\gamma)z)]\end{split} (C.13)

We will use extensively the following result:

PVsin(az+b)z𝑑z=πcos(b)sign(a)\text{PV}\int\limits_{-\infty}^{\infty}\frac{\sin(az+b)}{z}dz=\pi\cos(b)\text{sign}(a) (C.14)

The integral then yields:

[2cos((αβ)x)sign((α+βγ))2cos((αβ)x)sign((α+β+γ))2cos((α+β)x)sign((αβγ))+2cos((α+β)x)sign((αβ+γ)][cos((2αγ)x)sign((α+βγ))cos((2α+γ)x)sign((α+β+γ))cos((2αγ)x)sign((αβγ))+cos((2α+γ)x)sign((αβ+γ)z]+[cos((2β+γ)x)sign((α+βγ))cos(2βγ)x)sign((α+β+γ))cos((2β+γ)x)sign(αβγ)+cos((2βγ)x)sign(αβ+γ)]\begin{split}&[2\cos((\alpha-\beta)x)\text{sign}(-(\alpha+\beta-\gamma))-2\cos((\alpha-\beta)x)\text{sign}(-(\alpha+\beta+\gamma))\\ &-2\cos((\alpha+\beta)x)\text{sign}(-(\alpha-\beta-\gamma))+2\cos((\alpha+\beta)x)\text{sign}(-(\alpha-\beta+\gamma)]\\ -&[\cos((2\alpha-\gamma)x)\text{sign}(-(\alpha+\beta-\gamma))-\cos((2\alpha+\gamma)x)\text{sign}(-(\alpha+\beta+\gamma))\\ &-\cos((2\alpha-\gamma)x)\text{sign}(-(\alpha-\beta-\gamma))+\cos((2\alpha+\gamma)x)\text{sign}(-(\alpha-\beta+\gamma)z]\\ +&[\cos((-2\beta+\gamma)x)\text{sign}((\alpha+\beta-\gamma))-\cos(-2\beta-\gamma)x)\text{sign}((\alpha+\beta+\gamma))\\ &-\cos((2\beta+\gamma)x)\text{sign}(\alpha-\beta-\gamma)+\cos((2\beta-\gamma)x)\text{sign}(\alpha-\beta+\gamma)]\end{split} (C.15)

We assume α>γ>β\alpha>\gamma>\beta, so some of the signs are unambiguous

[2cos((αβ)x)+2cos((αβ)x)2cos((α+β)x)sign((αβγ))2cos((α+β)x)][cos((2αγ)x)+cos((2α+γ)x)cos((2αγ)x)sign((αβγ))cos((2α+γ)x)]+[cos((2β+γ)x)cos((2βγ)x)cos((2β+γ)x)sign(αβγ)+cos((2βγ)x)]\begin{split}&[-2\cos((\alpha-\beta)x)+2\cos((\alpha-\beta)x)\\ &-2\cos((\alpha+\beta)x)\text{sign}(-(\alpha-\beta-\gamma))-2\cos((\alpha+\beta)x)]\\ -&[-\cos((2\alpha-\gamma)x)+\cos((2\alpha+\gamma)x)\\ &-\cos((2\alpha-\gamma)x)\text{sign}(-(\alpha-\beta-\gamma))-\cos((2\alpha+\gamma)x)]\\ +&[\cos((-2\beta+\gamma)x)-\cos((-2\beta-\gamma)x)\\ &-\cos((2\beta+\gamma)x)\text{sign}(\alpha-\beta-\gamma)+\cos((2\beta-\gamma)x)]\end{split} (C.16)

If we further assume αβ<γ\alpha-\beta<\gamma we get that the integral is proportianal to

cos((2αγ)x)+cos((2β+γ)x)2cos((α+β)x)x2.\frac{\cos((2\alpha-\gamma)x)+\cos((-2\beta+\gamma)x)-2\cos((\alpha+\beta)x)}{x^{2}}. (C.17)

In order to find the approximate width γ\gamma we wish to find values of γ\gamma for which (C.17) has a zero for π/γ\pi/\gamma.

We can rewrite the numerator as

2cos((αβ)x)cos((α+βγ)x)2cos((α+β)x)2\cos((\alpha-\beta)x)\cos((\alpha+\beta-\gamma)x)-2\cos((\alpha+\beta)x) (C.18)

for x=π/γx=\pi/\gamma (the first zero of sinc(γx)\text{sinc}(\gamma x)), using cos(aπ)=cos(a)\cos(a-\pi)=-\cos(a), the numerator becomes

2cos((α+β)π/γ)(cos((αβ)π/γ)+1),-2\cos((\alpha+\beta)\pi/\gamma)(\cos((\alpha-\beta)\pi/\gamma)+1), (C.19)

which has zeros at

γ=α+βn+1/2,n,γ=αβ2n+1,n\gamma=\frac{\alpha+\beta}{n+1/2},n\in\mathbb{Z},\quad\gamma=\frac{\alpha-\beta}{2n+1},n\in\mathbb{Z}

The most localized eigenvector would be for the largest value of γ\gamma, e.g. for α=8,β=2\alpha=8,\beta=2, we get γ=23(α+β)\gamma=\frac{2}{3}(\alpha+\beta), which indeed matches the numerical estimation as can be seen in figures 19 and 20. The effective width of sin(c(x±y))\sin(c(x\pm y)), defined by the first zero in the 12(x^y^)\frac{1}{\sqrt{2}}(\widehat{x}\mp\widehat{y}) direction is π2c\frac{\pi}{\sqrt{2}c}. So if we denote

σα=π2α,σβ=π2β,σγ=πγ,\sigma_{\alpha}=\frac{\pi}{\sqrt{2}\alpha},\sigma_{\beta}=\frac{\pi}{\sqrt{2}\beta},\sigma_{\gamma}=\frac{\pi}{\gamma},

we get the equation

σ𝐮σγ=32σασβσα+σβ,\sigma_{\mathbf{u}}\approx\sigma_{\gamma}=\frac{3}{\sqrt{2}}\frac{\sigma_{\alpha}\sigma_{\beta}}{\sigma_{\alpha}+\sigma_{\beta}}, (C.20)

which is very close to the harmonic mean. It is easy to verify that with αβ>γ\alpha-\beta>\gamma the integral is 0 in principal value.

Refer to caption
Figure 19: Comparison of the top singular value of the sinc kernel of form (C.7). We can see that indeed the eigenfunction’s main lobe is approximated by a sinc with the width σγ\sigma_{\gamma}, though it decays much faster.
Refer to caption
Figure 20: Comparison of the top singular value of the sinc kernel of form (C.7) with the approximate eigenfunction in (C.17). We can see that (C.17) indeed approximates the top eigenfunction with a high degree of accuracy.

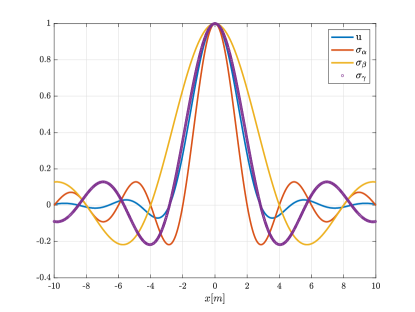
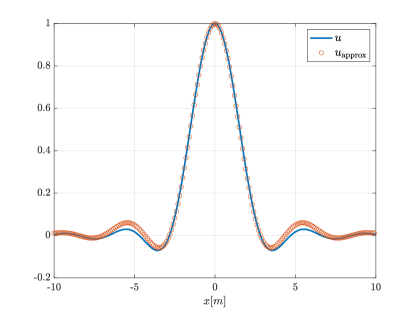
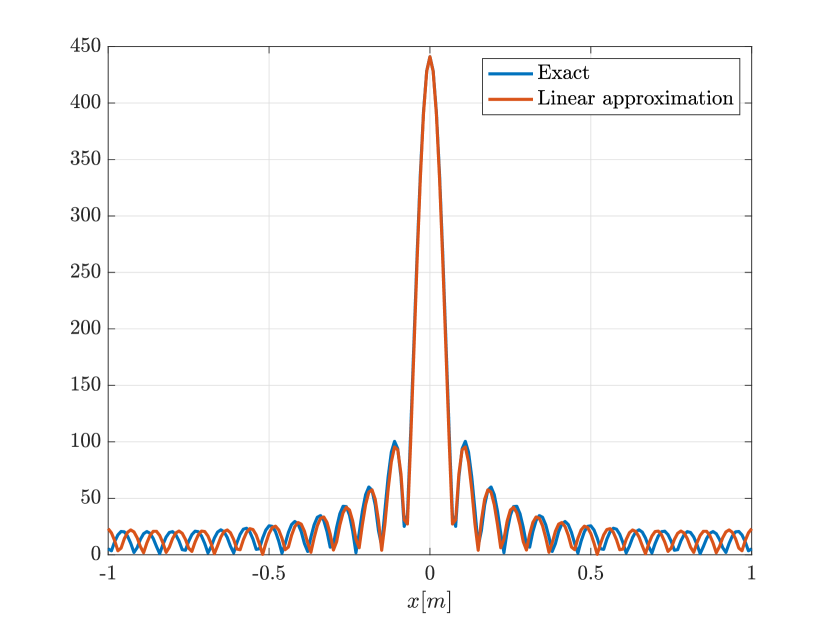
We see that in the sinc case the top eigenfunction is even more favorable compared to the case of a Gaussian kernel in the previous subsection. Now σ𝐮\sigma_{\mathbf{u}} is close to the harmonic mean which is biased toward the smaller width, that is, we gain in resolution compared to the Gaussian case, where we got the geometric mean. This makes sense as a Gaussian case could represents a random medium, as noted before, and we expect better resolution in media with weak fluctuations or no randomness. We also note that the top eigenfunction has a faster decay rate compared to the diagonal of the kernel, that is, the single point migration image. The estimation suggests x2x^{-2} as a lower bound, compared to x1x^{-1} decay of the Kernel itself.

C.3 Eigenfunction of the multiple stationary points

If now 𝒦(x,y)\mathcal{K}(x,y) is a linear combination of translations of (C.1),

𝒦(x,y)=i,jcijK(xai,yaj),\mathcal{K}{}(x,y)=\sum\limits_{i,j}c_{ij}K(x-a_{i},y-a_{j}),

then as long as the translations are far enough apart such that

𝑑yK(xai,yaj)u(yak)=ciju(xai)δjk,\int dyK(x-a_{i},y-a_{j})u(y-a_{k})=c_{ij}u(x-a_{i})\delta_{jk},

the top eigenfunction of 𝒦\mathcal{K} is

𝒰(x)=iαiu(xai)\mathcal{U}(x)=\sum\limits_{i}\alpha_{i}u(x-a_{i})

with the restriction

i,jcijαj=λαi\sum\limits_{i,j}c_{ij}\alpha_{j}=\lambda\alpha_{i}

i.e, the eigenfunction’s coefficient vector is an eigenvector of the coefficient matrix cijc_{ij}.

To summarize we have shown that the top eigenfunction of the superposition of anisotropic kernels is more localized than the maximal width of the kernel. Hence, on top of other considerations considered in Section 3, the rank-1 image provides better resolution than the single point migration image.

References

  • [1] IEEE Aerospace and Electronic Systems Magazine, 27, 2012.
  • [2] Stockwell Bleistein N., Cohen J.K. and John W. Jr. Mathematics of Multidimensional Seismic Imaging, Migration, and Inversion. Springer, 2001.
  • [3] L. Borcea, J. Garnier, G. Papanicolaou, K. Solna, and C. Tsogka. Resolution analysis of passive synthetic aperture imaging of fast moving objects. SIAM J. Imaging Sciences, 28, 2017.
  • [4] Liliana Borcea and Josselin Garnier. High-resolution interferometric synthetic aperture imaging in scattering media. arXiv preprint arXiv:1907.02514, 2019.
  • [5] Liliana Borcea, George Papanicolaou, and Chrysoula Tsogka. Theory and applications of time reversal and interferometric imaging. Inverse Problems, 19(6):S139, 2003.
  • [6] M. Cheney and B. Borden. Fundamentals of radar imaging. SIAM, 2009.
  • [7] John C. Curlander and Robert N. McDonough. Synthetic Aperture Radar: Systems and Signal Processing. Wiley-Interscience, 1991.
  • [8] Jacques Fournier, Josselin Garnier, George Papanicolaou, and Chrysoula Tsogka. Matched-filter and correlation-based imaging for fast moving objects using a sparse network of receivers. SIAM Journal on Imaging Sciences, 10(4):2165–2216, 2017.
  • [9] G. Franschetti and R. Lanari. Synthetic aperture radar processing. Boca Raton, FL: CRC Press, 1999.
  • [10] J. Garnier and G. Papanicolaou. Correlation based virtual source imaging in strongly scattering media. Inverse Problems, 28:075002, 2012.
  • [11] J. Garnier and G. Papanicolaou. Passive imaging with ambient noise. Cambridge University Press, 2016.
  • [12] J. Garnier, G. Papanicolaou, A. Semin, and C. Tsogka. Signal-to-noise ratio analysis in virtual source array imaging. SIAM J. Imaging Sciences, 8:248–279, 2015.
  • [13] Josselin Garnier and George Papanicolaou. Passive imaging with ambient noise. Cambridge University Press, 2016.
  • [14] J. A. Haimerl and G. P. Fonder. Space fence system overview. In Proceedings of the Advanced Maui Optical and Space Surveillance Technology Conference, 2015.
  • [15] Donald J Kessler and Burton G Cour-Palais. Collision frequency of artificial satellites: The creation of a debris belt. Journal of Geophysical Research: Space Physics, 83(A6):2637–2646, 1978.
  • [16] M. E. Lawrence, C. T. Hansen, S. P. Deshmukh, and B. C. Flickinger. Characterization of the effects of atmospheric lensing in sar images. SPIE Proceedings, 7308, 2009.
  • [17] P.D. Lax. Functional Analysis. Pure and Applied Mathematics: A Wiley Series of Texts, Monographs and Tracts. Wiley, 2002.
  • [18] M.S. Mahmud, S. U. Qaisar, and C. Benson. Tracking low earth orbit small debris with gps satellites a bistatic radar. In Proceedings of the Advanced Maui Optical and Space Surveillance Technology Conference, 2016.
  • [19] R. W. McMillan. Atmospheric turbulence effects on radar systems. In Proceedings of the IEEE 2010 National Aerospace & Electronics Conference, pages 181–196, 2010.
  • [20] D. Mehrholz, L. Leushacke, W. Flury, R. Jehn, H. Klinkrad, and M. Landgraf. Detecting, tracking and imaging space debris. ESA Bulletin, 109:128–134, 2002.
  • [21] M. T. Valley, S. P. Kearney, and M. Ackermann. Small space object imaging: LDRD final report. Sandia National Laboratories, 2009.
  • [22] K. Wormnes, R. Le Letty, L. Summerer, R. Schonenborg, O. Dubois-Matra, E. Luraschi, A. Cropp, H. Kragg, and J. Delaval. Esa technologies for space debris remediation. In Proceedings of 6th European Conference on Space Debris, Darmstadt, Germany, 2013.