GAMMA Challenge: Glaucoma grAding from Multi-Modality imAges
Abstract
Glaucoma is a chronic neuro-degenerative condition that is one of the world’s leading causes of irreversible but preventable blindness. The blindness is generally caused by the lack of timely detection and treatment. Early screening is thus essential for early treatment to preserve vision and maintain life quality. Color fundus photography and Optical Coherence Tomography (OCT) are the two most cost-effective tools for glaucoma screening. Both imaging modalities have prominent biomarkers to indicate glaucoma suspects, such as the vertical cup-to-disc ratio (vCDR) on fundus images and retinal nerve fiber layer (RNFL) thickness on OCT volume. In clinical practice, it is often recommended to take both of the screenings for a more accurate and reliable diagnosis. However, although numerous algorithms are proposed based on fundus images or OCT volumes for the automated glaucoma detection, there are few methods that leverage both of the modalities to achieve the target. To fulfill the research gap, we set up the Glaucoma grAding from Multi-Modality imAges (GAMMA) Challenge to encourage the development of fundus & OCT-based glaucoma grading. The primary task of the challenge is to grade glaucoma from both the 2D fundus images and 3D OCT scanning volumes. As part of GAMMA, we have publicly released a glaucoma annotated dataset with both 2D fundus color photography and 3D OCT volumes, which is the first multi-modality dataset for machine learning based glaucoma grading. In addition, an evaluation framework is also established to evaluate the performance of the submitted methods. During the challenge, 1272 results were submitted, and finally, ten best performing teams were selected for the final stage. We analyze their results and summarize their methods in the paper. Since all the teams submitted their source code in the challenge, we conducted a detailed ablation study to verify the effectiveness of the particular modules proposed. Finally, we identify the proposed techniques and strategies that could be of practical value for the clinical diagnosis of glaucoma. As the first in-depth study of fundus & OCT multi-modality glaucoma grading, we believe the GAMMA Challenge will serve as an essential guideline and benchmark for future research.
1 Introduction

Worldwide, glaucoma is the second-leading cause of blindness after cataracts ([37]). About 70 million people have glaucoma globally ([49]). Glaucoma can occur without any cause, but is affected by many factors. The most important of which is the intra-ocular eye pressure (IOP). Aqueous humor in the eyes flows through the pupil to the front of the eye. In a healthy eye, the fluid leaves through a drainage canal located between the iris and cornea. With glaucoma, the drainage canals become clogged with microscopic deposits. The fluid builds up in the eye. This excess fluid puts pressure on the eye. Eventually, this elevated eye pressure can damage the optic nerve head (ONH) leading to glaucoma.
Many forms of glaucoma have no warning signs. The effect is so gradual that one may not notice a change in vision until the condition is at an advanced stage. That is why glaucoma is also called the ’silent thief of sight’. Because vision loss due to glaucoma can not be recovered, it is important for the early diagnosis. If glaucoma is recognized early, vision loss can be slowed or prevented.
The function-based visual field test is the clinical gold standard of glaucoma screening, but it does not show signs of early glaucoma. Instead, an optic nerve head (ONH) assessment is a convenient way to detect early glaucoma and is currently performed widely for glaucoma screening ([21, 30, 13]). As practical and noninvasive tools, 2D fundus photography and 3D optical coherence tomography (OCT) are the most commonly used imaging modalities to evaluate the optic nerve structure in clinical practice.
The main advantage of the fundus photographs is that they can clearly show the optic disc, optic cup, and blood vessels. Among them, the clinical parameters like the vertical cup to disc ratio (vCDR), disc diameter, and the ratio of blood vessels area in inferior-superior side to area of blood vessel in the nasal-temporal side have been validated to be of great significance for the glaucoma diagnosis ([20, 16, 31, 25]). OCT measures retinal nerve fiber layer (RNFL) thickness based on its optical properties. RNFL thickness, computed from OCT volumes that are acquired in cylindrical sections surrounding the optic disc, is often used to identify glaucoma suspect. Though OCT volumes and fundus photographs are effective tools for diagnosing early glaucoma, neither of them alone can be used to exclude it. Clinically, ophthalmologists often recommend to take both of the screenings for a more accurate and reliable diagnosis. Recent report shows nearly 46.3% glaucoma cases would be ignored if using fundus images or OCT volume alone ([1]).
However, in terms of computer-aided glaucoma diagnosis, most algorithms are developed on only single modality. Although fundus photographs and OCT are both the mainstream glaucoma screening tools in clinical practice, few algorithms are established that make use of both modalities. This is primarily due to two reasons: a) there is no publicly available dataset to train and evaluate such models, and b) due to the discrepancy in the characteristics and the dimensionality between the two modalities, the task is technically challenging.
In order to overcome these issues, a challenge with an dataset , as a way to encourage the development of SOTA imaging technology on this clinically relevant task, may be an appropriate approach. Inspired by the success of Retinal Fundus Glaucoma Challenge (REFUGE) ([33]) we previously held, the Glaucoma grAding from Multi-Modality imAges (GAMMA) Challenge was organized in conjunction with the 8th Ophthalmic Medical Image Analysis (OMIA) workshop, during MICCAI 2021 (Strasbourg, France) to encourage the development of fundus & OCT-based multi-modal glaucoma grading algorithms. Given a pair consisting of a fundus image and an OCT volume, the submitted algorithms need to predict the case as normal, early-glaucoma, or progressive-glaucoma (intermediate and advanced stage). An illustration is shown in Figure 1. We also describe an evaluation framework to rank the participated teams. Ten top performing teams were invited to share their technical reports and source code. In brief, the primary contribution of the GAMMA Challenge is two-fold:
a) The first publicly available multi-modality glaucoma grading dataset for deep learning based methods is released, providing fundus photography and OCT volume pairs.
b) State-of-the-art (SOTA) machine learning methods are evaluated to encourage the development of novel methodologies for fundus & OCT-based glaucoma grading.
Due to the success of the challenge, GAMMA is expected to serve as the main benchmark for this clinically relevant task in the future.
Besides glaucoma grading labels, the optic disc & cup (OD/OC) mask labels as well as fovea location labels are also provided in the GAMMA dataset. These auxiliary tasks were proposed to investigate the role of optic disc and fovea in glaucoma grading. Thus, the participants can also submit algorithms for the OD/OC segmentation task and fovea localization task, and the final team performance includes the achieved scores on these auxiliary tasks. An illustration of the auxiliary tasks is shown in Figure 2. In the GAMMA Challenge, the participants are encouraged to utilize the auxiliary tasks to improve the performance of glaucoma grading.
The inception of the GAMMA challenge encourages many participants to contribute SOTA machine learning techniques on this task. This manuscript summarizes the GAMMA Challenge, analyzes their results, and investigates their particular approaches. All top-10 teams submitted the source code of their algorithms. This allowed us to conduct a detailed ablation study to identify which techniques were the most effective ones for the screening task. We believe that our analysis of SOTA machine learning methods will greatly benefit the future algorithm design on this task.
2 The GAMMA challenge
The GAMMA challenge was officially launched from 20 Mar 2021 to 01 October 2021, which focuses on the field of glaucoma grading based on multi-modality images (Fundus photography and OCT volume). The challenge consisted of a preliminary stage and a final stage. During the preliminary stage, we released a training set for the participating teams to train the models. The registered teams were allowed to use the training set to learn their proposed algorithms for glaucoma grading, and, optionally, for OD/OC segmentation and fovea localization. Their results can be submitted on https://aistudio.baidu.com/aistudio/competition/detail/90/0/submit-result and would be evaluated on the preliminary set. The registered teams then can see their performance on the preliminary set and adjust their algorithms. For a fair comparison of the proposed methods, the registered teams were not allowed to use any other private data set for developing their methods.
This preliminary stage lasted 30 days, and each team was allowed to make a maximum of five submissions per day. A total of 70 teams submitted 1272 valid results to the challenge platform during the preliminary stage, out of which ten teams, based on their method performance and the willingness to participate in the OMIA8 workshop, were selected to the final stage. The ten such selected teams were then ranked based on their performance on the final test set. For the final stage, teams were not allowed to modify their models anymore.
2.1 GAMMA Dataset
The dataset released by GAMMA was provided by Sun Yat-sen Ophthalmic Center, Sun Yat-sen University, Guangzhou, China, and the glaucoma and non-glaucoma subjects were randomly selected from glaucoma and myopia cohort, respectively. The dataset contained 300 samples of fundus-OCT pairs. The image acquisitions were performed in a standardized darkroom, and the patients were requested to sit upright. The OCT volumes were all acquired with a Topcon DRI OCT Triton. The OCT was centered on the macula, had a 3 3 mm en-face field of view, and each volume contained 256 two-dimensional cross-sectional images with a size of pixels. The fundus images were acquired using a KOWA camera with a resolution of pixels and a Topcon TRC-NW400 camera with a resolution of pixels. The fundus images in our dataset were centered on the macula or on the midpoint between optic disc and macula, with both optic disc and macula visible. The image quality was checked manually. The 300 samples in the GAMMA dataset correspond to 276 Chinese patients (42% female), which ranged in age from 19-77 and averaged at 40.6414.53 years old. Glaucoma accounted for 50% of the sample, including 52% in the early stage, 28.67% in the intermediate stage, and 19.33% in the advanced stage. Early glaucoma samples were obtained from 64 patients with average age of 43.4715.49, of whom 14 patients provided data from both eyes, another 30 patients provided data from the oculus sinister (OS), and 20 patients provided data from the oculus dexter (OD). Similarly, intermediate and advanced glaucoma samples were obtained from 35 and 27 patients with average ages of 47.9817.38 and 46.2414.47, respectively. In the intermediate glaucoma samples, 8 patients provided data from both eyes, 15 patients provided OS data, and 12 patients provided OD data. In the advanced glaucoma samples, 2 patients provided data from both eyes, 8 patients provided OS data, and 17 patients provided OD data. The non-glaucomatous samples in the dataset were collected from 150 patients with average age of 35.9711.29, 57 and 93 patients provided OS and OD data, respectively. We randomly divided the collected samples of each category (non-glaucoma, early-glaucoma, intermediate-glaucoma, and advanced-glaucoma) into three roughly equal parts and assigned them to each of the three challenge sets, corresponding to, we prepared 100 data pairs for each the training, preliminary process and final processes. Because the data sizes in intermediate and advanced glaucoma categories are relatively small compared to that of early glaucoma category, so we grouped the intermediate and advanced glaucoma into one category, i.e., progressive-glaucoma in the main challenge tasks.
In addition, the GAMMA dataset included the respective glaucoma grades, the fovea coordinates, and the mask of the cup and optic disc. The GAMMA dataset is publicly available through https://gamma.grand-challenge.org/, and is allowed to be used and distributed under CC BY-NC-ND (Attribution-NonCommercial-NoDerivs) licence. The following sections describe the implementation of the annotation processes of the three challenge tasks.

2.1.1 Glaucoma Grading
The ground truth of glaucoma grading task for each sample was determined based on mean deviation (MD) values from visual field reports following the criteria below: early-stage with MD value higher than -6 dB, intermediate stage with MD value between -6 and -12 dB, advanced stage with MD value worse than -12 dB. These visual field reports were generated on the same day as the OCT examination and were reliable with fixation losses of under 2/13 and false-positive rate under 15% and false-negative rate under 25% ([24, 52]).
2.1.2 Fovea Localization
The initial fovea coordinate annotation of each fundus image was performed manually by four clinical ophthalmologists from Sun Yat-sen Ophthalmic Center, Sun Yat-sen University, China, who had an average of 8 years of experience in the field (range 5-10 years). All ophthalmologists independently located the fovea in the image using a cross marker without having access to any patient information or knowledge of disease prevalence in the data. The results from the four ophthalmologists were then fused by a senior ophthalmologist (who has more than ten years of experience in glaucoma), who checked the four markers and decided which of these markers should be retained to be averaged to produce the final reference coordinate.
2.1.3 Optic Disc & Cup Segmentation
Similar to the previous task, the four ophthalmologists manually annotated the initial segmentation region of the optic cup and disc for each fundus image. The senior ophthalmologist then examined the initial segmentations and selected the intersection of the annotated results of several ophthalmologists as the final reference mask.
2.2 Challenge Evaluation
2.2.1 Glaucoma Grading
For each instance, the participants will predict normal, early-glaucoma or progressive-glaucoma. We use Cohen’s kappa as an evaluation metric for this ordinal ternary classification problem. Since our categories are ordered, kappa is quadratically weighted to manifest the different extents of the error. The final score of glaucoma grading is represented as:
| (1) |
where is the accuracy, and is the probability of predicting the correct categories by chance.
2.2.2 Fovea Localization
Fovea location is given by its X and Y coordinates. If the image does not contain a fovea, the estimated coordinate is set to be . We use the average Euclidean distance between the estimated coordinates and the real coordinates as the evaluation criterion for this task. It is worth noting that the estimated and the ground-truth coordinate values are normalized according to the image size. The final score is based on the reciprocal of the average Euclidean distance (AED) value, and the denominator addition item is set to 0.1 to keep the score within 10 points:
| (2) |
2.2.3 Optic Disc & Cup Segmentation
The Dice coefficient was calculated as the segmentation evaluation metric in the GAMMA challenge:
| (3) |
where and represent the number of pixels of the prediction and ground truth, represents the number of pixels in the overlap between the prediction and ground truth. In addition, we used Mean Absolute Error (MAE) to measure the differences of the vertical cup-to-disc ratio (vCDR) between the predicted results and the ground truth. vCDR has a direct clinical relevance as it is a common measure used in ophthalmology and optometry to assess glaucoma progression. The vCDR is calculated as the ratio of the maximum vertical diameters of the optic cup and optic disc. Each team was ranked based on the three metrics of optic cup Dice coefficient, optic disc Dice coefficient, and MAE. The final weighted score for the optic disc & cup segmentation task was as follows
| (4) |
where, the weights were chosen consistent with the REFUGE Challenge ([33]). Because vCDR was calculated based on OC and OD segmentation results, the weight for vCDR metric had the highest value, and because the OD region could limit the OC region, the metric weight for OD segmentation was set higher than that for OC segmentation.
|
|
|
|
Kappa | ||||||||||
| Single-modality | ✓ | 67.32.1 | ||||||||||||
| ✓ | 57.53.6 | |||||||||||||
| ✓ | ✓ | 67.71.8 | ||||||||||||
| ✓ | ✓ | 73.21.2 | ||||||||||||
| Multi-modality | ✓ | ✓ | 70.20.9 | |||||||||||
| ✓ | ✓ | ✓ | 77.00.7 | |||||||||||
| ✓ | ✓ | ✓ | 76.80.6 | |||||||||||
| ✓ | ✓ | ✓ | ✓ | 81.20.3 |

2.3 Baseline method
Before the challenge start, we provided a method to serve as a baseline implementation and performance for the challenge. As deep end-to-end learning has been proved to be widely effective for the biology and medical image analysis ([53, 14])
A simple dual-branch network was used to learn glaucoma grading from fundus images and 3D OCT volumes in an end-to-end manner. An illustration of the architecture is shown in Figure 3. Specifically, two CNN-based encoders are used to extract the features from fundus images and OCT volume, respectively. Two encoders are implemented following ResNet34 ([18]) with the same architecture except for the first convolutional layer. In the fundus branch, the input channel of the first convolutional layer is set as 3, and in the OCT branch, it is set as 256. The encoded features of the fundus branch and OCT branch are concatenated and classified by a fully connected layer. The model is supervised by cross-entropy loss function in the training stage. We trained it on the training dataset, evaluated it on the preliminary stage data and reported its performance on the final test data. We input the fundus images with resolution , and the OCT images with resolution . We train the networks using Adam optimizer ([22]) with batch size 4. More details of the baseline can be found in ([10]). The code of the baseline is released at https://aistudio.baidu.com/aistudio/projectdetail/1948228.
In the clinic, ophthalmologists use a combination of fundus photographs and OCT volumes for a more accurate and reliable diagnosis. We find that this approach is still applicable in deep learning-based computer-aided glaucoma diagnosis. We compare the performance of the single fundus branch, single OCT branch, and dual-branch baseline in Table 1. Of note, only the basic dual-branch model was released as the baseline to the participants (the fifth row in Table 1). From the table, one can observe that the dual-branch model outperforms the single branch one by a large margin with less variances. This indicates that despite the simple multimodal fusion strategy we adopted, multi-modal images can improve the glaucoma grading performance better than either of the modalities alone. This motivated us to hold the GAMMA Challenge to encourage the further exploration of advanced machine learning methods on this multimodal fusion task.
During the implementation of the baseline, we identified some techniques that were found particularly useful to obtain good performance on the task ([10]). The first is to utilize the local information of optic disc. Clinically, glaucoma leads to lesions in the optic disc region, such as cup-disc ratio enlargement and optic disc hemorrhage ([33]). Thus, we cropped the optic disc region of fundus images as the network’s input to make the network focus on the optic disc and cup. The optic disc region is obtained through pre-trained optic disc segmentation network. According to the results in Table 1, the local information extraction gains 7.2% improvement on mean kappa and 0.2% on standard deviation compared with the baseline.
We also note that glaucoma grading is actually an ordinal classification task. The three classifications: normal, early-glaucoma, and progressive-glaucoma, are the deterioration of glaucoma. Thus, in the training process, the loss should be smaller if the prediction is closer to the ground-truth. For example, predicting the early-glaucoma as normal should be considered as a smaller error than predicting the progressive-glaucoma as normal. Therefore, we adopted ordinal regression strategy ([32]) to perform two binary classifications, respectively. In this case, a severe error will be double-penalized by both of the classifiers. Specifically, the first classier divides the sample into 0 and 1, that is, to classify whether the input image is a glaucoma sample. The second classier divides the sample into 0 and 1 to identify the input image as progressive-glaucoma or early-glaucoma. The labels of the original triple classification task were converted according to the two binary classification tasks, that is, the labels of the normal samples were changed to (0,0), the labels of the early-glaucoma samples were changed to (1,0), and those of the progressive-glaucoma samples were changed to (1,1). The loss function used in the training processes was the sum of the two binary cross-entropy losses. According to the results in Table 1, ordinal regression independently resulted in an average 4.5% improvement of the models.
3 Methods of participating teams
The methodology applied by the ten top performing teams in the GAMMA Challenge is summarized in Table 2. In this section, we introduce their methods in the aspects of data preprocessing, architecture and ensembling strategy.
| Team | Architecture | Preprocessing | Ensemble | Method | ||||||||||||||||||||||||||
| SmartDSP ([4]) |
|
|
|
|
||||||||||||||||||||||||||
| VoxelCloud |
|
|
|
|
||||||||||||||||||||||||||
| EyeStar |
|
|
|
|
||||||||||||||||||||||||||
| HZL |
|
|
|
|
||||||||||||||||||||||||||
| MedIPBIT | Dual-branch EfficientNet |
|
|
|
||||||||||||||||||||||||||
| IBME | Dual-branch ResNet |
|
|
|||||||||||||||||||||||||||
| WZMedTech | Dual-branch ResNet |
|
|
|
||||||||||||||||||||||||||
| DIAGNOS-ETS |
|
|
|
|
||||||||||||||||||||||||||
| MedICAL | Dual-branch EfficientNet |
|
|
|
||||||||||||||||||||||||||
| FATRI-AI | EfficientNet |
|
|
|
3.1 Data Preprocessing
In the baseline implementation, we provided a default data augmentation implemented by some commonly used data augmentation techniques, including random crop, random flip and random rotation. Most of the teams used this default augmentation for data preprocessing.
Besides the standard data augmentation, during training, DIAGNOS-ETS augments the input samples by rescaling with the shorter spatial side randomly sampled in a range of 224 to 480, and cropping with size of . In the test phase, they do test-time augmentation for multi-scale ensemble. Inputs are spatially resized such that the shorter sides are 224, 256, 384, 480 respectively for each model, and all cropped to .Then they adopted ensemble over multi-scale results for the prediction. MedIPBIT cropped the fundus images to the optic disc region. In the training stage, they used the optic disc mask provided in GAMMA dataset for this cropping. In the inference stage, they used instead the masks estimated by the pre-trained segmentation network. The segmentation networks were trained on the auxiliary tasks on GAMMA dataset. Besides MedIPBIT, MedICAL also utilized OD/OC mask for data preprocessing. They enhanced their fundus image by OD/OC mask. Specifically, OD/OC region of the original image will be multiplied by a factor of 0.05 and added to the original image. MedICAL also transferred the 3D OCT volume to 2D retinal thickness heatmap by Iowa Reference Algorithm ([39]). An illustration of their process is shown in Figure 4.

3.2 Architecture
For the fundus & OCT-based glaucoma grading, almost all the teams adopted dual-branch network structure. Analogously to the baseline method, two branches extract the features of fundus images and OCT volumes. The encoded features are then concatenated for the classification. Unlike this strategy, FATRI-AI used a single network inputted by concatenated fundus image and OCT volume. Besides FATRI-AI, HZL also used a single branch of network. They proposed a multi-task UNet network to jointly learn the glaucoma grading, optic disc & cup segmentation and fovea localization. The glaucoma grading head is attached to the UNet encoder, while the segmentation head and localization head are attached to the UNet decoder. Through the multi-task learning strategy, the correlated features of different tasks will be enhanced and thus improve the performance of all the tasks.
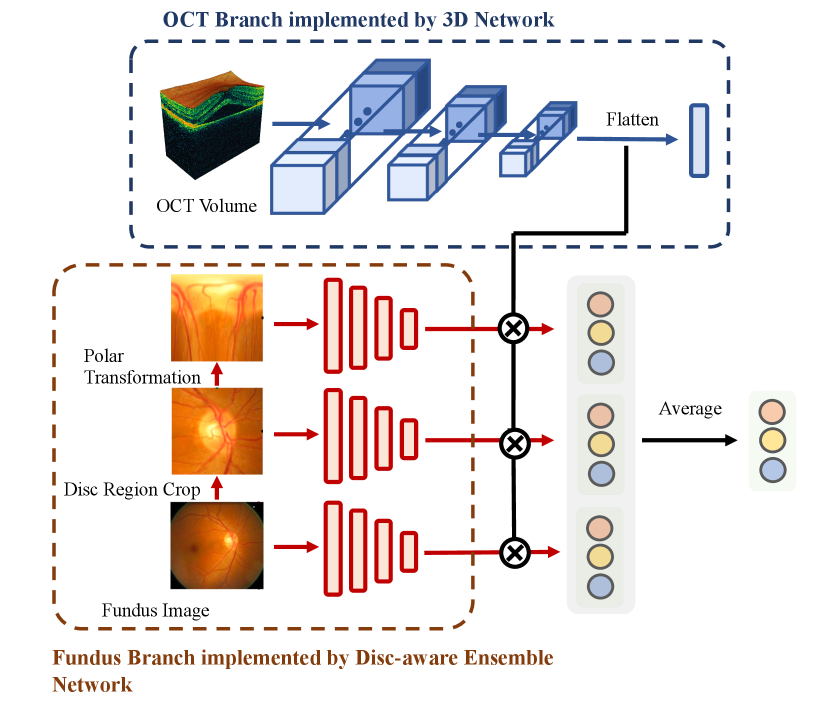
Although most of the teams adopted a dual-branch network architecture, their implementations varied greatly. VoxelCloud and DIAGNOS-ETS adopted 3D Network ([45]) in OCT branch to extract the features from 3D OCT volume. EyeStar adopted fundus Disc-aware Ensemble Network (DENet) ([12]) in fundus branch. Fundus disc-aware ensemble network uses three networks to respectively process the raw fundus image, optic disc region of the fundus image, and polar transformed optic disc region. The predictions of three networks are combined to obtain the final prediction. An illustration of 3D network and DENet is shown in Figure 5. WZMedTech used two independent networks to predict glaucoma grades based on fundus image and OCT volume, respectively. The final result is the average of the two predictions.
Regarding the supervision signal, most teams applied cross-entropy loss. DIAGNOS-ETS has an extra loss to align the fundus feature and OCT feature. Toward that end, they minimize the Kullback–Leibler (KL) divergence between these two encoded features. Instead of supervising the integrated features of two modalities, EyeStar and WZMedTech supervised the two branches independently. They took the average of the independent predictions as the final result. In the ablation experiments, we did not observe differences between these supervision strategies.
3.3 Ensemble strategy
Ensembling can substantially improve the quantitative result of glaucoma grading. A basic idea is to pick the best models on different validation folds and take the average of the results. Teams VoxelCloud, HZL, MedIPBIT, MedICAL adopted this strategy.
A unique ensemble strategy adopted in GAMMA Challenge is to exploit the ordinal nature of class labels for ensembling. Separating the triple-classification problem into two binary-classification ones can help to improve the results. Both SmartDSP and WZMedTech adopted a similar idea for their ensembling strategy. WZMedTech discriminated early/progressive cases based on the dual-model agreed glaucoma cases. They double-checked the normal cases by two different models, i.e., first discriminated the normal/glaucoma cases, then classified progressive/early by the second model on predicted glaucoma cases. SmartDSP followed the same high-level idea, but adopted a more sophisticated strategy. They first picked three models with the best accuracy on normal, early, and progressive cases, respectively. Then they discriminated the progressive cases by thresholding the progressive model with 0.6, discriminated the cases as glaucoma by thresholding the normal model with 0.5, discriminated early-glaucoma by thresholding the early model with 0.9. The samples rejected by all three models will be classified as early-glaucoma by default. The pseudo code of this process is shown in Algorithm 1.
Besides these ensembling strategies, DIAGNOS-ETS rescaled the input images to different sizes in the inference stage, and combined the multi-scale predictions by averaging them with temperature scaling. Specifically, they combines the multi-scale results through:
| (5) |
where are the multi-scale predictions, is the final prediction, is the number of scales, is a learned scalar parameter. FATRI-AI stacked two models, where the instances with high confidence in the first model (over 0.7) were used as pseudo labels to train the second model.
4 Results
4.1 Challenge Results
The top ten teams ranked by glaucoma grading score are SmartDSP, Voxelcloud, EyeStar, HZL, MedIPBIT, IBME, WZMedTech, DIAGNOS-ETS, MedICAL, and FATRI_AI. The quantitative scores of the glaucoma grading task measured by kappa are shown in Table 3. We reported their performances in the preliminary stage (evaluation on preliminary set) and the final stage (evaluation on final test set). Comparing the ranking in the preliminary stage with that of the final stage, we can see SmartDSP, Voxelcloud, EyeStar, HZL, IBME all keep or raise the rankings on the test dataset, indicating they are more robust than the other methods. The teams ranked lower are generally caused by the worse generalization capability. In particular, for MedIPBIT, IBME, WZMedTech, DIAGNOS-ETS, and MedICAL, we can see a dramatic decrease of the performance on the final test set.
The confusion matrices calculated on the test set are shown in Figure 6. We note that methods achieved similar performance in the prediction of normal/glaucoma. The error of predicting glaucoma as normal is generally in 4% to 8% range. This rate is lower than the reported misdiagnosed rate of junior ophthalmologists ([46]), indicating the clinical application potential of the models.
Different approaches widened the gap in the performance of early/progressive-glaucoma classification. Teams ranked higher generally achieved better performance on both the early-glaucoma accuracy and progressive-glaucoma accuracy. It is also worth noting that the accuracy of early glaucoma and progressive glaucoma has different significance in clinical scenarios. In clinical scenarios, predicting progressive-glaucoma as early-glaucoma is generally more undesirable than the other way around. Thus, among models with similar overall performance, those with higher progressive-glaucoma accuracy will be a better choice in clinical practice.

| Rank | Team | Preliminary | Final |
| 1 | SmartDSP | 93.38 (1) | 85.49 |
| 2 | VoxelCloud | 90.71 (6) | 85.00 |
| 3 | EyeStar | 88.28 (7) | 84.77 |
| 4 | HZL | 89.89 (8) | 84.01 |
| 5 | IBME | 87.60 (9) | 82.56 |
| 6 | MedIPBIT | 93.43 (2) | 80.48 |
| 7 | WZMedTech | 90.44 (5) | 79.46 |
| 8 | DIAGNOS-ETS | 91.70 (3) | 75.36 |
| 9 | MedICAL | 90.65 (4) | 72.90 |
| 10 | FATRI-AI | 87.34 (10) | 69.62 |
To encourage the teams participate in all three tasks of the GAMMA challenge, the official final ranking is calculated with the scores from all three competition tasks:
| (6) |
The published final ranking is shown in Table 4. The ranking of the auxiliary tasks is shown in the Appendix. The detailed leaderboards can also be accessed on the GAMMA challenge website at https://aistudio.baidu.com/aistudio/competition/detail/90/0/leaderboard.
| Rank | Team | Member | Institute | Score | |||||
| 1 | SmartDSP |
|
Xiamen University | 8.88892 | |||||
| 2 | Voxelcloud |
|
|
8.83127 | |||||
| 3 | EyeStar |
|
Institute of High Performance Computing, ASTAR | 8.72345 | |||||
| 4 | IBME | Wensai Wang, Lingxiao Wang |
|
8.70783 | |||||
| 5 | MedIPBIT |
|
Beijing Institute of Technology | 8.70561 | |||||
| 6 | HZL | Shihua Huang, Zhichao Lu |
|
8.68781 | |||||
| 7 | WZMedTech |
|
|
8.65384 | |||||
| 8 | DIAGNOS-ETS |
|
ETS Montreal; DIAGNOS Inc. | 8.59884 | |||||
| 9 | MedICAL | Li Lin, Huaqing He, Zhiyuan Cai |
|
8.43841 | |||||
| 10 | FATRI_AI |
|
Suixin (Shanghai) Technology Co., LTD. | 8.27601 |
4.2 Methodological Findings
In this section, we draw the key methodological findings by doing the ablation study on the techniques proposed in the GAMMA challenge. A brief conclusion is that a 3D Net & DENet dual branch architecture with ordinal ensemble strategy performs best on this task. The focus on the OD/OC region also helps to improve the glaucoma grading. The detailed analysis and discussion are as follow.
4.2.1 Ablation study on architectures in GAMMA
In order to fairly verify the effectiveness of proposed architectures, we did an ablation study utilizing our baseline implementation as reference. We kept everything the same as the baseline and only changed the architectures. The quantitative results are shown in Table 5. We measure the results by the overall kappa and also the accuracy value of each class. N-Acc, E-Acc and P-Acc denotes the accuracy values of normal, early-glaucoma and progressive-glaucoma, respectively. G-Acc denotes the glaucoma accuracy value of both early-glaucoma and progressive-glaucoma classes.
| N-Acc | E-Acc | P-Acc | G-Acc | Kappa | |
| DualRes | 84.31 | 27.20 | 71.66 | 42.04 | 70.26 |
| Res-3D | 82.74 | 24.26 | 73.32 | 52.18 | 73.81 |
| Res-DEN | 94.63 | 24.21 | 76.75 | 48.13 | 76.82 |
| SinCat | 74.31 | 33.60 | 52.50 | 42.86 | 61.31 |
| SinMulti | 89.02 | 20.80 | 67.21 | 51.46 | 75.31 |
| 3D-DEN | 97.88 | 33.12 | 54.56 | 43.14 | 79.55 |
From Table 5, we can see, first, the awareness of optic disc region is helpful for glaucoma grading. Res-DEN and SinMulti utilized the optic disc & cup segmentation mask, and they achieved higher and steadier performance. In particular, Res-DEN achieves a much better overall performance than standard DualRes (increases a 6.42% on mean kappa and decreases a 0.53% on standard deviation), indicating DENet is a better choice than the standard network for the fundus branch. In addition, Res-3D outperforms DualRes by a 3.41% on mean kappa and a 0.46% on kappa standard deviation, indicating 3D neural network works better than the standard network as an OCT branch. We also tried to combine the two advantages, by adopting 3D network on OCT branch and adopting DENet on fundus branch. The results are denoted as 3D-DEN in Table 5. We can see that the combined architecture outperforms both approaches. Specifically, it outperforms Res-3D by a 5.74% on mean kappa, outperforms Res-DEN by a 2.73% on mean kappa, and outperforms basic DualRes by an outstanding 9.15% on mean kappa with the lowest standard deviation among all methods. In conclusion, in terms of the architecture, a 3D neural network OCT branch with a DENet fundus branch is suggested for multi-modal glaucoma grading.
4.2.2 Ablation study on ensemble strategies in GAMMA
We also performed the ablation study on the ensemble strategies proposed by top ten teams. The quantitative results are shown in Table 6. A valuable conclusion that can be drawn from the results is that multi-model ordinal ensembling method, which WZMedTech and SmartDSP adopted, are superior on glaucoma grading task. Specifically, 2-ordinal adopted by WZMedTech outperforms standard five fold average ensemble by a 4.52% mean kappa improvement and 0.09% standard deviation descent, 3-ordinal adopted by SmartDSP outperforms standard five fold average ensemble by a 7.53% mean kappa improvement and 0.23% standard deviation descent. This improvement comes from their divide and conquer strategy, i.e., separating this triple classification task to multiple binary classification tasks, where the models that perform the best on each sub-tasks will be picked for the final ensemble. SmartDSP also classified the sample as early-glaucoma by default when all the models do not have high confidence in their prediction, a strategy often applied by clinical experts in their decision making. In clinical practice, when multiple experts give diverse opinions and are not confident, this case will be considered suspected early glaucoma for further screening. Due to the similarity of strategies, the ordinal ensemble strategy may be of use in the real-world clinical scenario.
| Ensemble | N-Acc | E-Acc | P-Acc | G-Acc | Kappa |
| Stacked | 90.12 | 11.82 | 84.02 | 47.45 | 71.31 |
| Rescale | 91.82 | 24.21 | 54.81 | 40.15 | 73.59 |
| 3-fold-ave | 92.57 | 37.54 | 57.92 | 47.02 | 74.55 |
| 5-fold-ave | 90.25 | 27.72 | 71.04 | 49.56 | 75.33 |
| 2-ordinal | 96.14 | 44.02 | 54.26 | 49.06 | 79.85 |
| 3-ordinal | 98.06 | 52.06 | 66.71 | 59.23 | 82.80 |
4.2.3 Effects of auxiliary tasks
Participants are also encouraged to utilize the optic disc & cup mask and fovea location information to improve glaucoma grading. In the GAMMA Challenge, we saw that the prior knowledge of optic disc & cup mask helped to improve the glaucoma grading performance. EyeStar and MedIPBIT both cropped optic disc regions from the fundus images in data preprocessing. EyeStar also adopted DENet to individually process the optic disc region and polar transformed optic disc region. MedICAL utilized the optic disc & cup mask to enhance the fundus inputs. This is also in line with the previous studies ([50, 54]) and what we found in Section 2.3. In Table 1, we can also see that optic disc region improves the dual-branch model more than the single fundus-branch. This is because OCT volume corresponds to the optic disc region of the fundus image. Cropping the optic disc region helps to align the features of the two branches. However, we also noted that this improvement decreases in the high-performance models. As the multi-modality results shown in Table 1, on the models with no ordinal regression, disc region cropping improves a 6.79% from 70.2% to 77.0%. However, on the models with ordinal regression, disc region cropping only improves a 4.40% from 76.8% to 81.2%. We conjecture that the stronger models can extract the optic disc region on their own and do not need this prior knowledge anymore.
5 Discussion
5.1 Multimodal Fusion strategies in GAMMA
In the GAMMA Challenge, we note that most multimodal fusion methods that gained high performance in GAMMA are very straightforward. Many advanced multimodal fusion techniques proposed recently were not adopted for this task. The main reason is that the fusion of fundus image and OCT volume is very different from the other more common multimodal fusion tasks. Advanced multimodal fusion algorithms can be divided into two categories: pixel-level and feature-level. Pixel-level fusion operates directly on the raw pixels of the images, making it a simple and widely used technique in medical image classification. However, it can only be applied to data with the same dimensions, such as brain magnetic resonance imaging (MRI) and computed tomography (CT) scans ([40, 42]), Positron Emission Tomography (PET) and MRT scans ([2, 41, 23]), or the chest PET and CT scans ([27]). This makes it inapplicable to our 2D-3D image fusion. Feature-level fusion, on the other hand, operates on features extracted from the images. Unlike the GAMMA methods, which typically perform fusion at the final embedding stage, these techniques often fuse multi-scale features with spatial attention, similarity matching ([29]) or domain adaptation ([15, 3, 8]) in applications such as lung-based Fluoro-D-Glucose PET (FDG PET) and MRI fusion ([7]) or Ultrasound and Single-Photon emission CT (SPECT) fusion ([44]). However, they are also difficult to apply to our case, as the two modalities (OCT and fundus) have a significant scale difference and lack strong spatial correspondence. OCT images typically focus on a small region near the fovea, while fundus images cover a large area of the fundus. To our knowledge, few multimodal fusion techniques can be directly adopted for the fundus-OCT fusion task, and explains why the straightforward dual-branch concatenation model was the main choice in the GAMMA Challenge. This indicates that more specific multimodal fusion algorithms are required in this field.
5.2 Challenge strengths and limitations
GAMMA was the first open initiative aiming to evaluate the possibility to develop automated methods for glaucoma grading from a combination of fundus images and OCT volume, mimicking the clinical operations of the ophthalmologists to some extent. Toward that end, the challenge provided to the community with the largest public available dataset of fundus photographs and OCT volume pairs to date. The unique characteristic of GAMMA provides a platform to establish more reliable and clinical-alike automated glaucoma classification methods, inspired by the clinical observation that the complementary fundus image and OCT can significantly improve the diagnostic accuracy of ophthalmologists ([1]). In addition, GAMMA provided the glaucoma diagnostic labels according to the clinical diagnostic standard (normal/early-stage/progressive) with a high quality reference OD/OC masks and fovea positions. These additional information is helpful to calibrate the glaucoma grading methods, as it was observed that training with fundus-derived labels have a negative impact on performance to detect truly diseased cases ([34]). To our knowledge, GAMMA is also the only available dataset to establish valid deep neural networks for now. The only other dataset similar to GAMMA ([35]) contains only 50 pairs of fundus-OCT scans, which is commonly not enough to train and evaluate the deep learning methods.
In the GAMMA challenge, the evaluation framework we designed matched the principles for evaluating retinal image analysis algorithms proposed by [47]. Specifically, the GAMMA dataset can be easily accessed through the website associated with the Grand Challenge. Moreover, an open and uniform evaluation interface is provided on the website to automatically evaluate any results submitted. The evaluation process is exactly the same as the GAMMA Challenge. Such an online evaluation provides the further participants a platform to test their algorithms and allows them to fairly compare with the algorithms on the GAMMA leaderboard. In this way, the effectiveness of the proposed techniques can be conveniently and fairly verified, which encourages the development of the further novel algorithms.
To prevent the submitted method to be overfitting, only the training dataset is released to the registered teams in the challenge. Moreover, each team was allowed to request a maximum five times evaluation on the preliminary data set per day to adjust their algorithms. In the final stage of the challenge, the submitted methods will only be evaluated once by the test dataset as the final results. Our conclusion and analysis can therefore remain unbiased by this issue. Since the online evaluation on the preliminary dataset is limited, most teams split the released training dataset to several parts offline for the private training and evaluation. The future challenges might perhaps consider to split the dataset to four parts, for the purpose of training, validation, online evaluation and final test, respectively. Among them, the training set and the validation set are the released labeled data sets, participants can use these sets to train the models directly, or they can mix them and design their own training and validation sets or cross-validation sets. These released labeled samples will not appear in the online evaluation and final test sets.
Regarding the technical methodology, we aim to find out the most effective solution for multi-modality glaucoma grading task in GAMMA. For that purpose, different from many other challenges, we did not allow the participants to use the extra data to train their models. In addition, the source code of the wining teams is required to be submitted with their final results. These ensure the methods proposed can be fairly compared, so that the effective techniques can be identified in the challenge. We also note that many factors are tangled together to effect the final results. This often bother the readers who want to quickly find out the most effective modules on this task, like which is the most effective architecture on this task or which is the most effective ensemble strategy on this task. Thus we also do the ablation study on the wining teams to identify the effectiveness of each proposed module. Since the source code of the wining teams is submitted, we are able to correctly reproduce their methods and do the comparison. Such an ablation study provides the future researchers/developers a cookbook to design their own models.
One limitation of GAMMA is the size of the dataset. Although GAMMA is the largest fundus-OCT paired data set to date, it is still not big enough for developing capable enough deep learning models. Fundus images based glaucoma classification often provided larger datasets, for instance, our previous REFUGE ([33]) and REFUGE2 ([9]) challenges released 1600 annotated fundus images in total. Moreover, it is worth mentioning that the diverse ethnicities are lack in the GAMMA dataset, as the images correspond to a Chinese population. Although OCT may not vary too much, the fundus images of different ethnicities will be different due to changes in the pigment of the fundus. Therefore, the algorithms in the GAMMA challenge might need to be retrained before applying to a different population. These limitations should be addressed in future challenges by a large-scale multi-ethnicities collection of data, to ensure the generalization of the models. We think the main reason of the absence of explainability is we did not take explainability as a metric to rank the teams in the challenge.
In addition, we note that all the methods in the GAMMA challenge are based on black-box neural networks, and few of them are interpretable. Explainability is an important factor for the clinical adoption of CAD methods, but it is often less-explored in this field. One team, HZL, did make an effort to incorporate explainability into their model by using a multi-task learning approach that jointly learned glaucoma grading and optic disc and cup segmentation. In this way, the segmentation results could be used as evidence of the neural network’s attention to the relevant parts of the image. Moreover, it is also ineffective to apply explainability methods from the deep learning community to our cases. In deep learning, explainability often refers to the ability to highlight the regions of interest in an image, such as a mustache on a face to recognize gender, or in our case, the optic disc and cup region on a fundus image to diagnose glaucoma. Many explainability techniques have been proposed for this purpose, such as the popular classification activation map (CAM) based methods. However, this type of explainability is not sufficient for medical image classification. In our case, it is not just the region but the ratio of the optic disc to the cup that is discriminative for diagnosing glaucoma. This is a problem that still needs to be studied by both machine learning and clinical research communities. In the future, we are considering adding explainability as one of the metrics in our challenges to encourage the development of these technologies for clinical applications. We have also acknowledged the limitations of the current methods and discussed the need for further research in this area in our paper.
5.3 Clinical implications of the results and future work
The GAMMA challenge is organized aiming to answer an open question: Should we develop automated glaucoma diagnosis based on a combination of fundus photography and OCT, like what we do clinically? Up to now, the GAMMA challenge seems to give us a preliminary but positive answer: fudus-OCT combined glaucoma grading obviously outperforms which using only fundus or OCT data. Comparing Table 1 and Table 4, we can see a simple fusion of 2D fundus and 3D OCT gains about 10% improvement against the single-modality. Another 10% improvement can gain from the advanced design of the model. To compare with the human experts, the sensitivities (considering the classification of normal and early/progressive glaucoma) of top-3 teams (0.959, 0.918 and 0.959) have been considerably higher than reported sensitivities of junior ophthalmologists (0.694 to 0.862) ([1]).
To move a step further, could these models be applied in the real clinical scenario to automatically screen the glaucoma suspect? It is still an open question. But first, an automated, objective diagnosis system is able to to mitigate the human individual bias and to save human experts substantial time. In addition, as the non-invasive, cost-efficient and early-stage glaucoma sensitive glaucoma screening tools, fundus photographs and OCT are widely used by the clinical experts for the primary screening of glaucoma suspect ([6]). In this case, fundus and OCT combined automated glaucoma detection seems to be an appropriate solution for the large-scale community screening. These models can achieve high sensitivities (above 0.9 for the top three teams) and better overall performance than single-modality models. Although these results are limited to a specific image population, we can still envision this technique to be widely used in clinic in the future.
The functional parameters like vision field test and IOP will be considered to be contained for the automated glaucoma detection in the future. Although the tools for ONH examination, like fundus images and OCT are cost-efficient and complementary to detect early-stage glaucoma, the clinical gold standard for glaucoma is vision field, which indicates the functional impairment scale. Besides, IOP is also a valid biomarker indicating the risk of damage to the optic nerve, causing glaucoma and permanent vision loss. In the future work, we will explore the possibility of further combining IOP measurement data and visual field test data to create an automated glaucoma detection model in full accordance with the clinical glaucoma diagnosis criteria. Such models may have the chance to be deployed in both large-scale community screening scenario and in-hospital diagnosis scenario.
6 Conclusion
Following the clinical glaucoma screening standard, we held a challenge for automated glaucoma grading from both fundus images and OCT volumes, called Glaucoma grAding from Multi-Modality imAges (GAMMA) Challenge. In this paper, we introduced the released GAMMA dataset, the process of the challenge, the evaluation framework and the top-ranked algorithms in the challenge. Detailed comparisons and analyses are also conducted on the proposed methodologies. As the first in-depth study of fundus-OCT multi-modality glaucoma grading task, we believe GAMMA will be an essential starting point for further research on this important and clinically-relevant task.
The data and evaluation framework are publicly accessible through https://gamma.grand-challenge.org/. The code and technical reports of top-10 teams are released at https://gamma.grand-challenge.org/technical-materials/. Future participants are welcome to use our dataset and submit their results on the website to benchmark their methods.
Acknowledgments
This research was supported by the High-level Hospital Construction Project, Zhongshan Ophthalmic Center, Sun Yat-sen University (303020104). H. Fu was supported by AME Programmatic Fund (A20H4b0141).
References
- Anton et al. [2021] Anton, A., Nolivos, K., Pazos, M., Fatti, G., Ayala, M.E., Martínez-Prats, E., Peral, O., Poposki, V., Tsiroukis, E., Morilla-Grasa, A., et al., 2021. Diagnostic accuracy and detection rate of glaucoma screening with optic disk photos, optical coherence tomography images, and telemedicine. Journal of Clinical Medicine 11, 216.
- Bhavana and Krishnappa [2015] Bhavana, V., Krishnappa, H., 2015. Multi-modality medical image fusion using discrete wavelet transform. Procedia Computer Science 70, 625–631.
- Bian et al. [2021] Bian, C., Yuan, C., Ma, K., Yu, S., Wei, D., Zheng, Y., 2021. Domain adaptation meets zero-shot learning: An annotation-efficient approach to multi-modality medical image segmentation. IEEE Transactions on Medical Imaging , 1–1doi:10.1109/TMI.2021.3131245.
- Cai et al. [2022] Cai, Z., Lin, L., He, H., Tang, X., 2022. Corolla: An efficient multi-modality fusion framework with supervised contrastive learning for glaucoma grading, in: 2022 IEEE 19th International Symposium on Biomedical Imaging (ISBI), IEEE. pp. 1–4.
- Chen et al. [2020] Chen, Y., Zhang, P., Li, Z., Li, Y., Zhang, X., Qi, L., Sun, J., Jia, J., 2020. Dynamic scale training for object detection. arXiv preprint arXiv:2004.12432 .
- Chen et al. [2019] Chen, Z., Zheng, X., Shen, H., Zeng, Z., Liu, Q., Li, Z., 2019. Combination of enhanced depth imaging optical coherence tomography and fundus images for glaucoma screening. Journal of Medical Systems 43, 1–12.
- Das and Kundu [2013] Das, S., Kundu, M.K., 2013. A neuro-fuzzy approach for medical image fusion. IEEE transactions on biomedical engineering 60, 3347–3353.
- Dou et al. [2018] Dou, Q., Ouyang, C., Chen, C., Chen, H., Heng, P.A., 2018. Unsupervised cross-modality domain adaptation of convnets for biomedical image segmentations with adversarial loss, in: Proceedings of the 27th International Joint Conference on Artificial Intelligence, AAAI Press. p. 691–697.
- Fang et al. [2022] Fang, H., Li, F., Fu, H., Sun, X., Cao, X., Son, J., Yu, S., Zhang, M., Yuan, C., Bian, C., et al., 2022. Refuge2 challenge: Treasure for multi-domain learning in glaucoma assessment. arXiv preprint arXiv:2202.08994 .
- Fang et al. [2021] Fang, H., Shang, F., Fu, H., Li, F., Zhang, X., Xu, Y., 2021. Multi-modality images analysis: A baseline for glaucoma grading via deep learning, in: International Workshop on Ophthalmic Medical Image Analysis, Springer. pp. 139–147.
- Fu et al. [2018a] Fu, H., Cheng, J., Xu, Y., Wong, D.W.K., Liu, J., Cao, X., 2018a. Joint optic disc and cup segmentation based on multi-label deep network and polar transformation. IEEE transactions on medical imaging 37, 1597–1605.
- Fu et al. [2018b] Fu, H., Cheng, J., et al., 2018b. Disc-Aware Ensemble Network for Glaucoma Screening From Fundus Image. IEEE Transactions on Medical Imaging 37, 2493–2501.
- Fu et al. [2017] Fu, H., Xu, Y., Lin, S., Zhang, X., Wong, D.W.K., Liu, J., Frangi, A.F., Baskaran, M., Aung, T., 2017. Segmentation and quantification for angle-closure glaucoma assessment in anterior segment oct. IEEE transactions on medical imaging 36, 1930–1938.
- Ge et al. [2022] Ge, X., Pereira, F.C., Mitteregger, M., Berry, D., Zhang, M., Hausmann, B., Zhang, J., Schintlmeister, A., Wagner, M., Cheng, J.X., 2022. Srs-fish: A high-throughput platform linking microbiome metabolism to identity at the single-cell level. Proceedings of the National Academy of Sciences 119, e2203519119.
- Han et al. [2022] Han, X., Qi, L., Yu, Q., Zhou, Z., Zheng, Y., Shi, Y., Gao, Y., 2022. Deep symmetric adaptation network for cross-modality medical image segmentation. IEEE Transactions on Medical Imaging 41, 121–132. doi:10.1109/TMI.2021.3105046.
- Hancox OD [1999] Hancox OD, M.D., 1999. Optic disc size, an important consideration in the glaucoma evaluation. Clinical Eye and Vision Care 11, 59–62.
- He et al. [2022] He, H., Lin, L., Cai, Z., Tang, X., 2022. Joined: Prior guided multi-task learning for joint optic disc/cup segmentation and fovea detection. arXiv preprint arXiv:2203.00461 .
- He et al. [2016] He, K., Zhang, X., Ren, S., Sun, J., 2016. Deep residual learning for image recognition, in: Proceedings of the IEEE conference on computer vision and pattern recognition, pp. 770–778.
- Huang et al. [2021] Huang, S., Lu, Z., Cheng, R., He, C., 2021. Fapn: Feature-aligned pyramid network for dense image prediction, in: Proceedings of the IEEE/CVF International Conference on Computer Vision, pp. 864–873.
- Jonas et al. [2000] Jonas, J.B., Bergua, A., Schmitz-Valckenberg, P., Papastathopoulos, K.I., Budde, W.M., 2000. Ranking of optic disc variables for detection of glaucomatous optic nerve damage. Investigative Ophthalmology & Visual Science 41, 1764–1773.
- Jonas et al. [1999] Jonas, J.B., Budde, W.M., Panda-Jonas, S., 1999. Ophthalmoscopic evaluation of the optic nerve head. Survey of ophthalmology 43, 293–320.
- Kingma and Ba [2014] Kingma, D.P., Ba, J., 2014. Adam: A method for stochastic optimization. arXiv preprint arXiv:1412.6980 .
- Lai et al. [2017] Lai, S., Wang, J., He, C., Borjer, T.H., 2017. Medical image fusion combined with accelerated non-negative matrix factorization and expanded laplacian energy in shearlet domain. Journal of Engineering Science & Technology Review 10.
- Li et al. [2020] Li, F., Song, D., Chen, H., Xiong, J., Li, X., Zhong, H., Tang, G., Fan, S., Lam, D.S., Pan, W., et al., 2020. Development and clinical deployment of a smartphone-based visual field deep learning system for glaucoma detection. NPJ digital medicine 3, 1–8.
- Li et al. [2022] Li, L., Li, H., Kou, G., Yang, D., Hu, W., Peng, J., Li, S., 2022. Dynamic camouflage characteristics of a thermal infrared film inspired by honeycomb structure. Journal of Bionic Engineering 19, 458–470.
- Li et al. [2021] Li, S., Sui, X., Luo, X., Xu, X., Liu, Y., Goh, R.S.M., 2021. Medical image segmentation using squeeze-and-expansion transformers. arXiv preprint arXiv:2105.09511 .
- Liu et al. [2010] Liu, Y., Yang, J., Sun, J., 2010. Pet/ct medical image fusion algorithm based on multiwavelet transform, in: 2010 2nd International Conference on Advanced Computer Control, IEEE. pp. 264–268.
- Liu et al. [2021] Liu, Z., Lin, Y., Cao, Y., Hu, H., Wei, Y., Zhang, Z., Lin, S., Guo, B., 2021. Swin transformer: Hierarchical vision transformer using shifted windows, in: Proceedings of the IEEE/CVF International Conference on Computer Vision, pp. 10012–10022.
- Meher et al. [2019] Meher, B., Agrawal, S., Panda, R., Abraham, A., 2019. A survey on region based image fusion methods. Information Fusion 48, 119–132.
- Morgan et al. [2005] Morgan, J.E., Sheen, N.J.L., North, R.V., Choong, Y., Ansari, E., 2005. Digital imaging of the optic nerve head: monoscopic and stereoscopic analysis. British journal of ophthalmology 89, 879–884.
- Nayak et al. [2009] Nayak, J., Acharya, R., Bhat, P.S., Shetty, N., Lim, T.C., 2009. Automated diagnosis of glaucoma using digital fundus images. Journal of medical systems 33, 337–346.
- Niu et al. [2016] Niu, Z., Zhou, M., Wang, L., Gao, X., Hua, G., 2016. Ordinal regression with multiple output cnn for age estimation, in: Proceedings of the IEEE conference on computer vision and pattern recognition, pp. 4920–4928.
- Orlando et al. [2020] Orlando, J.I., Fu, H., Breda, J.B., van Keer, K., Bathula, D.R., Diaz-Pinto, A., Fang, R., Heng, P.A., Kim, J., Lee, J., et al., 2020. Refuge challenge: A unified framework for evaluating automated methods for glaucoma assessment from fundus photographs. Medical image analysis 59, 101570.
- Phene et al. [2019] Phene, S., Carter Dunn, R., Hammel, N., Liu, Y., Krause, J., Kitade, N., et al., 2019. Deep learning to assess glaucoma risk and associated features in fundus images. arXiv preprint arXiv:1812.08911 .
- Raja et al. [2020] Raja, H., Akram, M.U., Khawaja, S.G., Arslan, M., Ramzan, A., Nazir, N., 2020. Data on oct and fundus images for the detection of glaucoma. Data in brief 29, 105342.
- Redmon et al. [2016] Redmon, J., Divvala, S., Girshick, R., Farhadi, A., 2016. You only look once: Unified, real-time object detection, in: Proceedings of the IEEE conference on computer vision and pattern recognition, pp. 779–788.
- Resnikoff et al. [2004] Resnikoff, S., Pascolini, D., Etya’Ale, D., Kocur, I., Pararajasegaram, R., Pokharel, G.P., Mariotti, S.P., 2004. Global data on visual impairment in the year 2002. Bulletin of the world health organization 82, 844–851.
- Ronneberger et al. [2015] Ronneberger, O., Fischer, P., Brox, T., 2015. U-net: Convolutional networks for biomedical image segmentation, in: International Conference on Medical image computing and computer-assisted intervention, Springer. pp. 234–241.
- Rosenthal et al. [2016] Rosenthal, P., Ritter, M., Kowerko, D., Heine, C., 2016. Ophthalvis-making data analytics of optical coherence tomography reproducible., in: EuroRV3@ EuroVis, pp. 9–13.
- Sahu et al. [2014] Sahu, A., Bhateja, V., Krishn, A., et al., 2014. Medical image fusion with laplacian pyramids, in: 2014 International conference on medical imaging, m-health and emerging communication systems (MedCom), IEEE. pp. 448–453.
- Shabanzade and Ghassemian [2017] Shabanzade, F., Ghassemian, H., 2017. Combination of wavelet and contourlet transforms for pet and mri image fusion, in: 2017 artificial intelligence and signal processing conference (AISP), IEEE. pp. 178–183.
- Singh and Anand [2018] Singh, S., Anand, R.S., 2018. Ripplet domain fusion approach for ct and mr medical image information. Biomedical Signal Processing and Control 46, 281–292.
- Tan and Le [2019] Tan, M., Le, Q., 2019. Efficientnet: Rethinking model scaling for convolutional neural networks, in: International conference on machine learning, PMLR. pp. 6105–6114.
- Tang et al. [2016] Tang, L., Li, L., Qian, J., Zhang, J., Pan, J.S., 2016. Nsct-based multimodal medical image fusion with sparse representation and pulse coupled neural network. J. Inf. Hiding Multim. Signal Process. 7, 1306–1316.
- Tran et al. [2015] Tran, D., Bourdev, L., Fergus, R., Torresani, L., Paluri, M., 2015. Learning spatiotemporal features with 3d convolutional networks, in: Proceedings of the IEEE international conference on computer vision, pp. 4489–4497.
- Trobe et al. [1980] Trobe, J.D., Glaser, J.S., Cassady, J.C., 1980. Optic atrophy: differential diagnosis by fundus observation alone. Archives of Ophthalmology 98, 1040–1045.
- Trucco et al. [2013] Trucco, E., Ruggeri, A., Karnowski, T., Giancardo, L., Chaum, E., Hubschman, J.P., Al-Diri, B., Cheung, C.Y., Wong, D., Abramoff, M., et al., 2013. Validating retinal fundus image analysis algorithms: issues and a proposal. Investigative ophthalmology & visual science 54, 3546–3559.
- Vaswani et al. [2017] Vaswani, A., Shazeer, N., Parmar, N., Uszkoreit, J., Jones, L., Gomez, A.N., Kaiser, Ł., Polosukhin, I., 2017. Attention is all you need, in: Advances in neural information processing systems, pp. 5998–6008.
- Vos et al. [2016] Vos, T., Allen, C., Arora, M., Barber, R.M., Bhutta, Z.A., Brown, A., Carter, A., Casey, D.C., Charlson, F.J., Chen, A.Z., et al., 2016. Global, regional, and national incidence, prevalence, and years lived with disability for 310 diseases and injuries, 1990–2015: a systematic analysis for the global burden of disease study 2015. The lancet 388, 1545–1602.
- Wu et al. [2020] Wu, J., Yu, S., Chen, W., Ma, K., Fu, R., Liu, H., Di, X., Zheng, Y., 2020. Leveraging undiagnosed data for glaucoma classification with teacher-student learning, in: International Conference on Medical Image Computing and Computer-Assisted Intervention, Springer. pp. 731–740.
- Xie et al. [2020] Xie, R., Liu, J., Cao, R., Qiu, C.S., Duan, J., Garibaldi, J., Qiu, G., 2020. End-to-end fovea localisation in colour fundus images with a hierarchical deep regression network. IEEE Transactions on Medical Imaging 40, 116–128.
- Xiong et al. [2021] Xiong, J., Li, F., Song, D., Tang, G., He, J., Gao, K., Zhang, H., Cheng, W., Song, Y., Lin, F., et al., 2021. Multimodal machine learning using visual fields and peripapillary circular oct scans in detection of glaucomatous optic neuropathy. Ophthalmology .
- Zhang et al. [2020] Zhang, J., Zhao, J., Lin, H., Tan, Y., Cheng, J.X., 2020. High-speed chemical imaging by dense-net learning of femtosecond stimulated raman scattering. The journal of physical chemistry letters 11, 8573–8578.
- Zhao et al. [2019] Zhao, R., Liao, W., Zou, B., Chen, Z., Li, S., 2019. Weakly-supervised simultaneous evidence identification and segmentation for automated glaucoma diagnosis, in: Proceedings of the AAAI Conference on Artificial Intelligence, pp. 809–816.
Appendix
In the following sections, we briefly introduce the methods proposed for the auxiliary tasks.
Fovea Localization
The ranking of fovea localization task is shown in Table 7. The results are evaluated by the fovea localization score (see Section 2.2) and Euclidean distance (ED). Teams are ranked by the fovea localization score. The methods of the teams are summarized in Table 9. Analogously to the glaucoma grading task, we also implemented a baseline for fovea localization task, which is shown in Figure 7. The input of the network is the whole fundus image, and the output is a 2D vector indicating the coordinate of the fovea center. The backbone of the network is ResNet50 and is supervised by the combination of Euclidean distance and MSE loss.
| Rank | Team | Score | ED |
| 1 | DIAGNOS-ETS | 9.60294 | 0.00413 |
| 2 | IBME | 9.58847 | 0.00429 |
| 3 | SmartDSP | 9.57458 | 0.00444 |
| 4 | MedIPBIT | 9.53757 | 0.00485 |
| 5 | Voxelcloud | 9.53443 | 0.00488 |
| 6 | EyeStar | 9.51465 | 0.0051 |
| 7 | WZMedTech | 9.45846 | 0.00573 |
| 8 | MedICAL | 9.34639 | 0.00699 |
| 9 | FATRI_AI | 9.33749 | 0.0071 |
| 10 | HZL | 9.22303 | 0.00842 |
On fovea localization task, the methods of the teams varies a lot. In the top-10 teams, SmartDSP, MedIPBIT, WZMedTech processed the task as a coordinate regression task, just like we did in the baseline method. VoxelCloud and DIAGNOS-ETS processed the task as a binary segmentation task. They generated a circle centered on the fovea location. The circle is then taken as the segmentation target for the binary segmentation task. The center of the segmented result is finally taken as the fovea location. Eyestar, IBME and MedICAL processed the task as a heatmap prediction task. They generated the ground-truth heatmap by Gaussian kernel. This strategy is similar to the binary segmentation, except it is supervised by a soft target, which is a normal distribution centered on fovea location. In contrast, FATRI-AI processed the task as a detection task. They generated a 160×160 square centered on the fovea location and used a YOLO (Redmon et al. [2016]) network to detect the region.
Almost half of the teams utilized a coarse-to-fine multi-stage strategy, including SmartDSP, EyeStar, MedIPBIT, WZMedTech and MedICAL. Most of them cropped Region Of Interest (ROI) based on the coarse stage predictions. The cropped region is then refined by the later stage. EyeStar proposed a more sophisticated architecture based on this strategy and named it Two-Stage Self-Adaptive localization Architecture (TSSAA). They first cropped multi-scale ROI based on the coarse predictions. Then they fused both multi-scale ROI and coarse-level features using sequential ROI Align layer, concatenation, self-attention modules (Vaswani et al. [2017]) and Fuse layer. An illustration of TSSAA is shown in Figure 7.
OD/OC Segmentation
The ranking of OD/OC segmentation task is shown in Table 8. The results are evaluated by the two Dice values, vertical optic Cup-to-Disc Ratio (vCDR) and the OD/OC segmentation score (see Section 2.2) in the GAMMA Challenge. Teams are ranked by the OD/OC segmentation score. The methods of the teams are summarized in Table 8. A standard UNet is also adopted as the baseline of the task.
| Rank | Team | Score | Dice-disc(%) | Dice-cup(%) | vCDR |
| 1 | Voxelcloud | 8.36384 | 96.25 | 87.84 | 0.04292 |
| 2 | DIAGNOS-ETS | 8.3275 | 95.96 | 87.74 | 0.04411 |
| 3 | WZMedTech | 8.31621 | 96.11 | 88.04 | 0.04538 |
| 4 | HZL | 8.30093 | 95.83 | 88.00 | 0.04562 |
| 5 | SmartDSP | 8.28488 | 95.79 | 88.01 | 0.04642 |
| 6 | MedICAL | 8.27264 | 95.75 | 87.57 | 0.0464 |
| 7 | IBME | 8.2309 | 95.79 | 87.66 | 0.04887 |
| 8 | FATRI_AI | 8.18773 | 95.40 | 86.69 | 0.04917 |
| 9 | MedIPBIT | 8.15502 | 95.49 | 87.67 | 0.05258 |
| 10 | EyeStar | 8.07253 | 94.77 | 85.83 | 0.05326 |
Like the fovea localization task, all the teams except HZL adopted a coarse-to-fine multi-stage strategy. Generally speaking, OD ROI will be first obtained through the coarse OD segmentation stage. The cropped OD patches will be sent to a subsequent Fine-grained OD/OC segmentation network to obtain the final result. Different from the others, VoxelCloud utilized the blood vessel information to improve the OC/OD segmentation. They first used a pre-trained model to obtain the fundus images’ blood vessel segmentation masks. The vessel masks are then concatenated with fundus images as the input. An illustration of their method is shown in Figure 8.


| Team | Architecture | Preprocessing | Ensemble | Method |
| SmartDSP He et al. [2022] | Efficientnet-b4 | (i) Center crop to 2000×2000, padding when height or width less than 2000 (ii) Resize to 224×224 (iii) Default Data Augmentation | 2-fold esmble by averaging | Two stages coordinate regression: (i) Coarse localization, crop to 512×512, (ii) Fine-grained localization. |
| VoxelCloud | TransUNet-like architecture | (i) Remove black background (ii) Pad and resize to 512×512 (iii) Default Data Augmentation + Blur + JPEG compression + GaussNoise + Coarse Dropout | Ensemble the predictions of 30 models train with different hyper-parameters | Binary segmentation the fovea centered circle. Using the sum of binary cross-entropy loss, SoftDice loss, SSIM loss, IOU loss and L1 loss to supervise |
| EyeStar | Poposed Two-Stage Self-Adaptive localization Architecture (TSSAA) | (i) Resize to 998×998 (ii) Crop to 896×896 (iii) Resize to 224×224 (iiii) Default data augmentation | Two stages heatmap prediction: (i) Coarse heatmap prediction, crop to multi-scale ROI, (ii) Fine-grained localization fusing multi-scale ROI and coarse-level features | |
| HZL | UNet with EfficientNet Backbone | Fundus: Resize to 1024×1024 OCT: Resize to 1024×1024 Default Data Augmentation | Pick 5 best models on 5 different validation folds. Ensemble the results by taking the average. | A multi-task UNet to jointly learn glaucoma grading, OD/OC segmentation and fovea localization. Recurrently run the model for coarse-to-fine localization |
| MedIPBIT | ResNet50 for coarse localization ResNet101 for Fine-grained localization | Resize to 512×512 | Three stages coordinate regression: (i) Coarse localization, crop to ROI (ii) Sequential two-stage Fine-grained localization. | |
| IBME | UNet with EfficientNetB5 backbone | (i) Padding to 2000×2992 (ii) Default Data Augmentation | End-to-end heatmap prediction with maximization likelihood for the localization | |
| WZMedTech | HDRNet (Xie et al. [2020]) for the first and second stage ResNet50 for the third stage | (i) Center crop to 1920×1920 (ii) Resize to 224×224 (iii) Default Data Augmentation | Three stages coordinate regression, predicted ROI of last stage is cropped as the input of the next stage | |
| DIAGNOS-ETS | Double stacked W-Net | (i) Resize to 512×512 (ii) Default data augmentation + Color Normalization | 4-fold temperature ensemble | End-to-end binary segmentation the fovea centered circle |
| MedICAL | ResNet50 for coordinate regression branch EfficientNet-B0 for heatmap predication branch | (i) Pick G channel of RGB image (ii) Histogram equalization (iii) Default data augmentation | Ensemble the results of heatmap branch and coordinate regression branch. If Euclidean distance of them larger than 30, take the regression result. If else, take the average of two results | Two stages: (i) Coarse OD/Macular segmentation, crop ROI to 128×128 and 256×256 (ii) Feed 128×128 patches and 256×256 patches to a heatmap predication network and coordinate regression network respectively, fuse the results of two branches for the final predication |
| FATRI-AI | YOLOv5s (Redmon et al. [2016]) | (i) Crop black background (ii) Default data augmentation + Mosaic (Chen et al. [2020]) + Cutout | End-to-end macular region detection, macular region is generated by a 160×160 square centered on fovea location |
| Team | Architecture | Preprocessing | Ensemble | Method |
| SmartDSP (He et al. [2022]) | DeepLabv3 with ResNet34 encoder for coarse segmentation DeepLabv3 with EfficientNet-b2 encoder for Fine-grained segmentation | (i) Crop to 512×512 centered on the highest brightness point (ii) Default Data Augmentation | 2-fold ensemble by averaging | Two stages: (i) Coarse OD segmentation, cropping (ii) Fine-grained OD/OC segmentation |
| VoxelCloud | TransUNet-like architecture for coarse segmentation CENet, TransUNet and Segtran for Fine-grained segmentation | (i) Resize to 512×512 (ii) Default data augmentation | 5-fold ensemble by averaging for coarse segmentation Ensemble the predictions of five folds, three networks and two kinds of input by averaging for Fine-grained segmentation | Two stages: (i) Coarse OD segmentation taking blood vessel mask concatenated fundus image as input, cropping (ii) Fine-grained OD/OC segmentation taking cropped patches and polar transformed patches as inputs. Model supervised by BCE loss + Dice loss |
| EyeStar | Segtran (Li et al. [2021]) with EfficientNet-B4 backbone | (i) Crop to 576×576 disc region by MNet DeepCDR (Fu et al. [2018a]) (ii) Resize to 288×288 (iii) Default data augmentation | Two stages: (i) Coarse OD segmentation using CNN, cropping (ii) Fine-grained OD/OC segmentation using Segtran | |
| HZL | UNet with EfficientNet Backbone | Fundus: Resize to 1024×1024 OCT: Resize to 1024×1024 Default Data Augmentation | Pick 5 best models on 5 different validation folds. Ensemble the results by taking the average. | A multi-task UNet to jointly learn glaucoma grading, OD/OC segmentation and fovea localization. FAM (Huang et al. [2021]) is adopted for the better segmentation |
| MedIPBIT | CNN-Transformer Mixed UNet CNN backbone implemented by ResNet34 | Resize to 512×512 | Two stages: (i) Coarse OD segmentation, cropping (ii) Fine-grained OC segmentation | |
| IBME | UNet with EfficientNetB3 backbone for OC center localization UNet with EfficientNetB6 backbone for Fine-grained segmentation | Default data augmentation | Two stages: (i) OC center localization, crop ROI to 512×512 (ii) Fine-grained OD/OC segmentation | |
| WZMedTech | DeepLabV3 for coarse segmentation TransUNet for Fine-grained segmentation | (i) Center crop to 1920×1920 (ii) Default data augmentation | In the Fine-grained stage, ensemble the models supervised by cross-entropy loss + boundary loss + dice loss and that supervided by focal loss + dice loss by taking the average | Two stages: (i) Coarse OD segmentation, crop ROI to 512×512 (ii) Fine-grained OD/OC segmentation |
| DIAGNOS-ETS | Double stacked W-Net | (i) Resize to 512×512 (ii) Default data augmentation + Color normalization | In coarse OD segmentation: 4-fold ensemble by taking average In Fine-grained OD/OC segmentation: 4-fold temperature ensemble | Two stages: (i) Coarse OD segmentation, crop ROI to 512×512 (ii) Fine-grained OD/OC segmentation |
| MedICAL | UNet with EfficientNet-B4 backbone | (i) Resize to 512×512 (ii) Default data augmentation | Three stages: (i) Coarse OD/Macular segmentation, crop OD ROI to 448×448 (ii) Fine-grained OD/OC segmentation, crop OC ROI TO 256×256 (iii) Fine-grained OC segmentation | |
| FATRI-AI | YOLOv5s for coarse segmentation HRNet for Fine-grained segmentation | (i) Resize to 608×608 (ii) Default data augmentation + Mosaic (Chen et al. [2020]) + Cutout | Two stages: (i) Coarse OD segmentation, crop ROI to 512×512 (ii) Fine-grained OD/OC segmentation. Final results will be smoothed as ellipses |