Frequency-comb response of a parametrically-driven Duffing oscillator to a small added ac excitation
Abstract
Here we present a one-degree-of-freedom model of a nonlinear parametrically-driven resonator in the presence of a small added ac signal that has spectral responses similar to a frequency comb. The proposed nonlinear resonator has a spread spectrum response with a series of narrow peaks that are equally spaced in frequency. The system displays this behavior most strongly after a symmetry-breaking bifurcation at the onset of parametric instability. We further show that the added ac signal can suppress the transition to parametric instability in the nonlinear oscillator. We also show that the averaging method is able to capture the essential dynamics involved.
I Introduction
The study of the effect of small signals on non-autonomous nonlinear dynamical systems near bifurcation points was pioneered by K. Wiesenfeld and B. McNamara in the mid 80’s Wiesenfeld and McNamara (1985, 1986). They showed that several different dynamical systems are very sensitive to coherent perturbations near the onset of codimention-one bifurcations, such as period doubling, saddle node, transcritical, Hopf, and pitchfork (symmetry-breaking) bifurcations. They developed a general linear response theory, based on perturbation and Floquet theories, explaining the effects of small coherent signals perturbing limit cycles of nonlinear systems near the onset of bifurcation points. One of the systems to which they applied their theory was the ac-driven Duffing oscillator. It was found by them that nonlinear dynamical systems could be used as narrow-band phase sensitive amplifiers.
Parametric amplification has been studied in electronic systems since at least from late 50’s and early 60’s by P. K. Tien Tien (1958), R. Landauer Landauer (1960), and Louisell Louisell (1960). It has been used for its desirable characteristics of high gain and low noise Batista and R. S. N. Moreira (2011). Parametrically-driven Duffing oscillators have been used to model many different physical systems such as the nonlinear dynamics of buckled beams Nayfeh and Sanchez (1989); Abou-Rayan et al. (1993) or driven Rayleigh-Bénard convection Lücke and Schank (1985). Homoclinic bifurcations were found in the parametrically-driven Duffing oscillator Parthasarathy (1992). Further bifurcations and chaos were found in Jiang et al. (2017). None of these papers investigated the type of spectral response we study here.
With the advent and development of micro-electromechanical systems (MEMS) technology in the 90’s new mechanical resonators were developed, such as the doubly clamped beam resonators that could reach very high quality factors. The dynamics of the fundamental mode of these resonators is well approximated by the Duffing equation. Furthermore, these micromechanical devices might exhibit, if properly tuned, a bistable response that can be quantitatively modeled by the bistability obtained in Duffing oscillators Aldridge and Cleland (2005). More recently, amplifiers that operate near the threshold of bifurcations were shown to present very high-gain amplification R. Almog, S. Zaitsev, O. Shtempluck, and Buks (2006, 2007); Almog et al. (2007). A degenerate parametrically excited Duffing amplifier was proposed by Rhoads et al. Rhoads and Shaw (2010).
One might be interested in a very sensitive high gain amplifier with a spread spectrum, so as to sample selectively a broad band of frequencies. This is particularly interesting for applications requiring spectrum sensing, and one way to achieve this is through the use of frequency combs Jamali and Babakhani (2019); Yang et al. (2019). The response of frequency combs to a narrowband small signal is given by a series of narrow peaks equally spaced in frequency. Cao et al. Cao et al. (2014) proposed a phononic frequency-comb generation based on an ac driven Fermi-Pasta-Ulam-Tsingou chain. In 2017, Ganesan et al Ganesan et al. (2017, 2018) created the first mechanical resonators that had spectral lines similar to optical frequency-combs. Their experimental apparatus is based on two symmetrical cantilevers mechanically coupled to one another at their bases. They used two coupled nonlinear normal modes to model the dynamics in which the first mode is resonantly excited by an added external drive, while the second mode is parametrically excited by the first mode. These experiments were followed by Czaplewski et al Czaplewski et al. (2018) in 2018, who used another two-mode coupling nonlinear model to describe experimental data from a mechanical resonator with both flexural and torsional vibrations. In Ref. Houri et al. (2019), the authors propose a theoretical model based on an approximation to a nonlocal Euler-Bernoulli model with many normal modes to describe frequency combs. More recently, Singh et al. Singh et al. (2020) observed a mechanical frequency comb in a graphene-silicon nitride hybrid resonator. They modeled the observed phenomena using two coupled normal modes, one nonlinear (graphene) and the other linear (SiN).
We present one parametrically-driven Duffing oscillator model and make a nonlinear analysis of it based on the averaging method. When there is no external added ac excitation, this nonlinear system can present a bistable region (in which the quiescent solution and one limit cycle are stable as seen in the original non-autonomous system). From the perspective of the averaged equations one has a tristable region, whose onset corresponds to a dual saddle-node bifurcation. There is also a threshold for parametric instability, which corresponds to a pitchfork bifurcation in the averaged equations, either supercritical or subcritical. With the application of an external ac drive, the nonlinear system may present a frequency-comb-like behavior as the parametric pump amplitude is increased past the dual saddle-node bifurcation. It occurs just after a sharp increase in the spectral component corresponding to parametric instability. This corresponds to a symmetry-breaking transition, in which the number of spectral peaks is doubled with peaks equally spaced in the frequency spectrum. All these responses are captured by the first-order averaging method.
In this article we show that a weaker form of mechanical frequency combs (MFCs) gradually appears when the parametric pump amplitude is increased. In addition to that, a stronger form of MFCs occurs after a symmetry-breaking bifurcation. In this form, there are twice as many peaks in the Duffing oscillator response to the added ac excitation as in the weaker form of the frequency comb. Furthermore, unlike the models proposed in Refs. Ganesan et al. (2017, 2018); Czaplewski et al. (2018), we show that only one parametrically-driven nonlinear mode is needed to present the frequency-comb-like behavior in the spectral response of the resonator. Different from the analysis developed by Bryant and Wiesenfeld Bryant and Wiesenfeld (1986), there is no typical period-doubling bifurcation here.
II The parametrically-driven Duffing oscillator model
The one-degree of freedom model we use to describe the dynamics of a parametrically-driven nonlinear resonator is given by
| (1) |
in dimensionless units. Here is the dissipation rate, is the nonlinear coefficient, is the parametric pump amplitude, and is the parametric pump angular frequency. Assuming and are , with , we can apply the averaging method Guckenheimer and Holmes (1983) to obtain a slow autonomous dynamics. This is accomplished via the transform
| (2) | ||||
After applying this change of variables and neglecting fast oscillating terms, via Poincaré weakly non-linear transformation, we obtain
| (3) | ||||
where . The fixed points are obtained from the solution of
| (4) | ||||
where . The characteristic equation based on Eq. (4) can be written as
| (5) |
The steady-state squared amplitude is given by
| (6) |
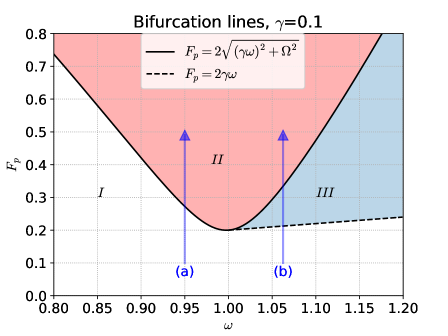
In Fig. 1, we present the bifurcation diagram in the parameter space of the averaged equations of motion, Eq. (3), of the parametrically-driven Duffing oscillator. When () and the only possible solution is . When () and , we also find the fixed-point solution with . These conditions characterize region I of the bifurcation diagram. In region II, we have . In this region, the steady-state amplitude admits two solutions: and
| (7) |
With and , we obtain the steady-state angle from
In region III, we have and . In this region, there are three different solutions for the steady-state amplitude : , and
| (8) |
The corresponding values of the steady-state angle can be obtained from
We determine the stability of the fixed points based on the eigenvalues of the Jacobian matrix. At a fixed point , it is given by
| (9) | ||||
For the fixed point, we obtain
| (10) |
The eigenvalues are given by
| (11) |
Note that when , the eigenvalues are complex and the quiescent mode fixed-point is a stable spiral. When , the two eigenvalues are real and this fixed point is a stable node. Hence, in regions I and III, this fixed point is stable, whereas, in region II, it is unstable. At the transition line to parametric instability, the stable node becomes an saddle point as one goes from either region I or III into region II.
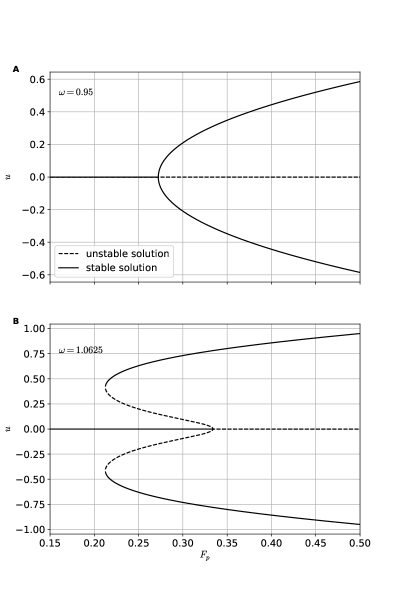
In Fig. 2 we plot the bifurcation diagrams along lines (a) and (b) of Fig. 1. In frame A, we obtain a supercritical pitchfork bifurcation as one crosses the parametric instability threshold along line (a). In frame B, we obtain a dual saddle-node bifurcation at about , and a subcritical pitchfork bifurcation at along line (b).
III The Duffing parametric amplifier
If we add to Eq. (1) an ac excitation, we obtain a parametric amplifier. Here we call it a Duffing amplifier (DA). It is described by the equation
| (12) |
where is the amplitude, is the angular frequency, and is an arbitrary phase of the external ac excitation. Assuming that , and all the other coefficients are also small as in the previous section, we can apply the averaging method. After doing so, we find the slowly-varying dynamics
| (13) | ||||
where .
IV Results and discussion
We used the Odeint function of the Python’s scientific library package SciPy Virtanen et al. (2020) to integrate Eqs. (12) and (13). The integration time-step used in each numerical result was , where . To avoid end discontinuities in the the time series we chose the total time of integration to be an integer multiple of . For each time series in which we performed the Fourier transform (FT) (Figs. 3-5), we run the equations of motion for a time interval of , of which we discarded the first half as an equilibration time so that all transients die out. The fast Fourier transform routine used was SciPy’s fftpack. In Figs 6-10, we calculated the peak amplitudes using the following method Rajamani and Rajasekar (2017)
| (14) | ||||
hence the amplitude of each peak is . This works because we have approximately . Here is the total number of visible peaks of the comb after the symmetry-breaking bifurcation, whereas before the symmetry-breaking bifurcation only peaks at odd values of contribute.
In frame (a) of Fig. 3, we show a time series of numerical integration of Eq. (12), which corresponds to parametric amplification in the DA with the parametric pump set at and the ac excitation amplitude set at . The envelopes are obtained from the averaged slowly-varying dynamics given in Eqs. (13). The envelope of the pulses is approximately symmetric in time. In frame (b) of Fig. 3, we plot the FT corresponding to the time series shown in frame (a). The semi-analytic approximation to the numerical FT spectrum was obtained from the numerical integration of the corresponding averaged system, given in Eqs. (13), with the transformation defined in Eq. (2). The first-order harmonic balance approximation is roughly accurate, since it only predicts the signal () and idler () peaks in a parametric amplifier. Here, besides the signal and idler peaks, we barely see two other sidebands due to the nonlinearity of our system.
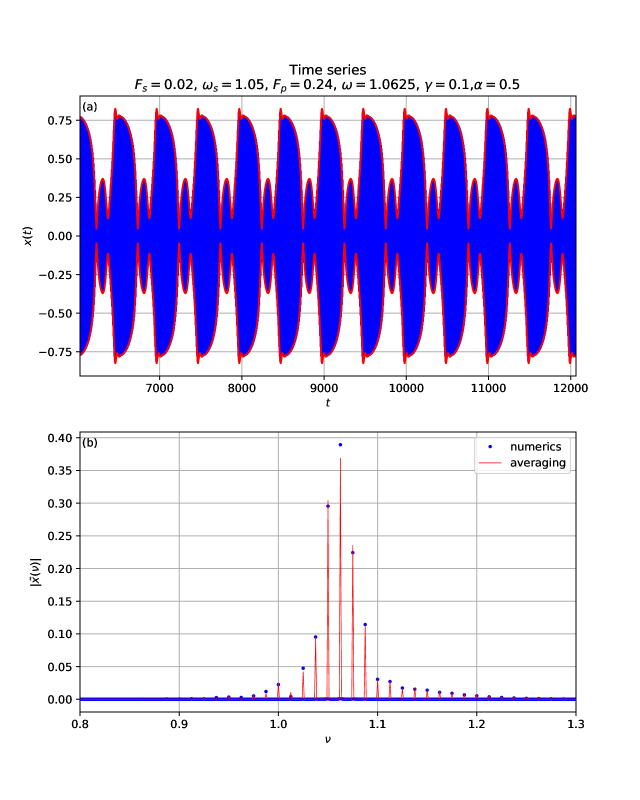
In frame (a) of Fig. 4, we show a time series of numerical integration of Eq. (12), which corresponds to parametric amplification in the DA with the parametric pump set at and the ac excitation amplitude set at . The envelopes are obtained from the averaged slowly-varying dynamics given in Eqs. (13). Note the increased time-inversion asymmetry in the envelope. In frame (b) of Fig. 4, we plot the Fourier transform (FT) corresponding to the time series shown in frame (a). The semi-analytic approximation to the numerical FT spectrum was obtained from the numerical integration of the corresponding averaged system, given in Eqs. (13), with the transformation defined in Eq. (2). The first-order harmonic balance approximation becomes inaccurate, since it only predicts the signal and idler peaks in a parametric amplifier. Here, besides the signal and idler peaks, we also have sidebands spaced from one another by and symmetrically positioned around these two central peaks. One can clearly see a frequency-comb-like spectrum with ten easily seen peaks.
In frame (a) of Fig. 5, with a higher value of the parametric pump amplitude (), the envelope of the DA response becomes even more asymmetric. One can see that for the same time span the number of pulses is halved as compared to the time series of Fig. 4. This could indicate that there was a period-doubling bifurcation in the dynamical system of Eq. (13), when the pump amplitude was increased from , in Fig. 4(a), to . In reality there is no period-doubling bifurcation there. In frame (b) of Fig. 5, in addition to the signal and idler peaks, we also have a strong peak at , which is at half the parametric drive frequency. Further new peaks can be seen at , , , …. If one increases further the parametric drive amplitude, then one gets a full transition to parametric instability in which one gets a very strong peak at with two small sidebands, the signal and the idler. The other spectral peaks of the frequency-comb tend to decrease gradually.
In Fig. 6, we show that a parametric instability occurs in a narrow window of amplitudes of the added ac excitation. In this region occurs the strongest forms of frequency-comb response such as occurs in Fig. 5. For the solutions are more symmetrical such as in Fig. 3, inside the window they are least symmetrical. Whereas for , there is parametric instability suppression, less asymmetry, and the frequency-comb response is weaker, with peaks spaced by (see Fig. 4).
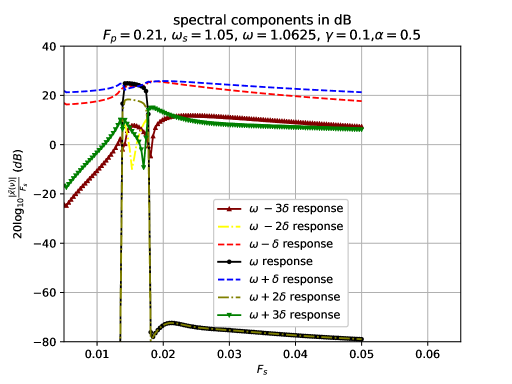
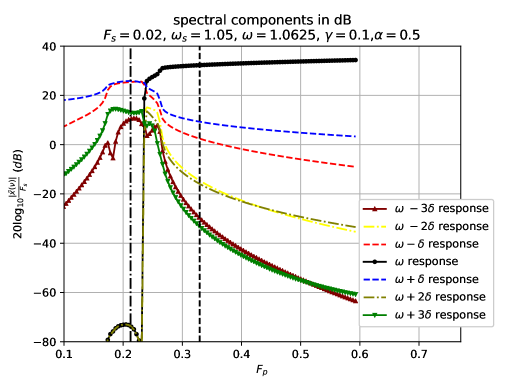
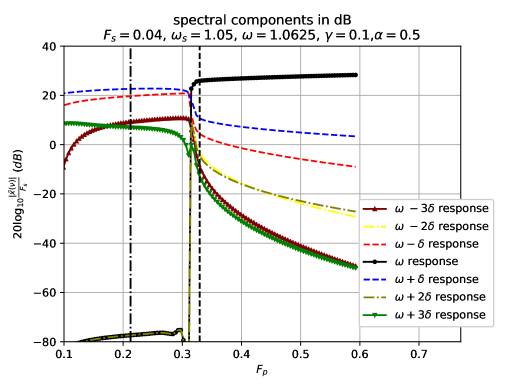
In Figs. 7-10, we show how the seven main spectral peaks vary as a function of the parametric pump amplitude. In Figs. 7-8, we fix at and we increase along line of the bifurcation diagram of Fig. 1. We can see parametric instability suppression as evidenced by the delayed increase in the amplitude of the spectral peak at . The sharp increase in this peak only occurs well past the parametric instability transition of Fig. 1, when there is no external drive (). One sees that the higher is the more suppression in parametric instability there is.
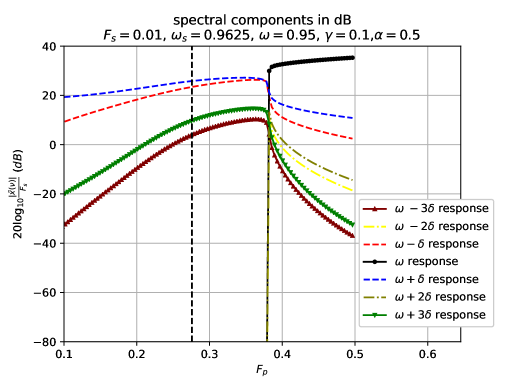
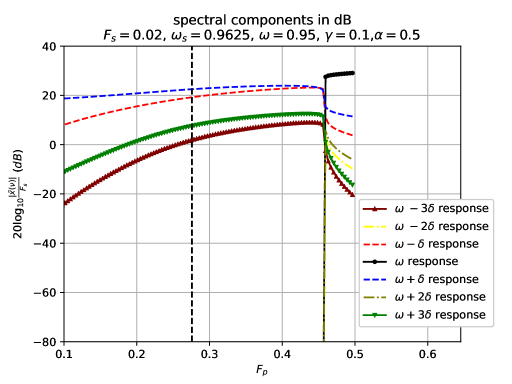
In Figs. 9-10, and we vary along line of the bifurcation diagram of Fig. 1. One can see that the sharp increase in the spectral peak at of the DA response generates an even stronger frequency-comb-like behavior, with twice as many peaks, now spaced out in frequency from one another by . By comparing the results of Figs. 9 and 10, one sees that with increasing value of there is also a suppression of parametric instability. In this case, the parametric instability transition still occurs in the bistable region, below the threshold to instability in the parametric oscillator (dashed line). Apparently, counterintuitively, the larger (the larger the external excitation) is, the more stable the smaller amplitude of the parametrically-driven Duffing oscillator response is.
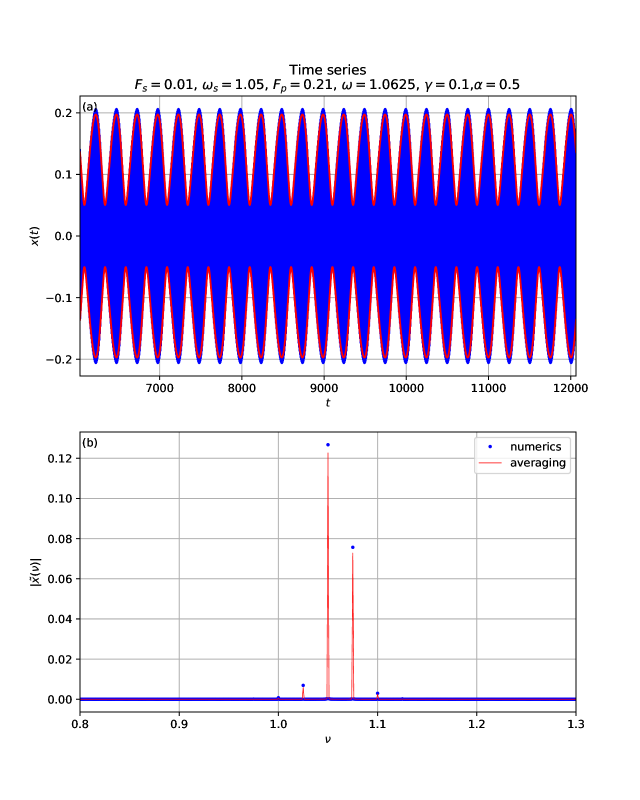
(b) The corresponding Fourier Transform. The strongest peak is the signal, at , whereas the second strongest peak is the idler. These two peaks (signal and idler) are hallmarks of a parametric amplifier.
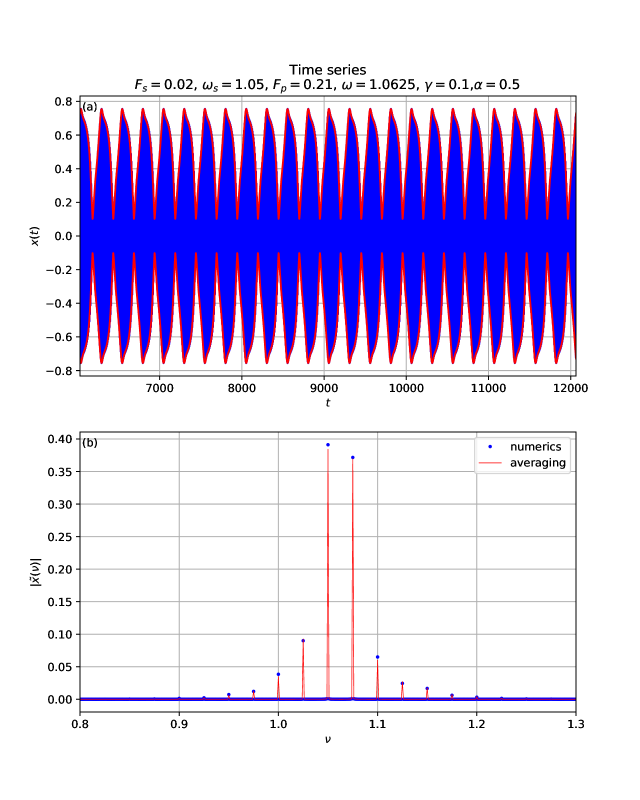
(b) The corresponding Fourier Transform. One can see a frequency-comb-like behavior. The strongest peak is the signal, at , whereas the second strongest peak is the idler. The other peaks are due to the nonlinear nature of the amplifier. There are peaks only at , where .
V Conclusion
Here we investigated a one-degree-of-freedom parametrically-driven Duffing oscillator with a small added ac drive that could present suppression of parametric instability or present spectral peaks similar to recent experimental results of mechanical frequency combs Ganesan et al. (2017, 2018); Czaplewski et al. (2018); Singh et al. (2020). We have seen two types of frequency comb behavior: one weaker and one stronger. The stronger frequency comb has twice as many peaks as the weaker form with peaks at half the distance from one another. We claim that the fundamental cause of the frequency-comb dynamical behavior is a symmetry breaking bifurcation that occurs near the parametric instability transition. We have also shown that the averaging method can capture this spectral response. The stronger form of the frequency comb arises after a subcritical pitchfork bifurcation of the averaged system of equations of the DA. In addition, the simple model we propose here could be used as a theoretical framework, or a toy model, for the study of the frequency comb phenomenon in mechanical oscillators.
Furthermore, we point out that our theory is similar to the one developed by K. Wiesenfeld and McNamara in the 80’s for amplification of small signals near bifurcation points. Their theory presented in Refs. Wiesenfeld and McNamara (1985, 1986) is a linear response theory based on Floquet theory, whereas here we present a nonlinear response theory based on the averaging method. Also, we construct an approximate analytical solution, whereas their model is generic. One would still have the difficult task of obtaining the Floquet eigenfunctions. In addition, the perturbing terms in their prototype example is a parametric drive, whereas in our models the perturbing terms are the added ac signals.
It is worth mentioning that Bryant and Wiesenfeld Bryant and Wiesenfeld (1986) (see their Fig. 12) obtained an effect similar to the frequency-comb spectral peaks seen here. There are several important differences between our physical systems. Their Duffing oscillator is not driven parametrically and has a very low quality factor, which effectively reduces its dimensionality. They present a suppression of a period-doubling bifurcation, whereas here we have a suppression of parametric instability due to the small added external ac signal. We saw that the suppression increases with the ac signal amplitude. In our system, the frequency-comb behavior occurs more strongly in the region III of the bifurcation diagram, where quiescent solution and limit cycle are both stable. Before the jump in amplitude of the central peak, the peaks are spaced by , after the jump the peaks are spaced by . The frequency-comb-like spectrum is stronger in a narrow region after the jump of the central peak.
We investigate one simple nonlinear dynamical system to support our claim. The proposed system does not present mode coupling and, thus, has lower dimensionality than the phenomenological models used to explain the spectral signatures of the experimental mechanical frequency combs. We believe this could lead to further research to find simpler apparatuses, with less parameters and less normal modes, that could deliver a frequency-comb-like behavior. We also believe this work could spur more theoretical work to help understand better the connection between the frequency comb behavior and the various bifurcations that occur in conjunction. For example, in Ganesan et al. Ganesan et al. (2018), one can see clearly in their Fig. 2 a spectral map that we think has the footprints of a symmetry-breaking bifurcation as we have seen here. Just below half-way their spectral map, as the pump amplitude is increased, twice as many peaks appear, with each new peak in the middle of two pre-existent ones. Finally, we point out that the equations of the model proposed by Singh et al. Singh et al. (2020) for describing their mechanical frequency comb can be recast in a form similar to Eq. (13) if one integrates out the degrees of freedom of the second normal mode.
References
- Wiesenfeld and McNamara (1985) K. Wiesenfeld and B. McNamara, Phys. Rev. Lett. 55, 13 (1985).
- Wiesenfeld and McNamara (1986) K. Wiesenfeld and B. McNamara, Phys. Rev. A 33, 629 (1986).
- Tien (1958) P. Tien, J. of Appl. Phys. 29, 1347 (1958).
- Landauer (1960) R. Landauer, J. of Appl. Phys. 31, 479 (1960).
- Louisell (1960) W. H. Louisell, Coupled Mode and Parametric Electronics (Wiley, New York, 1960).
- Batista and R. S. N. Moreira (2011) A. A. Batista and R. S. N. Moreira, Phys. Rev. E 84, 061121 (2011).
- Nayfeh and Sanchez (1989) A. H. Nayfeh and N. E. Sanchez, International Journal of Non-Linear Mechanics 24, 483 (1989).
- Abou-Rayan et al. (1993) A. Abou-Rayan, A. Nayfeh, D. Mook, and M. Nayfeh, Nonlinear Dynamics 4, 499 (1993).
- Lücke and Schank (1985) M. Lücke and F. Schank, Phys. Rev. Lett. 54, 1465 (1985).
- Parthasarathy (1992) S. Parthasarathy, Phys. Rev. A 46, 2147 (1992).
- Jiang et al. (2017) T. Jiang, Z. Yang, and Z. Jing, International Journal of Bifurcation and Chaos 27, 1750125 (2017).
- Aldridge and Cleland (2005) J. S. Aldridge and A. N. Cleland, Phys. Rev. Lett. 94, 156403 (2005).
- R. Almog, S. Zaitsev, O. Shtempluck, and Buks (2006) R. Almog, S. Zaitsev, O. Shtempluck, and E. Buks, Appl. Phys. Lett. 88, 213509 (2006).
- R. Almog, S. Zaitsev, O. Shtempluck, and Buks (2007) R. Almog, S. Zaitsev, O. Shtempluck, and E. Buks, Appl. Phys. Lett. 90, 013508 (2007).
- Almog et al. (2007) R. Almog, S. Zaitsev, O. Shtempluck, and E. Buks, Phys. Rev. Lett. 98, 078103 (2007).
- Rhoads and Shaw (2010) J. F. Rhoads and S. W. Shaw, Applied Physics Letters 96, 234101 (2010).
- Jamali and Babakhani (2019) B. Jamali and A. Babakhani, IEEE Transactions on Terahertz Science and Technology 9, 613 (2019).
- Yang et al. (2019) B. Yang, H. Chi, S. Yang, Z. Cao, J. Ou, and Y. Zhai, IEEE Photonics Journal (2019).
- Cao et al. (2014) L. Cao, D. Qi, R. Peng, M. Wang, and P. Schmelcher, Phys. Rev. Lett. 112, 075505 (2014).
- Ganesan et al. (2017) A. Ganesan, C. Do, and A. Seshia, Phys. Rev. Lett. 118, 033903 (2017).
- Ganesan et al. (2018) A. Ganesan, C. Do, and A. Seshia, Applied Physics Letters 112, 021906 (2018).
- Czaplewski et al. (2018) D. A. Czaplewski, C. Chen, D. Lopez, O. Shoshani, A. M. Eriksson, S. Strachan, and S. W. Shaw, Phys. Rev. Lett. 121, 244302 (2018).
- Houri et al. (2019) S. Houri, D. Hatanaka, Y. M. Blanter, and H. Yamaguchi, arXiv preprint arXiv:1902.10289 (2019).
- Singh et al. (2020) R. Singh, A. Sarkar, C. Guria, R. J. Nicholl, S. Chakraborty, K. I. Bolotin, and S. Ghosh, Nano Letters 20, 4659–4666 (2020).
- Bryant and Wiesenfeld (1986) P. Bryant and K. Wiesenfeld, Phys. Rev. A 33, 2525 (1986).
- Guckenheimer and Holmes (1983) J. Guckenheimer and P. Holmes, Nonlinear Oscillations, Dynamical Systems, and Bifurcations of Vector Fields (Springer-Verlag, New York, 1983).
- Virtanen et al. (2020) P. Virtanen et al., Nature Methods 17, 261 (2020).
- Rajamani and Rajasekar (2017) S. Rajamani and S. Rajasekar, Journal of Applied Nonlinear Dynamics 6, 121 (2017).