Framing in the Presence of Supporting Data: A Case Study in U.S. Economic News
Abstract
The mainstream media has much leeway in what it chooses to cover and how it covers it. These choices have real-world consequences on what people know and their subsequent behaviors. However, the lack of objective measures to evaluate editorial choices makes research in this area particularly difficult. In this paper, we argue that there are newsworthy topics where objective measures exist in the form of supporting data and propose a computational framework to analyze editorial choices in this setup. We focus on the economy because the reporting of economic indicators presents us with a relatively easy way to determine both the selection and framing of various publications. Their values provide a ground truth of how the economy is doing relative to how the publications choose to cover it. To do this, we define frame prediction as a set of interdependent tasks. At the article level, we learn to identify the reported stance towards the general state of the economy. Then, for every numerical quantity reported in the article, we learn to identify whether it corresponds to an economic indicator and whether it is being reported in a positive or negative way. To perform our analysis, we track six American publishers and each article that appeared in the top 10 slots of their landing page between 2015 and 2023.
1 Introduction
The mainstream media has much leeway in what it chooses to cover and how it covers it. Should the top article at any given point in time be about an international incident or the state of the economy? Conditional on choosing to cover the economy, should the article focus on the indicator that is up or the one that is down? Should it be optimistic or pessimistic towards the future? These choices have real-world consequences affecting outcomes such as voting behavior Druckman and Parkin (2005); Gerber et al. (2009), gun purchases Krupenkin et al. (2023), and attitudes towards immigrants Krupenkin et al. (2020); Guo et al. (2023). Most selection and framing decisions lack objective measures, making research on this topic difficult.

In this paper, we make the observation that there are a select number of newsworthy topics where objective measures do exist. For example, there is a finite set of economic indicators that experts use to define the state of the economy, such as changes in non-farm payroll and gross domestic product. Another example is crime, which has well-established data points maintained by the FBI and local jurisdictions. Building a system capable of tracking a large number of publications, identifying which indicators are reported and how they are being reported has enormous research potential. Such a system would enable us to create three views of potential bias: how a publication is covering a topic over time, how their coverage differs from other publications, and how it compares to the accepted ground truth of experts in the field.
Following this rationale, we propose a computational framework to predict frames in the presence of supporting data. For a given article, our goal is to automatically identify how the general topic is being portrayed, which indicators are being reported to support this view, and how each of these indicators are being presented. We focus specifically on news articles about the U.S. economy. However, we argue that this framework could be adapted to other domains where numerical indicators are used, including reports on crime, climate change, and public opinion.
Most previous computational framing analysis approaches have conceptualized and interpreted frames as high-level relevant topics and themes Ali and Hassan (2022). For example, Boydstun et al. (2014) proposed 15 broad dimensions that aim to capture ways in which policy issues are discussed in news articles. The dimensions include themes such as “economic” and “public opinion”. These broad dimensions fail to capture a frame’s nuances. For example, the “economic frame” focuses on anything related to the economy, which is insufficient to answer the question of how different aspects of the economy are being presented.
To address this problem, we decompose economic frames into a set of interdependent tasks (See Fig. 1). At the article level, we identify the relevance of the article to the economy, the type of economic information it covers (e.g., macro economic, industry-specific, firm-specific), and two measures of general economic sentiment: the state of the economy (e.g., good, fair, poor), and the direction in which the economy is heading (e.g., better, same, worse). Then, for each numerical quantity reported in the article, we predict whether it corresponds to an economic indicator (e.g., market numbers) and its reported polarity (e.g., “The S&P 500 fell 3%” has a negative polarity). This decomposition captures three levels: whether the economy is being discussed, which economic indicators are highlighted, and the framing of those indicators and the economy as a whole. This way, we can go beyond analyzing topic selection by additionally measuring how a publication’s reporting differs from the objective reality at that time, how it evolves across time, and how it compares to other publications. We present a computational model that predicts each proposed frame component jointly. It utilizes the inter-dependence between the sub-tasks (e.g., polarity of quantities and polarity of the article they appear in) to improve upon results obtained by independent classifiers trained to make predictions individually with limited supervision.
We make the following contributions: (1) We propose a computational framework to model framing in the presence of supporting data and apply it to news about the U.S. economy. (2) We collect a novel dataset of landing page news articles published by a set of major U.S. news outlets between 2015 and 2023, and provide high-quality annotations of our proposed frame components for a small subset of examples. (3) We propose an automated method to detect each of the proposed frame components under low-supervision settings. (4) We demonstrate that our framework can be used to track when and how often (selection), as well as how (framing) different news outlets report on specific aspects of the economy. We compare these reports to the ground truth for two example indicators: job numbers and prices. All of our code and data has been released to the community***https://github.com/blast-cu/econ-indicators.
2 Background and Related Work
In this section, we cover the background on selection and framing, explain economic indicators, and discuss previous approaches to analyze framing.
Selection and Framing
National news publications have a massive choice-set of topics they could cover on any given day. Though it may seem like the publications are reacting to a defined set of events that recently happened, outside of a few major events, they choose what the news is on any given day. In other words, the news in mainstream publications does not present an objective view of current affairs. Rather, it is influenced by the selection made by media professionals McQuail (1992). Selection is driven by what researchers have called news values Galtung and Ruge (1965); Harcup T and O’Neill D (2001, 2017), which determine whether a story is newsworthy.
While there is variation in the taxonomies that have been proposed to determine newsworthiness, the most recent ones include factors such as: the power of the elite (stories concerning powerful entities), bad and good news (stories with particular emotional overtones), and magnitude (stories that are perceived as significant for a wide audience) Harcup T and O’Neill D (2017). More interestingly, news values vary from publication to publication. A study of the run-up to the 2022 election showed that the New York Times and Washington Post averaged just two overlapping topics each morning in their printed editions out of about six articles Rothschild et al. (2023).
Conditional on selecting a topic, there is additional leeway on how to cover it, as there is a wide-range of facts and opinions that could spin the takeaway of the readers. This phenomenon, referred to as framing, has been widely studied in communication studies. While there is not an agreed upon definition of framing, recent surveys Vallejo et al. (2023) have identified the following prevalent definitions: equivalence framing (presenting the same exact information in different ways) Cacciatore et al. (2015), emphasis framing (highlighting specific aspects of an event to promote a particular interpretation) Entman (2007), and story framing (leveraging established narratives to convey information) Hallahan (1999).
When it comes to the economy, a publication could present a rosy or terrible version of the economy. They can do so without lying by simply picking the right economic indicator with the right perspective. For example, there are months where the value of the non-farm payroll is above average, but below the market expectation: either perspective is technically true. But, with a relatively finite set of indicators, and an established way for economists to judge them, there is still a clear ground truth to compare if any given indicator with any given perspective represents the consensus understanding of the economy at that time.
Economic Indicators
Understanding the health and wealth of the U.S. economy is critical for investment and growth. Most modern economic indicators have been tracked for decades, codified in the by the mid-20th century. Examples include: jobs numbers (e.g., non-farm payroll), prices (e.g., consumer price index), and macro economic (e.g., gross domestic product). With the exception of market prices (e.g., S&P500), which are a reflection of the underlying assets, the core indicators are tracked by a few government agencies (e.g, the Bureau of Economic Analysis for GDP, spending, income, trade, and the Bureau of Labor Statistics for unemployment, prices, productivity), which conduct regular, large scale polling.
These economic indicators inform the public on the health of the economy. The job numbers are front page news when they are released at 8:30 AM ET on the first Friday of each month. The state of the markets is constantly covered in the news. Indicators such as the consumer price index pop up whenever the media finds them most important, interesting, and engaging. Most people have limited views of the economy outside of their close social circle, so these values are the key to their understanding of the health of the economy as a whole. And, traditionally, the health of the economy has tracked very closely with the approval of incumbent political leaders Hummel and Rothschild (2014).
Framing of Economic News
This paper builds off of an extensive literature that has not just identified the quantity of economic coverage, but framing of that coverage. Most of this work is geared towards matching the sentiment of articles about the economy to both consumer sentiment and economic indicators, tracking both historical value and predicting future ones Hopkins et al. (2017); Ardia et al. (2019); Shapiro et al. (2022); Seki et al. (2022); Bybee (2023); van Binsbergen et al. (2024). While the methods continue to evolve from simple keywords to BERT or LLM-based predictions, they are focused on article-level sentiment, aggregated to states or the U.S. They also study a mix of questions about economic impact that benefit from a long time-series of sentiment, granular in both time and geography, regarding questions as diverse as the impact of bubbles on industries (Bybee, 2023), economic shocks to economic decisions Shapiro et al. (2022), to the relationship between news and perception of the economy Hopkins et al. (2017). Our paper extends this literature by capturing not only the sentiment of economic articles, but what economic indicators and economic indicator-level sentiment is driving it. This allows us to dissect what editorial choices are driving perceived sentiment around the economy.
Computational Framing Analysis
Scholars have increasingly adopted computational approaches to study framing, allowing studies to scale to large media repositories. In most cases, researchers adopt unsupervised techniques such as topic modeling to identify latent themes DiMaggio et al. (2013); Nguyen et al. (2015); Gilardi et al. (2021). However, topic models are limited in their ability to capture framing nuances. By defining topics as simple distributions over words, they lack the semantic and discursive conceptualization needed to answer how issues and events are being presented Ali and Hassan (2022).
There is also a body of work leveraging supervised learning Johnson et al. (2017); Khanehzar et al. (2019); Kwak et al. (2020); Huguet Cabot et al. (2020); Mendelsohn et al. (2021) and lexicon expansion techniques Field et al. (2018); Roy and Goldwasser (2020) to analyze framing. For this to be feasible, authors must define a concrete taxonomy of which frames are relevant and how they are represented in data. Most of these approaches rely on the taxonomy proposed by Boydstun et al. (2014). These dimensions correspond to broad themes such as “economic”, and “public opinion”. While these themes have shown to be useful to model a select set of contentious political issues like abortion and immigration, they are too broad to capture how the economy and other data-driven topics are being presented in the media.
3 Data
In this section, we describe our data collection process, annotation schema, annotation guidelines, and quality assurance process. We also present statistics for our resulting dataset.
Data Collection
The data for this study came from the Internet Archive’s Wayback Machine Archive (1996-2023). We consider six American publishers: The New York Times, The Wall Street Journal, The Washington Post, Fox News, HuffPost and Breitbart. Selected sources represent a broad range of mainstream media outlets that were easily accessible through the archive. Breitbart is included for a future analysis comparing mainstream media with a fringe source. For each publisher, we collected the “front page” from every Wayback Machine entry between Jan. 1st 2015 to Jan. 1st 2023. For each front page, we recorded articles in the top 10 positions and discarded all duplicates.
To identify articles that discuss the economy, we curated a lexicon of economic terms sourced from the Bureau of Labor Statistics and the FRED database operated by the Federal Reserve bank of St. Louis.†††https://www.bls.gov/data/‡‡‡https://fred.stlouisfed.org/ These sources provide a fairly comprehensive list of common metrics for economic activity. We consider an article to be relevant to the economy if it contains at least three sentences mentioning an economic term from our lexicon. This resulted in a total of 199,066 articles (Tab. 1). App. A.1 includes additional details about the data collection process and the lexicon of economic terms.
Data Annotation
We employed a group of six annotators to label our dataset following the guidelines outlined in App. A.3. Our annotators comprised senior, postdoctoral and pre-doctoral researchers. Their fields of study include: economics, computational social science, and communications. They received training from the authors of the paper and several rounds of calibration were performed before annotation began. Articles were chosen such that there would be some overlap between coders (in order to check quality) and a decent breadth of coverage. We prioritized topic diversity over uniformity of news outlets and thus followed the sampling procedure introduced in Pacheco et al. (2022b, 2023).
For each article in their batch, annotators selected: (1) what type of economic information was the most prominent (macro, government, industry-specific, business-specific or personal), (2) the framing of the general economic conditions (good, fair, bad), and (3) the framing of the direction that the economy is heading (better, same, worse). These questions were adapted from the Gallup economic index §§§https://news.gallup.com/poll/1609/consumer-views-economy.aspx. Then, for every valid numerical value reported in the article, annotators selected: (1) what type of economic data it reports (macro, government, industry-specific, business-specific or personal), (2) which indicator was reported (e.g., jobs, prices. See App. A.3 for the full list of options), and (3) the reported polarity of each quantity (positive, negative, neutral). We report resulting statistics in Table 1, and inter-annotator agreement in Tab. 2. To calculate agreement, we only consider examples that were annotated by two or more coders. In App. A.4 we include statistics for the number of coders for each of the label categories. Lastly, we show the resulting annotation distribution for all frame components in Figs. 2 and 3.
| Publisher | Econ | Quants. | Human Annotations | |
| Arts. | Art-level | Quant-level | ||
| New York Times | 58,240 | 370,723 | 516 | 1,117 |
| Wall Street Journal | 46,267 | 551,726 | 206 | 493 |
| Washington Post | 44,016 | 274,197 | 231 | 421 |
| Fox News | 21,795 | 76,074 | 45 | 42 |
| Breitbart | 15,954 | 66,572 | 91 | 149 |
| HuffPost | 12,794 | 75,180 | 82 | 210 |
| Total | 199,066 | 1,414,472 | 1,171 | 2,414 |
| Cross-Annotated | 270 | 689 | ||
| Annotation | K’s | % of Agreement | |
|---|---|---|---|
| Full | Partial | ||
| Article Type | 0.48 | 57.81 | 90.62 |
| Econ. Conditions | 0.43 | 55.13 | 85.90 |
| Econ. Direction | 0.42 | 47.44 | 82.05 |
| Quantity Type | 0.75 | 80.84 | 88.97 |
| Quantity Polarity | 0.56 | 68.04 | 76.48 |
| Macro Ind. | 0.83 | 83.42 | 92.78 |
We find that inter-annotator agreement is generally good for quantity-level information (Krippenforff’s 0.56-0.83). This reflects our intuition that capturing framing at the level of supporting data points may be a better alternative to relying on general topical markers. On the other hand, article-level judgements which aim to capture main “takeaways” are considerably harder for annotators, exhibiting moderate agreement (Krippenforff’s 0.42-0.48). This is expected and in line with other high-level framing tasks Card et al. (2015); Roy et al. (2021); Mendelsohn et al. (2021). To further characterize the lower agreement values, we include confusion matrices and some examples illustrating ambiguous cases in App. A.5. We find that most of the confusion lies on the following article-level judgements: (1) identifying the main type of the article, particularly deciding between macro-economic and government-specific types when both types of data points are present in the article, (2) characterizing articles that are positive towards the economy, as they tend to be more subtle than the clearly negative ones, and (3) identifying articles that suggest that the economy is doing neither better nor worse, but staying the same, which is an inherently ambiguous category. We have included a similar confusion analysis for quantitative-level judgements in App. A.5.


4 Model
Obtaining high-quality annotations for our task is time-consuming and requires considerable domain expertise. For this reason, one of the main challenges that we face in predicting economic frames is a small amount of supervision. To circumvent this constraint we combine two modeling strategies: (1) Exploiting the decomposition of frame prediction into a set of modular, inter-dependent sub-tasks, and (2) Leveraging pre-training strategies using our large set of in-domain unlabeled examples (all 199,066 economic articles collected).
Exploiting inter-dependencies with SRL
Statistical relational learning (SRL) methods attempt to model a joint distribution over relational, inter-dependent data Richardson and Domingos (2006); Bach et al. (2017); Pacheco and Goldwasser (2021). These methods have proven particularly effective in tasks where contextualizing information and interdependent decisions can compensate for a low number of annotated examples Deng and Wiebe (2015); Roy et al. (2021); Pacheco et al. (2022a).
To model framing, we take advantage of the relations between the values of the frame components for a given article and implement a relational model using Probabilistic Soft Logic (PSL) Bach et al. (2017). Dependencies in PSL are expressed using weighted logical rules of the form: , where indicates the importance of the rule in the model, and can be learned from data. Predicates correspond to decisions and observations. Rules are then compiled into a Hinge-Loss Markov random field and weights are learned using maximum likelihood estimation. We consider the following rules:
Priors. We explicitly model prior probabilities for all article-level (type, economic conditions and economic direction) and quantity-level (type, macro-indicator, and sentiment) components. These priors are derived from supervised classifiers trained on our labeled dataset.
Consistency between the quantity type and the macro-indicator. We enforce that if the quantity of a type is macro, then a macro-indicator must be predicted, and vice-versa:
Consistency between the article type, economic conditions and direction. We enforce that if the article type is macro, then economic conditions and economic direction must be predicted and vice-versa:
Dependency between the polarity of quantities and economic conditions. Our intuition is that if several negative quantities are reported in the article, then the article is likely to frame economic conditions as negative, and vice-versa for positive quantities:
Dependency between the polarity of quantities and economic direction. Our intuition is that if many negative quantities are reported in the article, then the article is likely to frame the direction of the economy as negative, and vice-versa for positive quantities:
Dependency between neighboring quantity types. Our intuition is that there are common patterns in the types of consecutive quantities (e.g., sequential dependencies):
Rule and are modeled as hard constraints, and are always enforced because they are designed to force predictions to follow the frame annotation structure. Rules are modeled as soft constraints, and their weights are learned through PSL. This way, we allow for predictions that do not conform to the templates to be active.
Enhancing PSL priors with pre-trained language models
Pre-trained language models (LMs) are one of the most effective techniques for acquiring knowledge from unlabeled text data Devlin et al. (2019). Domain-adaptive pre-training (DAPT) further enriches LMs with in-domain data Gururangan et al. (2020). In both of these pre-training stages, learning is conducted by randomly masking words in a large dataset and training the the LM to predict these words. To take advantage of these strategies, we use pre-trained RoBERTA and perform DAPT with our large unlabeled dataset (all 199,066 economic articles collected). We use this LM to fine-tune the classifiers that are used as priors in PSL. This strategy has been repeatedly used to combine PSL with strong classifiers, with consistent success Sridhar et al. (2015); Pacheco and Goldwasser (2021); Roy et al. (2021).
5 Experimental Evaluation
In this section, we outline our experimental settings and present results for our frame prediction model. We also include an example of the type of framing analysis that can be done using our model predictions over the complete dataset.
5.1 Frame Prediction
To determine the effectiveness of exploiting inter-dependencies with statistical relational learning and our additional pre-training steps, we conducted an ablation study in addition to evaluating the model as a whole. We provide a discussion of the results of these experiments, in which we detail per-class and per-publisher metrics.
Experimental Settings
We perform 5-fold cross-validation in all scenarios, and assume a multi-class setup for each frame component. To create our folds, we first split the articles that were cross-annotated and where inter-annotator agreement was reached (270 articles, 689 quantities) into five folds, and consider 4 folds for training and 1 for testing. Then, we further enhance the training data for all cases with the additional annotated articles, which we consider as a source of noisy supervision. More details about the data splits used for experiments are included in App. A.6.
The base classifiers are initialized with pre-trained RoBERTA (with and without DAPT) and trained using the AdamW optimizer, cross-entropy loss, and a learning rate of . For early stopping, we use the macro F1 on the dev set, consisting of ten percent of the training articles for each fold. For more details on the classifier architectures and training settings, see App. A.6. Predictions are fed into PSL as priors, and rule weight learning is done with the standard configuration. We report the average macro F1 scores for all folds.
Results
We present our general results in Tab. 3. This includes baselines obtained by zero-shot and two-shot prompting Mistral-7b-Instruct-v0.2. Additional details about the prompts and performance can be found in App. A.6. We find that fine-tuning, even with relatively little data, results in better performance than prompting an LLM. Additionally, we find that DAPT is considerably helpful for quantity-level predictions, but does not improve article-level predictions. We hypothesize that it is difficult for RoBERTa to model the long context of articles to take advantage of the masked language modeling objective. Next, we find that the relational model gives us a clear boost in performance over the base classifiers, with the exception of article type. This improvement supports our modeling decision to decompose frame prediction into inter-dependent sub-tasks. While Tab. 3 reports macro F1, we find the same trend for weighted F1 (See App. A.7).
| Model | Article-level | Quantity-level | ||||
|---|---|---|---|---|---|---|
| Type | Cond | Dir | Type | Ind | ||
| Random | 0.136 | 0.148 | 0.19 | 0.111 | 0.064 | 0.324 |
| Majority Label | 0.237 | 0.269 | 0.252 | 0.193 | 0.08 | 0.382 |
| Mistral 0-shot | 0.386 | 0.236 | 0.346 | 0.566 | 0.262 | 0.382 |
| Mistral 2-shot | 0.367 | 0.186 | 0.385 | 0.358 | 0.47 | 0.43 |
| Base Classifier | 0.515 | 0.697 | 0.493 | 0.685 | 0.824 | 0.796 |
| Base Classifier + DAPT | 0.474 | 0.636 | 0.475 | 0.731 | 0.826 | 0.812 |
| Relational (best) | 0.438 | 0.717 | 0.522 | 0.748 | 0.849 | 0.813 |
In Tab. 4 we include an ablation study for the relational model rules. We observe that all rules contribute to an increase in performance for their corresponding decision predicates (see bold scores). We find that combining hard constraints (,) and the rule modeling sequential dependencies () performs the best.
| Rule | Article-level | Quantity-level | ||||
|---|---|---|---|---|---|---|
| Type | Cond | Dir | Type | Ind | ||
| Priors only | 0.515 | 0.697 | 0.493 | 0.731 | 0.826 | 0.812 |
| 0.515 | 0.697 | 0.493 | 0.688 | 0.853 | 0.813 | |
| 0.438 | 0.717 | 0.518 | 0.731 | 0.826 | 0.812 | |
| 0.515 | 0.707 | 0.493 | 0.731 | 0.826 | 0.812 | |
| 0.515 | 0.697 | 0.521 | 0.731 | 0.826 | 0.813 | |
| 0.515 | 0.697 | 0.493 | 0.737 | 0.826 | 0.813 | |
| 0.438 | 0.717 | 0.518 | 0.688 | 0.853 | 0.813 | |
| 0.433 | 0.7 | 0.493 | 0.697 | 0.854 | 0.813 | |
| 0.432 | 0.691 | 0.516 | 0.697 | 0.855 | 0.813 | |
| (best) | 0.438 | 0.717 | 0.522 | 0.748 | 0.849 | 0.813 |
| 0.434 | 0.701 | 0.519 | 0.746 | 0.84 | 0.808 | |
We include results for the best relational model by article publisher in Tab. 5. At the article level, we observe higher values for the New York Times, reflecting the higher presence of annotated examples for this publisher (see Tab. 1). The results for Fox News articles are lower, reflecting the lower number of examples. Interestingly, the results for Breitbart and Huffpost do not follow this trend, maintaining relatively high values in spite of less supervision. In the case of quantities, we see relatively high and stable performance for all publishers, with the exception of Fox News. We provide further error analysis in regard to this in App. A.9. These results are particularly encouraging, as they suggest that we can leverage quantity predictions to perform a high-fidelity selection and framing analysis of economic news.
| Publisher | Article-level | Quantity-level | ||||
|---|---|---|---|---|---|---|
| Type | Cond | Dir | Type | Ind | ||
| New York Times | 0.544 | 0.809 | 0.534 | 0.663 | 0.826 | 0.777 |
| Wall Street Journal | 0.173 | 0.434 | 0.28 | 0.834 | 0.813 | 0.884 |
| Washington Post | 0.574 | 0.704 | 0.621 | 0.665 | 0.686 | 0.788 |
| Fox News | 0.4 | 1.0 | 0.4 | 0.733 | 1.0 | 0.333 |
| Breitbart | 0.636 | 0.325 | 0.597 | 0.98 | 0.867 | 0.655 |
| HuffPost | 0.564 | 0.625 | 0.3 | 0.609 | 0.686 | 0.866 |
Lastly, we include fine-grained results for predicting the different macro-indicators using our best model in Tab. 6. We find that we have relatively good performance for most indicators, with the exception of the ’other’ category, which may be due to the lack of cohesiveness in this class. We also see lower performance for retail sales, which we attribute to the lack of sufficient supervision for this class (See Fig. 3). An effective large-scale analysis of retail indicators in the news would require greater supervision for this class.
| Macro-Indicator | Prec. | Recall | F1 |
| Job Numbers (jobs, unemployment) | 0.956 | 0.982 | 0.968 |
| Retail Sales | 0.667 | 1.0 | 0.8 |
| Interest Rates (Fed, mortgage) | 0.75 | 0.857 | 0.8 |
| Prices (CPI, PPI) | 0.733 | 0.846 | 0.786 |
| Energy Prices (gas, oil, etc.) | 1.0 | 1.0 | 1.0 |
| Wages | 0.867 | 0.812 | 0.839 |
| Macro Economy (GDP, etc) | 0.881 | 0.860 | 0.871 |
| Market Numbers (any financial market) | 0.941 | 0.814 | 0.873 |
| Currency Values | 1.0 | 0.8 | 0.889 |
| Housing (start, sales, pricing) | 1.0 | 0.95 | 0.974 |
| Other | 0.375 | 0.5 | 0.429 |
| None | 0.956 | 0.964 | 0.96 |
| Accuracy | 0.922 | 0.922 | 0.922 |
| Macro Average | 0.844 | 0.865 | 0.849 |
| Weighted Average | 0.926 | 0.922 | 0.923 |
5.2 Framing and Selection Analysis
In this section we present a brief exploration of how the methods outlined in this paper can be used to study editorial choices. To do this, we use our best model to predict all frame components for the full dataset of 199,066 articles. We then use these frames to show how economic messaging shifts in response to exogenous shocks and changes in the balance of political power. In particular, we show how our framework can help us understand how the different choices these major publications make can produce significantly different views of economic conditions.
Article-level framing with macro-indicators
Because we have greater confidence in our model’s quantity-level performance, we generate article-level frames for specific economic indicators using our quantity-level predictions. First, we select the subset of articles that include at least two quantities in the category of interest. Then, we assign a positive indicator frame to articles with at least twice as many quantities with a positive polarity than negative polarity and vice versa for negative frames. Articles that meet neither threshold are assigned a "neutral" frame.
Shifts in Framing
Our preliminary evidence suggests that the framing of articles on any given topic by any given publication is both sensitive to exogenous factors as well as decisions made by the publication itself. Fig. ∥ ‣ 4 illustrates how the New York Times (NYT) framed their articles in regard to jobs data from 2015 to 2023. First, we can see that prior to 2020, during a period of stable job growth, the NYT already had a sustained negative valance, matching the key findings in recent literature on the general negativity bias on the Mainstream Media van Binsbergen et al. (2024). In response to the onset of COVID in 2020, the NYT intensified its coverage of the job market in response to a dramatic surge in unemployment caused by a cascade of lockdowns. We can also see that much of this coverage carried an extreme negative valence, which matches the large drop in jobs and subsequent uncertainty.
As the job market recovered and the labor market entered an extended period of exceptionally high growth, the volume of reporting in the NYT decreased back to its pre-pandemic levels, but the negativity persisted. This was not the same for other publications such as the Wall Street Journal, whose coverage more closely resembles the shifts in valence in the supporting data (See App. A.10.)


Indicator Selection
Fig. 5 shows us another lever that publications can pull when shaping their coverage: indicator selection. As inflation began to rise, we can see that all three publications responded by increasing their coverage of prices through a greater use of price based indicators.******This includes energy (e.g. oil) prices. These three publications did not, however, respond in an identical manner, with, for example, the New York Times increasing their coverage of prices far after the other publications returned to pre-crisis levels of coverage.
With the simple analysis shown in these two figures, we can begin to show that editors have considerable leeway when choosing what indicator to cover at any given time, and how to cover it. While we kept the analysis brief due to space considerations, we were able to show the usability of our framework to track a diverse set of indicators reported in different publishers across time.
6 Applicability to Other Domains
We emphasize that the main contribution of this paper is not centered around performance gains of our relational model over the baseline models, but rather the operationalization of a challenging task: analyzing framing at a scale for domains with supporting numerical data, such as the economy. While our solution does not apply to all framing scenarios, it applies to a substantial number. For example, we envision this framework being useful for analyzing news about crime (by tracking data points maintained by the FBI and local jurisdictions), climate change (by tracking weather statistics, global avg. temperature, emissions statistics, etc.) and public-opinion (by tracking polling numbers, political betting market numbers, etc.).
7 Conclusion and Future Work
In this paper, we presented a novel framework for modeling framing in news articles in the presence of supporting data. We focused our analysis on news about the U.S. economy, and proposed an annotation schema to identify framing at three levels of abstraction: the general framing of the economic conditions, the economic indicators that are highlighted, and the framing of each of those indicators.
We showed that we can predict the components of our schema with relatively good performance, even in very low supervision settings. Finally, we demonstrated how our framework can be used to perform a large scale exploration of the frame choices for a given economic indicator.
In our analysis, we showed that different publications cover economics using different indicators, for example the NYT covers jobs numbers less than normal during a strong jobs recovery, instead switching to more coverage rising prices. And, while all three publications responded to rising inflation, they each used price numbers differently when covering the economy, with the NYT employing price numbers more frequently than the Washington Post, or the Wall Street Journal.
Going forward, we have two main points of focus. First, we are working on expanding our schema to capture a larger set of economic aspects. While we focused our analysis on macro-economic indicators, there are other indicators that we could track to get a more holistic view of the economy. For example, for governmental indicators, we could track types of expenditures (e.g. social security), revenue (e.g. taxes), as well as debt and deficit. Additionally, we want to perform a large-scale analysis of economic news framing. In this paper, we presented a brief demonstration of how our framework can be used to analyze shifts in framing across time for different publications. Next, we want to perform a similar analysis for a larger set of economic indicators and publications. We note that to perform such an analysis we must scale up our annotations and improve our model predictions.
8 Limitations
The work presented in this paper has two main limitations:
(1) Obtaining high-quality annotations for our frame structure is very expensive and time consuming. For this reason, we worked with a low amount of supervision. While we showed that we could obtain relatively good performance in this constrained scenario, to be able to use our framework for a large scale, holistic analysis, we need to address this issue. This is particularly important given that our annotations are considerably skewed. For example, we have significantly more supervision for job numbers and market numbers (which occur more often) than we do for energy prices (which occur less often). This considerably affects our performance for more long-tail indicators, and hence limits the types of analysis that we can perform. Our current efforts are dedicated to increase the amount of annotations for all components of our frame structure, as well as incorporating alternative semi-supervised strategies. We are hoping to release an extended version of the annotated dataset to the community in the near future.
(2) The fact that we are using automated techniques for frame prediction necessarily carries some uncertainty. Even if we improve our models considerably, our large scale analysis will have a margin of error. It is important to acknowledge this when presenting our findings.
9 Ethical Considerations
To the best of our knowledge, no code of ethics was violated during the development of this project. We used publicly available tools to collect our dataset, and discarded any instances that were unreachable. The annotators were paid $15 per hour, and no personally identifiable information was collected or recorded during annotation.
We performed a thorough evaluation of our dataset, which is presented in the paper. We reported all pre-processing steps, learning configurations, hyperparameters, and additional technical details. Due to space constraints, some of this information was relegated to the Appendix. Further, the data and code have been released to the community. The results reported in this paper support our claims and we believe that they are reproducible.
10 Acknowledgements
This work utilized the Alpine high-performance computing resource, the Blanca condo computing resource, and the CUmulus on-premise cloud service at the University of Colorado Boulder. Alpine is jointly funded by the University of Colorado Boulder, the University of Colorado Anschutz, Colorado State University, and the NSF (award 2201538). Blanca is jointly funded by computing users and the University of Colorado Boulder. CUmulus is jointly funded by the National Science Foundation (award OAC-1925766) and the University of Colorado Boulder.
References
- Ali and Hassan (2022) Mohammad Ali and Naeemul Hassan. 2022. A survey of computational framing analysis approaches. In Proceedings of the 2022 Conference on Empirical Methods in Natural Language Processing, pages 9335–9348, Abu Dhabi, United Arab Emirates. Association for Computational Linguistics.
- Archive (1996-2023) Internet Archive. 1996-2023. The wayback machine. Accessed Continuously from January 2022.
- Ardia et al. (2019) David Ardia, Keven Bluteau, and Kris Boudt. 2019. Questioning the news about economic growth: Sparse forecasting using thousands of news-based sentiment values. International Journal of Forecasting, 35(4):1370–1386.
- Bach et al. (2017) Stephen H. Bach, Matthias Broecheler, Bert Huang, and Lise Getoor. 2017. Hinge-loss markov random fields and probabilistic soft logic. J. Mach. Learn. Res., 18(1):3846–3912.
- Barbaresi (2021) Adrien Barbaresi. 2021. Trafilatura: A web scraping library and command-line tool for text discovery and extraction. In Proceedings of the 59th Annual Meeting of the Association for Computational Linguistics and the 11th International Joint Conference on Natural Language Processing: System Demonstrations, pages 122–131, Online. Association for Computational Linguistics.
- Boydstun et al. (2014) Amber E. Boydstun, Dallas Card, Justin Gross, Paul Resnick, and Noah A. Smith. 2014. Tracking the Development of Media Frames within and across Policy Issues.
- Bybee (2023) J Leland Bybee. 2023. The ghost in the machine: Generating beliefs with large language models. Technical report, Working Paper.
- Cacciatore et al. (2015) Michael Cacciatore, Dietram Scheufele, and Shanto Iyengar. 2015. The end of framing as we know it … and the future of media effects. Mass Communication & Society, 19.
- Card et al. (2015) Dallas Card, Amber E. Boydstun, Justin H. Gross, Philip Resnik, and Noah A. Smith. 2015. The media frames corpus: Annotations of frames across issues. In Proceedings of the 53rd Annual Meeting of the Association for Computational Linguistics and the 7th International Joint Conference on Natural Language Processing (Volume 2: Short Papers), pages 438–444, Beijing, China. Association for Computational Linguistics.
- Deng and Wiebe (2015) Lingjia Deng and Janyce Wiebe. 2015. Joint prediction for entity/event-level sentiment analysis using probabilistic soft logic models. In Proceedings of the 2015 Conference on Empirical Methods in Natural Language Processing, pages 179–189, Lisbon, Portugal. Association for Computational Linguistics.
- Devlin et al. (2019) Jacob Devlin, Ming-Wei Chang, Kenton Lee, and Kristina Toutanova. 2019. BERT: Pre-training of deep bidirectional transformers for language understanding. In Proceedings of the 2019 Conference of the North American Chapter of the Association for Computational Linguistics: Human Language Technologies, Volume 1 (Long and Short Papers), pages 4171–4186, Minneapolis, Minnesota. Association for Computational Linguistics.
- DiMaggio et al. (2013) Paul DiMaggio, Manish Nag, and David Blei. 2013. Exploiting affinities between topic modeling and the sociological perspective on culture: Application to newspaper coverage of u.s. government arts funding. Poetics, 41:570–606.
- Druckman and Parkin (2005) James N. Druckman and Michael Parkin. 2005. The impact of media bias: How editorial slant affects voters. Journal of Politics, 67(4):1030–1049.
- Entman (2007) Robert Entman. 2007. Framing bias: Media in the distribution of power. Journal of Communication, 57:163 – 173.
- Field et al. (2018) Anjalie Field, Doron Kliger, Shuly Wintner, Jennifer Pan, Dan Jurafsky, and Yulia Tsvetkov. 2018. Framing and agenda-setting in Russian news: a computational analysis of intricate political strategies. In Proceedings of the 2018 Conference on Empirical Methods in Natural Language Processing, pages 3570–3580, Brussels, Belgium. Association for Computational Linguistics.
- Galtung and Ruge (1965) Johan Galtung and Mari Holmboe Ruge. 1965. The structure of foreign news: The presentation of the congo, cuba and cyprus crises in four norwegian newspapers. Journal of Peace Research, 2(1):64–90.
- Gerber et al. (2009) Alan S. Gerber, Dean Karlan, and Daniel Bergan. 2009. Does the media matter? a field experiment measuring the effect of newspapers on voting behavior and political opinions. American Economic Journal: Applied Economics, 1(2):35–52.
- Gilardi et al. (2021) Fabrizio Gilardi, Charles R. Shipan, and Bruno Wüest. 2021. Policy diffusion: The issue-definition stage. American Journal of Political Science, 65(1):21–35.
- Guo et al. (2023) Lei Guo, Chris Chao Su, and Hsuan-Ting Chen. 2023. Do news frames really have some influence in the real world? a computational analysis of cumulative framing effects on emotions and opinions about immigration. The International Journal of Press/Politics, 0(0):19401612231204535.
- Gururangan et al. (2020) Suchin Gururangan, Ana Marasović, Swabha Swayamdipta, Kyle Lo, Iz Beltagy, Doug Downey, and Noah A. Smith. 2020. Don’t stop pretraining: Adapt language models to domains and tasks. In Proceedings of the 58th Annual Meeting of the Association for Computational Linguistics, pages 8342–8360, Online. Association for Computational Linguistics.
- Hallahan (1999) Kirk Hallahan. 1999. Seven models of framing: Implications for public relations. Journal of Public Relations Research, 11(3):205–242.
- Harcup T and O’Neill D (2001) Harcup T and O’Neill D. 2001. What Is News? Galtung and Ruge revisited. Journalism Studies, 2:261–280. Accessed on 2023/12/15.
- Harcup T and O’Neill D (2017) Harcup T and O’Neill D. 2017. What is news? News values revisited (again). Journalism Studies, 18:1470–1488. Accessed on 2023/12/15.
- Hopkins et al. (2017) Daniel J Hopkins, Eunji Kim, and Soojong Kim. 2017. Does newspaper coverage influence or reflect public perceptions of the economy? Research & Politics, 4(4):2053168017737900.
- Huguet Cabot et al. (2020) Pere-Lluís Huguet Cabot, Verna Dankers, David Abadi, Agneta Fischer, and Ekaterina Shutova. 2020. The Pragmatics behind Politics: Modelling Metaphor, Framing and Emotion in Political Discourse. In Findings of the Association for Computational Linguistics: EMNLP 2020, pages 4479–4488, Online. Association for Computational Linguistics.
- Hummel and Rothschild (2014) Patrick Hummel and David Rothschild. 2014. Fundamental models for forecasting elections at the state level. Electoral Studies, 35:123–139.
- Johnson et al. (2017) Kristen Johnson, Di Jin, and Dan Goldwasser. 2017. Leveraging behavioral and social information for weakly supervised collective classification of political discourse on Twitter. In Proceedings of the 55th Annual Meeting of the Association for Computational Linguistics (Volume 1: Long Papers), pages 741–752, Vancouver, Canada. Association for Computational Linguistics.
- Khanehzar et al. (2019) Shima Khanehzar, Andrew Turpin, and Gosia Mikolajczak. 2019. Modeling political framing across policy issues and contexts. In Proceedings of the The 17th Annual Workshop of the Australasian Language Technology Association, pages 61–66, Sydney, Australia. Australasian Language Technology Association.
- Krupenkin et al. (2020) Masha Krupenkin, Shawndra Hill, and David Rothschild. 2020. Beyond agenda setting: Does media coverage of immigration lead to anti-immigrant behavior.
- Krupenkin et al. (2023) Masha Krupenkin, Elad Yom-Tov, and David Rothschild. 2023. Fear and loathing in st. louis: Gun purchase behavior as backlash to black lives matter protests.
- Kwak et al. (2020) Haewoon Kwak, Jisun An, and Yong-Yeol Ahn. 2020. A systematic media frame analysis of 1.5 million new york times articles from 2000 to 2017. In 12th ACM Conference on Web Science, WebSci ’20, page 305–314, New York, NY, USA. Association for Computing Machinery.
- McQuail (1992) D. McQuail. 1992. Media Performance: Mass Communication and the Public Interest. Sage Publications (CA).
- Mendelsohn et al. (2021) Julia Mendelsohn, Ceren Budak, and David Jurgens. 2021. Modeling framing in immigration discourse on social media. In Proceedings of the 2021 Conference of the North American Chapter of the Association for Computational Linguistics: Human Language Technologies, pages 2219–2263, Online. Association for Computational Linguistics.
- Nguyen et al. (2015) Viet-An Nguyen, Jordan Boyd-Graber, Philip Resnik, and Kristina Miler. 2015. Tea party in the house: A hierarchical ideal point topic model and its application to republican legislators in the 112th congress. In Proceedings of the 53rd Annual Meeting of the Association for Computational Linguistics and the 7th International Joint Conference on Natural Language Processing (Volume 1: Long Papers), pages 1438–1448, Beijing, China. Association for Computational Linguistics.
- Pacheco and Goldwasser (2021) Maria Leonor Pacheco and Dan Goldwasser. 2021. Modeling content and context with deep relational learning. Transactions of the Association for Computational Linguistics, 9:100–119.
- Pacheco et al. (2022a) Maria Leonor Pacheco, Tunazzina Islam, Monal Mahajan, Andrey Shor, Ming Yin, Lyle Ungar, and Dan Goldwasser. 2022a. A holistic framework for analyzing the COVID-19 vaccine debate. In Proceedings of the 2022 Conference of the North American Chapter of the Association for Computational Linguistics: Human Language Technologies, pages 5821–5839, Seattle, United States. Association for Computational Linguistics.
- Pacheco et al. (2022b) Maria Leonor Pacheco, Tunazzina Islam, Lyle Ungar, Ming Yin, and Dan Goldwasser. 2022b. Interactively uncovering latent arguments in social media platforms: A case study on the covid-19 vaccine debate. In Proceedings of the Fourth Workshop on Data Science with Human-in-the-Loop (Language Advances), pages 94–111, Abu Dhabi, United Arab Emirates (Hybrid). Association for Computational Linguistics.
- Pacheco et al. (2023) Maria Leonor Pacheco, Tunazzina Islam, Lyle Ungar, Ming Yin, and Dan Goldwasser. 2023. Interactive concept learning for uncovering latent themes in large text collections. In Findings of the Association for Computational Linguistics: ACL 2023, pages 5059–5080, Toronto, Canada. Association for Computational Linguistics.
- Raffel et al. (2020) Colin Raffel, Noam Shazeer, Adam Roberts, Katherine Lee, Sharan Narang, Michael Matena, Yanqi Zhou, Wei Li, and Peter J. Liu. 2020. Exploring the limits of transfer learning with a unified text-to-text transformer. J. Mach. Learn. Res., 21(1).
- Readability (2023a) Readability. 2023a. Readabilipy. The Alan Turing Institute.
- Readability (2023b) Readability. 2023b. Readabilityj̇s. Mozilla.
- Richardson and Domingos (2006) Matthew Richardson and Pedro Domingos. 2006. Markov logic networks. Machine Learning, 62(1-2):107–136.
- Rothschild et al. (2023) David M. Rothschild, Elliot Pickens, Gideon Heltzer, Jenny Wang, and Duncan J. Watts. 2023. Warped front pages.
- Roy and Goldwasser (2020) Shamik Roy and Dan Goldwasser. 2020. Weakly supervised learning of nuanced frames for analyzing polarization in news media. In Proceedings of the 2020 Conference on Empirical Methods in Natural Language Processing (EMNLP), pages 7698–7716, Online. Association for Computational Linguistics.
- Roy et al. (2021) Shamik Roy, Maria Leonor Pacheco, and Dan Goldwasser. 2021. Identifying morality frames in political tweets using relational learning. In Proceedings of the 2021 Conference on Empirical Methods in Natural Language Processing, pages 9939–9958, Online and Punta Cana, Dominican Republic. Association for Computational Linguistics.
- Seki et al. (2022) Kazuhiro Seki, Yusuke Ikuta, and Yoichi Matsubayashi. 2022. News-based business sentiment and its properties as an economic index. Information Processing & Management, 59(2):102795.
- Shapiro et al. (2022) Adam Hale Shapiro, Moritz Sudhof, and Daniel J Wilson. 2022. Measuring news sentiment. Journal of econometrics, 228(2):221–243.
- Sridhar et al. (2015) Dhanya Sridhar, James Foulds, Bert Huang, Lise Getoor, and Marilyn Walker. 2015. Joint models of disagreement and stance in online debate. In Proceedings of the 53rd Annual Meeting of the Association for Computational Linguistics and the 7th International Joint Conference on Natural Language Processing (Volume 1: Long Papers), pages 116–125, Beijing, China. Association for Computational Linguistics.
- Vallejo et al. (2023) Gisela Vallejo, Timothy Baldwin, and Lea Frermann. 2023. Connecting the dots in news analysis: A cross-disciplinary survey of media bias and framing.
- van Binsbergen et al. (2024) Jules H van Binsbergen, Svetlana Bryzgalova, Mayukh Mukhopadhyay, and Varun Sharma. 2024. (almost) 200 years of news-based economic sentiment. Working Paper 32026, National Bureau of Economic Research.
Appendix A Appendix
A.1 Additional Data Collection Details
For each of our included publishers’ landing pages, we retrieved a list of each Wayback Machine entry from Jan. 1st 2015 to Jan. 1st 2023, segmented the list of entries by the hour, and downloaded the earliest available document in that hour. Each of these documents is considered “front page”.
We used a heuristic based on the Document Object Model tree structure to remove opinion pieces, identify news articles, and establish an apparent ranking of those articles based on rendered size and distance from the upper-left hand corner of the viewport. This was calculated as a proxy for the order in which a reader sees the headlines.
Each article is assumed to have one and only one hypertext reference (href) across time, which points to a URL for the article’s HTML document. We recorded the front page document’s scrape timestamp, and each article’s href and apparent rank. For each unique article-timestamp tuple, we retrieved the linked document from the Wayback Machine. The timestamp is unlikely to match exactly, so we retrieved the nearest available entry. We extracted plain text versions of the article document whenever it was available, using Trafilatura Barbaresi (2021), and Readability Readability (2023b, a). These are both software packages designed to extract only the text from an HTML document. Trafilatura is built with natural language processing techniques in mind, whereas Readability is designed for naturalistic interfaces, specifically the "reader" view in Mozilla Firefox.
In some cases, the main body of the article could not be extracted either because the link no longer exists, or because the content is behind a paywall. We removed all such instances. We discarded all duplicates, keeping only the first appearance of each article. Fig. 6 shows the number of articles that were discarded due to either repetition or access issues. The number of discarded articles is quite large, but given that our dataset is based on hourly snapshots for the archive, this is to be expected. We aimed to over collect during the early collection steps to maximize the completeness of our final dataset.

bond*, budget, business, consumer, consumer price index, cost, cpi, currency debt, deficit, demand, dow jones, earning*, econo*, employ*, expenditure*, export*, fed, financ*, fiscal, gdp, gross domestic product, housing, import*, income, ipi, ipp, industrial production index, inflation, interest, invest*, international price program, job*, labor, market, monet*, mortgage, nasdaq, poverty, ppi, price*, productivity, producer price index, retail, revenue, s&p 500, sales, securities, small cap 2000, stimulus, stock, supply, tax, trade, trading, treasur*, unemploy*, wage*, wti, west texas intermediate
We stored the document’s title as extracted by readability and regarded it as the article’s headline. In some cases, there were errors when extracting headlines. To deal with these cases, we used T5 Raffel et al. (2020), a generative language model, to generate headlines using the body of the article. To do this, we used a model that was trained on 500,000 articles with their headlines ††††††huggingface.co/Michau/t5-base-en-generate-headline.
To identify the subset of articles that discuss the economy, we curated a lexicon of economic terms, shown in Table 7. We sourced these terms from the Bureau of Labor Statistics and the FRED database operated by the Federal Reserve bank of St. Louis.‡‡‡‡‡‡https://www.bls.gov/data/******https://fred.stlouisfed.org/ These sources provide a fairly comprehensive list of common metrics of economic activity.
We consider an article to be relevant to the economy if it contains at least three sentences mentioning any economic term from our lexicon. This resulted in a total of 199,066 articles (See Table 1). Fig. 7 shows the number of valid, unique articles extracted per source, as well as the resulting number of economic articles.

A.2 Codebook Development
The codebook (included in Appendix A.3) was developed by the two senior authors of the paper, one economist and one NLP/CSS expert.
Codifying indicators
We had an initial hypothesis that the reporting of economic indicators was prevalent in economic news, so we performed a few rounds of manual analysis using standard qualitative practices to establish the relevance of this information in our large unlabeled dataset. During this process, we realized that there were many relevant mentions to indicators that were not macro-economic, and we introduced the “type” category to differentiate between them (e.g., personal, industry, government). We created the initial lists of subcategories based on standard reported indicators, and refined them after a few rounds of annotation, taking annotator feedback into account.
Codifying article-level categories
We inherited the type category from the indicators to codify the “prevalent” or “dominant” type of information that the article discussed. For the economic conditions and direction, we took the Gallup economic index questions*†*†*†https://news.gallup.com/poll/1609/consumer-views-economy.aspx, and re-worded them to reflect the fact that coders were reading an article from sometime in the last 8 years. Finally, we refined them after a few rounds of annotation, taking annotator feedback into account.
A.3 Annotation Guidelines
In the following sections we replicate the codebook provided to the coders. This codebook was used during training, and as a reference for the coders to use as needed.
A.3.1 Setup and Goals
We have a large set of news articles about general economic topics. The goal is to:
-
1.
Identify if the article makes reference to macroeconomic conditions in the US. If it does then, answer the following questions:
-
•
How does this article rate economic conditions in the US today – (Good; Poor; No Opinion)
-
•
Does this article state/imply that economic conditions in the US as a whole are…? (Getting better; Getting worse; Same; No Opinion)
-
•
-
2.
If it does not, we would like to identify what the article covers: industry-specific economic information, firm-specific economic information, government-specific or political information, or personal stories.
-
3.
In a given article, we want to look at quantities and figures being reported and identify the type of figure (i.e. macro-economic, industry-specific, firm-specific, personal story), and in case of a macroeconomic, industry or government figure, identify the specific sub-type/indicator being discussed.
A.3.2 Guidelines
To annotate specific ARTICLES we will:
-
1.
Click “Edit Article”
-
2.
Annotate key quantities (first 5 relevant quantities in an article + 2 scattered throughout the article, if present):
-
•
Each quantity identified will be highlighted in yellow and clickable
-
•
If the quantity is a date or otherwise not relevant, skip it
-
•
If the quantity is relevant, click it and follow the instructions (code-book will be outlined below)
-
•
Data points may not fit into one of the groups. These should be labeled "Other" and a short comment should be left to explain it
-
•
Annotate general information: Answer the general article questions (detailed code-book below)
-
•
A.3.3 Codebook
-
1.
Macro-economic
-
•
Macro-economic indicators aggregate data according to a set of demographics.
-
•
Data Guide
-
–
For the purpose of this study, these will mostly be values that are aggregated up to a national level (e.g. national GDP). There may be, however, other demographic groups, like states, that fall into this category
-
–
-
•
Types of macro-indicators:
-
–
Jobs Numbers (Jobs, Unemployment)
-
–
Market Numbers (any financial market)
-
–
Housing (Start, Sales, Pricing)
-
–
Macro Economy (GDP, etc.)
-
–
Wages
-
–
Prices (CPI, PPI)
-
–
Confidence
-
–
Retail Sales
-
–
Interest Rates (Fed., Mortgage)
-
–
Currency Values
-
–
Energy Prices (Gas, Oil, etc.)
-
–
Other (Specify)
-
–
-
•
-
2.
Firm-Specific
-
•
A firm-specific data point is a data point associated with a particular firm or company.
-
•
Data Guide:
-
–
Examples include: stock prices, debt offerings, and capital investments
-
–
-
•
-
3.
Industry-Specific
-
•
Industry level articles/quantities describe an entire industry rather than individual businesses
-
•
Data Guide:
-
–
Examples include: Chip Manufacturers Post Strong Growth Numbers
-
–
-
•
Types of Industries:
-
–
Agriculture, forestry and hunting
-
–
Mining
-
–
Utilities
-
–
Construction
-
–
Manufacturing
-
–
Wholesale trade - selling products in bulk to other businesses
-
–
Retail trade - selling products directly to the end consumer
-
–
Transportation and warehousing
-
–
Information
-
–
Finance, insurance, real estate, rental and leasing
-
–
Professional and business services
-
–
Educational services, health care, and social assistance
-
–
Arts, entertainment, recreation, accommodation and food services
-
–
Other (Except government)
-
–
-
•
-
4.
Government Revenue and Expenditures
-
•
Any value that describes how a government earned or spent its income falls into this category.
-
•
Data Guide:
-
–
A few examples are: taxes, budgets, and treasury issuances
-
–
-
•
Government Level:
-
–
Federal
-
–
State and local
-
–
-
•
Types of Expenditures
-
–
Social Security and Public Welfare
-
–
Health and Hospitals
-
–
National Defense
-
–
Police
-
–
Transportation
-
–
Research
-
–
Education
-
–
Employment
-
–
Housing
-
–
Corrections
-
–
Courts
-
–
Net Interest
-
–
Other
-
–
-
•
Types of Revenue
-
–
Taxes and other compulsory transfers imposed by government units Property income derived from the ownership of assets
-
–
Sales of goods and services
-
–
Voluntary transfers received from other units
-
–
-
•
-
5.
Personal
-
•
If an article/quantity focuses on the economic condition of a single person, or a group of individuals that is not large enough to represent an entire demographic then we consider it personal. E.g. an individual’s struggle to find work, or the grocery/gas budget of a single family
-
•
Data Guide:
-
–
E.g. household expenditures, personal debts
-
–
-
•
A short comment should be added to explain the frame/quantity
-
•
A.3.4 Additional Notes
Data Points:
-
•
Each candidate data point is highlighted and clickable
-
•
Each data point has a general type:
-
–
Macro-economic:
-
–
Firm-specific
-
–
Industry-specific
-
–
Government revenue and expenditures
-
–
Personal
-
–
General Frame:
-
•
While an article can reference different data points, the goal is to identify the dominant frame
-
•
An article can have only one dominant frame
-
–
Macro-economic
-
–
Firm-specific
-
–
Industry-specific
-
–
Government revenue and expenditures
-
–
Personal
-
–
Other
-
–
-
•
An article may frame the economy in a certain light – if its dominant frame is Macro-economic, it will be tied to the following two questions:
-
–
How does this article rate economic conditions in the US – (Excellent; Good; Only Fair; Poor; No Opinion; Not relevant to the US economy)
-
–
Does this article state/imply that economic conditions in the US as a whole are…? {Getting better; Getting worse; Same; No Opinion; Not relevant to the US economy}
-
–
-
•
A comment should be added to explain rationale for choosing the frame class / economic outlook
A.4 Cross-Annotation Statistics
Below in Table 8 we present the statistics for the number of people who cross-annotated each of the label categories.
| Instances annotated by 2, 3 and 4+ annotators | |||
|---|---|---|---|
| Annotation | 2 Annotators | 3 Annotators | 4+ Annotators |
| Article Type | 17.19% | 49.22% | 33.59% |
| Econ. Conditions | 49.22% | 55.13% | 17.95% |
| Econ. Direction | 26.92% | 55.13% | 17.95% |
| Quantity Type | 55.59% | 35.85% | 8.56% |
| Macro Ind. | 51.6% | 41.44% | 0.36% |
| Quantity Polarity | 78.46% | 21.18% | 6.95% |
A.5 Annotation Confusion Matrices
To further characterize agreement values and types of disagreements for all annotations, we provide a set of confusion matrices below. We also provide specific examples of ambiguous cases.
We see in Fig. 8 that in general, there is some confusion between macro and government types. This type of disagreement was seen with The New York Times article entitled “Short Term’ Health Insurance? Up to 3 Years Under New Trump Policy”, which was classified with an article type macro and government by different annotators. The article focuses heavily on the policies of the Trump administration, which falls under government. However, it also makes strong arguments regarding rising prices, which falls under macro.

In general, we see in Fig. 9 there is strong agreement when the article is negative towards the economy. However, annotators struggle more to differentiate positive articles. One example of this type of disagreement is The Wall Street Journal article entitled “Fed Faces Mixed Signals as Hiring Cooled in August", which was classified as framing economic conditions as both good and poor by different annotators. We can observe that even the title of this article is inherently ambiguous, containing "mixed signals".

We see in Fig. 10 that there is strong agreement when an article is positive or negative towards the future of the economy. However, there is more confusion w.r.t. the same category. One example of this is seen with the Huffington Post article “The Secret IRS Files: Trove Of Never-Before-Seen Records Reveal How The Wealthiest Avoid Income Tax”, which was classified as framing economic direction as both worse and same. The article mentions rising wealth inequality (which could align with worse) but that does not really center the topic or talk explicitly about any forecast (which could align with same).

In Fig. 11 we observe a significant number of disagreements between industry and macro values for Quantity Type annotations. One example is seen in the excerpt: "Daily Business Briefing Oil prices approached $100 a barrel on Tuesday, the highest in more than seven years…" where the focus is on annotating the "$100 a barrel" indicator. We acknowledge that oil prices are an industry-specific topic but also have an effect on the macro economy. As a result, this case is ambiguous.

In Fig. 12 we see that annotators have difficulty discerning between prices and macro indicators. One ambiguous case is the excerpt: "But he said that declines in goods prices and rents, which have contributed notably to inflation over the last 18 months, might be insufficient if firms don’t slow their hiring. ’The labor market … shows only tentative signs of rebalancing, and wage growth remains well above levels that would be consistent with 2% inflation,’ Mr. Powell said." where the indicator in question is "with 2% inflation". While the indicator is discussing inflation–which is a macro topic–it is also strongly related to prices.

In Fig. 13 we see a high volume of disagreement between the pos and neutral labels. This type of disagreement was seen in the excerpt: "Economists expect applications for jobless benefits—seen as a proxy for layoffs—ticked down to 825,000 last week from 837,000 a week earlier. Weekly jobless claims are down sharply from a peak of nearly seven million in March but have clocked in at between 800,000 and 900,000 for more than a month. Claims remain above the pre-pandemic high of 695,000." where the indicator in question is "800,000". While the excerpt positively compares current joblessness positively to the previous week’s numbers, but negatively to pre-pandemic numbers, making the value difficult to annotate.

A.6 Additional Details for Experimental Setup
All experiments were run on a server with a single NVIDIA Tesla A100 GPU with 40 GB of RAM. In Table 9 we include the number of data points in each data split used for 5-fold cross-validation. All "Agreed" data points were cross-annotated by 2 or more people. Noisy data points include all annotations for labels which there was no inter-annotator agreement.
| Article Level | Quantity-level | |||||||||||
| Type | Condition | Direction | Type | Indicator | +/- | |||||||
| Fold | Agreed | Noisy | Agreed | Noisy | Agreed | Noisy | Agreed | Noisy | Agreed | Noisy | Agreed | Noisy |
| 0 | 22 | 58 | 15 | 68 | 15 | 74 | 110 | 683 | 56 | 384 | 78 | 789 |
| 1 | 25 | 58 | 17 | 68 | 17 | 74 | 133 | 704 | 108 | 341 | 85 | 773 |
| 2 | 22 | 58 | 11 | 68 | 10 | 74 | 124 | 707 | 50 | 378 | 77 | 783 |
| 3 | 20 | 58 | 11 | 68 | 10 | 74 | 108 | 636 | 65 | 343 | 82 | 744 |
| 4 | 22 | 58 | 12 | 68 | 12 | 74 | 137 | 693 | 66 | 337 | 105 | 771 |
Mistral baseline details
To further motivate our modeling choices, we present baseline results for zero and few-shot prompting instruction tuned model, Mistral-7B-Instruct-v0.2, to obtain labels for our dataset. Below we include samples of the zero-shot prompts used to obtain these results.
Example prompt for article-level type prediction
{‘role’: ‘user’, ‘content’: ‘You are a helpful annotation assistant. Your task is to answer a multiple choice question based on the below information from a U.S. news article about the economy:
So for instance the following:
excerpt: [article text]
multiple choice question: What is the main type of economic information covered in this article?
A. Firm-specific
B. Industry-specific
C. Macroeconomic / General Economic Conditions
D. Government revenue and expenses
E. None of the above
Please answer with a single letter without explanations. If you are unsure, please guess.’}
Example prompt for quantity-level type prediction
{‘role’: ‘user’,
‘content’: ‘You are a helpful annotation assistant. Your task is to answer a multiple choice question based on the below information from a U.S. news article about the economy.
So for instance the following:
excerpt: [indicator text]
context: [context text]
multiple choice question: The excerpt should contain an economic indicator value. Based on the context, what type of indicator is it?
A. Macroeconomic / General Economic Conditions
B. Industry-specific
C. Government revenue and expenses
D. Personal
E. Firm-specific
F. None of the above
Please answer with a single letter without explanations. If you are unsure, please guess.’}
The prompts were used for each sample in the test set of each fold. For two-shot prompting, two examples were randomly selected from the training set and enveloped into the prompt as shown below.
Example two-shot prompt for article-level type prediction
{‘role’: ‘user’, ‘content’: ‘You are a helpful annotation assistant. Your task is to answer a multiple choice question based on the below information from a U.S. news article about the economy:
So for instance the following:
excerpt: [example 1 article text]
multiple choice question: What is the main type of economic information covered in this article?
A. Firm-specific
B. Industry-specific
C. Macroeconomic / General Economic Conditions
D. Government revenue and expenses
E. None of the above
Please answer with a single letter without explanations. If you are unsure, please guess.’}
{‘role’: ‘assistant’, ‘content’: [example 1 gold label]’ }
{‘role’: ‘user’, ‘content’: ‘You are a helpful annotation assistant. Your task is to answer a multiple choice question based on the below information from a U.S. news article about the economy:
So for instance the following:
excerpt: [example 2 article text]
multiple choice question: What is the main type of economic information covered in this article?
A. Firm-specific
B. Industry-specific
C. Macroeconomic / General Economic Conditions
D. Government revenue and expenses
E. None of the above
Please answer with a single letter without explanations. If you are unsure, please guess.’}
{‘role’: ‘assistant’, ‘content’: [example 2 gold label]’ }
{‘role’: ‘user’, ‘content’: ‘You are a helpful annotation assistant. Your task is to answer a multiple choice question based on the below information from a U.S. news article about the economy:
excerpt: [article text]
multiple choice question: What is the main type of economic information covered in this article?
A. Firm-specific
B. Industry-specific
C. Macroeconomic / General Economic Conditions
D. Government revenue and expenses
E. None of the above
Please answer with a single letter without explanations. If you are unsure, please guess.’}
Example two-shot prompt for quantity-level type prediction
{‘role’: ‘user’,
‘content’: ‘You are a helpful annotation assistant. Your task is to answer a multiple choice question based on the below information from a U.S. news article about the economy.
So for instance the following:
excerpt: [example 1 indicator text]
context: [example 1 context text]
multiple choice question: The excerpt should contain an economic indicator value. Based on the context, what type of indicator is it?
A. Macroeconomic / General Economic Conditions
B. Industry-specific
C. Government revenue and expenses
D. Personal
E. Firm-specific
F. None of the above
Please answer with a single letter without explanations. If you are unsure, please guess.’}
{‘role’: ‘assistant’, ‘content’: [example 1 gold label]’ }
{‘role’: ‘user’,
‘content’: ‘You are a helpful annotation assistant. Your task is to answer a multiple choice question based on the below information from a U.S. news article about the economy.
So for instance the following:
excerpt: [example 2 indicator text]
context: [example 2 context text]
multiple choice question: The excerpt should contain an economic indicator value. Based on the context, what type of indicator is it?
A. Macroeconomic / General Economic Conditions
B. Industry-specific
C. Government revenue and expenses
D. Personal
E. Firm-specific
F. None of the above
Please answer with a single letter without explanations. If you are unsure, please guess.’}
{‘role’: ‘assistant’, ‘content’: [example 2 gold label]’ }
{‘role’: ‘user’,
‘content’: ‘You are a helpful annotation assistant. Your task is to answer a multiple choice question based on the below information from a U.S. news article about the economy.
excerpt: [indicator text]
context: [context text]
multiple choice question: The excerpt should contain an economic indicator value. Based on the context, what type of indicator is it?
A. Macroeconomic / General Economic Conditions
B. Industry-specific
C. Government revenue and expenses
D. Personal
E. Firm-specific
F. None of the above
Please answer with a single letter without explanations. If you are unsure, please guess.’}
Article-level RoBERTa base classifier architecture details
For article-level classifiers, we add a classifier on top of the CLS token. For quantity-level classifiers, we use the sentence containing the excerpt and the two surrounding sentences, to the left and right. We then concatenate the CLS embedding of this contextual information with the average embedding (final-layer) of all tokens within the excerpt containing the quantity before passing it to the classifier. All base classifiers are
Training Settings for RoBERTa base classifiers
The noisy data points were used to augment the training set when the corresponding "Agreed" split (see Table 9) was used for testing. To prevent data leakage, noisy quantitative annotations were removed from the set if their corresponding article was included in the test split. We experimented with both appending all noisy points to the training set and choosing one "best" annotation for each uniqe value (i.e. one annotation for Type was selected per article). We considered the best annotation the one contributed by the annotator with the highest agreement rate. We tested both settings using RoBERTa with and without DAPT. These results are shown in Table 10. The best-performing trained model (bolded) was used to generate priors for the relational model.
| Model | Article-level | Quantity-level | ||||
|---|---|---|---|---|---|---|
| Type | Cond | Dir | Type | Ind | ||
| Random | 0.136 | 0.148 | 0.19 | 0.111 | 0.064 | 0.324 |
| Majority Label | 0.237 | 0.269 | 0.252 | 0.193 | 0.08 | 0.382 |
| RoBERTa | 0.515 | 0.697 | 0.446 | 0.642 | 0.79 | 0.796 |
| RoBERTa + all noisy data | 0.411 | 0.618 | 0.493 | 0.639 | 0.793 | 0.796 |
| RoBERTa + best noisy data point | 0.425 | 0.479 | 0.321 | 0.685 | 0.824 | 0.788 |
| RoBERTa + DAPT | 0.382 | 0.636 | 0.47 | 0.697 | 0.769 | 0.776 |
| RoBERTa + DAPT + all noisy data | 0.474 | 0.574 | 0.475 | 0.722 | 0.817 | 0.803 |
| RoBERTa + DAPT + best noisy data point | 0.436 | 0.396 | 0.328 | 0.731 | 0.826 | 0.812 |
A.7 Additional Results for Frame Prediction
In Table 11, we include the weighted F1 results for our experiments.
| Model | Article-level | Quantity-level | ||||
|---|---|---|---|---|---|---|
| Type | Cond | Dir | Type | Ind | ||
| Random | 0.266 | 0.2 | 0.243 | 0.203 | 0.107 | 0.33 |
| Majority Label | 0.607 | 0.412 | 0.382 | 0.542 | 0.318 | 0.393 |
| Base Classifier | 0.792 | 0.732 | 0.596 | 0.925 | 0.916 | 0.81 |
| Base Classifier + DAPT | 0.785 | 0.675 | 0.563 | 0.938 | 0.913 | 0.815 |
| Relational (best) | 0.778 | 0.732 | 0.596 | 0.93 | 0.922 | 0.817 |
A.8 Addressing Concerns with Data Leakage and DAPT
We chose to include the annotated subset of data for DAPT because, while one may not have access to a labeled dataset, anyone utilizing the framework would have access to their full unlabelled dataset, and thus would be able to perform additional rounds of DAPT using self-supervised objectives.
However, to address any concerns with data leakage, we executed DAPT with all labelled articles removed from the training set. Specifically, any articles used at any point for fine-tuning the classifiers were omitted. We present results for all versions of the model which included DAPT with this checkpoint in Tab. 12. We find that there is no significant advantage to including labelled articles in the pre-training set.
| Model | Article-level | Quantity-level | ||||
|---|---|---|---|---|---|---|
| Type | Cond | Dir | Type | Ind | ||
| RoBERTa + DAPT | 0.382 | 0.636 | 0.47 | 0.697 | 0.769 | 0.776 |
| RoBERTa + DAPT (LAR) | 0.519 | 0.521 | 0.426 | 0.700 | 0.722 | 0.763 |
| RoBERTa + DAPT + all noisy data | 0.474 | 0.574 | 0.475 | 0.722 | 0.817 | 0.803 |
| RoBERTa + DAPT (LAR) + all noisy data | 0.465 | 0.562 | 0.429 | 0.698 | 0.787 | 0.776 |
| RoBERTa + DAPT + best noisy data point | 0.436 | 0.396 | 0.328 | 0.731 | 0.826 | 0.812 |
| RoBERTa + DAPT (LAR) + best noisy data point | 0.446 | 0.487 | 0.382 | 0.688 | 0.870 | 0.821 |
A.9 Error Analysis for Frame Prediction
In Tab. 5, we observe particular instability for predictions over articles from Fox News and the Wall Street Journal.
For Fox News articles, performance for article-level predictions are particularly low. We attribute this to the fact that there are only three training examples in the data. This prohibits the model from learning to make predictions for the slightly different writing style. Additionally, this means that the test set is very small and one incorrect prediction decreases the macro f1 score significantly. We note that the training example for which an incorrect article type was predicted, had a gold label of government but was predicted macro. This was also a common disagreement among annotators, as described in App. A.5, and therefore a more difficult problem.
Quantity-level polarity was also unstable for Fox News. There were only two training examples for polarity. For the single error, the model predicted neutral while the gold label was negative. This was also a common disagreement among annotators.
In spite of sufficient training examples, we achieve relatively low f1 scores on article-level predictions for documents from the Wall Street Journal. We believe that this may be attributed to the difference in format of these articles compared to those of other publishers. In Fig. 14, we observe that of the 18 training examples, 14 had macro gold labels. We believe that the class imbalance caused the model to associate the Wall Street Journal writing with a macro label only. This is supported by the fact that the model predicted that 17 of the 18 articles were of type macro.
Because the relational model predicts None for the other article-level annotation components when a label other than Macro is predicted for article type, this type of error contributes to the lower F1 scores for article-level condition and direction. We believe these errors can also be attributed to the somewhat dryer delivery of information in WSJ articles. Empirically, their articles tend to express less opinion when discussing the economy compared to other publishers in the corpus.

A.10 Additional Framing Analysis Graphs
In Section 5.2 we investigated how economic indicators are used by the New York Times, the Washington Post, and the Wall Street Journal. In addition to the figures shown in that section we generated a number of additional graphs that can be seen below. These graphs are meant to provide additional detail on how each publication is operating.

In Figure 15, we can see how the three publications choose to use jobs indicators in relation to the underlying jobs numbers. Notably, we can see that the New York Times and Wall Street Journal both exhibit similar changes in their use of job indicators in response to the change in underlying data. The Washington Post also has a notable change in behavior, but its response is less persistent than that of the other papers.

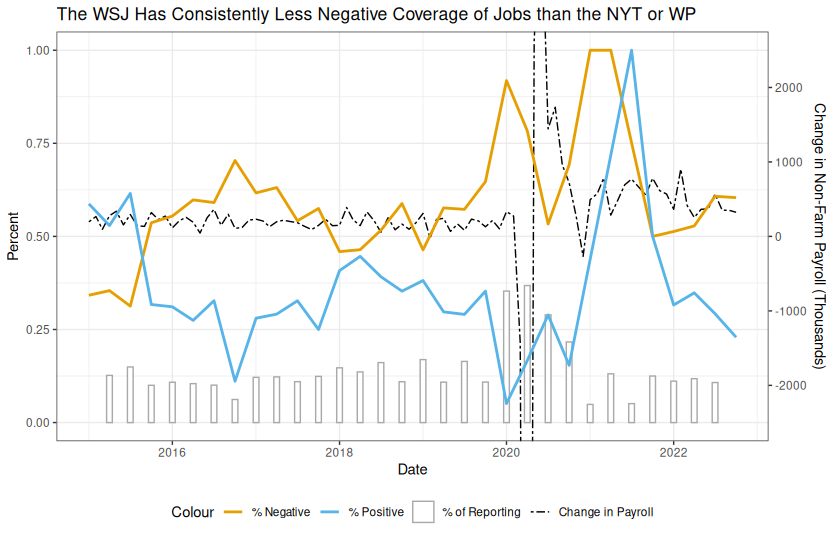
Figures 16, 17, and 18, show how the New York Times, the Washington Post and the Wall Street Journal use jobs indicators in their reporting.
While all three publications chose to promptly respond to the massive job loss caused by the pandemic, dramatically increasing their percent of coverage devoted to jobs, the Journal dipped back down quickly, the Post slowly dipped to their pre-pandemic norm, and the Times slowly fell below pre-pandemic norms (and as shown in Figure 5, the Times had a relatively higher surge in their coverage of prices in this post-pandemic era). Further, it is not just quantity, but the spin that makes the frame: the Journal has very malleable framing, with heavily positive coverage of jobs numbers as they soured in the early Biden administration, while the Times coverage continued to be heavily negative despite the historic run of jobs recovery.


Figures 19, 20, and 21, show how the New York Times, the Washington Post, and the Wall Street Journal use price (including energy price) indicators in their reporting. Once again, the New York Times and Washington Post display consistently negative framing of price indicators, while the Wall Street Journal has a more balanced framing of such indicators. It is interesting that the framing of price indicators in the New York Times and Washington Post seems almost static, with no obvious change following the rise in inflation. This differs from the shifts in framing we see in both papers in Figures 16 and 17.