ForMAX - a beamline for multiscale and multimodal structural characterization of hierarchical materials
Abstract
The ForMAX beamline at the MAX IV Laboratory provides multiscale and multimodal structural characterization of hierarchical materials in the nm to mm range by combining small- and wide-angle x-ray scattering with full-field microtomography. The modular design of the beamline is optimized for easy switching between different experimental modalities. The beamline has a special focus on the development of novel, fibrous materials from forest resources, but it is also well suited for studies within, e.g., food science and biomedical research.
I Introduction
Many natural and synthetic materials are hierarchical, exhibiting important structure at several different length scales that govern the material’s properties Lakes (1993); Fratzl and Weinkamer (2007); Gibson (2012). Wood is an archetypical example, with the assembly of the load-bearing cellulose at nano-, micro-, and macroscopic scales determining its mechanical properties. In order to understand the structure-function relationship in such materials, we need access to multiscale structural characterization. Moreover, we need sufficient temporal resolution to allow monitoring how the structure evolves in situ or in operando during external stimuli or processing of the material.
The ForMAX beamline of MAX IV addresses this need for structural characterization of hierarchical materials. A key feature is its modular design, that allows temporally resolved multiscale structural characterization of bulk materials owing to easy and fast switching between complementary experimental modalities: small- and wide-angle x-ray scattering (SWAXS) in the nm regime Glatter and Kratky (1982); Pauw (2013) and full-field synchrotron x-ray microtomography (SRCT) in the m to mm regime Maire and Withers (2014). Both of these techniques are applicable to a wide range of materials and suitable for temporally resolved experiments. We foresee that SWAXS will often be carried out in scanning imaging mode using a focused x-ray beam, either as SWAXS-based microscopy Lichtenegger et al. (1999); Bunk et al. (2009), tomography Feldkamp et al. (2009); Jensen et al. (2011), or tensor tomography Liebi et al. (2015); Schaff et al. (2015), covering seven orders of magnitude in length scales and hence being particularly useful for structural characterization of hierarchical materials.
ForMAX is externally funded, with the objective to support research on new materials from renewable forest resources. Its construction was funded by the Knut and Alice Wallenberg foundation (kaw.wallenberg.org), while the operation costs for ten years are covered by Swedish industry via Treesearch (www.treesearch.se) - a national research platform for the development of new materials and specialty chemicals from the forest. Access for both Treesearch members and general users is granted through common calls for proposals, with half of the user beam time reserved for academic and industrial members of Treesearch. For a brief background to ForMAX, see McEntee (2023).
In the following we outline the technical design of the beamline, data acquisition, and data processing, with a focus on the needs of the users. We conclude by providing a first benchmarking of the beamline and a few examples of multiscale and multimodal structural characterization available at ForMAX.
II Technical design
The combination of SWAXS and SRCT provides a number of technical challenges, in particular when applied in situ or in operando to fibrous materials such as wood-based materials:
-
•
In SRCT one monitors the attenuated beam directly downstream of the sample (i.e., in forward scattering direction), while in SAXS one collects scattering data further downstream at small angles. Since the SRCT full-field microscope blocks the view of the SAXS detector, we have devised a strategy for easy movement of the former in and out of the x-ray beam.
-
•
WAXS from fibrous materials exhibits anisotropy, reflecting the orientation of the crystalline fibers, fibrils, or filaments. When mapping out nanoscale orientation in such materials, one needs to be able to collect WAXS data in all directions of the scattering plane Lichtenegger et al. (1999). In order to facilitate scanning SWAXS imaging experiments on these materials, we have therefore chosen a custom WAXS detector with a hole in the center, that passes through the SAXS signal while simultaneously catching anisotropic WAXS data.
-
•
SWAXS is often carried out at moderate x-ray energies keV in order to reach small scattering vector moduli , while it is advantageous to carry out SRCT at higher x-ray energies ( keV) for enhanced phase contrast. As a compromise we operate ForMAX in the 8-25 keV energy range, which is particularly suitable for soft materials.
-
•
Whereas the small divergence of the x-ray beam at the MAX IV 3 GeV storage ring Tavares et al. (2018) is beneficial for SWAXS experiments, it limits the natural beam size at the sample position in full-field imaging. As a compromise, we have placed the sample relatively far downstream of the source (42 m from source), while still allowing a reasonable sample-to-detector distance for SAXS experiments. Moreover, we will install secondary beam-expanding optics in the experimental station to facilitate full-field imaging.
-
•
In order to obtain a clean x-ray beam for SAXS experiments, we need to reject higher harmonics of the monochromator by passing the beam via x-ray mirrors. In the full-field imaging mode, the slope errors of the mirrors cause parasitic striation of the x-ray beam. We mitigate the effect of striation by shape compensation of the mirrors.
-
•
Due to the high photon density at fourth generation sources like the MAX IV 3 GeV storage ring Tavares et al. (2018), radiation damage in organic samples is a major issue that we need to assess and mitigate case by case. This also holds true for full-field imaging, that has traditionally been less prone to beam-induced radiation damage due to a large beam size.
-
•
Finally, in order to accomodate various sample environments, such as a rheometer or a mechanical load device with controlled atmosphere, we need an experimental table that is spacious and has a relatively large load capacity.
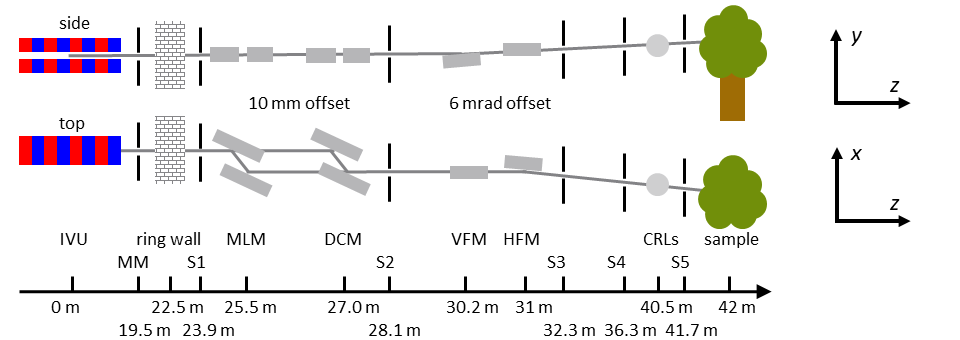
In Table 1 we summarize the main parameters of the MAX IV 3 GeV storage ring, while in Table 2 and Fig. 1 we present the main components of the ForMAX beamline.
Throughout this article, we employ MAX IV’s coordinate system: the lateral x axis with positive direction outbound from the ring, the vertical y axis with positive direction upwards, and the longitudinal z axis with positive direction downstream from the source. The positive direction of each rotation around the Cartesian axes (Rx, Ry, and Rz) is given by the right-hand rule.
II.1 Undulator and front end
ForMAX is equipped with a 3 m long room-temperature, in-vacuum undulator from Hitachi Metals. The maximum effective deflection parameter is at the minimum magnetic gap of 4.5 mm and the measured phase error is within specification for all operational gaps. In order to cover the energy range of 8-25 keV, we make use of the fifth to thirteenth harmonics of the undulator as shown in Fig. 2. Similar to other beamlines around the MAX IV 3 GeV storage ring Ursby et al. (2020); Johansson et al. (2021), the undulator exhibits narrow harmonic peaks, eV (full width at half maximum; FWHM). We summarize the main parameters of the undulator in Table 3.
The front end serves as the interface between the MAX IV 3 GeV storage ring and the ForMAX beamline and was provided by Toyama. It is part of personal and machine safety systems; it ensures safe access to the optical hutch and safe equipment operation. It includes safety and photon shutters, several fixed and movable masks, various diagnostics components including beam viewers, x-ray beam position monitors, thermocouples, and vacuum gauges, as well as vacuum valves to separate different vacuum sections and to safeguard the vacuum of the storage ring in case of vacuum loss in the beamline. The fixed masks remove a vast portion of the undulator radiation power, with the front end typically passing through W of radiation to the optics hutch at the projected 500 mA ring current. The movable mask, based on two L-shaped GLIDCOP slits with tantalum edges and located m downstream of the source, is used to define the angular acceptance of photon beam for the ForMAX beamline.
II.2 Primary optics
ForMAX’s primary optics consist of a double crystal monochromator provided by FMB Oxford, a double multilayer monochromator by Axilon, dynamically bendable vertical and horizontal focusing mirrors in Kirkpatrick-Baez geometry by IRELEC, a photon shutter by Axilon, and four diagnostics modules by FMB Oxford that host a fixed mask limiting the beamline’s acceptance angle to rad2 () and a high-band-pass diamond filter for heat-load management, a white-beam stop, bremsstrahlung collimators, slits, beam viewers, and beam intensity monitors. In the following we will briefly discuss the monochromators and mirrors.
II.2.1 Monochromators
Depending on the experimental needs, ForMAX can be operated using either a double crystal monochromator (DCM) or a double multilayer monochromator (MLM). In line with several other hard x-ray beamlines at MAX IV Ursby et al. (2020); Johansson et al. (2021); Kahnt et al. (2021), we have chosen a horizontal deflection geometry for both monochromators to maximize their stability. Owing to the relatively high x-ray energy at ForMAX, the energy-dependent polarization factor is and in the full energy range for the DCM and MLM, respectively. In order to facilitate switching between monochromators, both employ the same fixed-exit design with 10 mm inboard offset.
The horizontally deflecting Si(111) DCM is positioned 27 m from the source. We note that the small horizontal offset between the crystals allows for a compact and rigid design with excellent stability, as shown elsewhere Kristiansen et al. (2016). In ForMAX’s case, the 50 mm long upstream crystal is mounted directly on the Bragg goniometer (Ry) without any other motorized axes, while the 100 mm long downstream crystal has additional motorized adjustments for pitch Ry, roll Rz, and perpendicular motion. Moreover, the monochromator is equipped with motorized lateral x and vertical y translations. Both crystals are side cooled by clamping the crystals to liquid-nitrogen-cooled Cu blocks; the high heat load of the upstream crystal requires direct cooling of the Cu block, while indirect cooling of the Cu block by braids is sufficient to manage the lower heat load of the downstream crystal.
The horizontally deflecting MLM, in turn, is positioned 25 m from the source. While it is foreseen to be used almost exclusively for full-field imaging experiments requiring high temporal resolution, it may also find use in niche, photon-hungry scattering experiments. Both multilayer mirrors consists of flat, 180 mm long Si(100) substrates covered with separate stripes of 200 layers of W/B4C and 250 layers of Ru/B4C. Each multilayer stripe has a period of nm and nm B4C layer thickness, optimized for the energy range of the beamline. The bandpass of the MLM, by design, is larger than the width of an individual harmonic peak of the undulator. The Bragg rotation Ry of the monochromator, fine roll Rz of the upstream mirror, and fine pitch Ry of the downstream mirror are all realized by linear actuators and special flexure arrangements. Due to the large angular range of the monochromator, a longitudinal z translation of the downstream multilayer assembly is needed. Moreover, the motorized motions include the lateral x and vertical y translations of the monochromator as well as the perpendicular translation of the downstream multilayer assembly. Due to the significantly smaller Bragg angle compared to the DCM, and hence a larger x-ray beam footprint, it suffices to cool both multilayer mirrors indirectly by braids from water-cooled Galinstan baths.
II.2.2 Mirror system
The mirror system consists of vertically (VFM) and horizontally (HFM) focusing (and deflecting) mirrors in Kirkpatrick-Baez geometry, housed inside a single vacuum chamber. Each mirror has a 650 mm optical length and works at a fixed incidence angle of 3 mrad. The mirrors serve two main purposes. First, they provide harmonic rejection. In order to cover the wide energy range of the beamline, each mirror from Insync has three separate stripes of Si, Rh, and Pt. Second, each mirror can be independently bent to radii between and 100 km, allowing us to focus at the nominal sample position or any position downstream thereof, collimate the beam, or essentially operate without focusing. In practice, the mirror bending is achieved by applying two controlled bending moments (monitored by strain gauges) at the upstream and downstream ends of the mirror in a four-point bending configuration. Each mirror is equipped with a limited amount of stiff, motorized axes to maximize stability; lateral x and vertical y granite translation stages as well as pitch rotation (Rx for VFM, Ry for HFM) employing a high-resolution actuator and flexure parts. Moreover, the HFM is also equipped with a similar motorized roll rotation Rx by combining a high-resolution actuator and flexure parts.
Mirror slope errors cause striation of the downstream x-ray beam, that is a nuisance when operating the beamline in unfocused mode during SRCT experiments. In order to minimize this effect, each bender is equipped with a set of five spring actuators or so-called shape compensators. The residual slope errors for the flat geometry are and rad for the VFM and HFM, respectively. In the nominal elliptical shape for focusing, the mirrors show residual slope errors rad for each stripe.
II.3 Experimental station
The major components of the experimental station shown in Fig. 3 - two beam-conditioning units (BCUs), an experimental table, a detector gantry, and a flight tube - have been custom designed at MAX IV. Due to the different, and some times mutually competing, technical requirements of SWAXS and SRCT as outlined above, we gave special attention to the integration of these components into a single instrument. Because of the modular nature of the experimental station, as described below, we have installed a dedicated programmable logic controller (PLC) system to ensure its safe operation. In order to mitigate the effect of parasitic scattering in the small-angle regime, that hampers SAXS studies of weakly scattering biobased materials such as low-concentration suspensions of cellulose nanoparticles, all windows in the x-ray beam path of the ForMAX beamline are single crystalline. Finally, we have dedicated space between the BCUs to assemble a setup for x-ray multi-projection imaging (XMPI) Villanueva-Perez et al. (2018, 2023).
II.3.1 Beam-conditioning units
The experimental station hosts two BCUs, positioned approximately 36 and 41 m downstream of the source. The upstream BCU (called BCU I) includes a fast shutter, a pneumatic filter unit, and a set of monochromatic slits. In the near future, it will also host an x-ray prism lens that allows beam expansion in the mm range for full-field tomographic imaging experiments. The downstream BCU (BCU II) includes a beam viewer, two Si diodes for x-ray beam flux monitoring, a set of monochromatic slits, a set of compound refractive lenses optimized to provide a microfocus x-ray beam at 16.3 keV for scanning SWAXS experiments, and the possibility of mounting a simple off-axis optical microscope for visual monitoring of the sample. In order to minimize the x-ray path in air for different setups, the exit vacuum window of BCU II is motorized along the beam path. Finally, all slits in the experimental station are so-called hybrid scatterless slits Li et al. (2008), with single crystal InP wafers mounted on tungsten carbide blades in order to suppress parasitic x-ray scattering.
II.3.2 Experimental table
The experimental table is located 42 m downstream of the source and is based on a concept developed at the ALBA synchrotron Colldelram et al. (2010). The table provides flexibility for sample environment mounting in terms of available top surface of mm2, load capacity of 200 kg, large lateral and vertical translation ranges of 200 mm each, and up to mm space between the top surface and the x-ray beam.
The base of the experimental table is a stable and stiff granite block. For vertical motion of the table (m resolution) we make use of two (upstream and downstream) motorized steel plates, that are driven by ball screws with linear guides and actuated by stepper motors. Flexure hinges on the steel plates allow fine tuning of the pitch (20 mrad range, rad resolution). We have added the lateral motion (m resolution) on top of the assembly, again driven by a ball screw with linear guides.
II.3.3 Detector gantry
The granite detector gantry, located by the experimental table, hosts the WAXS detector and the full-field microscope for SRCT. It has five independent motions, viz.,
-
•
the longitudinal motion of the gantry along the x-ray beam path (1500 mm range, m resolution),
-
•
lateral (700 mm) and vertical (20 mm) motions of the WAXS detector (m resolution each), and
-
•
lateral (700 mm) and vertical (30 mm) motions of the full-field microscope (m resolution each).
We have verified by measuring the vibrations of the microscope tip with a laser Doppler vibrometer (one minute average, integrated 4-100 Hz) that the amplitudes are nm in both lateral and vertical directions (root mean square; RMS).
The above motions permit easy and independent movement of the WAXS detector and the full-field microscope in and out of the x-ray beam, thus providing a number of different experimental modes:
-
•
In the SWAXS setup (see Fig. 3), we center the x-ray beam on the WAXS detector, while the SAXS signal (and unscattered beam) passes through the central hole of the WAXS detector and impinges on the SAXS detector (and the central beam stop). In this setup, we translate the full-field microscope out of the x-ray beam path. In the SAXS setup, in turn, we also translate the WAXS detector out of the x-ray beam path and mount an evacuated nose cone onto the flight tube to minimize the air path downstream of the sample.
-
•
In the SRCT setup, we translate the WAXS detector out of the path of the x-ray beam. As a safety measure we close a gate valve at the entrance of the flight tube, to avoid x-ray exposure of the SAXS detector.
-
•
In the combined SAXS and SRCT setup, we align the SAXS detector with the x-ray beam, and translate the full-field microscope vertically in and out of the x-ray beam path for full-field imaging and scattering modes, respectively. The vertical translation of the microscope out of the x-ray beam path takes seconds. A combined SWAXS and SRCT setup is also possible, but the accessible SAXS and WAXS angular ranges are limited by space restrictions.
II.3.4 Flight tube
In order to minimize (i) absorption of the scattered x-ray beam and (ii) parasitic x-ray scattering from air, we have placed the SAXS detector on a motorized detector trolley inside a 9 m long and 1 m diameter evacuated vacuum vessel operating at mbar. We have also mounted a motorized central beam stop, made from tungsten and equipped with a GaAs diode for monitoring the flux of the transmitted x-ray beam, on the detector trolley. The motorized longitudinal motion of the detector trolley permits easy switching of the nominal sample-to-detector distance in the range of mm, while the independent motorized lateral and vertical motions allow users to freely position the SAXS detector with respect to the direct x-ray beam. We have mechanically decoupled the rail system of the detector trolley from the vacuum vessel, thereby isolating the trolley motion from vibrations and vacuum-induced deformations of the vessel.
II.4 Sample manipulation
ForMAX offers a number of experimental techniques, each with specific requirements with respect to sample manipulation. In order to meet different user needs, ForMAX is equipped with three separate stacks of stages for sample manipulation:
-
•
For SWAXS experiments, we provide a high-load (N) five-axis assembly from Huber as shown in Fig. 4A. It consists, from bottom to top, of motorized pitch Rx (), roll Rz (), lateral x (mm), longitudinal z (mm), and vertical y (mm) axes. In order to simplify mounting of sample holders or environments, we have added an optical breadboard with a mm2 grid of centered ISO metric M6 threaded holes on top of the stages. The nominal distance between the top surface and the center of rotation is mm, but this can be increased owing to the modular nature of the assembly of stages.
-
•
For scanning SWAXS experiments, we provide another assembly with five degrees of freedom by Huber, see Fig. 4B. The base consists of motorized lateral x (mm), vertical y ( or mm, depending on resolution and speed requirements), and longitudinal z (mm) axes for 2D scanning and adjustment of the sample along the x-ray beam path. On top of these we have mounted a yaw Ry axis that, combined with the translation stages below, allows SWAXS tomographic imaging. Finally, we have added a large-range, custom pitch axis Rx () for SWAXS tensor tomography experiments. A manual five-axis goniometer head (Huber, model 1002 or 1005) on top of the assembly enable fine alignment of the sample.
-
•
In SRCT experiments we employ a five-axis assembly from Lab Motion as shown in Fig. 4C. It consists, from bottom to top, of a motorized longitudinal z axis (mm range) for propagation-based phase-contrast imaging, a vertical y axis (mm) for helical imaging, an air-bearing tomographic yaw axis Ry, coupled with a rotary union accomodating a fluid slip ring, and horizontal xz axes (mm each) for sample alignment. The electrical slip ring is equipped with 15 spare wires for integration of sample environments. The maximum rotation speed of the yaw stage is 720 revolutions per minute, allowing SRCT experiments with temporal resolution up to Hz. The assembly is modular and is typically operated without the vertical axis and the rotary union. In order to facilitate mounting of sample holders or environments, we have installed an optical breadboard with a mm2 grid of centered ISO metric M6 threaded holes on top of the stages.
We further note that we can combine the air-bearing tomographic rotation stage with linear scanning SWAXS stages in a modular setup, allowing combined high-resolution SRCT and 2D/3D scanning SWAXS experiments without the need to re-mount the sample upon changing experimental modality.
III Data acquisition and processing
Data acquisition and processing greatly affects the user experience. In the following, we briefly review how these are managed at the ForMAX beamline.
III.1 X-ray detection systems
For SWAXS experiments, ForMAX is equipped with two megapixel, hybrid photon-counting detectors that provide high resolution, high dynamic range, and low noise. The SAXS detector is a vacuum-compatible Dectris EIGER2 X 4M Donath et al. (2023). The WAXS detector, in turn, is a custom X-Spectrum Lambda 3M Pennicard et al. (2013). In Table 4 we provide technical details about both detectors.
The range of scattering vector modulus q covered by the SAXS detector depends on the x-ray energy, sample-to-detector distance (SDD), positioning of the SAXS detector in the scattering plane, and the size of the central beam stop (at the moment 4-5 mm diameter); assuming that the SAXS detector is centered on the direct x-ray beam, the accessible SAXS q range varies from nm-1 at minimum x-ray energy and maximum SDD to nm-1 at maximum energy and minimum SDD.
The custom WAXS detector warrants a more detailed discussion. In order to facilitate scanning SWAXS experiments from fibrous materials, it has a hole in the center to pass through the SAXS signal (and the direct x-ray beam), while simultaneously allowing us to collect WAXS data in all directions of the scattering plane as exemplified in Fig. 5A. Moreover, it is mounted onto an evacuated nose cone and connected to the flight tube via a bellow, thereby minimizing parasitic air scattering in the SAXS regime. At the nominal SDD of 135 mm, we can collect WAXS data at scattering angles in all directions of the scattering plane, yielding the energy-dependent range of accessible scattering vector moduli shown in Fig. 5B. We note that there is mm path of air between the sample and the entrance window of the flight tube when using the WAXS detector, adding to the parasitic background scattering in the SAXS regime. Finally, due to the thickness of the full-field microscope, SDD mm in the combined SWAXS and SRCT experiments, essentially halving (i) the energy-dependent minimum and maximum q of Fig. 5B and (ii) the accessible scattering angles in the SAXS regime due to shadowing of the flight tube entrance window, hence in practice limiting these experiments to x-ray energies keV.
For SRCT experiments, ForMAX is equipped with a high-resolution full-field microtomography detection system encompassing two main components an optical microscope and a sCMOS camera. The transmitted x-ray beam is converted by a scintillator into visible light, that in turn is magnified by the optical microscope and recorded by the sCMOS camera. The white-beam optical microscope from Optique Peter has motorized triple objective lens and dual camera port configurations for simple switching of magnification and sCMOS camera, respectively. We can operate the microscope with , , , , and objectives, depending on the required effective pixel size and field of view.
Currently we employ two sCMOS cameras for high-resolution imaging at limited speed, the Hamamatsu ORCA Lightning and the Andor Zyla. We are also equipped with a high-speed Photron FASTCAM Nova sCMOS camera to allow Hz SRCT, i.e., the maximum temporal resolution allowed for by the tomographic rotation stage. We summarize the technical details of the sCMOS cameras in Table 5.
We have evaluated the performance and resolution of the presented SRCT system. For this evaluation, we used the full-field microscope with , , and magnification coupled to the Andor Zyla camera (physical pixel size 6.5 m), resulting in 1.3, 0.65, and 0.325 m effective pixel size, respectively. The reconstructed slices for the different magnifications of a wood sample are presented in the right column of Fig. 6. We also evaluated the resolution over the 3D reconstructed volume using the Fourier Shell Correlation (FSC) together with the half-bit threshold criterion van Heel (1987); van Heel and Schatz (2005) as depicted in the right column of Fig. 6. We observe that the ForMAX instrument retrieves Nyquist-limited resolution for the and magnifications, i.e., 2.6 and 1.3 m resolution. For the magnification, the retrieved resolution was around 3 pixels, which corresponds to 0.975 m. Thus, the ForMAX instrument is ideal to characterize objects in 3D with micrometer resolution.
III.2 Control system
ForMAX’s control system is based on Tango Chaize et al. (1999), an open-source control system that is in use at several European synchrotron facilities. On top of Tango we employ Sardana Coutinho et al. (2011), a software environment for, e.g., controlling motors, acquiring signals, and running macros. We have optimized the scan routines for the specific needs of ForMAX, such as reducing the overhead per line in continuous xy mesh scans to second for scanning SWAXS applications. From a hardware point of view, the majority of our motorized axes are based on stepper motors controlled by IcePAP Janvier et al. (2013) and we make use of PandABoxes for synchronization of the experiments Zhang et al. (2017).
III.3 Data pipelines
All detectors are integrated into the beamline control system via dedicated detector servers, utilizing detector-specific software development kits (SDKs) running on detector control units (DCUs) for detector control and data readout. Low-level image processing such as flat-field correction is either applied by default (for hybrid pixel detectors; SWAXS) or in the image reconstruction (for sCMOS cameras; SRCT), while low level acquisition parameters such as acquisition time, number of frames, and photon-counting threshold energy are accessible to the user. Finally, the data are streamed via high-speed Ethernet connections to MAX IV’s central data storage and saved together with metadata in the hierarchical data format 5 (HDF5). In the case of the high-speed Photron sCMOS camera, the data will temporarily be saved on the local data storage of the camera, before transfer to the central data storage. The data are stored for at least seven years.
In parallel with data streaming and storage of the as measured scattering data, our SWAXS data pipeline reduces the data to a more user-friendly format. The data reduction is carried out using the python implementation of MatFRAIA Jensen et al. (2022), based on a matrix-multiplication algorithm for radial and azimuthal integration, and is faster than the maximum frame rate of the EIGER detector. We reduce the SWAXS data into both 1D and 2D formats, where denotes the scattering intensity and the azimuthal angle. We emphasize that the fast data reduction into so-called ’cake plots’, , is particularly convenient for monitoring anisotropic scattering from fibrous materials in (scanning) SWAXS experiments. For calibration and masking of the detectors we utilize PyFAI Kieffer et al. (2018), which is well known in the user community. Finally, in order to facilitate monitoring of the experiment, we plot either the radial integral or the ’cake plot’ in both SAXS and WAXS regimes in live mode. In Fig. 7 we present a snapshot from the beamline control computer, exemplifying the live plotting of reduced SWAXS data.
In SRCT experiments, we take a different approach for the data pipeline. In line with community convention, we collect projections as well as flat- and dark-field images using dedicated scan routines and save all data in common HDF5 files. In order to further improve user friendliness, we are currently in the process of implementing live tomographic reconstructions for SRCT experiments.
III.4 Data analysis and image reconstructions
ForMAX allows a wide range of SWAXS, scanning SWAXS, and SRCT experiments, each with their unique requirements with respect to on-line data analysis. In order to support all these different experiments, we provide up-to-date Jupyter notebook templates for our users. For SRCT experiments, the script for tomographic reconstruction includes the option to perform phase retrieval for single-distance propagation-based phase contrast tomography, in addition to standard absorption contrast tomography reconstruction. We plan to continuously implement further developments, including the aforementioned live tomographic reconstructions for SRCT experiments.
SAXS tensor tomography (SASTT), that combines concepts of scanning SAXS with SRCT to retrieve not solely scattering intensity measures but the full 3D reciprocal space map within each voxel of the tomogram, is a special case due to the high demands on image reconstruction. Data acquisition must be matched with sufficient computational resources to allow reconstructions of the 3D reciprocal space map, ideally already during the experiment, to evaluate the quality of the measurements. At ForMAX, we have implemented Jupyter notebook templates for projection alignment and apply the software package Mumott (mumott.org) to perform SASTT reconstructions. In the future, we plan to continuously update these notebooks to remain up to date and match further developments and improvements of the reconstruction algorithm. Details about Mumott can be found in a recent publication by Nielsen et al. (2023).
IV Benchmarking
In this section we report on initial benchmarking of the main x-ray beam properties at ForMAX.
IV.1 Beam size
The dynamically bendable mirrors provide means to vary the lateral and vertical beam size at the sample position in a large range. In the unfocused mode, we obtain an FWHM beam size of mm2 () using the DCM, while the larger bandpass of the MLM yields a beam size of mm2. In the other extreme, we can focus the beam down to m2 at the sample position using either monochromator. In this case, the lateral beam size is limited by source size and imaging geometry, while the vertical beam size is limited by slope errors of the mirrors. The dependence of the beam size on the ID harmonic is negligible.
In order to further decrease the beam size at the sample position, we have installed compound refractive lenses (CRLs) m upstream of the nominal sample position. At the moment we employ a stack of 16 radiation-resistant SU-8 polymeric lenses from Microworks, optimized for 16.3 keV x-rays and yielding a FWHM beam size of m2 at the sample position. This is similar to the beam size typically available at third-generation SWAXS beamlines with microfocus capability Buffet et al. (2012); Smith et al. (2021).
The natural beam size at ForMAX limits SRCT experiments on large samples. This limitation can be partly overcome by stitching images, but at the expense of temporal resolution. We will soon also install an optional, overfocusing SU-8 x-ray prism lens from Microworks m upstream of the nominal sample position, yielding an energy-dependent x-ray beam size of mm2 or larger at the sample position in combination with the DCM.
IV.2 Flux
The imaging techniques available at ForMAX rely on a large incident photon flux. In Fig. 8 we present the measured x-ray photon flux at the sample position for both monochromators. We collected the data with the minimum undulator gap (4.5 mm) and maximum acceptance angle (rad2), as typically employed for photon-hungry SRCT and scanning SWAXS experiments. We measured the flux of a strongly attenuated x-ray beam at and 20 keV using the photon-counting EIGER detector, an approach that yielded reliable results owing to the efficient harmonic rejection using the Si and Rh stripes of the mirrors at these energies. The measured fluxes agree within a factor of three with results based on ray-tracing simulations with XRT Klementiev and Chernikov (2014), assuming ideal undulator and optics.
Let us briefly discuss the available x-ray flux at ForMAX compared to competitive beamlines at third-generation synchrotron sources. In terms of SWAXS, the x-ray flux at the latter for typical experimental conditions in the enrgey range of ForMAX is generally ph s-1 or smaller, see e.g. Smith et al. (2021). The smaller x-ray beam divergence at ForMAX allows for a photon flux (using the DCM) of up to an order of magnitude larger than these values, greatly facilitating scanning SWAXS experiments. Moreover, the MLM is available for niche experiments requiring an even higher flux. In terms of SRCT, in turn, the flux at ForMAX (using the MLM) is comparable to one available at third-generation sources Stampanoni et al. (2006); Rau et al. (2011); Vaughan et al. (2020), albeit in an up to two orders of magnitude smaller beam cross section. We note that while the small beam size at ForMAX limits the capability of full-field imaging of large samples, as alluded to above, the very high photon density instead carries the potential for ultrafast imaging.
IV.3 Coherence estimation
In this section, we present an initial quantification of the coherent properties at the ForMAX beamline. Specifically, we evaluate the effects of coherence in the formation of holographic fringes in an in-line holography experiment. We envision performing an exhaustive analysis of the coherent properties of ForMAX Goodman (1985); Vartanyants and Singer (2010) for different energies and imaging configurations, but this is out of the scope of the present paper.
We performed in-line holography at 9.1 keV, imaging a broken membrane that exhibited several sharp edges with random orientations Dierks and Wallentin (2020). Fig. 9A depicts the hologram () recorded 19 cm downstream of the sample, using the SRCT detection system with an effective pixel size of 0.325 m and a response function (also known as the Point Spread Function; PSF) with a FWHM corresponding to 3 pixels (=0.41 m), as estimated in section III.1 for the 20x magnification objective. The Fourier transform of the recorded hologram () can be written as Zabler et al. (2005)
| (1) |
where is the frequency, the wave’s phase after the object, the wavelength, the propagation distance between the sample and the detector, the detector’s point-spread function, and the degree of coherence. The sinusoidal term in Eq. (1) is also known as the contrast-transfer function Guigay (1977) and the visibility of its oscillations as a function of the frequency is limited by the coherence and the PSF. The power spectrum () of the recorded hologram in logarithmic scale is depicted in Fig. 9B. We clearly observe an asymmetry between the visibility of the CTF oscillations in the vertical and lateral directions due to coherent effects.
For an initial quantification of the coherence effects, we performed a fit of Eq. (1) to the power spectrum, describing the PSF and the degree of coherence by a Gaussian function with the standard deviation
| (2) |
where is due to the degree of coherence. Because of the difference in phase space of the source in the principal directions, we fitted the data independently in vertical and lateral directions as presented in Fig. 9C. On the one hand, the vertical m is comparable to , implying that the blurring of the fringes in the vertical direction is dominated by the PSF. This observation is compatible with the small vertical electron source size, and hence large vertical coherence length, of Table 1. On the other hand, the lateral m corresponds to m, suggesting that the lateral visibility is mainly limited by the degree of coherence. This finding is in line with the larger lateral electron source size, and hence smaller lateral coherence length, of Table 1.
V Probing hierarchical materials
The objective of the ForMAX beamline is to provide multiscale and multimodal structural characterization of materials from nm to mm length scales. In the following, we demonstrate this capability with a few examples.
V.1 Combined scanning SWAXS and SRCT
A key feature of ForMAX is the possibility of zooming into hierarchical materials, as illustrated in Fig. 10. In a first instance, we acquire a high-resolution 3D image by SRCT, yielding microscopic structural characterization of the sample. This is exemplified in Fig. 10A for a sample of aspen sapling mounted in tangential geometry. Moreover, the tomogram allows us to identify regions of interest (RoI) for scanning SWAXS mapping of nanoscale structures. In the second instance, we focus the x-ray beam onto the sample position and collect spatially resolved SWAXS data on either the RoIs or the full sample, as illustrated in Figs. 10B and C-D for SAXS and WAXS, respectively. Here, the anisotropy in the SAXS data is due to scattering from cellulose fibrils, whereas the main WAXS signal is due to diffraction from their crystalline parts. We note that whereas the SAXS and WAXS data of Figs. 10 provide access to structural properties such as microfibril size and orientation, the WAXS data of Figs. 10C and D also allow the mapping of other crystalline compounds within the sample, in this case calcium oxalate crystals. For bio-based materials, different crystalline agents are often present in the samples, and with the combination of spatial SRCT and SWAXS data, the regions of interest within the sample can be reconstructed using various scattering contrasts.
The feature of zooming into hierarchical materials is still under development. Potential means for improving user friendliness include, e.g., a graphical user interface for selecting RoIs from the 3D SRCT data. Nevertheless, ForMAX provides already in its present state unique means for multiscale and multimodal structural characterization of soft and/or bio-based materials in the nm to mm range.
V.2 SAXS tensor tomography
As noted in the introduction, scanning SWAXS imaging provides structural characterization across seven orders of magnitude in length scales in a single experiment. SAXS tensor tomography (SASTT) is particularly useful for hierarchical materials, since the statistically averaged local orientation of fibrils, fibers, or filaments accessible in these experiments is directly linked to the mechanical properties of the sample. In the scope of commissioning the beamline, we acquired a SASTT dataset from carbon fiber bundles that were carefully arranged in the shape of a small knot. A similar test sample has already been used in the initial SASTT commissioning experiments at the cSAXS beamline, Swiss Light Source Liebi et al. (2015). The purpose of such a measurement is to ensure the proper mapping of 3D reciprocal space (scattering directions) and real space directions, scanning at different rotation and tilt orientations, into the reconstruction algorithm. We successfully reconstructed the first dataset already during the beamtime, due to the readily available computing resources at the MAX IV high performance cluster (HPC).
The input for the reconstruction consists of a dataset with 276 two-dimensional projections with pixels () at a pixel size of m, computed from a total of 1.15M detector frames. Each pixel of every projection consists of detector data which was reintegrated into 32 azimuthal bins in the range of nm-1 and further symmetrically averaged to remove detector gaps. The remaining 16 azimuthal bins are used as input for the SASTT reconstruction with Mumott version 1.2 (https://zenodo.org/records/8404162). Another important step in the workflow is projection alignment. We used a computational procedure to align all projections for different orientations of the sample ( for , for ), that first generates a tomogram for and next back projects the projections of all other tilts and uses phase_cross_correlation from the skimage.registration python package for image registration and computation of the required shifts. We used the integrated dark field signal as input for the alignment procedure, due to the weak absorption signal from the carbon fibers. The same procedure was further used to mask out the sample holder and frame from some of the projections. The computed vertical and horizontal shifts are in total m (see Fig. 11), showing that the experimental setup is very stable.
We reconstruct the 3D reciprocal space in each voxel using band-limited Friedel symmetric spherical functions expressed in spherical harmonics up to a maximum order of 6, which results in 28 coefficients for each voxel that are used to reconstruct the 3D reciprocal space. The orientation of the main structure is determined from the eigenvector associated with the smallest eigenvalue of the rank-2 tensor. We have checked the robustness of the reconstruction by visual comparison of 2D orientation, anisotropy, and degree of orientation between the measurements and simulated projections of the reconstructed data. Finally, we calculate the degree of orientation as the ratio between the mean (isotropic component) and standard deviation (RMS of anisotropic component).
We display the results of the reconstruction in Fig. 12. In Fig. 12A, we directly compare the input data of the mean intensity with a synthetic projection computed from results of the reconstruction. Since there is essentially no difference between measured and synthetic projections, which is the goal of the reconstruction, we move on to inspect the tomogram in more detail. Fig. 12B displays two central cuts, a zx and a zy slice through the tomographic reconstructed mean intensity, which gives direct insights into the arrangement of the fibers within the knot. The top left of the image exhibits a region of higher intensity where the fiber bundles from top/bottom overlap, while the opposing side of the image shows two open loops of less densely packed material. Besides the mean intensity, SASTT reconstructions also offer the unique possibility to assess the 3D reciprocal space map within each voxel, as shown in Fig. 12C for selected voxels of the tomogram (scaled with the same colormap for better comparison). The high intensity region clearly shows a ring-like reciprocal space map, which is expected for fiber-like structures. Finally, in Fig. 12D we visualize the combined information of the carbon fiber knot using the visualization software ParaView (www.paraview.org). Cylinder glyphs with fixed aspect ratio point in the direction of the carbon fibers. We use the mean intensity, a measure of the material’s density, to scale as well as color-code the glyphs. Note that we have masked the output with a 3D array taken from the mean intensity to exclude low scattering regions and mask out data from air/background voxels.
V.3 Advanced rheological and mechanical testing
In situ rheological or mechanical testing is a common approach to address, for example, flow-induced assembly of nanoparticles into advanced materials or the relationship between structural and mechanical properties in fibrous materials. We foresee that such studies will be popular among our user community. However, while combined rheological and small-angle scattering experiments are rather mature Eberle and Porcar (2012), a deep understanding of flow-induced assembly of nanoparticle suspensions into novel hierarchical materials requires simultaneous rheological and multiscale structural characterization Kádár et al. (2021, 2023). This is particularly important for the assembly and development of new materials from biomass, for which the importance of flow cannot be overstated. Likewise, while in situ uniaxial tensile or compressional load is commonly excerted during SWAXS or SRCT experiments, materials engineering applications may require more complex load geometries and loading profiles or extensive load cycling in well controlled temperature and relative humidity. Again, this is of great importance for biobased materials, that are viscoelastic even in their solid state.
In parallel with the construction and commissioning of ForMAX, we have therefore also developed x-ray methodology to further expand the possibilities for multiscale and multimodal structural characterization during rheological and mechanical testing. Based on this development work we can, together with our sister beamline CoSAXS Kahnt et al. (2021), provide users with the following capability:
-
•
Simultaneous rheological and SWAXS experiments, as exemplified in Figs. 13A and 13C for a cellulose nanocrystal suspension subjected to laminar Couette flow in a concentric polycarbonate cup-bob geometry. Other geometries, including plate-plate geometry that allows simultaneous mesoscale structural characterization by polarized light imaging (see Fig. 13D), and environmental control are also available. Finally, we note that the MLM provides the prospect of supreme temporal resolution in such studies.
-
•
We’re addressing the need for more complex in situ load experiments by developing combined dynamical mechanical analysis (DMA) and SWAXS in an atmosphere of controlled temperature and humidity, see Fig. 13B. Inspired by recent development of combined rheological and SRCT experiments Dobson et al. (2020), we’re currently expanding the DMA-SWAXS experiments towards multiscale structural characterization by introducing simultaneous SRCT capability, using the rheometer in co-rotation mode as the tomographic rotation stage.
VI Conclusions and outlook
We have recently brought into operation ForMAX, that allows unique multiscale and multimodal structural characterization of hierarchical materials in the nm to mm range by combining SWAXS, scanning SWAXS imaging, and SRCT (or any combination of these techniques) in a single experiment. Although we are still optimizing the beamline’s performance, the initial benchmarking of the x-ray beam properties reported here demonstrates ForMAX’s potential.
A major aspect of ForMAX is the possibility to monitor multiscale structural evolution during material processing. Currently we are developing this possibility along two different paths. First, the very high photon density at ForMAX provides unprecedented possibilities for ultrafast full-field imaging. Second, we are working on dedicated sample environments that allow multiscale structural characterization during complex rheological or mechanical testing under controlled temperature and humidity, as exemplified above. We hope to make these developments available for general users in the near future.
We thank the staff at the MAX IV Laboratory for all their support during the beamline project. The construction of ForMAX has been funded by the Knut and Alice Wallenberg Foundation, while a large fraction of the operation costs are covered by Swedish industry via the Treesearch platform. Research conducted at MAX IV, a Swedish national user facility, is supported by the Swedish Research Council under contract 2018-07152, the Swedish Governmental Agency for Innovation Systems under contract 2018-04969, and Formas under contract 2019-02496. We have received additional funding from the European Union’s Horizon 2020 Framework Programme via the European Research Council (WIREDIRECT, grant agreement 801847; 3DX-FLASH, 948426; MUMOTT, 949301) and the Marie Sklodowska-Curie Actions (PSI-FELLOW-III-3i, grant agreement 884104), the Swedish Research Council (project grant number 2022-04192), the Swedish Foundation for Strategic Research (SSF grant ID17-0097), the Crafoord foundation, NanoLund, the ’FibRe - Competence Centre for Design for Circularity: Lignocellulose- based Thermoplastics’ partly funded by the Swedish Innovation Agency VINNOVA (Grant Number 2019-00047), Chalmers Center for Advanced Neutron and X-ray scattering techniques, and Chalmers Area of Advance Materials Science.
References
- Lakes (1993) R. Lakes, Nature 361, 511 (1993).
- Fratzl and Weinkamer (2007) P. Fratzl and R. Weinkamer, Prog. Mat. Sci. 52, 1263 (2007).
- Gibson (2012) L. J. Gibson, J. R. Soc. Interface 9, 2749 (2012).
- Glatter and Kratky (1982) O. Glatter and O. Kratky, eds., Small-Angle X-ray Scattering (Academic Press, 1982).
- Pauw (2013) B. R. Pauw, J. Phys.: Condens. Matter 25, 383201 (2013).
- Maire and Withers (2014) E. Maire and P. J. Withers, Int. Mater. Rev. 59, 1 (2014).
- Lichtenegger et al. (1999) H. Lichtenegger, M. Müller, O. Paris, C. Riekel, and P. Fratzl, J. Appl. Cryst. 32, 1127 (1999).
- Bunk et al. (2009) O. Bunk, M. Bech, T. H. Jensen, R. Feidenhans’l, T. Binderup, A. Menzel, and F. Pfeiffer, New J. Phys. 19, 123016 (2009).
- Feldkamp et al. (2009) J. M. Feldkamp, M. Kuhlmann, S. V. Roth, A. Timmann, R. Gehrke, I. Shakhverdova, P. Paufler, S. K. Filatov, R. S. Bubnova, and C. G. Schroer, Phys. Status Solidi A 206, 1723 (2009).
- Jensen et al. (2011) T. H. Jensen, M. Bech, O. Bunk, M. Thomsen, A. Menzel, A. Bouchet, B. Le-Duc, and F. Pfeiffer, Phys. Med. Biol. 56, 1717 (2011).
- Liebi et al. (2015) M. Liebi, M. Georgiadis, A. Menzel, P. Schneider, J. Kohlbrecher, O. Bunk, and M. Guizar-Sicairos, Nature 527, 349 (2015).
- Schaff et al. (2015) F. Schaff, M. Bech, P. Zaslansky, C. Jud, M. Liebi, M. Guizar-Sicairos, and F. Pfeiffer, Nature 527, 353 (2015).
- McEntee (2023) J. McEntee, Physics World Instrum. Vac. Briefing pp. 5–8 (2023).
- Tavares et al. (2018) P. F. Tavares, E. Al-Dmour, Å. Andersson, F. Cullinan, B. N. Jensen, D. Olsson, D. K. Olsson, M. Sjöström, H. Tarawhen, S. Thorin, et al., J. Synchrotron Rad. 25, 1291 (2018).
- Ursby et al. (2020) T. Ursby, K. Åhnberg, R. Appio, O. Aurelius, A. Barczyk, M. Bjelčić, F. Blomsten, Y. Cerenius, R. B. Doak, M. Eguiraun, et al., J. Synchrotron Rad. 27, 1415–1429 (2020).
- Johansson et al. (2021) U. Johansson, D. Carbone, S. Kalbfleisch, A. Björling, M. Kahnt, S. Sala, T. Stankevic, M. Liebi, A. R. Fernandez, B. Bring, et al., J. Synchrotron Rad. 28, 1935 (2021).
- Kahnt et al. (2021) M. Kahnt, K. Klementiev, V. Haghighat, C. Weninger, T. S. Plivelic, A. E. Terry, and A. Björling, J. Synchrotron Rad. 28, 1948 (2021).
- Kristiansen et al. (2016) P. Kristiansen, U. Johansson, T. Ursby, and B. N. Jensen, J. Synchrotron Rad. 23, 1076 (2016).
- Villanueva-Perez et al. (2018) P. Villanueva-Perez, B. Pedrini, R. Mokso, P. Vagovic, V. A. Guzenko, S. J. Leake, P. R. Willmott, P. Oberta, C. David, H. N. Chapman, et al., Optica 5, 1521 (2018).
- Villanueva-Perez et al. (2023) P. Villanueva-Perez, V. Bellucci, Y. Zhang, S. Birnsteinova, R. Graceffa, L. Adriano, E. M. Asimakopoulou, I. Petrov, Z. Yao, M. Romagnoni, et al., arXiv p. 2305.11920 (2023).
- Li et al. (2008) Y. Li, R. Beck, T. Huang, M. C. Choi, and M. Divinagracia, J. Appl. Cryst. 41, 1134 (2008).
- Colldelram et al. (2010) C. Colldelram, C. Ruget, and L. Nikitina, Proc. MEDSI’10 1, e44 (2010).
- Donath et al. (2023) T. Donath, D. Š. Jung, M. Burian, V. Radicci, P. Zambon, A. N. Fitch, C. Dejoie, B. Zhang, M. Ruat, M. Hanfland, et al., J. Synchrotron Rad. 30, 723 (2023).
- Pennicard et al. (2013) D. Pennicard, S. Lange, S. Smoljanin, H. Hirsemann, H. Graafsma, M. Epple, M. Zuvic, M. O. Lampert, T. Fritzsch, and M. Rothermund, J. Phys.: Conf. Series 425, 062010 (2013).
- van Heel (1987) M. van Heel, Ultramicroscopy 21, 95 (1987).
- van Heel and Schatz (2005) M. van Heel and M. Schatz, Journal of structural biology 151, 250 (2005).
- Chaize et al. (1999) J.-M. Chaize, A. Götz, W.-D. Klotz, J. Meyer, M. Perez, and E. Taurel, in Proceedings of the 7th International Conference on Accelerator and Large Experimental Physics Control Systems (ICALEPCS’99) (1999), pp. 475–479.
- Coutinho et al. (2011) T. Coutinho, G. Cuní, D. Fernández-Carreiras, J. Klora, C. Pascual-Izarra, Z. Reszela, R. Suñé, A. Homs, E. Taurel, and V. Rey, in Proceedings of the 13th International Conference on Accelerator and Large Experimental Physics Control Systems (ICALEPCS 2011) (2011), pp. 607–609.
- Janvier et al. (2013) N. Janvier, J. M. Clement, P. Fajardo, and G. Cuní, in Proceedings of the 14th International Conference on Accelerator and Large Experimental Physics Control Systems (ICALEPCS 2013) (2013), pp. 766–769.
- Zhang et al. (2017) S. Zhang, Y. M. Abiven, J. Bisou, G. Renaud, G. Thibaux, F. Ta, S. Minolli, and F. Langlois, in Proceedings of the 16th International Conference on Accelerator and Large Experimental Physics Control Systems (ICALEPCS 2017) (2017), pp. 143–150.
- Jensen et al. (2022) A. B. Jensen, T. E. K. Christensen, C. Weninger, and H. Birkedal, J. Synchrotron Rad. 29, 1420 (2022).
- Kieffer et al. (2018) J. Kieffer, S. Petitdemange, and T. Vincent, J. Synchrotron Rad. 25, 612 (2018).
- Nielsen et al. (2023) L. M. Nielsen, P. Erhart, M. Guizar-Sicairos, and M. Liebi, Acta Cryst. A79, 515 (2023).
- Buffet et al. (2012) A. Buffet, A. Rothkirch, R. Döhrmann, V. Körstgens, M. M. A. Kashem, J. Perlich, G. Herzhog, M. Schwartzkopf, R. Gehrke, P. Müller-Buschbaum, et al., J. Synchrotron Rad. 11, 647 (2012).
- Smith et al. (2021) M. J. Smith, S. G. Alcock, L. S. Davidson, J. H. Emmins, J. C. H. Bardsley, P. Holloway, M. Malfois, A. R. Marshall, C. L. Pizzey, S. E. Rogers, et al., J. Synchrotron Rad. 28, 939 (2021).
- Klementiev and Chernikov (2014) K. Klementiev and R. Chernikov, in Proc. SPIE 9209, Advances in Computational Methods for X-Ray Optics III (2014), p. 92090A.
- Stampanoni et al. (2006) M. Stampanoni, A. Groso, A. Isenegger, G. Mikuljan, Q. Chen, A. Bertrand, S. Henein, R. Betemps, U. Frommherz, P. Böhler, et al., Proc. SPIE 6318, Developments in X-Ray Tomography p. 63180M (2006).
- Rau et al. (2011) C. Rau, U. Wagner, Z. Pešić, and A. D. Fanis, Phys. Status Solid A 208, 2522 (2011).
- Vaughan et al. (2020) G. B. M. Vaughan, R. Baker, R. Barret, J. Bonnefoy, T. Buslaps, S. Checchia, D. Duran, F. Fihman, P. Got, J. Kieffer, et al., J. Synchrotron Rad. 27, 515 (2020).
- Goodman (1985) J. W. Goodman, Statistical optics (Wiley-Interscience, New York, 1985).
- Vartanyants and Singer (2010) I. A. Vartanyants and A. Singer, New Journal of Physics 12, 035004 (2010).
- Dierks and Wallentin (2020) H. Dierks and J. Wallentin, Opt. Express 28, 29562 (2020).
- Zabler et al. (2005) S. Zabler, P. Cloetens, J.-P. Guigay, J. Baruchel, and M. Schlenker, Review of Scientific Instruments 76, 073705 (2005).
- Guigay (1977) J.-P. Guigay, Optik 49, 121 (1977).
- Eberle and Porcar (2012) A. P. R. Eberle and L. Porcar, Curr. Opin. Coll. Interface Sci 17, 33 (2012).
- Kádár et al. (2021) R. Kádár, S. Spirk, and T. Nypelö, ACS Nano 15, 7931 (2021).
- Kádár et al. (2023) R. Kádár, A. Terry, K. Nygård, T. Nypelö, G. Westman, S. Wojno, R. Ghanbari, M. Fazilati, M. Bek, and A. K. Sonker, AIP Conf. Proc., Novel Trends in Rheology IX 2997, 020007 (2023).
- Dobson et al. (2020) K. J. Dobson, A. Allabar, E. Bretagne, J. Coumans, M. Cassidy, C. Cimarelli, R. Coats, T. Connolley, L. Courtois, D. B. Dingwell, et al., Frontiers in Earth Science 8, 287 (2020).
- Kim (2009) K.-J. Kim, X-Ray Data Booklet (Lawrence Berkeley National Laboratory, 2009), chap. 2.1, 3rd ed.
| Storage ring energy | 3 GeV |
|---|---|
| Circumference | 528 m |
| Beam current (operation November 2023) | 400 mA |
| Projected beam current | 500 mA |
| Electron beam emittance () | pm2rad2 |
| Electron energy spread | |
| Electron source size () | m2 |
| Electron source divergence () | rad2 |
| Top up | Every 10 minutes |
| Component | Distance from source [m] |
|---|---|
| Undulator | 0 |
| Front end movable mask | 19.5 |
| White-beam slits | 23.9 |
| Double multilayer monochromator | 25.0 |
| Double crystal monochromator | 27.0 |
| Vertically focusing mirror | 30.2 |
| Horizontally focusing mirror | 31.0 |
| Monochromatic slits | 28.1, 32.3, 36.3, 41.5 - 41.8 |
| X-ray prism lens (placeholder) | 36.6 |
| Compound refractive lenses | 40.5 |
| Experimental table | 42.0 |
| Full-field microscope | 42.0 - 42.3 |
| WAXS detector | 42.1 |
| SAXS detector | 42.8 - 49.6 |
| Magnet material | NdFeB |
|---|---|
| Pole Material | Vanadium permedur |
| Energy range | 8-25 keV |
| Period length | 17 mm |
| Number of periods | 166 |
| Minimum magnetic gap | 4.5 mm |
| K value at minimum gap | 1.89 |
| Phase error | |
| Total power (projected 500 mA ring current) | kW |
| Dectris | X-Spectrum | |
| EIGER2 X 4M | Lambda 3M | |
| Number of pixels | 4M | 3M |
| Sensor size | pixels | pixels |
| Pixel size | m2 | m2 |
| Sensor material | Si | Si |
| Sensor thickness | 450 m | 320 m |
| Dynamic range | 32 bit | 24 bit |
| Maximum frame rate111Full dynamic range. | 560 Hz | 1000 Hz |
| Data storage | Streaming | Streaming |
| Speciality | Vacuum compatible | ’Windmill’ shaped |
| Hamamatsu | Andor | Photron | |
|---|---|---|---|
| ORCA Lightning | Zyla 5.5 | FASTCAM Nova S16 | |
| Number of pixels | 12M | 5.5M | 1M |
| Sensor size | pixels | pixels | pixels |
| Pixel size | m2 | m2 | m2 |
| Maximum dynamic range | 16 bit | 16 bit | 12 bit |
| Maximum frame rate222Full frame | 121 Hz (12 bit) | 100 Hz (12 bit) | 16 kHz (12 bit) |
| 30 Hz (16 bit) | 75 Hz (16 bit) | ||
| Data storage | Streaming | Streaming | 128 Gb / 4 Tb |