Formation of transfermium elements in reactions with 208Pb
Abstract
Within the Langevin framework, we investigate the dynamics of the fusion process for production of transfermium elements in reactions of 48Ca, 50Ti, 54Cr, and 58Fe with 208Pb. After the reacting nuclei have made contact, the early dynamical stage is dominated by the dissipation of the initial radial kinetic energy, while the subsequent shape evolution is diffusive. The probability for surmounting the inner barrier and forming a compound system is obtained by simulating the evolution as a Metropolis random walk in a five-dimensional potential-energy landscape. Good agreement with the available data is obtained, especially for the maximal formation probability.
I Introduction
The primary method for producing superheavy atomic nuclei (SHN) has been heavy-ion fusion reactions dullman15:a ; rudolph16:a . When relatively light reaction partners reach their Coulomb barrier the configuration is more compact than that of the fission saddle shape. Therefore, a compound nucleus is automatically formed. However, for heavier reaction partners the Coulomb barrier is situated outside the fission saddle. To avoid a re-separation, referred to as quasi-fission (QF), the shape of the composite system must diffuse over the inner barrier swiatecki81:a ; swiatecki82:a ; bjornholm82:a .
Thus the production of a SHN in a fusion reaction requires a heavy reaction system and the process can be divided into three stages: (i) Contact: the two reaction partners overcome their mutual Coulomb repulsion and achieve contact; (ii) Formation: evolving in competition with QF, the combined system achieves a compact shape well inside the fission barrier; (iii) Survival: the compact system deexcites towards the ground state in competition with fission.
The heaviest known elements are produced in fusion with targets heavier than 208Pb at rather large excitation energies. However, fusion reactions with 208Pb are more accessible experimentally and thus serve as a good starting point for theoretical studies and we shall focus this first study on reactions with the projectiles 48Ca, 50Ti, 54Cr, and 58Fe on a 208Pb target. For three of these reactions, the formation probability was obtained experimentally by extracting the fusion-fission component from the total cross section banerjee19:a .
The dynamics in the formation stage is not yet well understood and several models have been developed to describe the process. They can broadly be classified into two groups: time-dependent Hartree-Fock methods godbey20:a and models based on the stochastic Langevin framework swiatecki03:a ; swiatecki05:a ; zagrebaev15:a .
In this study we investigate the formation process with a Langevin-type treatment. During the formation process, the nuclear shape is described by five parameters and the associated five-dimensional (5D) potential-energy surface includes energy-dependent shell and pairing effects. The shape evolution is simulated in a Monte-Carlo manner so an ensemble of events is generated, thus allowing the extraction of both fluctuations of the observables and correlations between them.
After the reacting nuclei have made contact, the early part of the formation stage is assumed to be dominated by the dissipation of the initial radial kinetic energy, leading the shape along an effectively one-dimensional path towards smaller overall elongations. With the same assumption of overdamped shape evolution as invoked in the fusion-by-diffusion (FBD) model swiatecki03:a ; swiatecki05:a , the subsequent shape evolution is then diffusion dominated. A preliminary version of this treatment was published in Ref. albertsson_thesis .
Section II describes the shape coordinates employed to represent the composite system and the relevant structures in the potential-energy landscape, such as the different valleys. Section III discusses the dynamics of the formation process and the calculated formation probabilities are presented in Sec. IV. Finally, Sec. V provides a summary and a discussion.
II Shapes and potential energy


The shape of the evolving nuclear system is described within the three-quadratic-surface parametrization in which two spheroidal end parts are connected smoothly by a hyperbolic surface of revolution nix69:a . This shape family has five parameters: the overall elongation measured by the dimensionless quadrupole moment, ; the degree of reflection asymmetry, ; the radius of the neck connecting the two parts, ; the deformations of the two spheroidal end parts, and . Collectively, these five shape parameters are denoted by . The parameter is defined from the quadrupole moment of a uniformly charged sharp-surface volume, , as with fm.
For each shape, the potential energy is calculated by the macroscopic-microscopic method using the finite-range liquid-drop model moller09:a , assuming that the system has a uniform charge-to-mass ratio. The associated 5D shape lattice is set up as described in Ref. albertsson20:b .
The resulting potential-energy profile , i.e. the minimum energy of for a specified , is shown in Fig. LABEL:fig:epot1d for the reactions at angular momentum =0 induced by the projectiles 48Ca, 50Ti, 54Cr, and 58Fe on a 208Pb target, leading to the compound nuclei 256No (a), 258Rf (b), 262Sg (c), and 266Hs (d), respectively.
In all four cases the compound nucleus has a prolate ground-state shape with , corresponding to a quadrupole deformation of the overall shape of . The inner saddle point protecting the compound nucleus from fissioning is located at , as determined by the immersion method moller09:a . The saddle point is almost symmetric in all cases: =0.02 for projectiles 48Ca, 50Ti and 54Cr, and =0.1 for 58Fe. Different valleys are found by identifying local minima for each value in the energy surface and smoothly following these minima as increases. The ground states are connected to valleys that are mainly symmetric and these are denoted as the respective fission valleys (blue circles). Being initially reflection symmetric, the fission valleys bifurcate into asymmetric shapes at (see Fig. 2).
For each case, in addition to the fission valley, there is a valley (denoted as the fusion valley) having a mass asymmetry similar to that of the projectile-target system (red circles). The ridge separating the two valleys is found using the immersion method and is shown as a black curve. The shapes along the fusion valley are highly asymmetric with 0.5–0.6 for but become less asymmetric for smaller (see Fig. 2).
During the approach stage, while still well separated, the nuclei interact only via the Coulomb potential, which is shown for two spheres in Fig. LABEL:fig:epot1d as dashed green curves. However, when the nuclei come close, the nuclear interaction will start to have effect and it is energetically more favourable to develop a neck. This occurs at the contact elongation (shown as black arrows in Fig. LABEL:fig:epot1d).
The neck radius along the fusion path is shown in Fig. 3, where the neck is seen to develop at =4.6 and 5.1 for the reactions 50Ti+208Pb and 58Fe+208Pb, respectively. This rapid increase in neck radius is also in agreement with the “neck zip” concept discussed in the FBD model swiatecki03:a ; swiatecki05:a . The nuclear interaction leads to a substantial lowering of the potential energy. The shapes at contact and shortly after are also displayed in Fig. 3 and it can be seen how the neck formation causes a dramatic shape change of the projectile-like part, from being nearly spherical to having a large prolate deformation. Similar changes of the elongation of the projectile was found in the investigation of fusion barriers in Ref. ichikawa05:a .
The development of the optimal shapes along the fusion path is illustrated in Fig. 4. While the target-like part retains a constant and slightly oblate shape, the projectile-like part acquires a substantial and variable prolate shape, with that of the titanium-like part building up quickly and that of the iron-like part deforming more gradually.

The numerical calculations have been performed for different values of excitation energy and angular momentum . The excitation energy of the compound nucleus is given by
| (1) |
where is the relative kinetic energy and
| (2) |
with , , and being the masses of projectile nucleus, target nucleus, and corresponding compound nucleus, respectively. The masses are calculated within the same macroscopic-microscopic model that is used to obtain the potential-energy surfaces moller04:a .
Generally, the resulting compound nucleus inherits the angular momentum brought in by the colliding projectile-target system. To a good approximation, this can be taken into account by adding a centrifugal potential, leading to an effective potential
| (3) |
where is the rigid-body moment of inertia perpendicular to the symmetry axis. The rotational term corresponds to an increase of the potential energy at smaller relative to larger . For example, for =60 in 50Ti+208Pb, the centrifugal potential is 5.8 MeV at contact, while it is 9.9 MeV at the fission saddle.
III Dynamics
After establishing contact, the two colliding nuclei continue their inward relative motion while experiencing a frictional force that gradually converts the relative kinetic energy into intrinsic excitation. After this early drift-dominated stage has brought the relative motion to a halt, the further shape evolution takes on a diffusive character in the full 5D shape space. The system may then eventually become as compact as the ground-state shape inside the inner barrier (which we shall denote as fusion) or it may re-divide into two fragments (which is denoted as QF).
Section III.1 describes the contact configurations. Then the drift stage is discussed in Sec. III.2 and the diffusive stage is presented in Sec. III.3.
III.1 Contact
In order for the nuclei to come into contact, they first have to overcome the Coulomb barrier in the two-body channel. On the approach towards contact, vibrations and transfer channels are activated. These processes effectively lead to a distribution in barrier heights, described by an average barrier height and a width . Adopting this procedure, with the parameters derived from experiment and discussed in Refs. siwek04:a ; cap11:a , we calculate the capture cross section as a function of energy, . Following Ref. cap11:a , we use a sharp cut-off in angular momentum, assuming full transmission up to , , and zero above, ,
| (4) |
where is the reduced wavelength, .
Figure 5 shows the resulting maximum angular momentum as a function of the excitation energy of the compound nucleus for 50Ti+208Pb. Its monotonic increase is steeper for energies near the average Coulomb barrier height MeV.

III.2 Drift dynamics
At contact the neck quickly develops and the radial friction sets in. The inward motion then slows down as the associated kinetic energy is being dissipated into intrinsic excitation energy. We assume that the system drifts in the radial direction along the fusion valley without exploring other shape changes. For each value of the lattice site with the lowest energy is determined and the separation between the mass centers of the two parts is calculated, with the shape having been divided according to the determined value of the asymmetry . A smooth function is then obtained through a linear fit of these discrete values along the fusion valley. Therefore, although the fusion path is one dimensional, the separation coordinate depends on all five shape parameters.
The equation of motion for the separation is calculated with the one-dimensional Langevin equation
| (5) |
containing the conservative force exerted by the effective potential , the friction force governed by the strength , and the associated random force with strength . The stochastic variable is drawn from a standard normal distribution. Furthermore, is the reduced mass of the projectile and target.
While the friction strength is negligible before contact, it increases rapidly thereafter. We approximate by the radial component of the one-body window friction tensor blocki78:a which represents the dissipative effect of nucleon exchanges between the two collision partners,
| (6) |
where is the nucleon mass, is the nucleon number density in nuclear matter, and is the average nucleon speed. Insertion of the standard values MeV/, , and yields
| (7) |
where the scaling parameter makes it possible to study the sensitivity of the results to the friction strength. Unless otherwise indicated, the calculations have been carried out for .
As noted above, the neck radius increases quickly as the system moves past touching (see Fig. 3), so the friction strength , being proportional to , has a quite strong dependence on . For the cases considered, it quickly increases to about after contact and, as decreases further, it continues to increase to about at where 4.9 fm.
At the separation the intrinsic excitation energy of the evolving system is given by
| (8) |
where the kinetic energy associated with the radial motion is and the effective potential is . The corresponding intrinsic temperature is given by , where is the Fermi-gas level-density parameter. In accordance with the fluctuation-dissipation theorem, this quantity governs the magnitude of the random force in equilibrium through .
However, the finite relative motion enhances the fluctuations, an effect that can be taken into account by means of an effective temperature randrup79:a ,
| (9) |
where the exciton energy is the typical amount of energy dissipated in each nucleon transfer and the average is over all possible transfers. To a good approximation, i.e. within 2%, can be obtained as
| (10) |
where MeV is the Fermi energy bohr69:a . The strength of the random force in Eq. (5) is then
| (11) |

With the initial conditions
| (12) |
where is the kinetic energy in the radial direction at contact, the Langevin simulation along the fusion valley is continued until the radial speed has decreased to the mean equilibrium speed given by the equipartition theorem . The directed inward motion has then effectively stopped and the diffusive evolution takes over (see Sec. III.3). The corresponding elongation coordinate is obtained from the linear fit between and along the fusion valley. The other four shape parameters are then determined by the fusion valley.
When the energy is increased, the inward motion proceeds further and decreases. Figure 6 shows the stopping elongation for the reactions 50Ti+208Pb (a) and 58Fe+208Pb (b) and for three different values of the friction scaling parameter in Eq. (7). The average values are at the center of the shaded bands which have a width equal to the dispersion of the distribution for that energy, . If no kinetic energy remains at contact, there is no inward drift and (marked with black arrows). Because the present model does not describe tunneling, the energy has to be higher than the barrier for a reaction to occur. This is indicated by the shaded gray region in Fig. 6.
While a higher initial energy thus results in more compact stopping configurations (smaller ), a stronger friction causes the inward motion to stop earlier, thus resulting in a larger value of .
III.3 Diffusion dynamics
From the stopping configuration , where the collective velocity has become negligible, the system can diffuse in all five shape parameters. In the limit of strong dissipation considered here, the Langevin equation then reduces to the Smoluchowski equation in which there is no kinetic energy and the various forces balance out abe96:a . The shape evolution then has the character of Brownian motion and can be simulated as a random walk on the multidimensional potential-energy surface randrup11:a . Such simulations are carried out here with the Metropolis method using the energy-dependent effective level density of Ref. randrup13:a that accounts for the gradual disappearance of the local shell and pairing effects as the energy is raised.
A given walk is stopped and registered as a formation event if its elongation reaches that of the ground-state. While the fission saddle shape at (see Fig. LABEL:fig:epot1d) is typically mass symmetric, the diffusive evolution will generally evolve toward compact shapes having mass asymmetries closer to the initial asymmetry. However, once inside the saddle point, the walks will diffuse towards the compound nuclear ground state and the evolution becomes quasiergodic.
More often, though, a walk may lead towards larger elongations and an eventual division of the system into two fragments. Such a QF event is assumed to occur if the neck radius becomes smaller than 1.5 fm albertsson21:a .
Examples of walks are displayed in Fig. 7 for the reaction 50Ti+208Pb at MeV and =0. The color contours show the total number of visits to sites with specified elongation and mass asymmetry in Metropolis walks leading either to fusion (a) or to QF (b). The respective probabilities for these event classes are calculated to be 28% and 72%. A typical trajectory is shown for each case, with a black solid circle marking their starting point (located at ) and the arrows indicating their general direction. There is a large concentration of visits near the starting point due to the presence of a minor local minimum in the fusion valley, apparent in Fig. LABEL:fig:epot1d(b). The fusion trajectories retain a relatively large mass asymmetry, even for elongations where there is only a very low ridge protecting the shape from diffusing into the fission valley. However, after their elongation has shrunk to that of the ground state, the further diffusion leads the shape towards the actual ground-state shape which has . Those trajectories that do diffuse over the ridge and into the fission valley have practically no chance of getting back over the fission barrier towards more compact shapes and they therefore end up as QF events.

IV Results
The dynamical calculations described above are carried out for a range of angular momenta . For a given energy and a particular the formation probability is calculated as the number of formation events divided by the total number of events,
| (13) |
For each energy and angular momentum we simulate events. For a given energy, reactions having a higher angular momentum will come to a stop further out in , because the effective potential energy from the contact elongation and inwards grows ever steeper at larger . As a consequence, the subsequent diffusion process will be less likely to lead to compact shapes and the formation probability will thus decrease as is increased.
An effective formation probability can be obtained by averaging over all angular momenta up to the maximum value (see Fig. 5), weighting each by the geometric factor ,
| (14) |
Figure 8 shows for the reaction 50Ti+208Pb at various energies. For each energy, , 20 and 40 MeV, the contribution to is shown by the shaded region. This should be compared to the corresponding area under the line which represents a 100% formation probability. The ratio between these two areas, which thus constitutes the effective formation probability in Eq. (14), decreases with increasing energy, with the values being 0.285, 0.270, 0.128, respectively. These values may be compared to the formation probabilites for , which are found to be 0.286, 0.276, 0.162, respectively. Thus, the inclusion of angular momentum implies a decrease in the formation probability of only 0.3%, 2.2%, and 21.0%, respectively. This shows that in our calculations, there is a much higher sensitivity to the excitation energy, and a rather weak dependence on the angular momentum.

Figure LABEL:fig:form_tot shows the calculated effective formation probability as a function of energy for the four considered reactions. We note that the data of Naik et al. naik07:a for 50Ti+208Pb exhibit a maximum in the formation probability at MeV. The data of Banerjee et al. banerjee19:a , which represent the upper limit of the formation probabilities, instead show a steady decrease with energy.
Because the model does not include tunneling, formation is only possible if the total energy is sufficient to allow the system to move up the fusion valley and over the inner saddle. The corresponding thresholds in are 12.6, 10.6, 9.2, and 6.7 MeV for the four reactions, respectively. For all four cases, the formation probability initially increases steeply above the threshold energy and then reaches a maximum at MeV, followed by a moderate decrease. This behaviour arises from the competition between two effects. As the energy is increased, the early inward motion stops at ever more compact shapes, thereby increasing the probability that the subsequent diffusive evolution succeeds in forming a compound nucleus. However, it also becomes ever easier for the shape to find more favorable paths on the potential-energy landscape and cross the ridge from the fusion valley to the fission valley, leading to QF and thus decreasing the formation probability. As already noted, the angular momentum does not have a significant effect on these results.
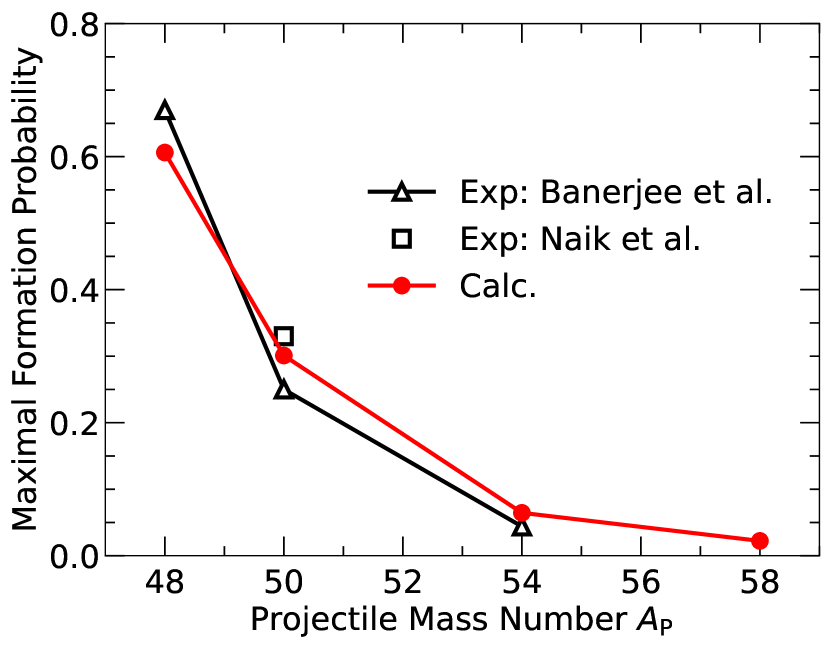
In Fig. LABEL:fig:form_tot it is seen that the formation probability decreases as the projectile mass is increased. The calculated maximal formation probability is shown in Fig. 10 versus the projectile mass, together with the available data. Ranging from about 60 percent for 48Ca to just a few percent for 58Fe, the calculated values agree very well with the measured results. The large formation probabilty for 48Ca is partly due to the contact configuration being relatively compact and partly due to the slightly downward sloping potential energy in the fusion valley as one moves towards smaller values of (see Fig. LABEL:fig:epot1da). Both of these effects cause the early inward motion to proceed further, so the diffusion process starts at more compact shapes and therefore needs fewer steps to form a compound nucleus. For heavier projectiles, the contact configuration becomes more elongated and a gradual steeper upward slope in the fusion valley (see Fig. LABEL:fig:epot1d) leads to a steady reduction in the maximal formation probability.
At higher energies, from about 40 MeV and up, the calculated formation probabilities increase steadily. This is due to the increasing temperature and the associated disappearance of the shell and pairing effects which allows the diffusion process to explore larger regions of the deformation parameter space, thereby also making it easier to attain more compact shapes, counted as fusion events. However, the walks that do venture inside the inner saddle would relatively quickly cross the saddle again and proceed towards QF, so an equilibrated compound nucleus is less likely to form. Still, the comparison to the data of Ref. banerjee19:a is meaningful, because the shapes in the registered formation events have temporarily been very compact. During such a compact stage, the memory of the original direction of the symmetry axis will be lost and, upon separation, the angular distribution will then be that of a fusion-fission event. However, in experimental attempts to produce SHN, the increased formation probability at high energies will be of little importance because the very excited compound system will promptly fission and the event will be registered as fusion-fission.
While the formation probability generally decreases when the friction is stronger, the overall behavior of the curves in Fig. LABEL:fig:form_tot is rather insensitive to the friction strength (governed by the parameter ), The underestimate of the measured formation probability with the projectile 48Ca (a) could be remedied by reducing the friction strength. Note, however, that the data points of Ref. banerjee19:a are upper limits. In turn, the overestimate obtained with 54Cr (c) could be remedied by using a slightly stronger friction strength. Such adjustments of the friction strength are well within the current uncertainty on the nuclear dissipation.
V Summary and discussion
We have calculated the probabilities for compound-nucleus formation in several reactions with 208Pb within the Langevin framework for the nuclear shape evolution. After the colliding nuclei have come into contact, the early evolution is dominated by an inward motion during which initial radial kinetic energy is being dissipated. The system then continues its shape evolution in a diffusive manner, until it either reaches the region of compact shapes near the ground state or redivides in a QF process.
The shape of the evolving system is described in the three-quadratic-surfaces parametrization. The associated 5D table of the effective potential-energy surface includes shell and pairing effects that subside as the energy is raised. During the early stage, the relative motion of the two parts of the system is subject to the one-body window friction while the subsequent diffusive shape evolution is simulated as a random walk in the shape parameter space. While no parameters were adjusted, it was studied how the results depend on the dissipation strength. Comparison with the experimental data suggests that it might increase with increasing system size.
Relative to previous treatments of SHN formation (see Refs. zagrebaev08:a ; cap22:a ) several refinements have been made. The full dynamical process from contact to formation or separation is followed, with the starting shape for the diffusive evolution being affected by energy-dependent nuclear structure effects obtained with well-established models moller09:a . The evolution of the system is obtained by Monte Carlo event-by-event simulation, which allows the extraction of a variety of correlation observables.
The calculated formation probabilities compare very well with available data, as illustrated in Figs. LABEL:fig:form_tot and 10. As the energy is increased, two opposite effects give rise to a maximum in the formation probability: 1) at higher energy the early inward evolution leads to more compact shapes which increases the chance for the subsequent shape diffusion to reach the compact region inside the fission barrier and thus form a compound nucleus; 2) the higher energy also makes a larger shape domain accessible to the diffusive evolution, thereby facilitating the crossing of the ridge towards the fission valley, hence decreasing the formation probability. At even higher energies shell and pairing effects gradually subside and it becomes ever easier to enter the region of very compact shapes. However, as the ground-state minimum then becomes less pronounced, any compact shapes will quickly grow more elongated and proceed to fission, thus being ineffective for SHN formation.
The gradual decrease in formation probability with increasing projectile mass (see Fig. 10) was understood as being partly due to the fact that heavier projectiles lead to more elongated contact configurations and partly due to the changes in the slope of the potential energy along the fusion path (see Fig. LABEL:fig:epot1d).
Earlier studies with a diffusion-based model zagrebaev08:a show a steady increase of formation probability with energy. It was therefore suggested in Ref. banerjee19:a that diffusion is not the main mechanism that drives SHN formation in fusion reactions with 208Pb nuclei. This was addressed in the extended FBD model cap22:a where the decrease in formation probability with increasing energy was attributed to suppression of contributions of higher partial waves in the reactions. In contrast, the present results display only a marginal effect of the angular momentum. The decrease in formation probability with excitation energy seems instead to occur because more favorable QF paths become accessible in the potential-energy landscape.
There have been indications that multi-nucleon transfer and energy dissipation play a significant role already before contact is reached cook23:a . This would result in a lower remaining kinetic energy at contact and therefore more elongated shapes at the start of the diffusive stage. The effect might be effectively emulated by an increase in the friction strength. Multi-nucleon transfer would also result in a distribution of ratios in the two reaction partners at contact; this degree of freedom is not yet taken into account.
Generally, the formation of the compound system requires the
diffusive shape evolution to pass over the inner barrier.
However, at energies only slightly above the threshold energy,
shell and pairing effects in the saddle region
may modulate the transmission probability
because of the structure in the local density of states.
In particular,
the absence of excited states between 0 and 2 quasiparticle states
is enhanced by the relatively large value of the pairing correlation
in the barrier region, resulting in a non-monotonic energy dependence
of the formation probability.
This is
an effect similar to the undulating behavior of the symmetric fragment yield
in actinide fission, as discussed theoretically in Ref. Ward17
and also observed experimentally Chadwick11 ; Glendening81 .
One might thus expect such structure effects to appear
in the energy dependence of the formation probability
just above the threshold energy.
Acknowledgements.
The project was supported by the Knut and Alice Wallenberg foundation (KAW 2015.0021). M.A. was supported by the Swedish Research Council under grant number 2022-00223 and J.R. was supported in part by the Office of Nuclear Physics in the U.S. Department of Energy’s Office of Science under Contract No. DE-AC02-05CH11231. The computations were enabled by resources provided by the National Academic Infrastructure for Supercomputing in Sweden (NAISS) and the Swedish National Infrastructure for Computing (SNIC) at LUNARC.References
- [1] Special Issue on Superheavy Elements, edited by Ch.E. Düllman, R.-D. Herzberg, W. Nazarewicz, and Y. Oganessian, Nucl. Phys. A944, 1 (2015).
- [2] Proceedings of the Nobel Symposium NS160, Chemistry and Physics of Heavy and Superheavy Elements, edited by D. Rudolph, L.-I. Elding, C. Fahlander, and S. Åberg, EPJ Web of Conferences 131 (2016).
- [3] W.J. Świa̧tecki, Phys. Scr. 24, 113 (1981).
- [4] W.J. Świa̧tecki, Nucl. Phys. A376, 275 (1982).
- [5] S. Bjørnholm and W.J. Świa̧tecki, Nucl. Phys. A391, 471 (1982).
- [6] K. Banerjee, D.J. Hinde, M. Dasgupta, E.C. Simpson, D.Y. Jeung, C. Simenel, B.M.A. Swinton-Bland, E. Williams, I.P. Carter, K.J. Cook et al., Phys. Rev. Lett. 122, 232503 (2019).
- [7] K. Godbey and A.S. Umar, Frontiers Phys. 8, 40 (2020).
- [8] V.I. Zagrebaev and W. Greiner, Nucl. Phys. A 944, 257 (2015).
- [9] W.J. Świa̧tecki, K. Siwek-Wilczyńska, and J. Wilczyński, Acta Phys. Pol. B 34, 2049 (2003).
- [10] W.J. Świa̧tecki, K. Siwek-Wilczyńska, and J. Wilczyński, Phys. Rev. C 71, 014602 (2005).
- [11] M. Albertsson, Nuclear fission and fusion in a random-walk model, Doctoral dissertation, Lund University, 2021. ISBN: 978-91-7895-869-6. https://portal.research.lu.se/en/publications/nuclear-fission-and-fusion-in-a-random-walk-model
- [12] J.R. Nix, Nucl. Phys. A 130, 241 (1969).
- [13] P. Möller, A.J. Sierk, T. Ichikawa, A. Iwamoto, R. Bengtsson, H. Uhrenholt, and S. Åberg, Phys. Rev. C 79, 064304 (2009).
- [14] M. Albertsson, B.G. Carlsson, T. Døssing, P. Möller, J.Randrup, and S. Åberg, Eur. Phys. J. A 56, 46 (2020).
- [15] T. Ichikawa, A. Iwamoto, P. Möller, and A.J. Sierk, Phys. Rev. C 71, 044608 (2005).
- [16] P. Möller, A.J. Sierk, and A. Iwamoto, Phys. Rev. Lett. 92, 072501 (2004).
- [17] K. Siwek-Wilczyńska and J. Wilczyński, Phys. Rev. C 69, 024611 (2004).
- [18] T. Cap, K. Siwek-Wilczyńska, and J. Wilczyński, Phys. Rev. C 83, 054602 (2011).
- [19] J. Blocki, Y. Boneh, J.R. Nix, J. Randrup, M. Robel, A.J. Sierk, and W.J. Swiatecki, Ann. Phys. 113, 330 (1978).
- [20] J. Randrup, Nucl. Phys. A327, 490 (1979).
- [21] A. Bohr and B.R. Mottelson, Nuclear structure, vol. I (Benjamin, NY, 1969).
- [22] Y. Abe, S. Ayik, P.-G. Reinhard, and E. Suraud Phys. Rep. 275, 49 (1996).
- [23] J. Randrup and P. Möller, Phys. Rev. Lett. 106, 132503 (2011).
- [24] J. Randrup and P. Möller, Phys. Rev. C 88, 064606 (2013).
- [25] M. Albertsson, B.G. Carlsson, T. Døssing, P. Möller, J.Randrup, and S. Åberg, Phys. Rev. C 103, 014609 (2021).
- [26] R.S. Naik, W. Loveland, P.H. Sprunger, A.M. Vinodkumar, D. Peterson, C.L. Jiang, S. Zhu, X. Tang, E.F. Moore, and P. Chowdhury, Phys. Rev. C 76, 054604 (2007).
- [27] V. Zagrebaev and W. Greiner, Phys. Rev. C 78, 034610 (2008).
- [28] T. Cap, M. Kowal, and K. Siwek-Wilczyńska, Phys. Rev. C 105, L051601 (2022).
- [29] K.J. Cook, D.C. Rafferty, D.J. Hinde, E.C. Simpson, M. Dasgupta, L. Corradi, M. Evers, E. Fioretto, D. Jeung, N. Lobanov, et al., Nat. Commun. 14, 7988 (2023).
- [30] D.E. Ward, B.G. Carlsson, T. Døssing, P. Möller, J. Randrup, and S. Åberg, Phys. Rev. C 95, 024618 (2017).
- [31] M.B. Chadwick et al., Nucl. Data Sheets 112, 2887 (2011).
- [32] L.E. Glendenin, J.E. Gindler, D.J. Henderson, and J.W. Meadows, Phys. Rev. C 24, 2600 (1981).