Formation mechanisms and fluorescence properties of carbon dots in coal burning dust from coal fired power plants
Abstract
Carbon dots (CDs) shows great application potential with their unique and excellent performances. Coal and its derivatives are rich in aromatic ring structure, which is suitable for preparing CDs in microstructure. Coal burning dust from coal-fired power plants can be utilized as a rich resource to separate and extract CDs. It has been shown in our results that there have two main possible mechanisms for the formation of CDs in coal burning dust. One is the self-assembly of polycyclic aromatic hydrocarbons contained in coal or produced by incomplete combustion of coal. The other mechanism is that the bridge bonds linking different aromatic structures in coal are breaking which would form CDs with different functional groups when the coals are burning at high temperature. Under violet light excitation at 310-340 nm or red light at 610-640 nm, CDs extracted from coal burning dust can emit purple fluorescence around 410 nm. The mechanism of up-conversion fluorescence emission of CDs is due to a two-photon absorption process. The recycling of CDs from coal burning dust from coal-fired power plants are not only good to protect environment but also would be helpful for mass production of CDs.
1. Introduction
Carbon dots (CDs) are zero-dimensional (0D) carbon-based nanomaterials discovered in 2004 [1]. They are composed of sp2/sp3 carbon skeletons and a variety of surface functional groups such as hydroxyl, carboxyl, carbonyl, and amino groups. The sizes of CDs are generally less than 10 nm and their cores usually consist of aromatic structures with sp2 hybridized carbon [2]. CDs exhibit high photoluminescent quantum yield and luminescence stability, along with good biocompatibility, low toxicity, excellent chemical inertia, low production cost, abundant raw materials, and environmental friendliness. These characteristics make CDs one of the emerging fluorescent materials poised to replace traditional organic fluorescent dyes and semiconductor quantum dots [3, 4]. Nowadays, CDs have attracted significant attention and shall be widely used in many fields such as optoelectronic devices, green lighting, biological imaging, cell labeling, drug delivery, cancer diagnosis and treatment, etc [2, 5, 6, 7, 8, 9, 10].
Coal and coal-based derivatives are known for their high carbon content, which is rich in aromatic structures and graphite microcrystalline. The organic part of coal contains aromatic and aliphatic compounds, with aromatic compounds forming the basic skeleton of coal [11]. Additionally, coal contains a large number of polycyclic aromatic hydrocarbons (PAHs), primarily derived from coal-forming precursors such as plant remains and microorganisms. Many research groups have explored using coal as a carbon source to prepare high-quality CDs due to coals aromatic structure and abundant resources [6, 12, 7, 13, 14, 15, 16, 17, 18, 19, 20, 21, 22, 23, 24]. The unique aromatic structure in coal offers advantages such as abundant raw materials and low cost compared to pure sp2 carbon allotropes like graphite for the preparation of CDs [25]. In 2016, Hu et al. proposed a facile, green, and inexpensive top-down strategy for producing fluorescent CDs from coal, avoiding the burden of tedious or inefficient post-processing steps and the risk of highly toxic gas release [6].
At present, coal is one of the most abundant energy resources in nature and is typically used as the main fuel for thermal power generation worldwide. During electricity generation from coal combustion, a mixture of flue gases is released, including CO, CO2, SO2, SO3, NO, NO2, toxic organic pollutant like PAHs, and particulate matter (PM) of various sizes, such as carbon black [26, 27]. The dust emitted from coal-fired power plants contains water-soluble carbon dots (CDs), water-insoluble black carbon, and inorganic components such as sulfates. However, current flue gas purification technologies are difficult to capture and control CDs with the size of a few nanometers. As a result, these particles are discharged into the atmosphere, causing environmental pollution without effective monitoring [28, 29]. The emission of particulate matter from coal burning is substantial due to the high number of coal-fired power plants. Because of their small particle size, large specific surface area, and high reactivity, CDs can easily adsorb heavy metals, microorganisms, and other toxic substances, which can directly enter the human alveoli and harm human health.
In previous studies, the precursors of CDs have mainly focused on various types of biomass and chemical reagents. The separation and extraction of CDs from coal-burning dust in coal fired power plants are rarely reported yet. In this study, CDs were separated and extracted from the smoke washing waste water obtained from coal-burning dust in a coal fired power plant. The formation mechanism, structural properties, and up-conversion and down-conversion fluorescence emission mechanisms of the CDs were examined. These CDs are of a few nanometers in size and exhibit good water solubility. Typically, coal burning dust are discharged into the atmosphere, which would contribute significantly to PM2.5 (sizes of PM 2.5 ) pollution because they contains large amounts of CDs with size of a few nanometers. Therefore, the investigating the formation mechanism and fluorescence properties of CDs in coal burning dust from coal-fired power plants holds significant research value and practical implications for resource utilization, environmental protection, and carbon neutrality. Meanwhile, there can also find a low-cost, non-polluting, and sustainable method to produce CDs using coal dust as a raw material.
2. Results and discussions
Figure 1 illustrates the primary mechanisms of CDs formation during coal combustion. As shown in Figure 1(a), PAHs condense and polymerize to form CDs with a carbon skeleton sheet created through sp2 hybridization. The self-assembly of PAHs, either originally present in coal or generated from its incomplete combustion, is one of the main mechanisms of CD formation during coal combustion [30, 31]. Another key formation mechanism of CDs occurs when coal burns at high temperatures of 700 1200 ∘C with breaking the bridge bonds which link the edges of microcrystalline fragments in coals [6, 11]. This process results in the formation of graphene fragments with functional groups at their edges, known as graphene quantum dots (GQDs) or CDs as depicted in Figure 1(b).


Figure 2 presents the TEM images which show the morphology and lattice fringes, as well as the corresponding diffraction pattern of CDs extracted from smoke washing wastewater discharged from the wet flue gas desulfurization system in the absorption tower of a coal fired power plant. The inset of Figure 2(a) shows that the size of CDs ranges from 1.5 nm to 3.5 nm, with an average diameter of 2.38 nm. Figure 2(b) clearly displays a crystal plane spacing of 0.24 nm in the conjugated sp2-domain of CDs, corresponding to the (1120) crystal plane of graphene [32]. The hexagonal diffraction pattern in Figure 2(c) corresponds to the six symmetrical crystal faces of the graphene sheets or graphite microcrystalline at the core of CDs, indicating aromatic structures in CDs with high crystallinity.
Figure 3 shows X-ray diffraction (XRD) patterns of (a) CDs with impurities and (b) purified CDs solution. Figure 3(a) reveals that the diffraction peaks of impurities in the CD solution correspond to NaCl (JCPDS file no. 99-0059) and CaSO42H2O (JCPDS file no.74-1904) crystals. Figure 3(b) displays two typical peaks at 22.04∘ and 44.58∘, corresponding to the (002) and (100) crystal planes of the graphitic structure, respectively [2]. The mechanism for the separation of CaSO42H2O crystals in the CD solution is as follows
| (1) |
The NaCl and CaSO42H2O crystals in CDs solution were removed by washing with distilled water several times [33, 34]. The masses of NaCl and CaSO42H2O crystals separated from CDs solution were measured using a precision balance. The combined mass of these crystals accounted for approximately 56.5% of the total mass of the CDs solution. Trace elements in the CD solution were measured using inductively coupled plasma (ICP)spectroscopy. The result shows that the CD solution contained 373.50 mg/L calcium, 394.23 mg/L sulfur, 44.32 mg/L sodium, 2.96 g/L iron, and 5.96 g/L of Plumbum. The mass ratio of calcium to sulfur is close to 1:1 with calcium being slightly less than sulfur. However, the molar ratio of Ca to S in CaSO42H2O crystal should be 1:1, implying a mass ratio of 5:4. This suggests the presence of a small amount of sulfite (H2SO3) in the CD solution, as indicated by the precipitation process in Equation 1. The pH of the CD solution is 6.4, with acidity arising from trace sulfite and nitric acid produced by the chemical reactions of O2 and NOx in the coal flue gas.
The Fourier-transform infrared (FT-IR) spectrum of the CDs is shown in Figure 4. The broad peak around 3456 cm-1 corresponds to the stretching vibration of O-H [2]. The absorption at 2050 cm-1 is due to the stretching vibration of the -SCN group [35]. The strong peak at 1640 cm-1 is attributed to the stretching vibration of C=O [36]. The peak around 1380 cm-1 corresponds to the C-N stretching vibration [2]. The C-O stretching vibration appears at about 1120 cm-1 [37], and the absorption near 1090 cm-1 is due to the -COOH group [38]. Absorptions at 760 cm-1 and 655 cm-1 are attributed to the stretching vibrations of C-Cl and C-S, respectively [39, 40].


The X-ray photoelectron spectroscopy (XPS) analysis of the CDs is shown in Figure 5. The CDs are primarily composed of C(60.93%), O(29.82%), and N(3.69%), with small amounts of impurities such as Na, Cl, S, and Mg. The C1s peaks can be divided into four peaks corresponding to the bonds C-C/C=C (284.7eV, 36.47%), C-O (285.1eV, 38.35%), C-O/C-S(286.5eV, 15.49%), and C=O (288.5eV, 9.69%), respectively [41]. The O1s peaks can be divided into two peaks corresponding to the bonds C=O (532.2eV, 80.38%) and C-O (533.8eV, 19.62%) [42, 43]. The N1s peaks can be divided into three peaks corresponding to pyridinic N (399.1eV, 21.43%), pyrrolic N (400.0eV, 70.37%), and graphitic N-C3 (401.7eV, 8.19%) peaks [44, 45]. The Cl2p can be divided into three peaks: Cl 2p3/2 (198.5 eV, 26.09%), Cl 2p1/2 (199.8 eV, 48.52%) and Cl-C =O (201.3 eV, 25.39%) [46]. The S2p peak can be divided into two peaks corresponding to S-O (167.8 eV, 47.97%) and S=O (169.3 eV, 52.03%) [47]. The XPS results for impurities and functional groups in the CDs are consistent with the FT-IR results. Impurity elements such as Na, Cl, S, and Mg mainly originate from the coal. The Si element comes from the silicon substrate used to place the sample during the XPS measurement and is therefore excluded from the elemental composition of the CDs.
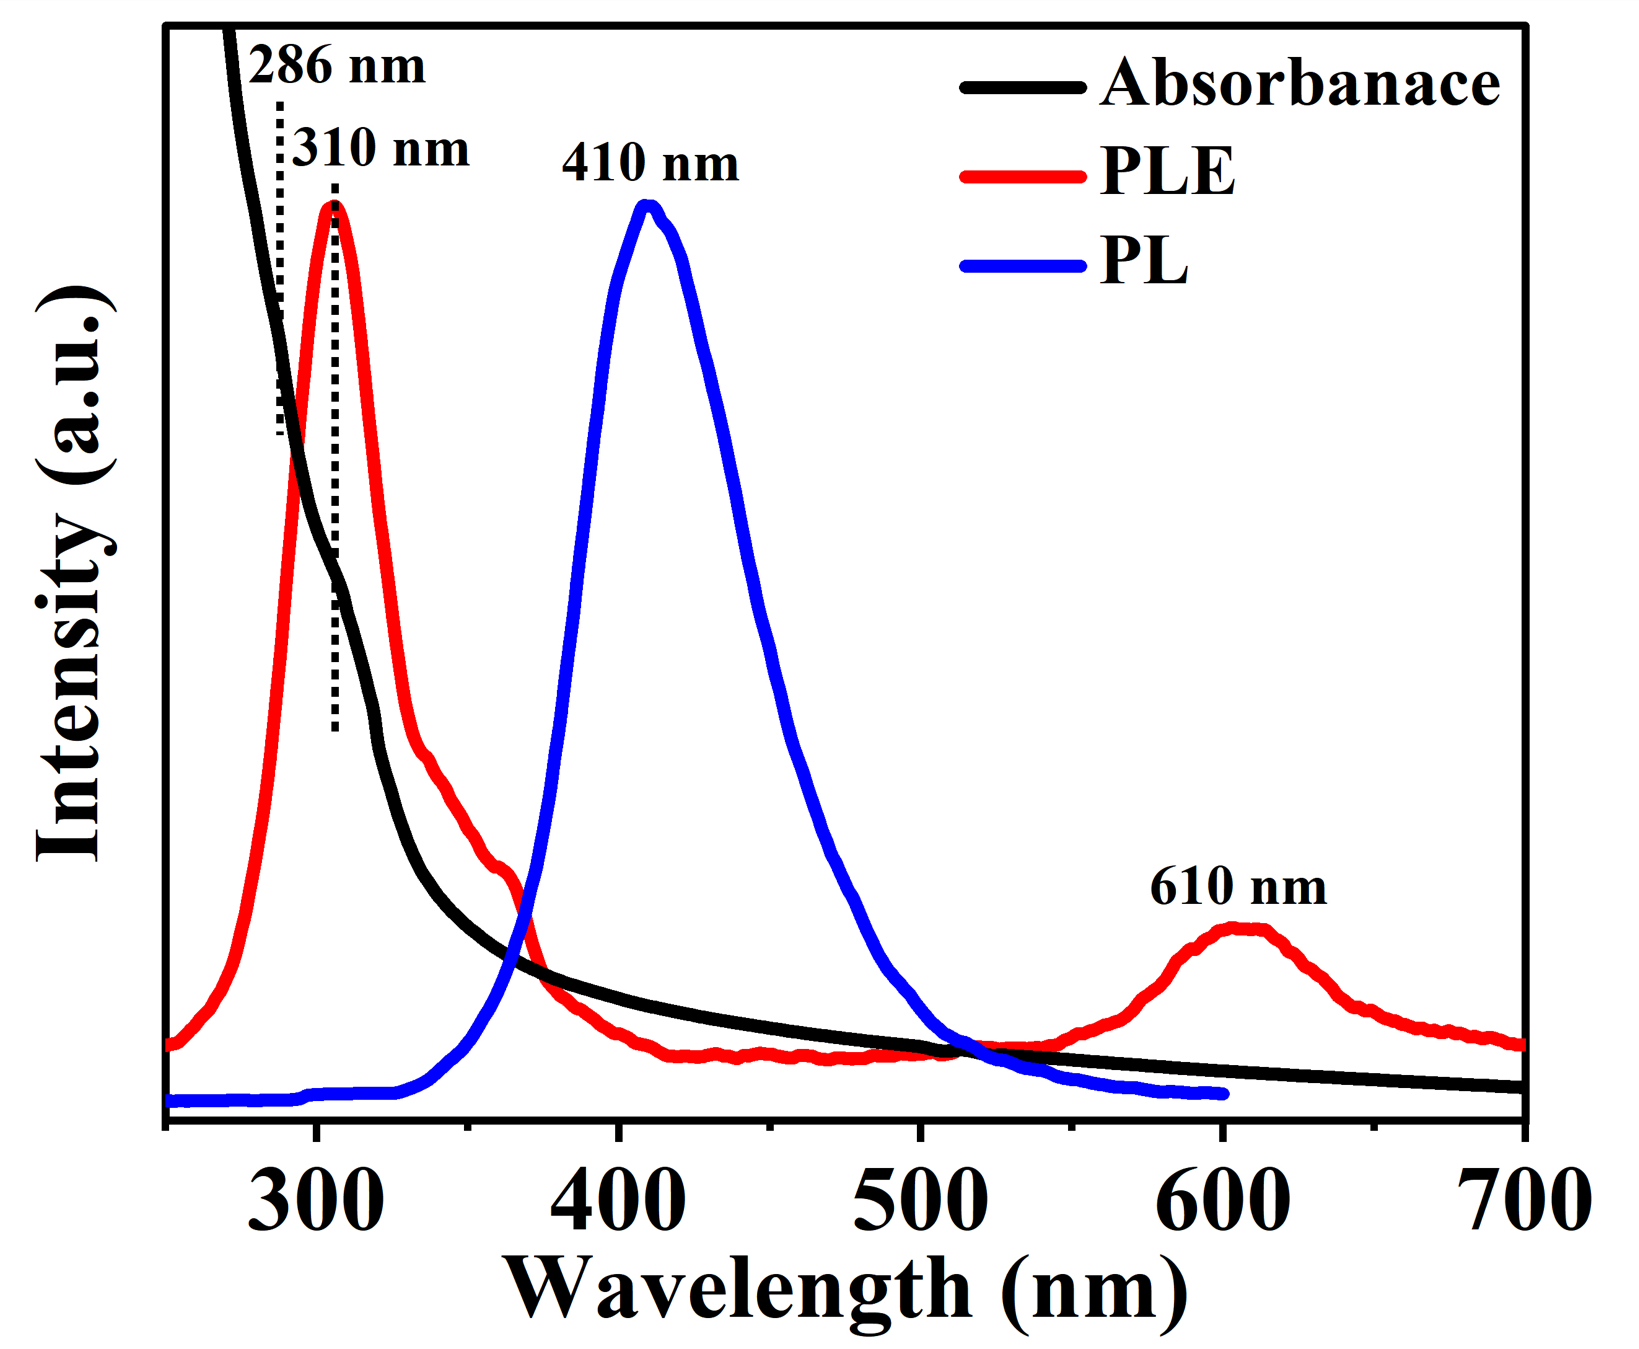
The black line in Figure 6 shows the ultraviolet-visible (UV-vis) absorption spectrum of the CDs. There are two typical wide absorption bands near 286 nm and 310 nm, with the band near 286 nm attributed to the transition of C=C, and and the absorption near 310 nm attributed to the transition of C=O on the surface of CDs [2]. With a fixed emission wavelength of 410 nm and scanned the excitation wavelength, the photoluminescence excitation spectrum (PLE) of CDs is given by the red curve in Figure 6. The PLE curve in Figure 6 indicates that CDs can emit fluorescence with a peak wavelength of about 410 nm when excited by photons with wavelengthes both of 310 nm and 610 nm. The blue curves in Figure 6 is PL spectrum with a excitation wavelength of 310 nm. The PL and PLE spectra reveal that the fluorescence around 410 nm has two excitation peaks which a strong down-conversion excitation peak at 310 nm and a weak up-conversion excitation peak at 610 nm.
In Figure 7 we give the 2D contour plot of PL spectrum of CDs which implies that fluorescence emission at wavelength 410 nm has two electronic transition channels. One type of photoluminescence is down-conversion photoluminescence (DCPL), which corresponds to transitions of the C=O bond. Another type is up-conversion photoluminescence (UCPL), which involves electronic transitions caused by continuous photon absorption coupled with the stretching vibration of the C=O bond [48]. CDs contain a variety of impurities or surface groups which makes them possessing a variety of surface states. Consequently, such CDs are more likely to have up-conversion and down-conversion fluorescence emissions due to the high probability of metastable states.
Figure 8(a) shows the up-conversion and down-conversion photoluminescence (PL) spectra of CDs. As can be seen, CDs can emit purple-blue fluorescence around 410-417 nm excited by red light with wavelengths of 610 nm, 620 nm, 630 nm, and 640 nm, respectively. For the excitation wavelengths at 310 nm, 320 nm, 33 nm, and 340 nm, the photoluminescence peak is located around 410-420 nm. With the increasing of excitation wavelength, the emission peak wavelengths of the up-conversion photoluminescence (UCPL) and the down-conversion photoluminescence (DCPL) have a red-shift of about 10 nm, as shown by the red arrow and the yellow arrow in Figure 8(a). The red-shifts of UCPL and DCPL can be understand with the help of Figure 9. Because CDs have multiple surface state levels, the photon energy emitted from the electronic transitions from different surface state levels to the ground state would be different. It is interesting that the emission peak wavelengths for both UCPL and DCPL of CDs are around 410 nm, which indicates that both UCPL and DCPL emit photons through surface state luminescence at the same surface state energy levels. Figure 8(b) reveals PL spectra of CDs with different excitation light powers at a excitation wavelength of 610 nm. It’s shown that the fluorescence intensity of CDs increases slightly with increasing the excitation light power. From Figure 8(c) we can get an obvious quadratic linear relationship between the excitation power and the emission fluorescence intensity of CDs while the slope is about 2.11, which can clearly indicating that the UCPL mechanism of CDs is induced by two-photon excitation (TPE) [50, 49]. Through the inset in Figure 8(c), we can clearly see the UCPL phenomenon in CDs.
The mechanisms of DCPL and UCPL can be understood with the help of Figure 9. For the DCPL case, when the CDs are illuminating by photons with wavelengths of 310-340 nm (photon energy of about 4 eV), the electrons on C=O bonds would occur transitions as shown by the blue arrows. Subsequently, the excited electrons move to the surface state energy levels through non-radiative processes represented by dashed black arrows and combine with holes in the ground state (n) with emitting the blue-purple fluorescence with wavelengthes of 410-420 nm. For the case of UCPL, when CDs are irradiated by the light with wavelengthes of 610-640 nm (with photon energies around 2 eV), the electron in the ground state (n) absorbs a photon and jumps up to one of intermediate energy levels induced by impurities or surface groups of CDs shown by black dashed lines, and then the electron in intermediate energy levels could absorb another photon with the same energy and transit to band [48]. Subsequently, the electron moves to the surface state levels with a non-radiative transition process represented by dashed black arrows and recombine with holes on the ground state (n) with emitting fluorescence around 410-420 nm. This process can be regarded as two step photon absorption from the ground state to the excited state through a virtual middle energy level. Moreover, DCPL is more stronger than UCPL because the probability of single-photon absorption is greater than two photon absorption [49, 50] in CDs .


Calculation of fluorescence quantum yield (QY). At a UV excitation wavelength of 310 nm, the fluorescence quantum yield of CDs can be calculated using quinine sulfate as the standard sample by using a combined FLSP fluorescence lifetime and steady-state fluorescence spectrometer equipped with integrating sphere (Edinburgh Instruments, UK). The formula for calculating the QY of fluorescence is given by
| (2) |
where is the quantum yield of the fluorescence for a standard sample for reference. and are the integrated emission intensities of the CDs sample and the standard sample, respectively. and are respectively the absorbance of the prepared sample and standard sample at the same excitation wavelength. and are respectively the refractivity of the prepared sample and standard sample. It is calculated that the QY for DCPL of CDs is about 3.6%.
The fluorescence decay life is further studied by measuring the time-resolved fluorescence spectrum of CDs. The fluorescence decay curve of CDs in Figure 10 can be well fitted with two exponential functions through
| (3) |
where is the background PL intensity and , and , are the fractional contributions to PL emission from three transition channels with corresponding decay time or lifetime.
The average fluorescence lifetime can be calculated through [51]
| (4) |
According to the above Equation 4, the fluorescence lifetime of CDs can be calculated as follows: = 2.067 ns (99.9684%), = 8.382 ns (0.0316%), and the average fluorescence lifetime of CDs is = 2.088 ns. The lifetime of 2.088 ns is attributed to the surface state in CDs [52] as evidenced by the absorption of C=O in Figure 4. The UCPL fluorescence mechanism of CDs is closely related to the functional groups on their surfaces.
3. Conclusions
In summary, we proposed a method to separate and extract CDs from the coal-burning dust of coal-fired power plants and identified two primary mechanisms for their formation. One mechanism involves the self-assembly of PAHs contained in coal or produced by its incomplete combustion, leading to the formation of CDs. Another mechanism involves the breaking of bridge bonds linking different aromatic structures in coal at high temperatures, resulting in CDs with various surface functional groups. Our research demonstrates that these CDs have good water solubility and exhibit up-conversion fluorescence behavior. The up-conversion fluorescence mechanism is likely a two-photon absorption process. Both of up-conversion and down-conversion processes can emit fluorescence at the same wavelength. CDs extracted from coal-burning dust can emit purple-blue fluorescence at wavelengthes around 410 nm when excited by red light with wavelengthes of 610-640 nm or purple light with wavelengthes of 310-340 nm. The fluorescence quantum yield at an excitation wavelength of 310 nm is about 3.6%, and the average fluorescence lifetime is 2.088 ns which belongs to surface state luminescence. This study indicates that CDs extracted from coal-burning dust possess excellent fluorescence properties. Recycling CDs from coal-burning dust not only helps protect the environment and turns waste into treasure but also facilitates the mass production of CDs at a low cost and are beneficial to achieve carbon neutrality.
4. Experimental Section
Materials: CDs have good water solubility and most of them in the dust of coal fired power generation are dissolved into the smoke washing wastewater discharged by the dust cleaning system such as absorption tower. In this study, the smoke washing wastewater discharged from wet flue gas desulphurization system in the absorption tower from Yunnan Huadian Kunming Power Generation Co., Ltd. was used as raw material to collect the CDs in the coal dust. The deionized water used in the experiment was produced by Master-S15 deionized water production machine of Shanghai Hetai Instrument Co., LTD.
Preparation: Coal-based CDs were separated and extracted from the smoke washing wastewater by the procedures such as membrane filtration, centrifugation, dialysis, and concentration treatment. The specific steps are as follows. Firstly, the smoke washing wastewater is filtered through a multistage membrane to eliminate large impurity particles. 2000 mL filtered liquid is transferred to a beaker to heat at 70-80 ∘C for 3-5 hours and then let it cool to room temperature. The concentrated samples were dispersed in 30 mL deionized water. Subsequently, the solution was put into an ultrasonic dispersion instrument for oscillating 30 min and be centrifuged for 10 min by high speed centrifuge at a speed of 12000 RPM. The supernatant was taken and filtered by a 0.22 m syringe filter membrane to obtain transparent liquid. Then, this solution undergoes dialysis using MD44-500 Da membranes in water for 24 hours. Finally, the dialyzed solution was concentrated to 20 mL and the CDs sample was obtained.
Characterization: The morphology and micro-structure of CDs were characterized by using the transmission electron microscopy (Tecnai G2 TF30, USA) with 300 kV acceleration voltage. The X-ray diffraction (XRD) patterns were obtained by Rotating target X-ray polycrystalline diffractometer (RIGAKUTTRIII-18KW, Japan). The infrared absorption spectrum of CDs was measured by a Fourier transform infrared spectrometer (Nicoletis10, USA).The X-ray photoelectron spectroscopy (XPS) of CDs were measured by using PHI5000 Versa Probe II 51 photoelectron spectrometer with 1486.6 eV Al Kα. The UV-Vis absorption spectra were measured by a UV-Vis spectrophotometer (Specord200, Germany) and the fluorescence spectrum of was measured by a fluorescence spectrometer F9818012 (Shanghai lenguang technology Co., LTD). A combined fluorescence lifetime and steady-state fluorescence spectrometer (Edinburgh Instruments, UK) was used to measure the fluorescence decay curve at room temperature.
Acknowledgements
This work was supported by the National Natural Science foundation of China (NSFC) (Grants No. 12064049, No. 62175209, No. U2230122, No. U2067207, No. 12364009, and No. 12004331), Yunnan Provincial Science and Technology Department (Grants No. 202301AT070120, No. 202301AU070127), Yunnan University (Grant No. CY22624108), Xingdian Talent Plans for Young Talents of Yunnan Province (Grant No. XDYC-QNRC-2022-0492), and Shenzhen Science and Technology Program (Grant No. KQTD20190929173954826).
Conflict of Interest
The authors declare no conflict of interest.
Data Availability Statement
The data that support the findings of this study are available from the corresponding author upon reasonable request.
Keywords
carbon dots, formation mechanism, fluorescence property, coal-fired power plants
References
- [1] X. Xu, R. Ray, Y. Gu, H. J. Ploehn, L. Gearheart, K. Raker, W. A. Scrivens, J. Am. Chem. Soc. 2004, 126, 12736.
- [2] P. Li, S. Xue, L. Sun, X. Zong, L. An, D. Qu, X. Wang, Z. Sun, Light Sci. Appl. 2022, 11, 298.
- [3] J. Yu, X. Yong, Z. Tang, B. Yang, S. Lu, The Journal of Physical Chemistry Letters 2021, 12, 7671.
- [4] Z. Wang, F. Yuan, X. Li, Y. Li, H. Zhong, L. Fan, S. Yang, Adv. Mater. 2017, 29, 1702910.
- [5] K. Akbar, E. Moretti, A. Vomiero, Adv. Opt. Mater. 2021, 9, 2100532.
- [6] S. Hu, Z. Wei, Q. Chang, A. Trinchi, J. Yang, Appl. Surf. Sci. 2016, 378, 402.
- [7] M. Li, C. Yu, C. Hu, W. Yang, C. Zhao, S. Wang, M. Zhang, J. Zhao, X. Wang, J. Qiu, Chem. Eng. J. 2017, 320, 570.
- [8] Y. Zhang, K. Zhang, K. Jia, G. Liu, S. Ren, K. Li, X. Long, M. Li, J. Qiu, Fuel 2019, 241, 646.
- [9] S. N. Baker, G. A. Baker, Angew. Chem. Int. Ed. 2010, 49, 6726.
- [10] L. Zhou, J. Geng, B. Liu, Part. Part. Syst. Charact. 2013, 30, 1086.
- [11] T. Zhu, R. Wang, N. Yi, W. Niu, L. Wang, Z. Xue, Int. J. Coal Sci. Technol. 2020, 7, 19.
- [12] X. Chu, T. Chen, Y. Cao, Microchem. J. 2022, 177, 107255.
- [13] S. P. Sasikala, L. Henry, G. Yesilbag Tonga, K. Huang, R. Das, B. Giroire, S. Marre, V. M. Rotello, A. Penicaud, P. Poulin, ACS Nano 2016, 10, 5293.
- [14] Y. Zhang, K. Li, S. Ren, Y. Dang, G. Liu, R. Zhang, K. Zhang, X. Long, K. Jia, ACS Sustainable Chem. Eng. 2019, 7, 9793.
- [15] A. Kovalchuk, K. Huang, C. Xiang, A. A. Martí, J. M. Tour, ACS Appl. Mater. Interfaces 2015, 7, 26063.
- [16] S. K. Thiyagarajan, S. Raghupathy, D. Palanivel, K. Raji, P. Ramamurthy, Phys. Chem. Chem. Phys. 2016, 18, 12065.
- [17] X. Feng, Y. Zhang, RSC Adv. 2019, 9, 33789.
- [18] B. Geng, D. Yang, F. Zheng, C. Zhang, J. Zhan, Z. Li, D. Pan, L. Wang, New J. Chem. 2017, 41, 14444.
- [19] S. R. Singamaneni, J. van Tol, R. Ye, J. M. Tour, Appl. Phys. Lett. 2015, 107.
- [20] Y. Dong, C. Chen, X. Zheng, L. Gao, Z. Cui, H. Yang, C. Guo, Y. Chi, C.M. Li, J. Mater. Chem. 2012, 22, 8764.
- [21] C. Hu, C. Yu, M. Li, X. Wang, J. Yang, Z. Zhao, A. Eychmüller, Y.P. Sun, J. Qiu, Small 2014, 10, 4926.
- [22] S. Hu, X. Meng, F. Tian, W. Yang, N. Li, C. Xue, J. Yang, Q. Chang, J. Mater. Chem. C 2017, 5, 9849.
- [23] B. Zhang, H. Maimaiti, D.-D. Zhang, B. Xu, M. Wei, J. Photochem. Photobiol., A 2017, 345, 54.
- [24] S. Kang, K.M. Kim, K. Jung, Y. Son, S. Mhin, J.H. Ryu, K.B. Shim, B. Lee, H. Han, T. Song, Sci. Rep. 2019, 9, 4101.
- [25] R. Ye, C. Xiang, J. Lin, Z. Peng, K. Huang, Z. Yan, N.P. Cook, E. L. Samuel, C.-C. Hwang, G. Ruan, Nat. Commun. 2013, 4, 2943.
- [26] R.R. Anderson, D.V. Martello, P.C. Rohar, B.R. Strazisar, J.P. Tamilia, K. Waldner, C.M. White, W.K. Modey, N.F. Mangelson, D.J. Eatough, Energy fuels 2002, 16, 261.
- [27] J.-K. Choi, J.-B. Heo, S.-J. Ban, S.-M. Yi, K.-D. Zoh, Atmos. Environ. 2012, 60, 583.
- [28] S.A.M. Din, N.N.-H.N. Yahya, A. Abdullah, Pro-Soc Beh. Sci. 2013, 85, 92.
- [29] E.J. Highwood, R.P. Kinnersley, Environ. Int. 2006, 32, 560.
- [30] S. Xue, P. Li, L. Sun, L. An, D. Qu, X. Wang, Z. Sun, Small 2023, 19, 2206180.
- [31] L. Shi, B. Wang, S. Lu, Matter 2023, 6, 728.
- [32] D. Qu, M. Zheng, L. Zhang, H. Zhao, Z. Xie, X. Jing, R.E. Haddad, H. Fan, Z. Sun, Sci. Rep. 2014, 4, 5294.
- [33] X. Teng, C. Ma, C. Ge, M. Yan, J. Yang, Y. Zhang, P. C. Morais, H. Bi, J. Mater. Chem. B, 2014, 2, 4631.
- [34] J. Chen, X. Zhang, Y. Zhang, W. Wang, S. Li, Y. Wang, M. Hu, L. Liu, H. Bi, Langmuir 2017, 33, 10259.
- [35] X. Miao, X. Yan, D. Qu, D. Li, F.F. Tao, Z. Sun, ACS Appl. Mater. Interfaces 2017, 9, 18549.
- [36] J. Zhu, X. Bai, Y. Zhai, X. Chen, Y. Zhu, G. Pan, H. Zhang, B. Dong, H. Song, J. Mater. Chem. C 2017, 5, 11416.
- [37] G. Liu, B. Li, Y. Liu, Y. Feng, D. Jia, Y. Zhou, Appl. Surf. Sci. 2019, 487, 1167.
- [38] Q. Dang, Y. Sun, X. Wang, W. Zhu, Y. Chen, F. Liao, H. Huang, M. Shao, Appl. Catal., B 2019, 257, 117905.
- [39] D. Zhang, D. Chao, C. Yu, Q. Zhu, S. Zhou, L. Tian, L. Zhou, The Journal of Physical Chemistry Letters 2021, 12, 8939.
- [40] Y. Hu, Z. Yang, X. Lu, J. Guo, R. Cheng, L. Zhu, C.-F. Wang, S. Chen, Nanoscale 2020, 12, 5494.
- [41] Z. Wei, B. Wang, Y. Liu, Z. Liu, H. Zhang, S. Zhang, J. Chang, S. Lu, New J. Chem. 2019, 43, 718.
- [42] X. Yang, L. Ai, J. Yu, G.I. Waterhouse, L. Sui, J. Ding, B. Zhang, X. Yong, S. Lu, Sci. Bull. 2022, 67, 1450.
- [43] J. Liu, T. Kong, H. M. Xiong, Adv. Mater. 2022, 34, 2200152.
- [44] D. Sun, R. Ban, P.-H. Zhang, G.-H. Wu, J.-R. Zhang, J.-J. Zhu, Carbon 2013, 64, 424.
- [45] H. Ding, J.-S. Wei, H.-M. Xiong, Nanoscale 2014, 6, 13817.
- [46] Z. Zhu, P. Yang, X. Li, M. Luo, W. Zhang, M. Chen, X. Zhou, Spectrochim. Acta, Part A 2020, 227, 117659.
- [47] Q. Wang, S. Zhang, B. Wang, X. Yang, B. Zou, B. Yang, S. Lu, Nanoscale Horiz. 2019, 4, 1227.
- [48] H. Dong, L. Sun, C. Yan, Chem. Soc. Rev. 2015, 44(6):1608.
- [49] L. Jiang, H. Ding, M. Xu, X. Hu, S. Li, M. Zhang, Q. Zhang, Q. Wang, S. Lu, Y. Tian, H. Bi, Small 2020, 16, 2000680.
- [50] J. Wang, Z. Zhang, S. Zha, Y. Zhu, P. Wu, B. Ehrenberg, J. Y. Chen, Biomaterials 2014, 35, 9372.
- [51] H. Dang, L.-K. Huang, Y. Zhang, C.-F. Wang, S. Chen, Ind. Eng. Chem. Res. 2016, 55, 5335.
- [52] Y. Choi, B. Kang, J. Lee, S. Kim, G.T. Kim, H. Kang, B.R. Lee, H. Kim, S.-H. Shim, G. Lee, O.-H. Kwon, B.-S. Kim, Chem. Mater. 2016, 28, 6840.