Flux evolution and kinematics of superluminal components in blazar 3C345
Abstract
Context. The precessing jet-nozzle scenario previously proposed was applied to model-fit the kinematics of five superluminal components (C19, C20, C21, B5 and B7) of jet-B in blazar 3C345.
Aims. Based on a specific pattern for the precessing common trajectory of jet-B, the kinematic properties (including trajectory, coordinates, core separation and apparent velocity) were model-fitted and their flux evolution could be studied.
Methods. Through model-simulation of their kinematic behavior, the bulk Lorentz factor, viewing angle and Doppler factor were derived as continuous functions of time and the association of their flux evolution with their Doppler-boosting effect was investigated.
Results. The 43GHz light-curves of the five superluminal components can be well interpreted in terms of their Doppler effect. The close association of their flux evolution with the Doppler-boosting effect firmly validate our precessing nozzle scenario and support the traditional point-view that superluminal components are physical entities (traveling shocks or plasmoids) participating relativistic motion toward us at small viewing angles.
Conclusions. The model-simulation of kinematic behavior of superluminal components by using our precessing nozzle scenario with specific patterns (helical or ballistic) assumed for the precessing common trajectories yields the model-derived bulk Lorentz factor, apparent speed, viewing angle and Doppler factor as continuous functions of time, which are most applicable to study the connection of flux evolution with Doppler boosting effect for the superluminal components.
Key Words.:
galaxies: active – galaxies: jets – galaxies: nucleus – galaxies: individual 3C3451 Introduction
3C345 (z=0.595) is a prototypical quasar which has been detected in all
wavebands of the entire electromagnetic spectrum from radio/mm,
infrared/optical/UV and X-rays to high-energy rays
(Biretta et al. Bi86 (1986), Babadzhanyants et al. Ba95 (1995),
Schramm et al. Sch93 (1993), Moore & Stockman Mo84 (1984),
Wang et al. Wa04 (2004), Malina et al. Ma94 (1994),
Lobanov & Zensus Lo99 (1999), Schinzel et al. 2011b ,
Zensus Ze97 (1997), Ros et al. Ro00 (2000)).
It exhibits remarkable and violent multi-waveband variations and
its spectral energy distribution has been extensively monitored and
studied, yielding significant results on the physical properties of
the source. Studies of the correlation between the variabilities at
multi-frequencies (from radio to rays) play an important role.
3C345 is one of the firstly discovered quasar having a relativistic jet.
VLBI-observations have revealed its parsec structure and
monitored the kinematic behavior of superluminal components ejected
from the radio core (Qian et al. 1991a , 1991b , Qi96 (1996),
Qi09 (2009), Klare Kl03 (2003), Klare et al. Kl05 (2005), Steffen et al.
St95 (1995), Ros et al. Ro00 (2000), Schinzel et al. 2010a ,
Lobanov & Roland Lo05 (2005), Lobanov & Zensus Lo94 (1994),
Zensus et al. Ze95 (1995), Hardee Ha87 (1987)).
The flaring activities of the source at
multi-frequencies (from radio to -rays) are closely connected with
the ejection of superluminal components (e.g., Schinzel 2010b ).
VLBI-monitoring observations have also shown that the swing of the knot’s
ejection position angle could be periodic and caused by its
jet-precession. We have tried to interpret the VLBI-kinematics of
superluminal components in 3C345 in terms of a precessing jet-nozzle
scenario since early years (Qian et al. 1991a , 1991b ,
Qi96 (1996), Qi09 (2009)). Recently, Qian (2022a ) has tried to
make model simulations of the kinematic behavior for twenty-seven
superluminal components (measured during a 38 yr period) in detail.
It was found that these superluminal knots could be hypothetically separated
into two groups, which were ejected from a precessing double nozzle
(jet-A and jet-B), respectively. Based on this division a precession
period of 7.3 yr was derived for both the jet-nozzles.
In a recent paper (Qian 2022b ), the flux evolution of five
superluminal components (C4, C5, C9, C10 and C22) belonging to jet-A
was well explained in terms of their Doppler boosting effect combined with
the intrinsic flux variations of the components.
In this paper we present the results of modelfits to the flux evolution
for five superluminal components (C19, C20, C21, B5
and B7) belonging to jet-B. Before doing so, we firstly give a brief
description of the results obtained in the previous work for the five
components belonging to jet-A (Qian 2022b ), taking knot C9 as
a representative example.


-
•
Based on an assumed helical pattern of precessing common trajectory for jet-A the trajectory distribution of the superluminal components of jet-A is shown in Figure 1 (left panel) for different knots ejected at different precession phseses. It clearly demonstates both the swing of their ejection position angles and different curved tracks cooresponding to different ejection times, which have been successfully applied to modelfit the observed kinematics of the superluminal components of jet-A (Qian 2022a , 2022b ).
-
•
Generally, the superluminal knots moved along their precessing common trajectories in the inner-jet regions, while they moved along their own individual tracks in the outer jet regions. This transition of trajectory pattern occurred at different core distances for different knots. The apparent trajectory of knot C9 was measured extending to core distance of 4.16 mas, equivalent to a traveled distance Z106 mas=705 pc. Its entire trajectory is well fitted in terms of our precessing nozzle scenario as shown in Figure 1 (right). Particularly, its inner trajectory can be very well fitted by the precessing common trajectory pattern (Figure 2), corresponding to a precession phase =5.54+2 (or ejection time 1995.06) and extending to a core distance 1.25 mas, which is equivalent to a traveled distance Z44.8 mas=298 pc. The precessing common trajectory pattern assumed in the scenario for jet-A is also applicable to interpret the trajectories measured for other superluminal knots in jet-A (e.g. C4, C5, C7, C10–C13, C22 and C23; Qian 2022a , 2022b ).
-
•
The curved jet-axis and the helical pattern assumed for the precessing common trajectory of jet-A in our scenario result in prominent curvatures in the apparent trajectories of superluminal components (Fig.1, left panel). The remarkable trajectory curvature measured for knot C9 is very well model-fitted in our precessing nozzle scenario (Figure 2). Within =1.22 mas knot C9 moved along the precessing common track. Most of the observed data-points are located extremely well within the area delimited by the red and blue lines which indicate the trajectories calculated for the precession phases =5.540.31 rad (or 5% of the precession period). This distinctively demonstrates that the helical pattern assumed for the precessing common trajectory is appropriate and valid to describe the kinematic behavior of knot C9 and other knots (e.g., C4, C5 and C22; for knot C4, its common track extends to 1.14 mas, equivalent to a traveled distance of 267 pc). Moreover, the model-fits to the apparent trajectories of multi-knots imply the existence of both a precessing nozzle and a precessing common track of helical pattern.
-
•
For knot C9, its core distance , coordinates and are well fitted and shown in Figure 3 (upper two and bottom left panels). Both the model-derived apparent velocity and viewing angle as continuous functions of time shown in Figure 3 (bottom right panel) reveal prominent structural details. During the period of 1997–2005 exhibits a structure of acceleration/deceleration/re-acceleration/deceleration: (a) at 1997.44 (core separation =0.33 mas) =17.91 (a maximum) and =; (b) at 1998.77 (=0.88 mas) =11.44 (a minimum) and = (a minimum, corresponding to the maximal Doppler factor =31.86, see Figure 4 below); (c) at 2001.28 (=1.77 mas) =17.91 (a maximum) and =.
-
•
The bulk Lorentz factor and Doppler factor derived for knot C9 are shown in Figure 4. During the period of 1997.5-2001.4 the bulk Lorentz factor 18.5–18.0, while the Doppler factor has a smooth bump structure, which was completely caused by the change in the viewing angle, as shown in Figure 3 (bottom right panel). The maximal Doppler factor is 31.86 at 1998.77 (at =0.88 mas), coincident with the minimal viewing angle = and minimal apparent speed =11.44.
-
•
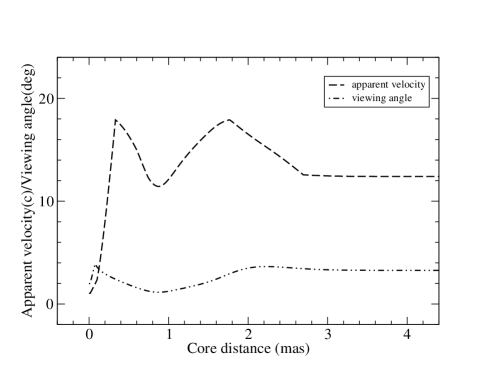
In order to compare our results with those obtained by Jorstad et al. (Jo05 (2005)) we show the apparent speed as a function of core distance for knot C9 in Figure 5. It exhibits a pronounced oscillating structure with two maxima (both =17.91) at core distances =0.33 mas and 1.77 mas, and a minimum =11.4 at =0.88 mas, corresponding to a minimal viewing angle =. In addition, the decreasing part (in the range of 1.2–1.8 mas) of the 43 GHz light curve measured by Jorstad et al. (Jo05 (2005)) for knot C9 can be well fitted by the Doppler boosting profile derived as a function of core distance in this paper as shown in Figure 6. Thus, we unexpectedly find that the model-simulated results obtained within the framework of our precessing nozzle scenario are fully consistent with the phenomena observed and analyzed by Jorstad et al. (Jo05 (2005)) as follows:
The change in apparent speed and the twisted trajectory are also pronounced for C9. Although the historically extrapolated position of C9 (using the average apparent speed of 15.6c) agrees well with the the measured position at epoch 1996.81 (Ros et al. 2000). It decelerates significantly from 20c near the core to 10c at 1 mas and then accelerates beyond 1.5 mas. The deceleration is accompanied by brightening of the knot and rotation of the EVPA by , making it almost perpendicular to the jet direction.
It is worth noticing that the rapid variations in its intrinsic flux density (or the steepening of the local spectrum at 43 GHz) resulted in the peaking stage of the flare not observed at 43GHz. Detailed model-fits to the light curves measured by Schinzel (2011a ) at 15, 22 and 43 GHz will be presented below in Figure 7. -
•
It should be emphasized that the bulk Lorentz factor , viewing angle and Doppler factor as functions of time were directly derived from the model fitting of the kinematics only, and the Doppler boosting effect () is purely predicted by the precesssing nozzle scenario. Thus, whether the predicted Doppler boosting profile can explain the flux evolution of superluminal knots in 3C345 would be a significant test for our precessing nozzle scenario. In the model-simulation the intrinsic flux density were adopted to be 3.83, 2.58 and 1.65 Jy for 15, 22 and 43 GHz, respectively. The spectral index was adopted as (15-22-43GHz)=0.80 ().
-
•
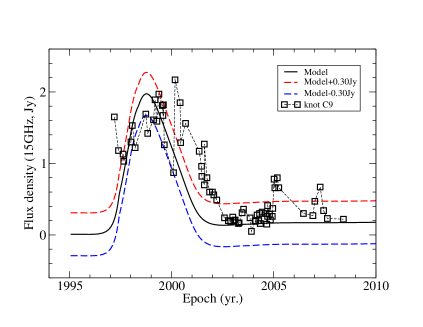
The light curves observed at 15, 22 and 43 GHz for knot C9 111Data are adopted from Schinzel (2011a ) only. are shown in Figure 7 (left panels). They exhibit very complicated structures with flux density fluctuations on short time-scales of 0.5 years, but the Doppler boosting effect having a time scale of 5 years (1996.5–2001.5) as predicted by our model-simulation can be explicitly discerned: (1) During both the rising (1997.0–1998.5) and decaying (1999.5–2001.0) stages the flux densities measured at 15 GHz are well fitted by the Doppler boosting profiles (solid black lines in Fig.7, right panels). Thus the model-predicted Doppler-boosting profiles can be regarded as correctly determined with its maximum at 1998.77, where the apparent speed and viewing angle are at minimum; (2) At both 22 and 43 GHz there are a few data-points are also fitted by the profiles during the rising satge (1997–1998); (3) The low flux densities measured at 43 GHz during 1998–1999 and measured at 22 GHz during the decaying stage (1999.5–2000.5) are obviously due to the intrinsic variations of knot C9. For example, during 1998–1999 the measured spectral index (15-43GHz)1.8 much larger than that ((15–43GHz)0.80) during both rising and decaying stages; (4) The fluctuations on time-scales of 0.5–1 years in flux density measured at 15, 22 and 43 GHz during 2001–2008 can also be interpreted in terms of the intrinsic variations of knot C9, because the Doppler boosting effect has diminished during that period. Thus in order to fully explain the flux evolution of superluminal components in 3C345 both intrinsic variations and Doppler boosting effect should be taken into account; (5) In Figure 7 (right panels) the dashed red and blue lines show the profiles deviating from the model-derived Doppler boosting profiles (solid lines in black) by 0.15 Jy (for 43 GHz) and 0.30 Jy (for 22 and 15 GHz). It can be seen that most of the measured data-points fall between the two lines, indicating that the model-fits to the measured light curves are successful.
The brief summary described above for the midel-fitting results of the
kinematic behavior and flux evolution for the superluminal components of
jet-A in 3C345 explicitly shows that our processing nozzle scenario is
most appropriate and valid to explain the kinematic, dynamic and emission
properties observed in the superluminal components of blazar 3C345.
In the following we shall investigate the flux evolution associated
with the Doppler boosting effect for five superluminal knots (C19, C20,
C21, B5 and B7) belonging to the jet-B of 3C345. As in
the previous work (Qian 2022b ) the observational data are adopted
from Schinzel (2011a ) and Jorstad et al. (Jo05 (2005)).
2 Geometry and model parameters
According to the precessing nozzle scenario proposed for 3C345 (Qian
2022a , 2022b ) the superluminal knots could be separated into
two groups (group-A and group-B) which were hypothetically assumed to
be related to a double-jet structure (jet-A plus jet-B), because the two
jets were found to be precessing with the same period of 7.3 yr, but
having different patterns of precessing common trajectory.
The geometry and model-parameters describing the precessing nozzle
scenario proposed for 3C345 have been discussed in detail in the previous
works (Qian 2022a , 2022b ). Here we only list the
main points of the scenario related to the investigation of the
kinematics of the superluminal knots of group-B as follows:
(1) Jet-axis
The direction of the axis of jet-B in space, around which superluminal knots
of group-B move, is defined by parameters and . The
jet-axis is assumed as:
| (1) |
where =, =, =1.0 and
p=1.34 are adopted.
(2) Amplitude and phase of trajectory
The amplitude and phase of the trajectory of superluminal
knots are defined as:
| (2) |
| (3) |
where represents the amplitude coefficient of the common trajectory pattern. =1.09 mas and =396 mas are adopted. is the precession phase of an individual knot, which is related to its ejection time :
| (4) |
where is the precession period of the jet nozzle.
The distribution of the precessing trajectories of the knots
is shown in Figure 8, displaying a bunch of straight-line trajectories,
which is completely different from that of the curved trajectories of the
knots in jet-A.

(3) Doppler boosting effect
In order to investigate the relation between the flux evolution of
superluminal components and their Doppler boosting effect during their
accelerated/decelerated motion and model-fitting of the measured
light curves, we define the Doppler boosting profile as
or
, where –the intrinsic
flux density of the knot, –Doppler factor and
–spectral index (in the frequency range of 10.7–43 GHz).
The observed flux density of the superluminal components
is Doppler-boosted:
| (5) |
= ,
–the flux density at the fiducial frequency . 222Here
in this paper we assume and are
constants, not depending on time and frequency. In general case both
and could be defined as functions of frequency and time.
Thus flux evolution of superluminal knots would be associated with
more complex Doppler-boosting effect.
(4) Cosmological model
We will apply the concordant cosmological model (Spergel et al.
Sp03 (2003), Hogg Ho99 (1999)) with =0.73 and
=0.27, and =71km. Thus the luminosity
distance of 3C345 =3.49 Gpc, the angular-diameter distance
=1.37 Gpc, 1 mas=6.65 pc and 1 mas/yr=34.6 c. 1 c is equivalent
to an angular speed 0.046 mas/yr in the rest frame.


3 Knot C19: Interpretation of kinematics and flux evolution
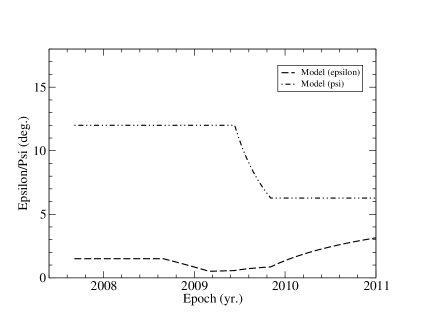
According to the precessing nozzle scenario for jet-B, knot C19 has its ejection time =2004.85 and corresponding precession phase =1.77+2. Its traveled distance Z(t) and parameters and are model-fitted as shown in Figure 9. Before 2008.87 = and =, knot C9 moved along the precessing common trajectory. The cooresponding traveled distance Z=14.6 mas=97.1 pc. After 2008.87 (core separation 0.26 mas or 0.25 mas) and started to change and knot C19 started to move along its own individual track, deviating from the precessing common track.
3.1 Knot C19: Model simulation of kinematics
The model-fitting results of the entire trajectory , core
separation and coordinates and for knot C19
are shown in Figures 10 and 11 They are all well fitted
because the transition between the common track in the inner jet region
and the individual track in the outer jet region has been
taken into account.
The model-derived apparent speed and viewing angle
as continuous functions of time are shown in Figure 12 (right
panel): has a prominent bump during 2007.5–2008.8
with its peak of 6.57 (at 2008.22), while
. The modeled bulk Lorentz factor
and Doppler factor as continuous functions of time
are shown in Figure 12 (left panel), also demonstrating a distinct bump
structure with =14.8 and =26.3.
3.2 Knot C19: Doppler boosting effect and flux evolution
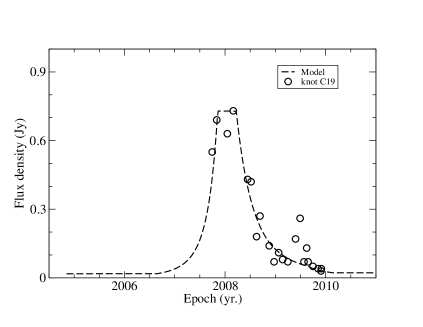
The light curve observed at 43 GHz and its corresponding normalized light curve are well fitted (Figure 13) in terms of the Doppler boosting profile and , respectively. A spectral index =0.40 and an intrinsic flux density =10.8Jy are adopted.


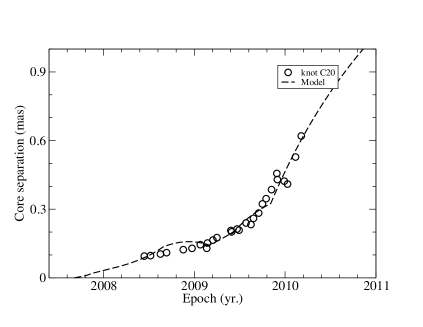


4 Knot C20: Interpretation of kinematics and flux evolution
According to the precessing nozzzle scenario for jet-B, the ejection time of knot C20 is =2007.68 and corresponding precession phase =4.20+2. Its traveled distance Z(t) and parameters and were model-fitted as functions of time as showm in Figure 14. Before 2008.66 = and =, knot C20 moved along the precessing common trajectory. The corresponding traveled distance Z=4.0 mas=26.6 pc. After 2008.66 (core separation 0.14 mas or coordinate mas) parameter started to change (parameter started to change after 2009.4) and its motion started to follow its own individual track, deviating from the precessing common track.
4.1 Knot C20: Model simulation of kinematics
The model-fitting results of the entire trajectory , core
distance , coordinates and for knot C20 are
presented in Figure 15 and Figure 16. They are all well fitted
because the transition between the common track in the inner jet region and
the individual track in the outer jet region has been considered.
The model-derived apparent speed and viewing angle
as continuous functions of time are shown in Figure 17 (left
panel). The apparent speed has two peaks at 2008.66 and 2009.44:
=9.57 and 7.50, respectively. The corresponding viewing angles
are = and .
The model-derived bulk Lorentz factor and Doppler
factor as continuous functions of time are shown in Figure 17
(right panel). Both have a peak at 2009.44, coincident with the second
peak in the apparent speed: =15.0 and =27.9.
4.2 Knot C20: Doppler boosting effect and flux evolution
The model fitting of the measured 43 GHz light curve and its corresponding normalized light curve are shown in Figure 18. Both are well model-fitted in terms of the Doppler boosting effect with an assumed spectral index at 43 GHz of =0.70 and an intrinsic flux density =16.2 Jy. The maximal flux density =3.63 Jy at 2009.44.


5 Knot C21: Interpretation of kinematics and flux evolution
According to the precessing nozzle secnario for jet-B the ejection time of knot C21 is =2007.32 and the corresponding precession phase =3.90+2. Its traveled distance Z(t) and modeled parameters and as continuous functions of time are shown in Figure 19. Before 2009.08 = and =, knot C21 moved along the precessing common track, which extends to the traveled distance Z=3.40 mas=22.6 pc. After 2009.08 (0.11 mas or 0.10 mas) parameter started to change (parameter started to change after 2009.40) and knot C21 started to follow its own individual track, deviating from the precessing common track. That is, the transition between the precessing common track and its individual track occurred at 0.10 mas.
5.1 Knot C21: model simulation of kinematics
The model-fitting results of the entire trajectory , and the core
seperation and coordinates and as
functions of time are shown in Figures 20 and 21. They are all
well fitted in both inner and outer jet regions.
The model-derived apparent speed and viewing angle
as functions of time are shown in Figure 22 (right panel),
Both exhibit three peaks at 2009.33, 2009.56 and 2009.76 with
=10.9, 8.4 and 10.2, respectively. The corresponding
viewing angles are =, and
, respectively.
The model-derived bulk Lorentz factor and Doppler factor
as continuous functions of time are shown in Figure 22 (left
panel). Both also show three peaks at 2009.40, 2009.56 and 2009.76 with
=16.50, 15.87 and 16.46, respectively. The corresponding Doppler
factor =29.43, 29.29 and 29.38, respectively. These peaks are
well coincident with the peaks in the measured light curve.
5.2 Knot C21: Doppler boosting effect and flx evolution
The model fitting results of the measured 43 GHz light curve and its corresponding normalized light curve are shown in Figure 23. It can be seen that the entire light curve with three peaks (2.62 Jy at 2009.40, 2.57 Jy at 2009.56 and 2.61 at 2009.76) is very well fitted in terms of the model-derived Doppler boosting profile with an assumed spectral index =0.70 and an intrinsic flux density =9.64Jy, indicating that the modeled Doppler boosting effect may dominate the complex flaring event and the intrinsic emission of knot C21 is quite stable.


6 Knot B5: Interpretation of kinematics and flux evolution
According to the precessing nozzle scenario for jet-B the ejection time of knot B5 is =2010.48 and the corresponding precession phase =0.33+4. Its traveled distance Z(t) and modeled parameters and as functions of time are shown in Figure 24. Before 2010.88 (0.015 mas) = and = knot B5 moved along the precessing common trajectory which extends to the traveled distance Z=0.60 mas=4.0 pc. After that epoch both and started to change and knot B5 started to follow its own individual track, deviating from the precessing common track. That is, the transition between the precessing common track and its individual track occurred very near to the core (at =0.015 mas) and the Doppler-boosting effect occurred completely in the outer jet regions.
6.1 Knot B5: Model simulation of kinematics
The model-fitting results of the entire trajectory and the core
separation , coordinates and as
functions of time are shwon in Figures 25 and 26. They are all
well fitted during the five years (2011.0–2016.0). The rapid
increase in core distance during 2012.8–2014.0 was mostly
induced by the increase in the viewing angle .
The model-derived apparent velocity and viewing angle
as continuous functions of time are shown in Figure 27 (left
panel). The maximal apparent speed =16.54 occurred
at 2011.28 and the corresponding viewing angle =,
=17.2 and =21.81.
The model-derived bulk Lorentz factor and Doppler factor
as continuous functions of time are shown in Figure 27 (right
panel). the maximal Lorentz factor =17.20 (during
2011.13–2011.28).
The maximal Doppler factor =25.21 at 2011.13 and the
corresponding viewing angle = ( a local minimum).
6.2 Knot B5: Doppler boosting effect and flux evolution
The model fitting results of the measured 43 GHz light curve and its corresponding normalized light curve are shown in Figure 28. The light curve of the radio burst measured during 2011–2011.4 is well fitted in terms of the Doppler boosting effect with an assumed spectral index =0.50 and an intrinsic flux density =12.9 Jy. The flux fluctuations observed during 2012.2–2014.2 may be due to the variations in the intrinsic flux density of knot B5.


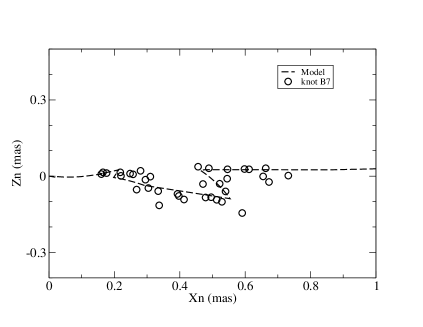


7 Knot B7: Interpretation of kinematics and flux evolution
According to the precessing nozzle scenario for jet-B the ejection time of knot B7 is =2011.60 and its corresponding precession phase =1.30+4. Its traveled distance Z(t) and the modeled parameters and as functions of time are shown in Figure 29. Before 2012.60 (0.036 mas) = and = knot B7 moved along the precessing common trajectory, extending to the traveled distance Z=2.0 mas=13.3 pc. After 2012.60 both parameters started to change and knot B7 started to move along its own individual track, deviating from the precessing common track. That is, the transition from the common track to its individual track occurred at =0.036 mas. Thus its flaring associated with the Doppler boosting effect completely occurred in the outer jet region.
7.1 Knot B7: Model simulation of kinematics
The model fitting results of the entire trajectory and the
core separation , coordinates and as
functions of time are shown in Figures 30 and 31. They
are all well fitted during the four years (2013–2016), especially
for the prominent decrease in the core distance near epoch 2016.
The model-derived apparent speed and viewing angle
as continuous functions of time are shown in Figure 32 (left
panel). The maximal apparent speed =15.15 at 2013.30.
The model-derived bulk Lorentz factor and Doppler factor
as continuos functions are shown in Figure 32 (right panel).
The maximal Doppler factor =27.16 occurred at 2013.30,
coincident with the maximal apparent speed. The
corresponding Lorentz factor =17.5 (a maximum) and
=.


7.2 Knot B7: Doppler boosting effect and flux evolution
The model fitting results of the measured 43 GHz light curve and its corresponding normalized light curve are shown in Figure 33. Both are well fitted by the Doppler-boosting profile and , respectively. An intirinsic flux density =28.0Jy and a spectral index =0.50 are adopted.
8 Conclusion
Based on the precessing nozzle scenario proposed for jet-B in 3C345
(Qian 2022a ) we have model-fitted the flux evolution of five
superluminal
components (C19, C20, C21, B5 and B7) associated with their kinematics
(accelerated/decelerated motion). Combining with the results for the five
superluminal knots (C4, C5, C9, C10 and C22) of jet-A (Qian 2022b ),
we have interpreted the flux evolution as caused by the Doppler boosting
effect for ten superluminal knots in 3C345.
In fact, similar studies can be made for more superluminal knots in 3C345:
e.g., knots C7, C11, C12 and C23 of jet-A and C15–C18, B8, B11
and B12 of jet-B.
In addition, we have also applied our precessing nozzle scenario to
investigate the flux evolution of superluminal components associated with
their Doppler boosting effect in QSO B1308+326 (Qian 2023a ) and
blazars 3C454.3 (Qian 2023b ) and 3C279 (Qian 2022b ). In
all these cases the flux evolution of the superluminal components can be
interpreted in terms of their Doppler boosting effect combined with their
intrinsic flux variations.
We would like to note that there are signicant
differences in the application of the
precessing nozzle scenario to QSOs and blazars. For QSOs [e.g., for
B1308+326 (Qian et al. Qi17 (2017), Qian 2023a ), PG1302-102
(Qian et al. 2018a ) and NRAO 150 (Qian Qi16 (2016))]
the precessing nozzle scenario has been
applied to study the model-fitting of the kinematics and flux evolution of
superluminal components ejected from a single precessing jet, while for
blazars [e.g., 3C345 (Qian 2022a , 2022b and this paper);
3C454.3 (Qian et al. Qi07 (2007), Qi14 (2014), Qi21 (2021),
Qian 2023b ); 3C279 (Qian Qi11 (2011), Qi12 (2012), Qi13 (2013),
2022a ); OJ287 (Qian Qi15 (2015), 2018b , Qi19 (2019),
Qi20 (2020))] a double jet structure (jet-A plus jet-B)
has been hypothetically introduced to study the kinematics and flux
evolution of their superluminal components, because their knots could be
separated into two groups (group-A and group-B) which need different
patterns of precessing common trajectory to fit their kinematics,
respectively.
It is worth noting the fact: Analysing the observational data in earlier
years (i.e. the observational data on the knots of group-A only), Klare
(Kl05 (2005)), Lobanov & Roland (Lo05 (2005)) and Qian et al.
(Qi09 (2009)) suggested 3C345 having a precessing jet, while analysing the
whole observational data on the knots of both group-A and group-B,
Schinzel et al. (2011a ) suggested no precession of the jet in 3C345.
Thus the separation of the superluminal knots
into two groups may be a plausible assumption for investigating the jet
precession in 3C345, otherwise we would have to relinquish the assumption
of jet precession for 3C345.
The full interpretation of the kinematics and flux evolution of
the superluminal components in 3C345 demonstrates that our precessing
nozzle scenario proposed for blazar 3C345 can interpret
the kinematic, dynamic and emission properties of its superlumiunal
components, although the assumption of a double jet structure is only
a working hypothesis.
We have been trying to propose a scenario with a single precessing
jet, as an significant alternative, to interpret the kinematics of
the superluminal knots in 3C345 as a whole, because there seems a
possibility that the knots of group-A and group-B can be combined into
one group. For example, we may assume that the trajectory-pattern
transition of the knots in the jet-B could occur at core distances
0.1 mas and their innermost tracks could connect with
the precessing common trajectory of jet-A at core distances
0.10–0.05 mas. In such a scenario
the observed tracks of the knots of group-B are only the outer
trajectories beyond their trajectory-transitions, while their innermost
tracks within the transitions (0.05–0.1 mas) have not been
observed. The trajectory-transition observed in the core-distance range of
0.1–0.4 mas in knot C8 (Qian 2022a ) is an extremely
instructive example. In this case the precession of the jet may be
related to the precession of the disk around the black hole in the nucleus
of 3C345. This kind of scenario with a single precessing jet nozzle
should be tested by the VLBI observations with higher resolutions in
the future.
References
- (1) Babadzhanyants M.K., Belokon E.T. & Gamm N.G., 1995, Astronomy Report 39, 393
- (2) Biretta J.A., Moore R.L. & Cohen M.H., 1986, ApJ 308, 93
- (3) Hardee P.E., 1987, ApJ 318, 78
- (4) Hogg D.W., 1999, astro-ph/9905116
- (5) Jorstad S.G., Marscher A.P., Lister M.L., et al., 2005, AJ 130, 1418
- (6) Klare J., 2003, Quasi-Periodicity in the Parsec-Scale Jet of the Quasar 3C345, PhD Thesis, Rheinische-Friedrich-Wilhelms-Universität Bonn, Bonn, Germany
- (7) Klare J., Zensus J.A., Lobanov A.P., et al., 2005, in ”Future Directions in High resolution Astronomy: The 10th Anniversary of the VLBA”, ASP Conference Series , Vol.340 (eds., J.D. Romney and M.J. Reid), p.40
- (8) Lobanov A.P. & Roland J., 2005, A&A 431, 831
- (9) Lobanov A.P. & Zensus J.A., 1999, ApJ 521, 509
- (10) Lobanov A.P. & Zenzus J.A., 1994, in Proc. Second EVN/JIVE Symposium, ed. A.J. Kus, R.T. Schilizzi, K.M. Borkovski & L.I. Gurvits, 93
- (11) Malina R.F., et al., 1994, AJ 107, 751
- (12) Moore R.L. & Stockman H.S., 1984, ApJ 279, 465
- (13) Qian S.J., Witzel A., Krichbaum T.P., et al., 1991a, Acta Astron. Sin. 32, 369 (Chin. Astro. Astrophys. 16, 137 (1992))
- (14) Qian S.J., Krichbaum T.P., Witzel A., et al., 1991b, in: High Energy Astrophysics: Compact Stars and Active Galaxies (Proceedings of the 3rd Chinese Academy of Sciences and Max-Planck Society Workshop, held 19-23, October 1990 in Huangshan, China, edited by Qibin Li, Singapore: World Scientific), p.80
- (15) Qian S.J., Krichbaum T.P., Zensus J.A., et al., 1996, A&A 308, 395
- (16) Qian S.J., Kudryavtzva N.A., Britzen S., et al., 2007, Chin. J. Astrophys. 7, 364
- (17) Qian S.J., Witzel A., Zensus J.A., et al., 2009, Research in Astron. Astrophys. 9, 137
- (18) Qian S.J., 2011, Research in Astron. Astrophys. 11, 43
- (19) Qian S.J., 2012, Research in Astron. Astrophys. 12, 46
- (20) Qian S.J., 2013, Research in Astron. Astrophys. 13, 783
- (21) Qian S.J., Britzen S., Witzel A., et al., 2014, Research in Astron. Astrophys. 14, 249
- (22) Qian S.J., 2015, Research in Astron. Astrophys. 15, 687
- (23) Qian S.J., 2016, Research in Astron. Astrophys., 16, 20
- (24) Qian S.J., Britzen S., Witzel A., et al., 2017, A&A 604, A90
- (25) Qian S.J., Britzen S., Witzel A., et al., 2018a, A&A 615, A123
- (26) Qian S.J., 2018b, arXiv e-prints, arXiv:1811.11514
- (27) Qian S.J., Britzen S., Krichbaum T.P., Witzel A., 2019, A&A 621, A11
- (28) Qian S.J., 2020, arXiv e-prints, arXiv:2005.05517
- (29) Qian S.J., Britzen S., Krichbaum T.P., Witzel A., 2021, A&A 653, A7
- (30) Qian S.J., 2022a, arXiv e-prints, arXiv:2202.01915
- (31) Qian S.J., 2022b, arXiv e-prints, arXiv:2206.14995
- (32) Qian S.J., 2023a, arXiv e-prints, arXiv:2306.05619
- (33) Qian S.J., 2023b, arXiv e-prints, arXiv:2306.06863
- (34) Ros E., Zensus J.A. & Lobanov A.P., 2000, A&A 354, 55
- (35) Schinzel F.K., 2011a, PhD thesis, University of Cologne
- (36) Schinzel F.K., Sokolovsky K.V., D’Ammando F., et al., 2011b, A&A 532, A150
- (37) Schinzel F.K., Lobanov A.P. & Zensus J.A., 2010a, in: Accretion and Ejection in AGNs: A Global View, ASP Conference Series, Vol.427 (2010), eds. L. Maraschi, G. Ghisellini, R. Della Ceca & F. Tavecchio
- (38) Schinzel F.K., Lobanov A.P., Jorstad S.G., et al., 2010b: in ”Fermi meets Jansky–AGN in Radio and Gamma Rays”, eds. T. Savolainen, E. Ros, R.W. Porcas & J.A. Zensus
- (39) Schramm R.-J., Borgeest U., Camenzind M., et al., 1993, A&A
- (40) Spergel D.N., Verde L., Peilis H.V., et al., 2003, ApJS 148, 145
- (41) Steffen W., Zensus J.A., Kirchbaum T.P., Witzel A., Qian S.J., 1995, A&A 302, 335
- (42) Wang J.M., Luo B., Ho L.C., 2004, ApJ 615, L9
- (43) Zensus J.A., 1997, ARA&A 35, 607
- (44) Zensus J.A., Cohen M.H., Unwin S.C., 1995, ApJ 443, 35