FinXABSA: Explainable Finance
through Aspect-Based Sentiment Analysis
Abstract
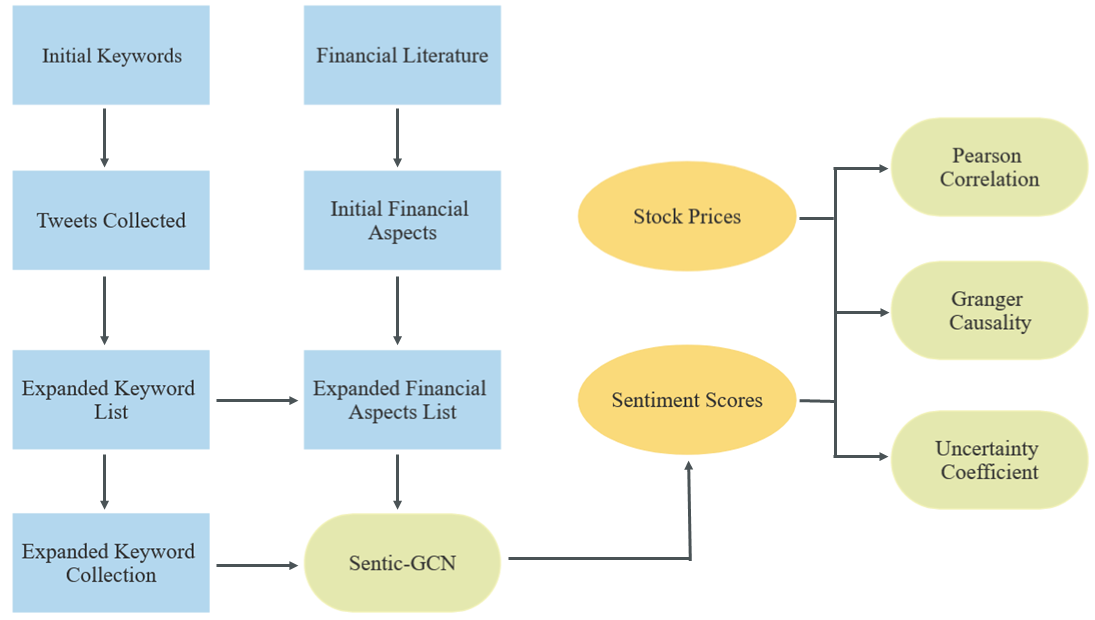
This paper presents a novel approach for explainability in financial analysis by deriving financially-explainable statistical relationships through aspect-based sentiment analysis, Pearson correlation, Granger causality & uncertainty coefficient. The proposed methodology involves constructing an aspect list from financial literature and applying aspect-based sentiment analysis on social media text to compute sentiment scores for each aspect. Pearson correlation is then applied to uncover financially explainable relationships between aspect sentiment scores and stock prices. Findings for derived relationships are made robust by applying Granger causality to determine the forecasting ability of each aspect sentiment score for stock prices. Finally, an added layer of interpretability is added by evaluating uncertainty coefficient scores between aspect sentiment scores and stock prices. This allows us to determine the aspects whose sentiment scores are most statistically significant for stock prices. Relative to other methods, our approach provides a more informative and accurate understanding of the relationship between sentiment analysis and stock prices. Specifically, this methodology enables an interpretation of the statistical relationship between aspect-based sentiment scores and stock prices, which offers explainability to AI-driven financial decision-making.
I Introduction
Given the increasing use of AI in finance, explainability has become crucial for transparency, trust, and accountability in financial decisions. Interpretable AI aids in spotting errors and biases, bolstering investor confidence and AI credibility [1]. This paper presents an explainable AI method for finance, merging aspect-based sentiment analysis (ABSA) with statistical techniques. After extracting financial aspects, we use the ABSA model from [2] to compute sentiment scores and analyze their correlation with specific stocks.
Our study addresses three core questions: the potential for significant explainable correlations through this framework, the application of Granger causality for robust correlations, and the use of the uncertainty coefficient to interpret financial aspect significance. Our results highlight key financial aspects impacting stock prices and establish intelligible and robust statistical relationships. The Pearson correlation with ABSA reveals an explainable link between financial aspect sentiment and stock prices, reinforced by the Granger causality test. The entropy-based uncertainty coefficient further pinpoints the most influential aspect sentiment scores for stock prices.
The paper is organized as follows: Section II investigates research in financial sentiment analysis; Section III focuses on data collection; Section IV delineates the model adopted; Section V explains our calculation of aspect sentiment scores; Sections VI, VII & VIII briefly describe statistical methods employed; Section IX highlights the main results; Section X outlines main discussion points; finally, Section XI discusses limitations and future research directions.
II Related Work
Sentiment analysis is a natural language processing (NLP) technique leveraging computational methods to determine the polarity or emotional tone expressed in a piece of text [3]. Different AI techniques have been leveraged to improve both accuracy and interpretability of sentiment analysis algorithms, including symbolic AI [4, 5], subsymbolic AI [6, 7], and neurosymbolic AI [8, 9]. Recent work on ABSA include [10], which combines multitask learning with ABSA, and [11], which adopts a meta-weighting strategy.
Finance-specific ABSA techniques used CNNs and transfer learning [12, 13]. Financial Sentiment Analysis (FSA) methods are more comprehensively covered in [14], and pertinent for investment. [15] emphasizes market news sentiment and company metrics for stock price forecasting, whereas [16] leverages technical indicators and social media sentiment. [17] and [16] highlight FSA’s utility for uncovering market trends. FSA and ABSA have progressed, but explainable sentiment analysis in finance (XFSA) is still emerging. Recent developments pave the way for improved explainability which can enhance FSA’s reliability in financial decisions. [18] combined sentiment and technical analysis for clear stock predictions. [19] introduced an interpretable neural net for FSA with a query-driven attention mechanism. [20] emphasized better interpretability using ABSA for Bitcoin text forecasting.
Separately, statistical methods have proven useful for uncovering the dependence between financial variables. Pearson correlation can gauge sentiment-stock price links, as demonstrated by [21]. Granger causality, discussed in [22], highlighted bi-directional causality between sentiment and the Chinese stock market [23]. Additionally, Pearson correlation and Granger causality have been jointly utilized in sentiment-stock price studies [24]. Uncertainty coefficients, highlighted by [25] and [26], reveal sentiment’s influence on stock returns during high information uncertainty.
III Data Collection
III-A Gathering Keywords via ‘Keyword Hopping’
Using a ‘keyword hopping’ framework, we began with the keywords ‘nasdaq stock market’ to gather tweets from Q4 2022, leveraging NASDAQ’s prominence with over 3,300 company listings. From approximately 11k tweets, we identified high-frequency keywords (above 100) [27], counting each word once per tweet. After filtering out overly specific or non-financial terms like tesla or cnbc, we added relevant financial keywords such as ‘sharemarket’, ‘stockstobuy’ [28]. The comprehensive keyword list is detailed in the next section.
III-B Twitter API
Tweets were collected via the Twitter API v2 with academic access from Q4 2022. Due to the sheer number of tweets from the Twitter full archive search, we collected the tweets from only the turn of the hour for every hour each day. We utilised the following keywords: stock market, Nasdaq, inflation, investors, friday sharemarket, monday sharemarket, china stock, china market, china economy, recession, Tuesday sharemarket, stock fall, thursday sharemarket, stock market, market rally, wednesday sharemarket, finance, economy, market closes, stock closes, financial market, sharemarket, stockstobuy, sharemarket drops, pandemic stock. In our keyword list, commas mean ‘OR’ and spaces mean ‘AND’ for Twitter API queries. We excluded retweets and limited tweets to English, collecting about 120k tweets for sentiment analysis.
III-C Stock Prices
We collected closing stock prices for six companies from Q4 2022, sourced from Yahoo Finance. Focusing on the rising significance of sustainable finance, we analyzed stocks from the sustainable energy sector, contrasting them with traditional energy. Traditional energy stocks are British Petroleum, Exxon, Shell, and sustainable ones are NextEra, Clearway, Brookfield Renewable. Each selected stock holds a significant market share. Stock prices of companies reflect their financial health and are watched by investors and analysts. Analyzing this data reveals market trends and company performance. Fluctuations offer insights into financial stability, growth, and market position, aiding investors and experts in decision-making. In essence, the data on closing stock prices is vital for gauging the market and the companies’ standings.
III-D Collecting financial aspects for Sentic GCN
| Economic | Stock Market | Financial Institution | Corporate |
|---|---|---|---|
| inflation | investors | finance | report |
| economy | market | financial | sales |
| recession | stock | rate | cost |
| china | trading | interest | tax |
| price | bank | ||
| stockmarket | |||
| bitcoin |
As explained later, a list of aspects (attributes or components of a sentence) is necessary for our task of ABSA. When working in the context of FSA, these aspects comprise lists of words used daily in the financial world, for example, “share”, “profit” or “risk”. An extensive list of aspects requires a large compilation of text data. Therefore, we exploit previous research in the FSA domain and draw upon the groundwork of [29], [30] and [31]. The justification for making use of these existing aspect lists is that of trusted statistical methods to generate these words, such as Non-negative Matrix Factorisation, Latent Dirichlet Allocation, and Principal Component Analysis, and annotations by experts in the field, with [29] sharing a similar goal to this paper.
Additionally, as these words contain significant financial meaning, utilising them for ABSA enhances explainability. While keeping the words derived from the aforementioned financial literature the overwhelming bulk of our aspect list, we add another 24 financially important keywords from ‘Keyword Hopping’ (III-A). Altogether, we assemble a list of 131 aspects to facilitate our analysis. Out of these, we focus on the 20 aspects that occurred most frequently in the text data (Table I).
IV Sentic GCN
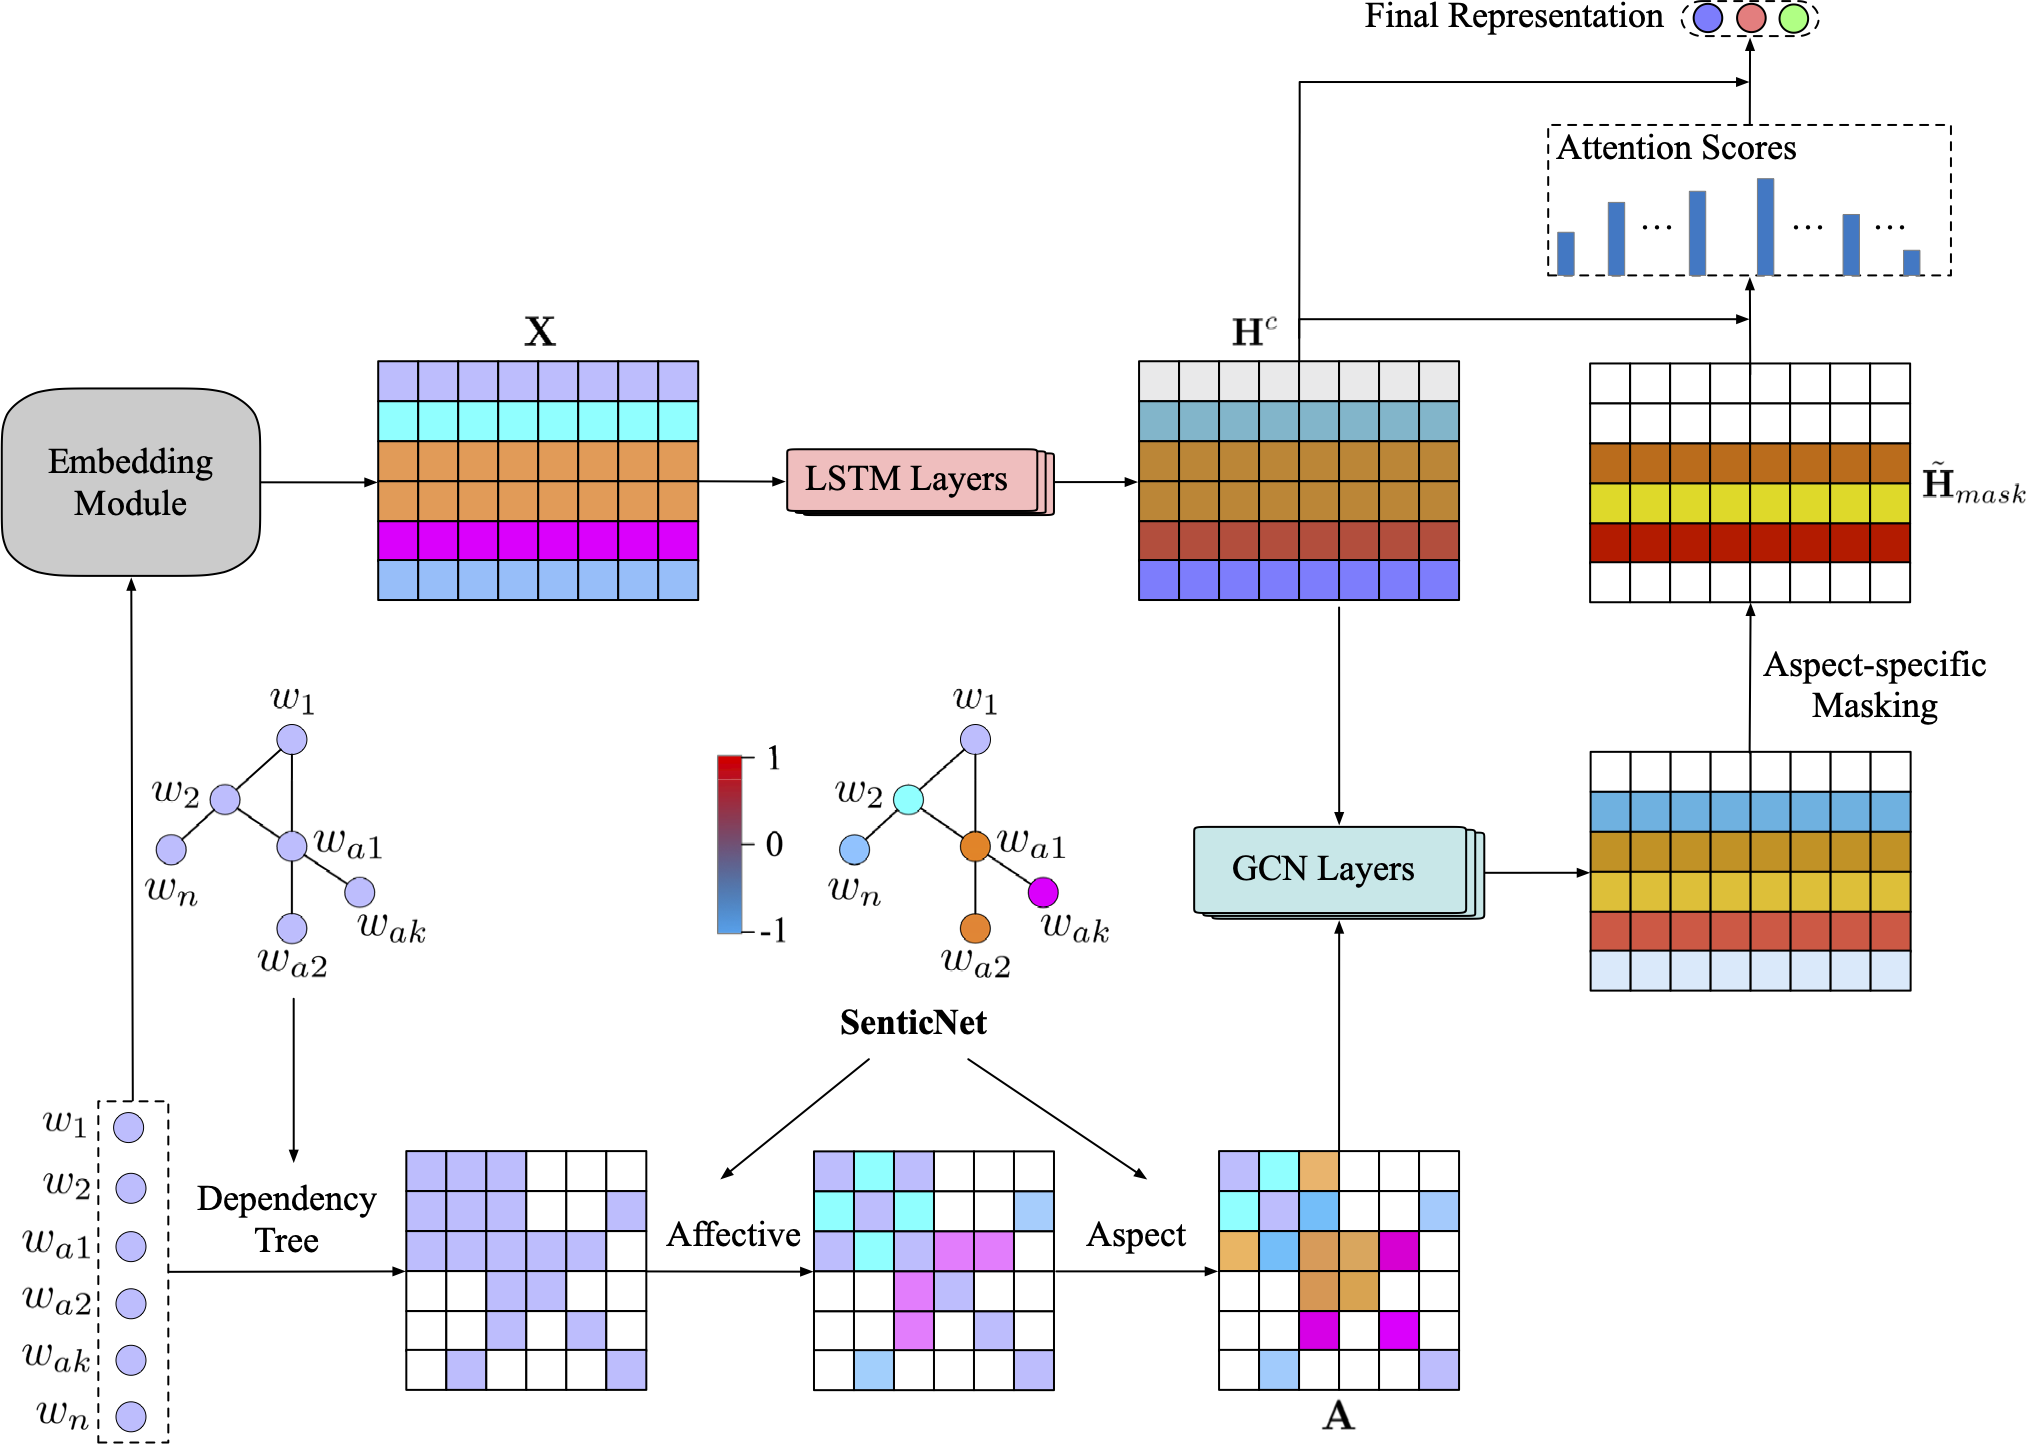
Sentic GCN [2] consists of two components, learning contextual representations and leveraging graph information. The first component is accomplished through LSTM layers, which derives latent contextual representations from the embedding matrix of each input sentence, while the second component entails utilising Graph Convolutional Network layers. These layers can express the potential sentiment dependencies of the contextual words by taking as input the hidden contextual representations, together with the matching affective enhanced graph.
Thereafter, the model merges the representations of these two elements in order to deduce, with respect to a particular aspect, the most substantial dependencies. This improves upon majority of graph-based models which only considered the syntactical information contained within a sentence. Sentic GCN prioritises words with strong aspect-related sentiment by capitalising on the contextual sentiment dependencies concerning the specific aspect. This is done since the feature of aspect-related sentiment is crucial in ABSA tasks and as such the model refines the sentence’s graph structure in an explicable manner. The entire process of the Sentic GCN model is illustrated in Fig. 2, where the final representation is the polarity of the different aspects of an input sentence. The depth of GCN layers is 2, L2 regularization coefficient is 0.00001, Adam learning rate is 0.001, and hidden state vectors have 300 dimensionality.
V Sentiment Scores
To compute the sentiment scores, Sentic GCN is employed on the collected tweets to label the sentiment of the collected financial aspects according to the polarities positive, neutral, and negative. We refer to absolute aspect sentiment scores as & . is the number of times an aspect is labelled positive for each day, while is the number of times an aspect is labelled negative for each day. is referred to as positive absolute aspect sentiment score while is referred to as negative absolute aspect sentiment score.
On the other hand, is the sum of positive, negative and neutral labels corresponding to an aspect for each day. We refer to normalised aspect sentiment scores as & . is computed by dividing with , while is computed by dividing with . is referred to as positive normalised aspect sentiment score while is referred to as negative normalised aspect sentiment score.
In our paper, can represent the different absolute aspect sentiment scores or normalised aspect sentiment scores (i.e. ). We also lag sentiment scores 1 day before stock prices before determining Pearson correlation, Granger causality & uncertainty coefficient. The motivation for this follows from [32], where lagging sentiment metrics behind stockprice has proven effective for reflecting price movements. Moreover we conduct statistical analyses only for the trading days of 2022 Q4.
VI Pearson correlation
We will now explain the notation for stock prices. We represent the companies in our analysis by their stock symbol (i.e. Shell (SHEL), British Petroleum (BP), Exxon (XOM), Brookfield Renewable (BEPC), Clearway (CWEN), Nextera (NEE)). As such, our notation for daily stock closing price will contain the stock symbol. For example, refers to the stock closing price of British Petroleum for the day, while refers to the closing price of Brookfield Renewable for the day. can represent the different stock closing prices (i.e. ).
The Pearson correlation test is conducted to obtain the coefficient , which measures the strength of linear relationship between two continuous variables. For our paper, we are conducting the correlation between sentiment scores lagged 1 day before stockpries. From equation (1), refers to the total number of {} pairs which is equivalent to the total trading days - 1 (due to the lag) of 2022 Q4.
| (1) |
VII Granger causality
The Granger causality test [33] highlights whether previous values of one variable encompasses data that helps predict another variable. In this paper, we will apply this test to uncover not only the forecasting ability of respective aspect sentiment scores for stock price prediction, but the interdependent relationship between these two variables. Particularly, we determine if the various aspect sentiment scores Granger cause the different stock prices. Our implementation of the Granger causality test is akin to the bivariate linear Granger causality test described in [34]. It is briefly explained below:
| (2) |
| (3) |
& can be the the time series of different sentiment scores, & different stock prices, respectively. , , & are the one-sided lag polynomials of a, b, c, d respectively, where L is the lag operator. & are the errors of regression. Granger causality is specifically tested via the F-test of exclusion restrictions, at the 0.05 significance level. Granger causes if the constituents in (that is, (i = 1, …, c)) are jointly significantly different from zero. Vice-versa, Granger causes if the constituents in , (i = 1, …, b)) are jointly significantly different from zero. Although we have shown the bivariate implementation of the Granger causality test, in our paper, we only highlight Granger Causality in the direction of Granger causes . Particularly, we show the results for lagged one day behind . This is the most relevant to our analyses.
VIII Uncertainty coefficient
To supplement Granger causality and Pearson correlation, which primarily detect linear relationships, the uncertainty coefficient (also known as Theil’s U or entropy coefficient) examines the statistical link between sentiment scores and stock prices without assuming linearity. This is crucial given the stock market’s potential non-linear behavior [35]. The coefficient quantifies the reduction in entropy in stock prices, , when aspect sentiment scores, , are known. Essentially, it gauges the information about a stock price provided by an aspect sentiment score, denoted as . We calculate this using equations from Henri Theil [36], detailed in (4), (5), and (6).
| (4) |
denotes the entropy of , which is given by:
| (5) |
denotes the conditional entropy of given the known value of , and this is given by:
| (6) |
& , where & are continuous variables, are entropy values that are derived through nearest neighbour entropy approximation methods from [37]. Entropy and therefore uncertainty coefficient will be determined with samples of & that we obtain from their respective time series, where is lagged one day before .
IX Implementation and Results
IX-A Correlation results for sustainable energy stocks
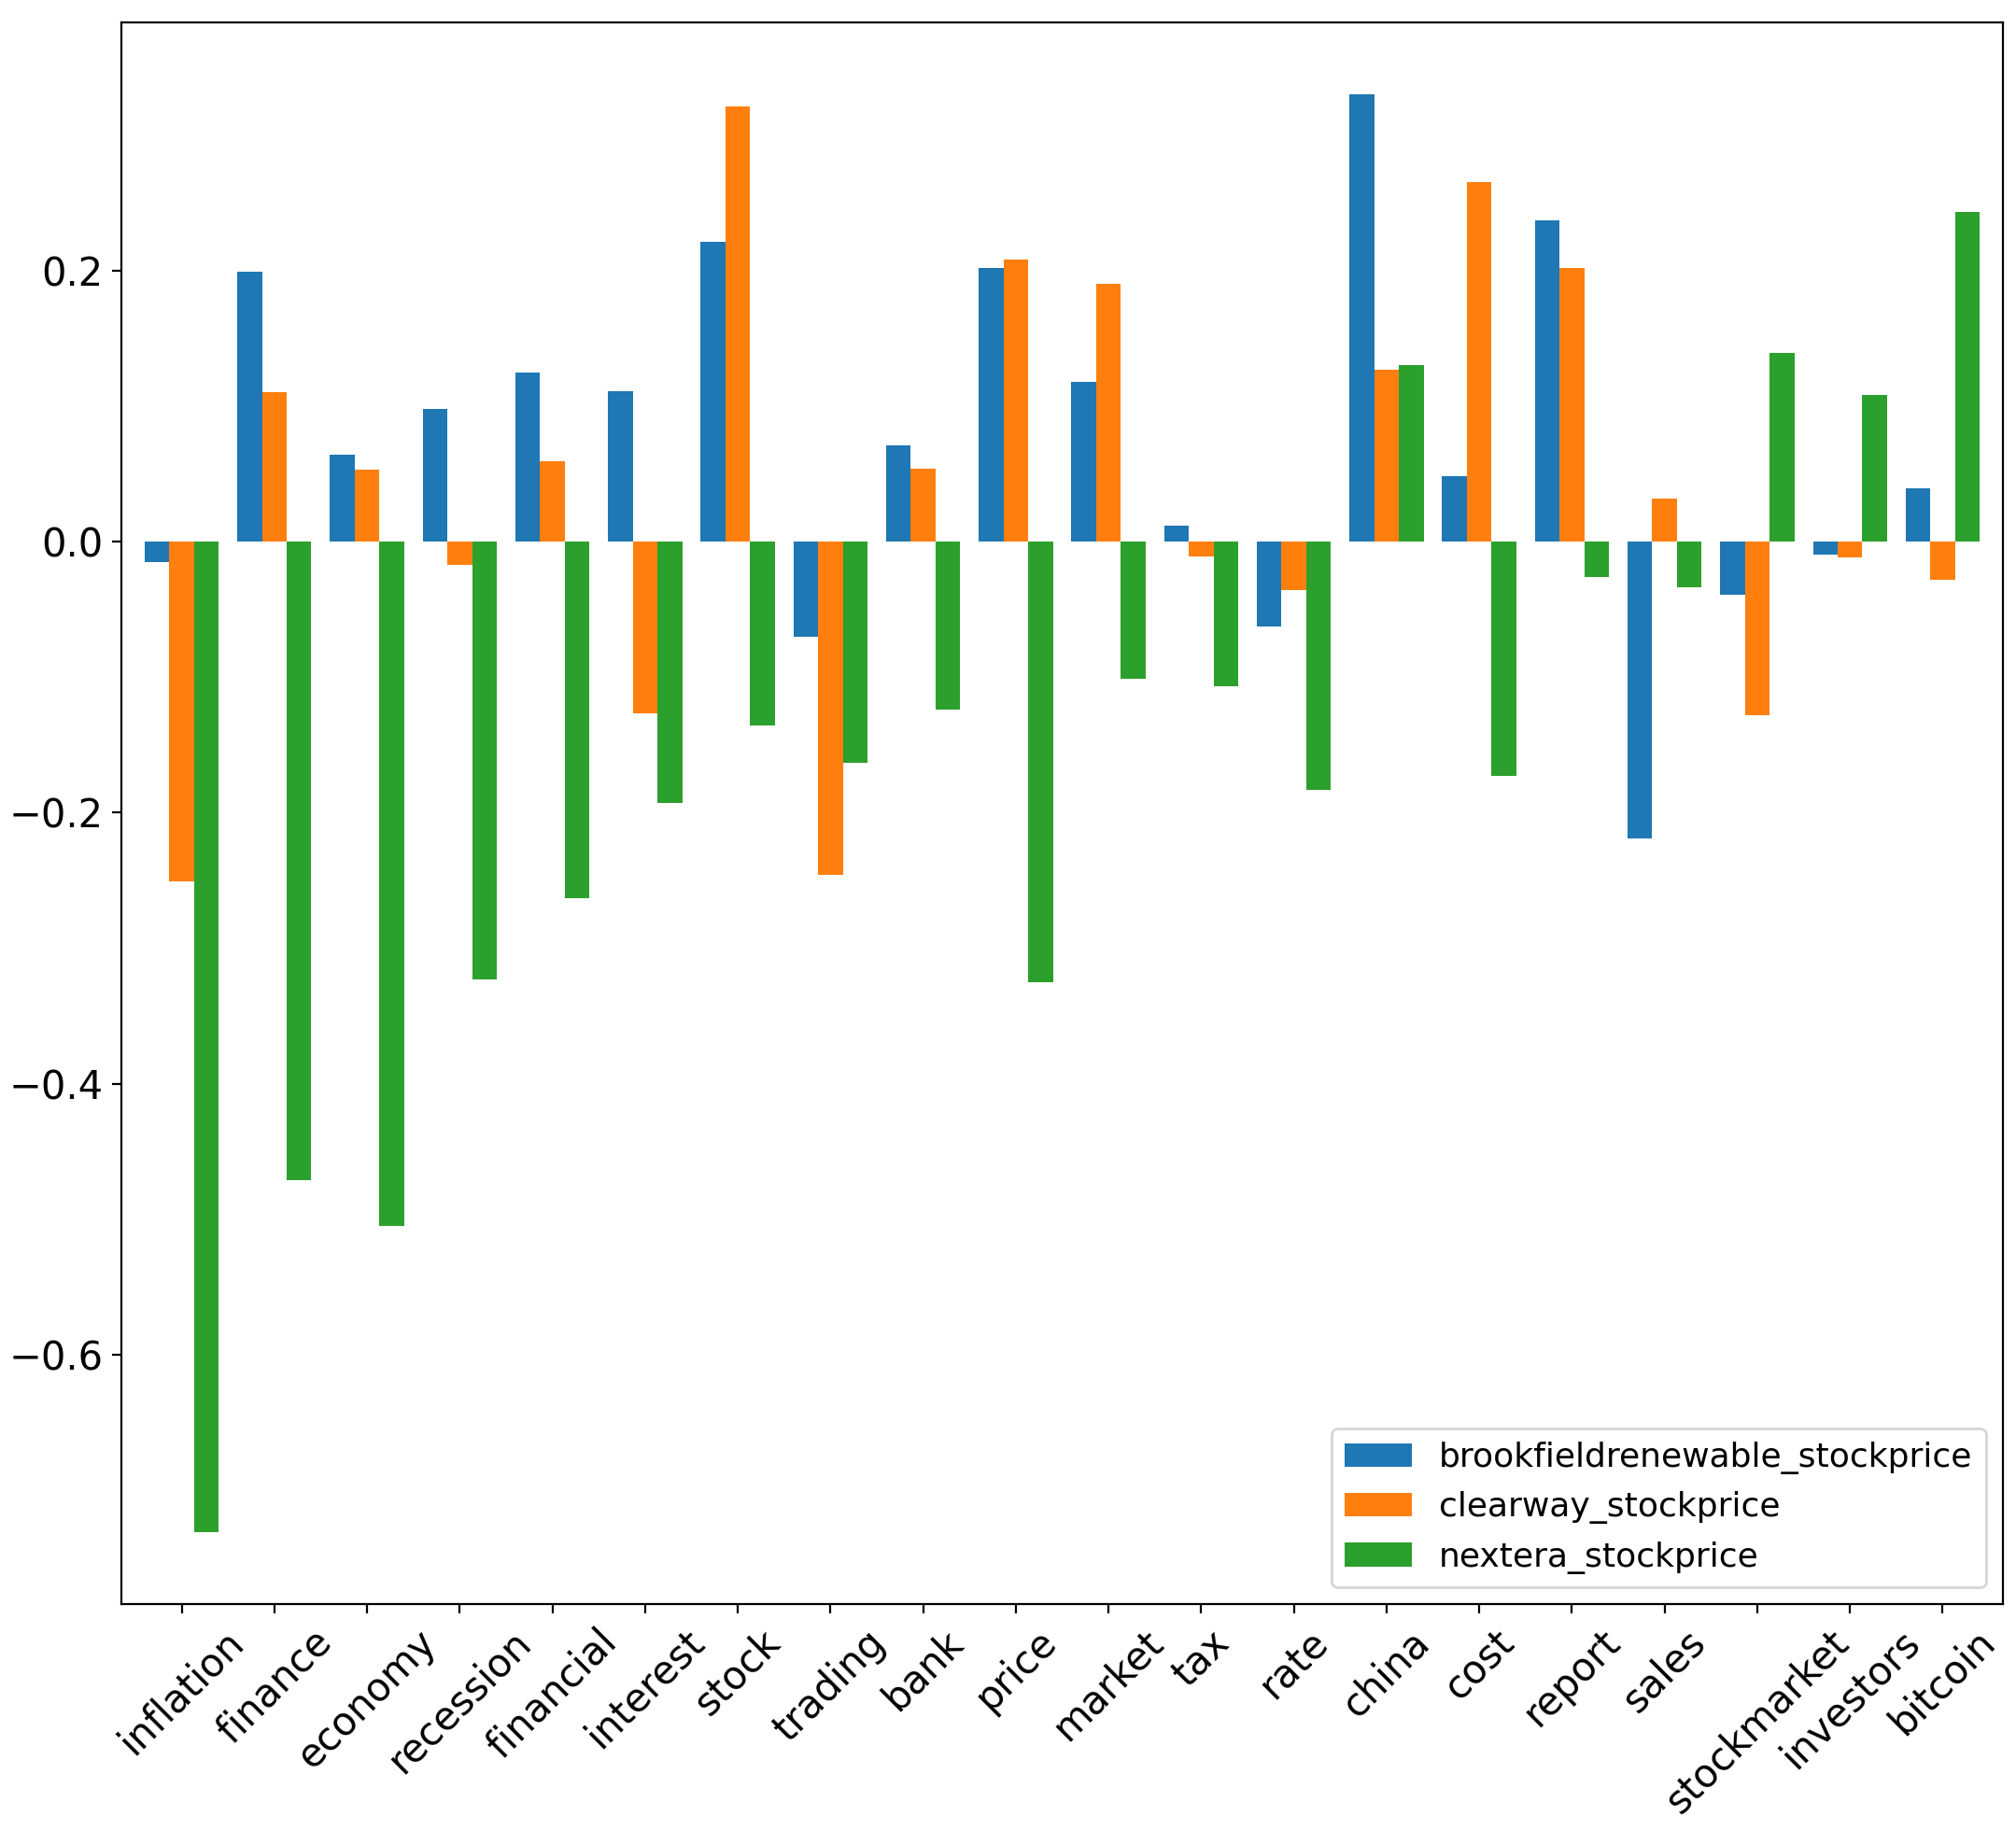
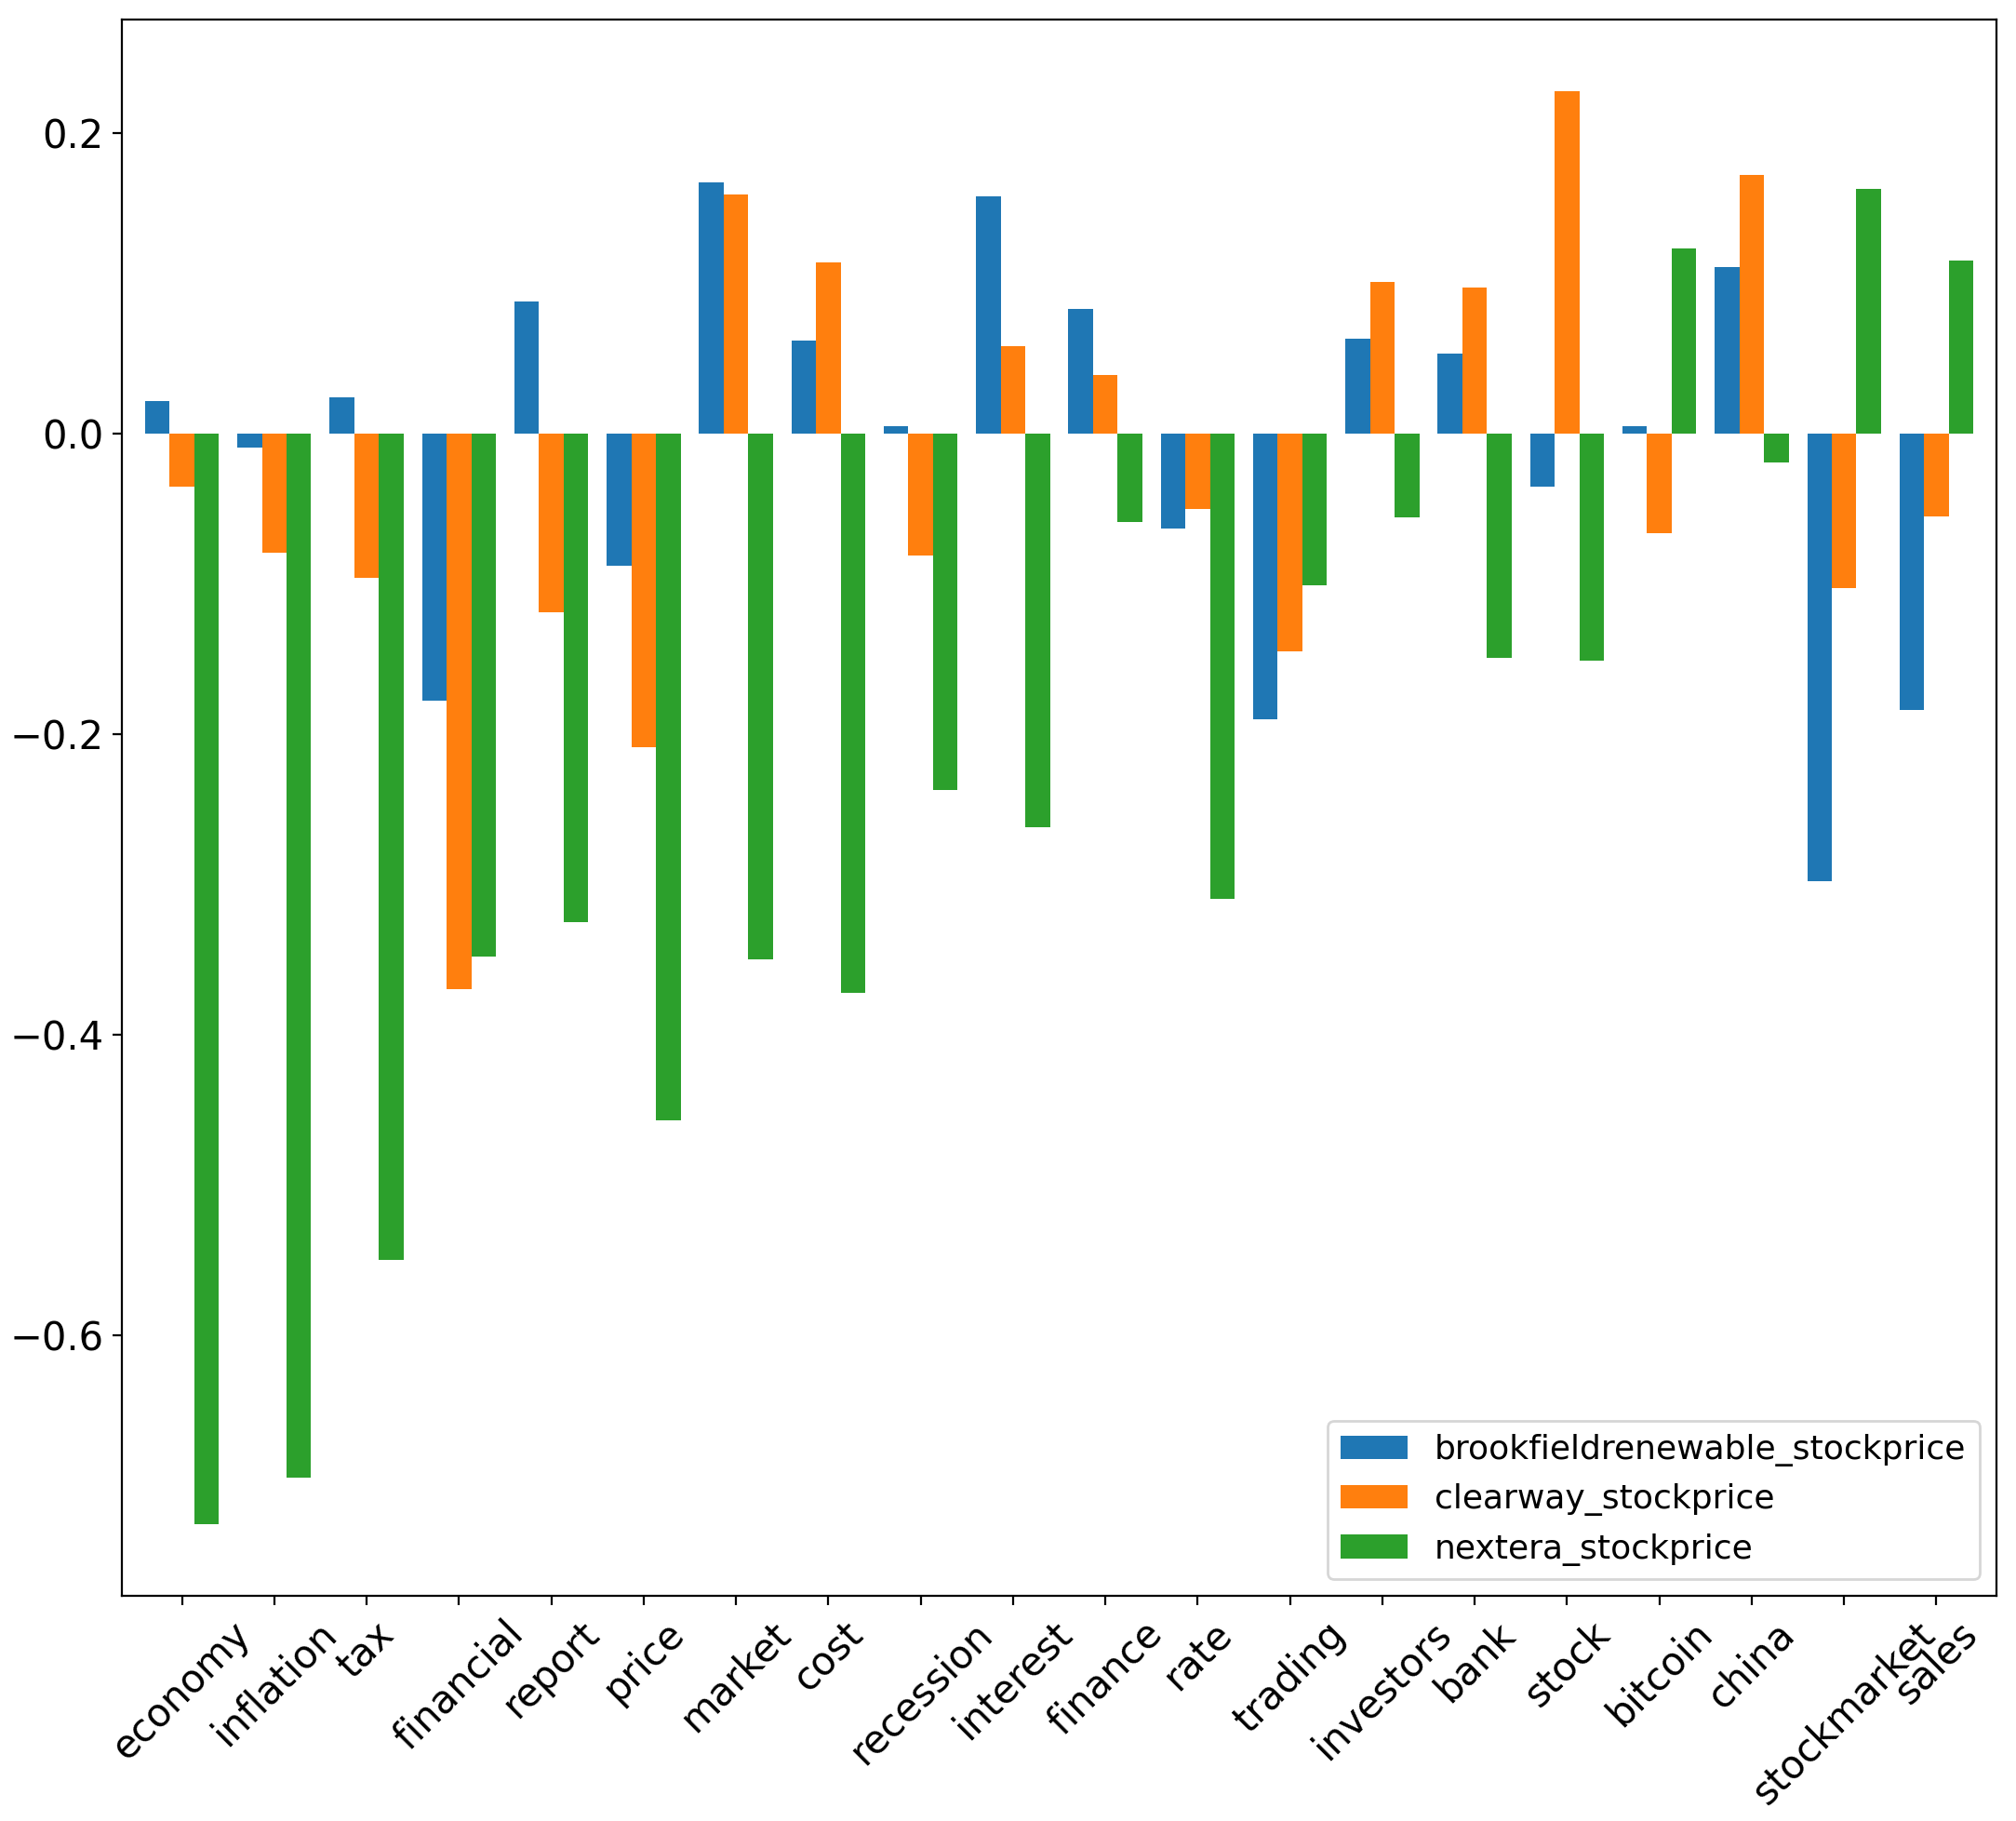
Though [38] has considered separate thresholds for r (i.e. ), this paper will consider correlations of to be statistically significant. For absolute aspect sentiment scores, yields the greatest magnitude for correlation compared to other sustainable energy stocks. Specifically, yields values of with corresponding to the (inflation, economy, finance) aspects respectively. Conversely, yields values of & with corresponding to the respective aspects of (economy, inflation, tax, price). values for normalised aspect sentiment scores, & , are noticeably smaller in magnitude compared to absolute aspect sentiment scores. yields an value of with for the stockmarket aspect, and an value of with for the economy aspect. Additionally, yields a value of with for the financial aspect.
| Brookfieldrenewable | Clearway | Nextera |
|---|---|---|
| tax | finance | finance |
| stock | price | investors |
| bitcoin | cost | |
| tax | investors | |
| stock |
IX-B Granger causality results for sustainable energy stocks
We conduct the Granger causality test to determine whether the different aspect sentiment scores, , Granger cause the various stock prices at the 0.05 significance level. From table II, we observe that more aspect sentiment scores Granger cause & compared to . Additionally, we observe that aspect sentiment scores pertaining to aspects (finance, tax) Granger cause sustainable energy stock prices for the most occurrences compared to sentiment scores for other aspects.
IX-C Uncertainty coefficient results for sustainable energy stocks
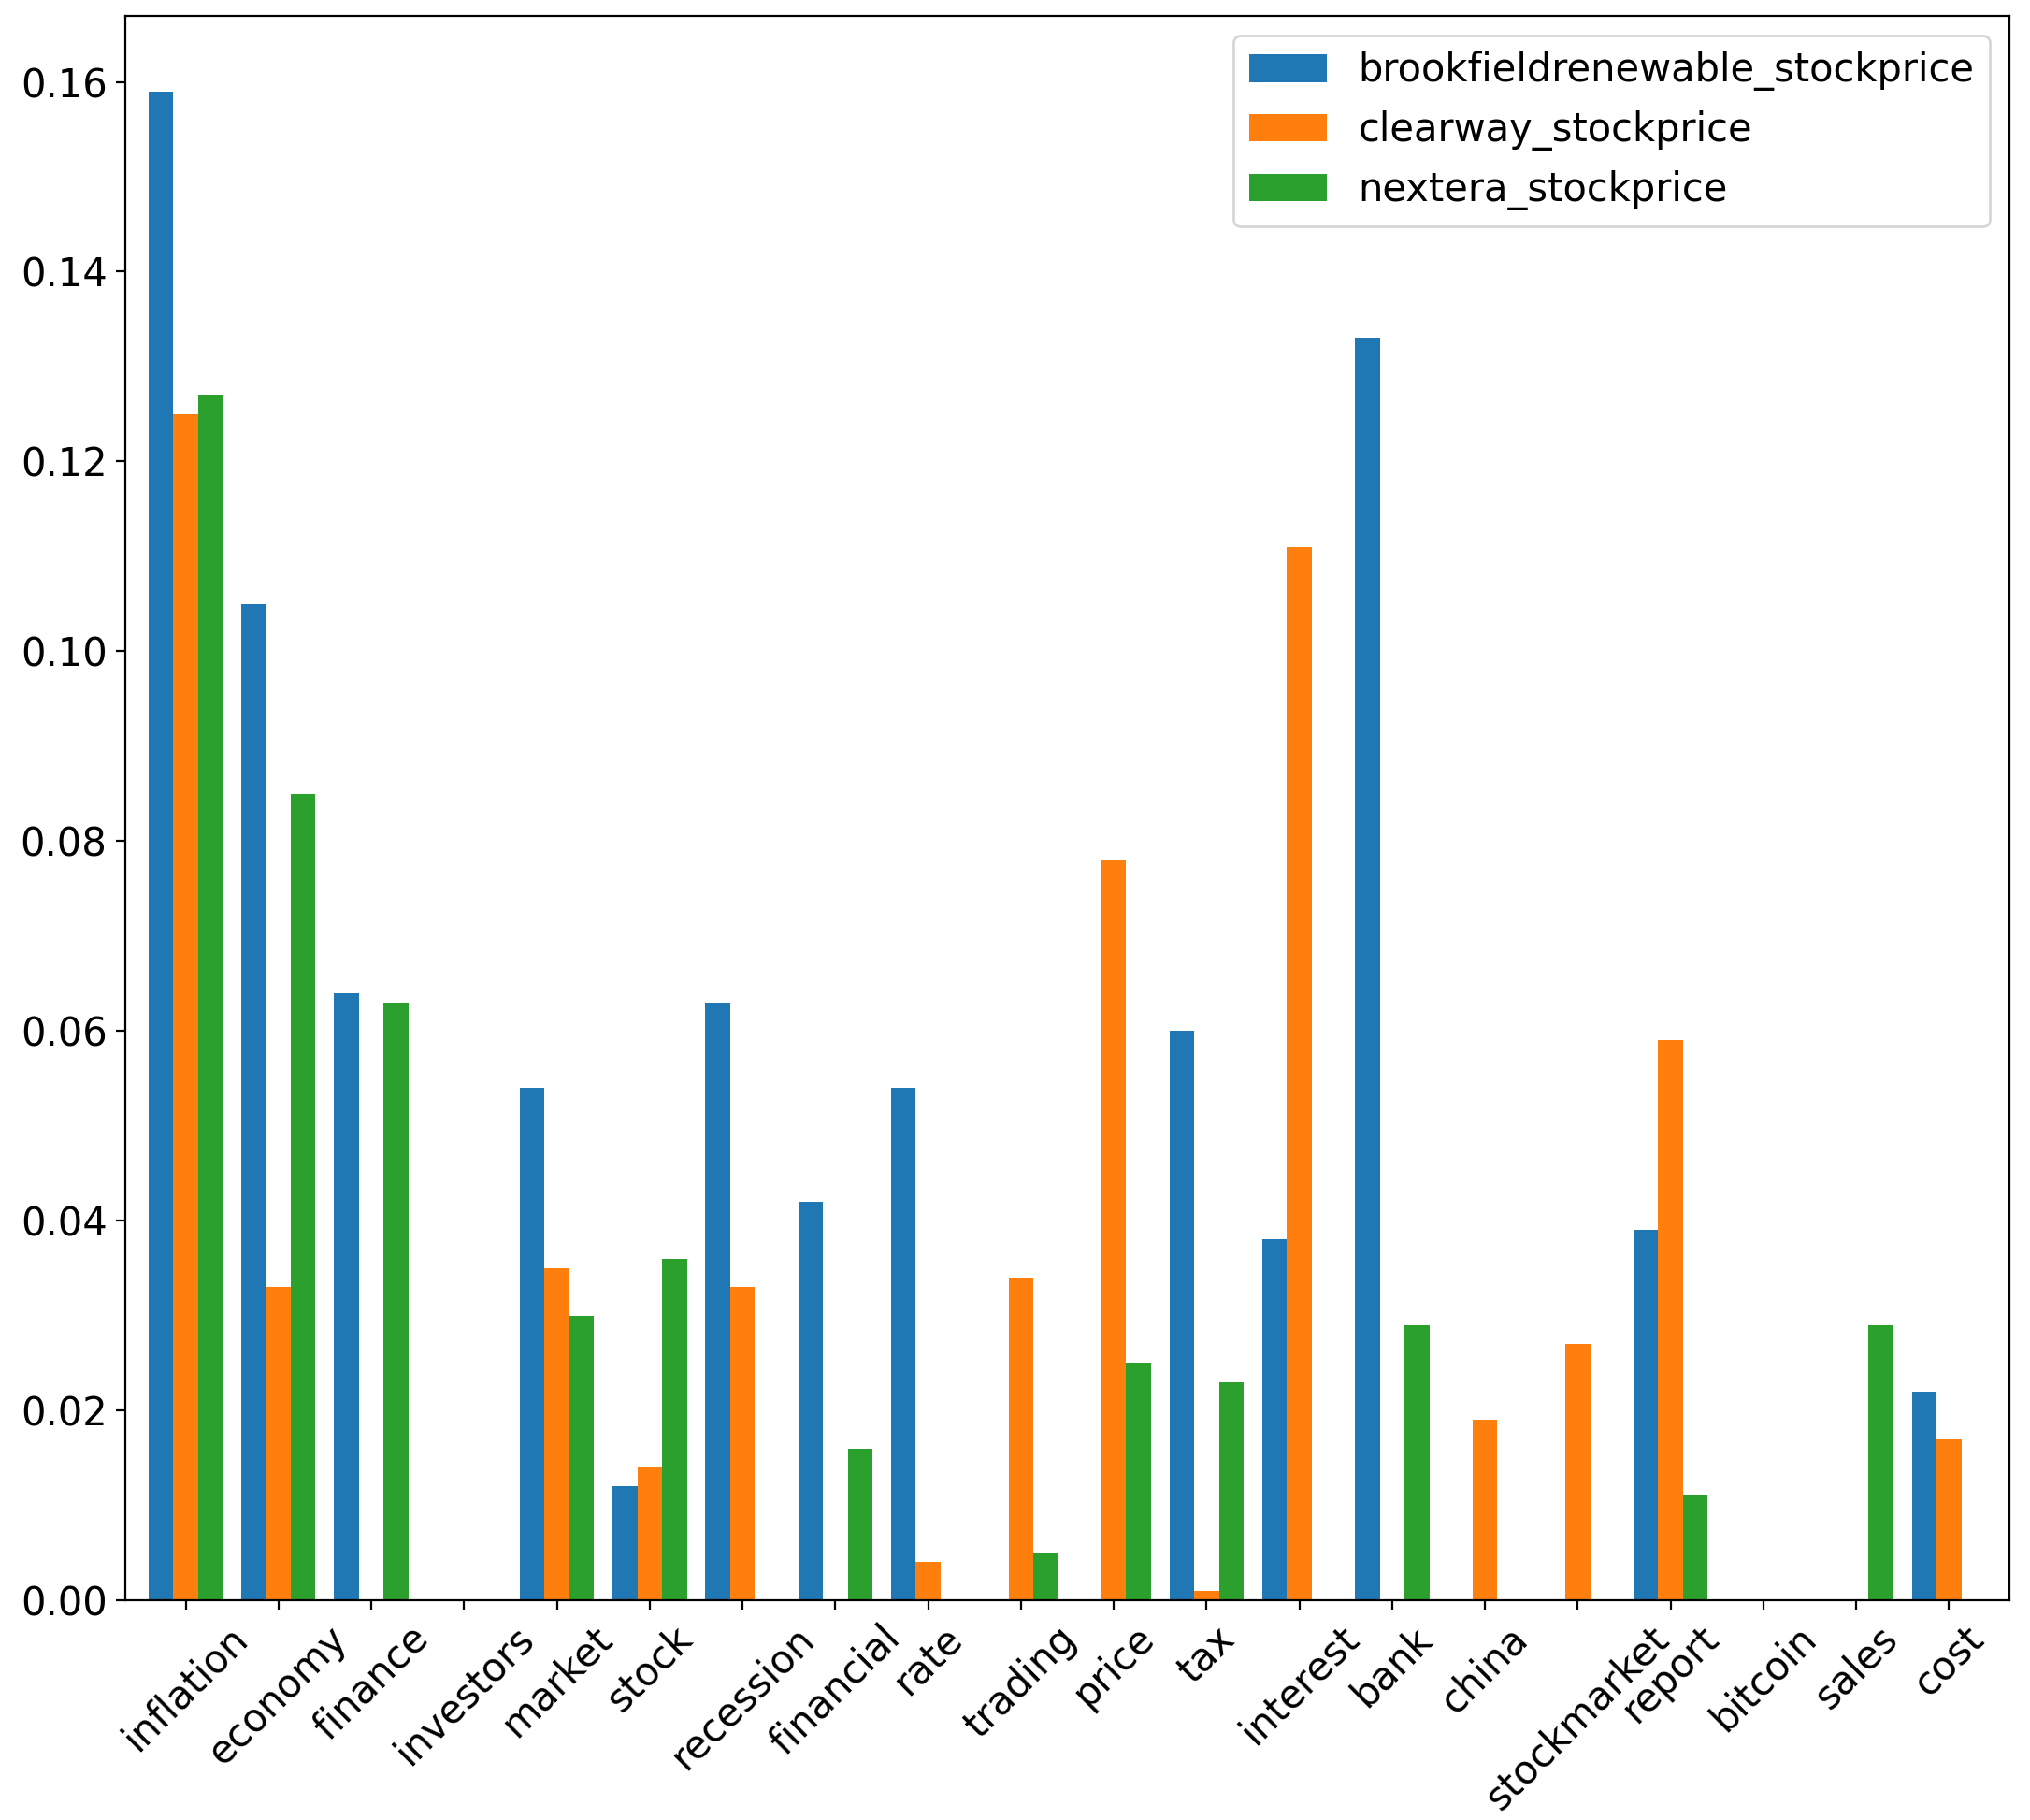
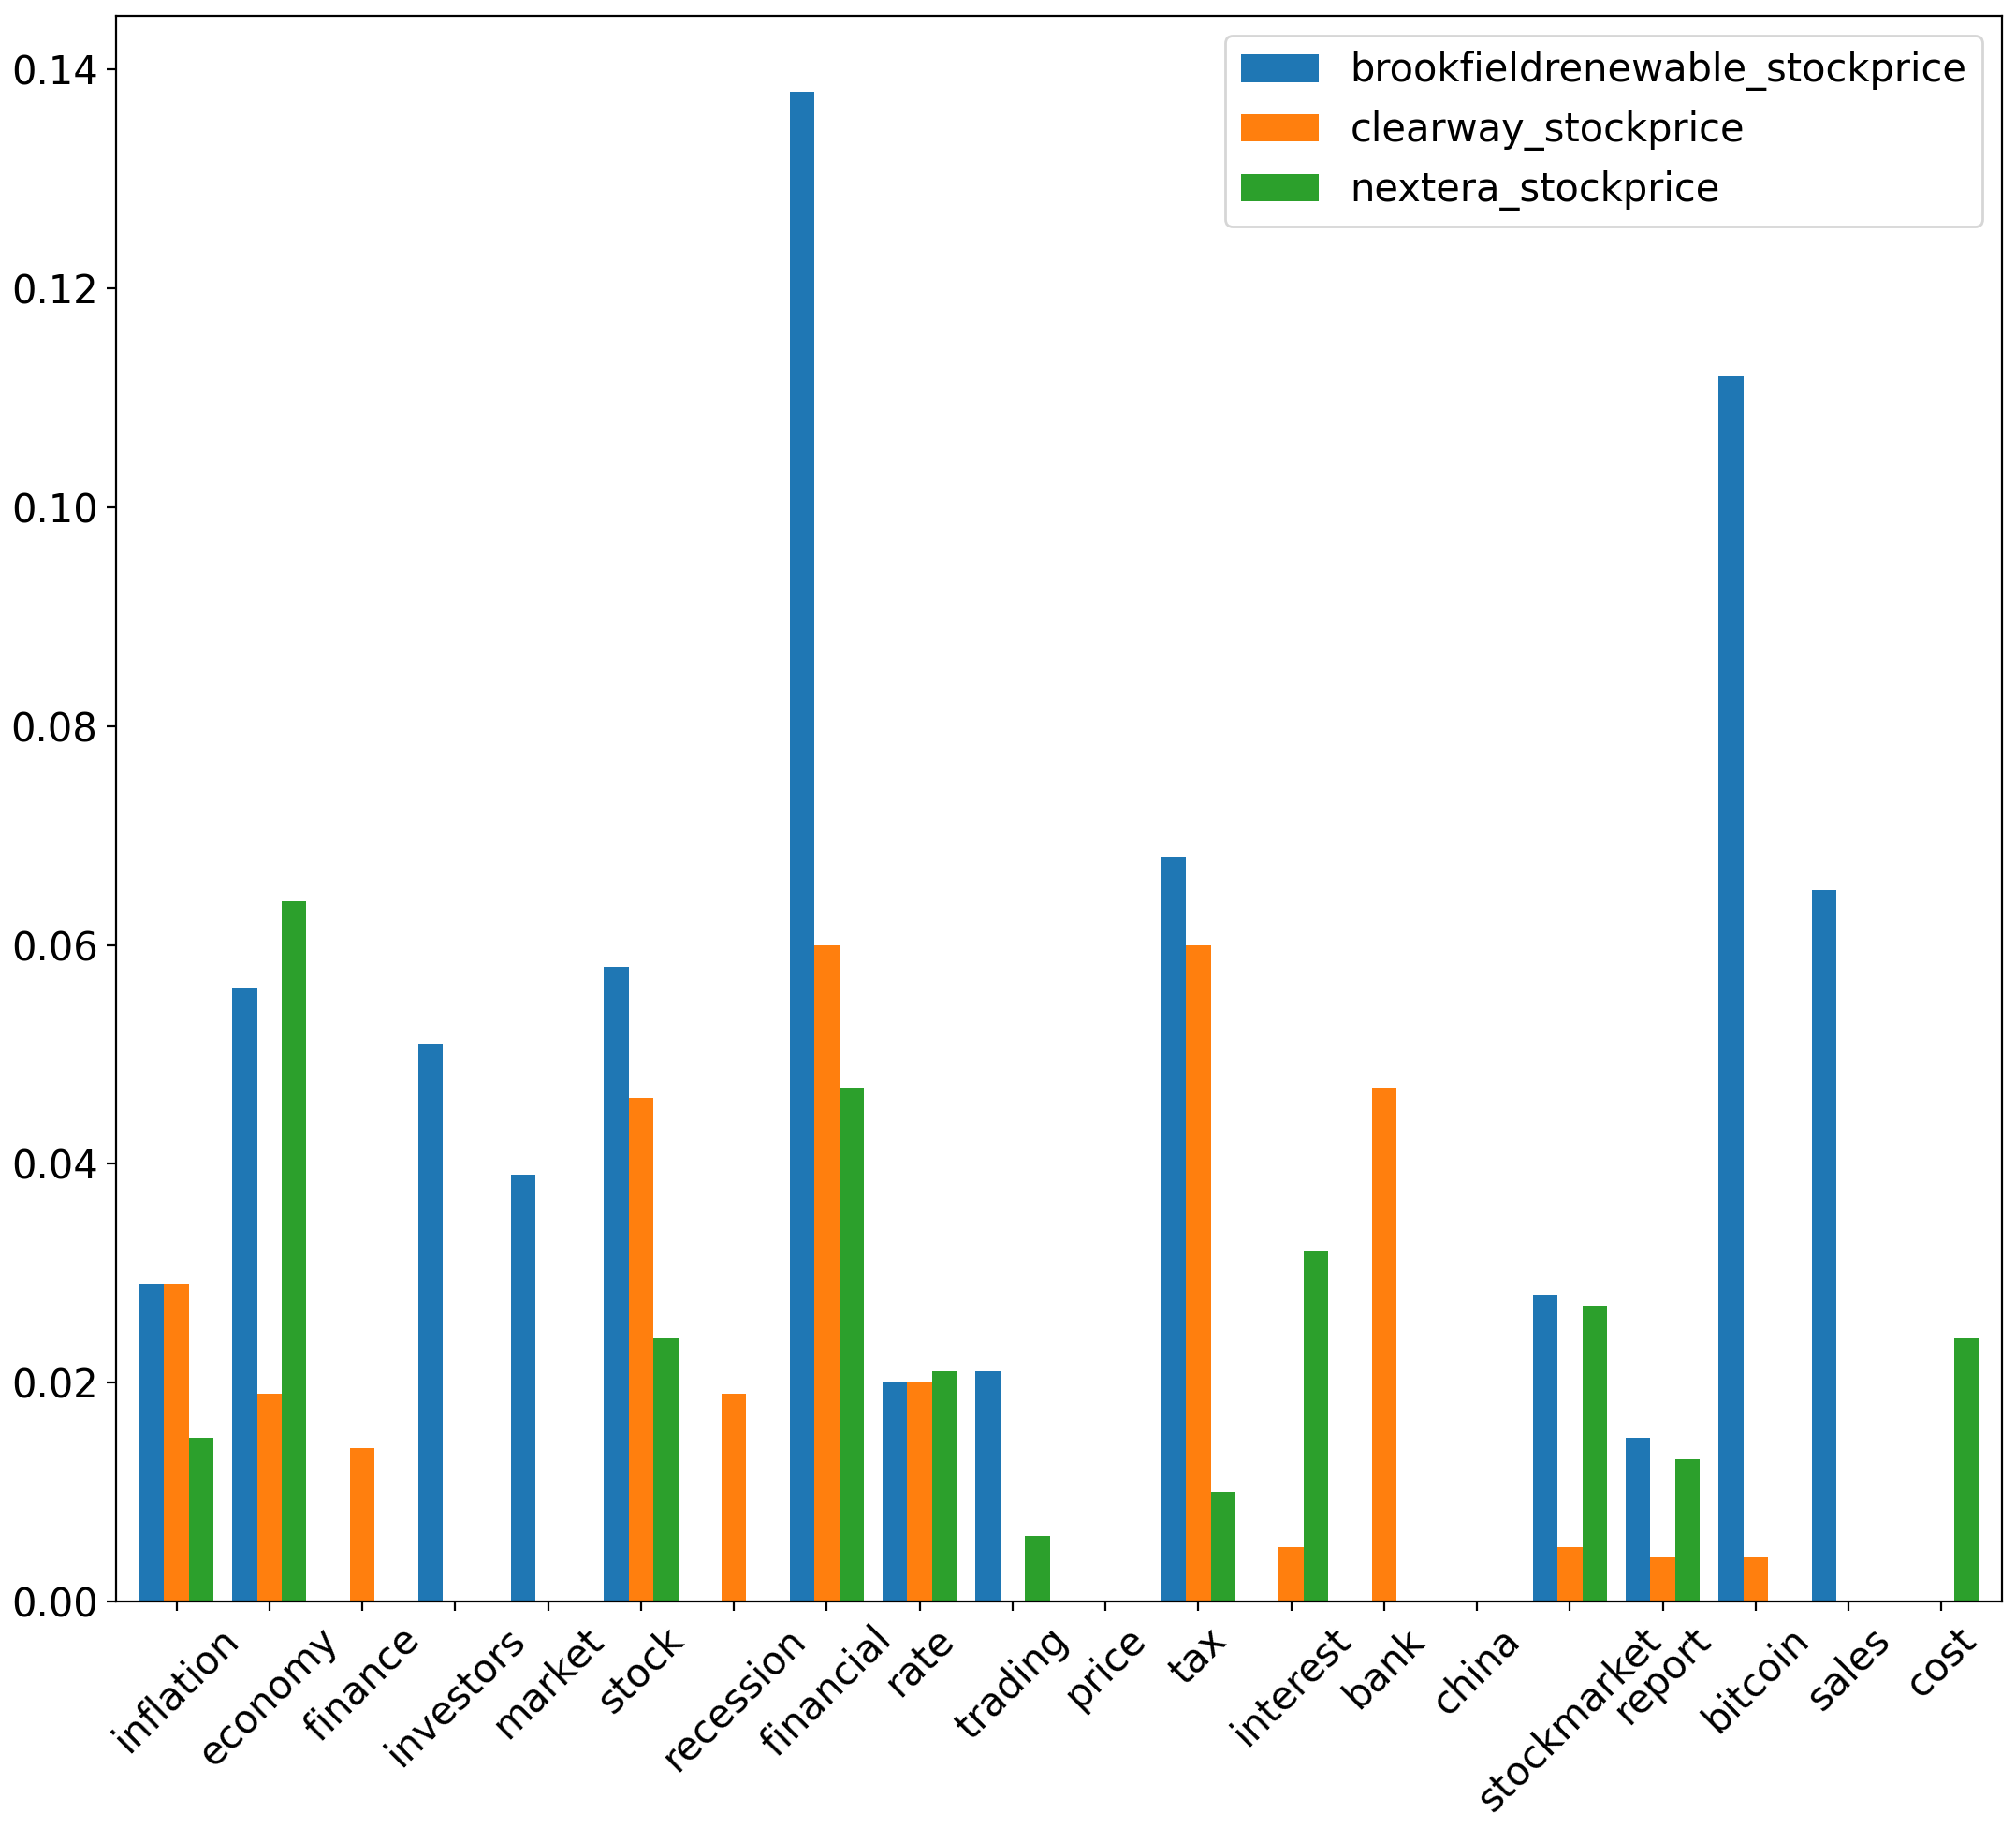
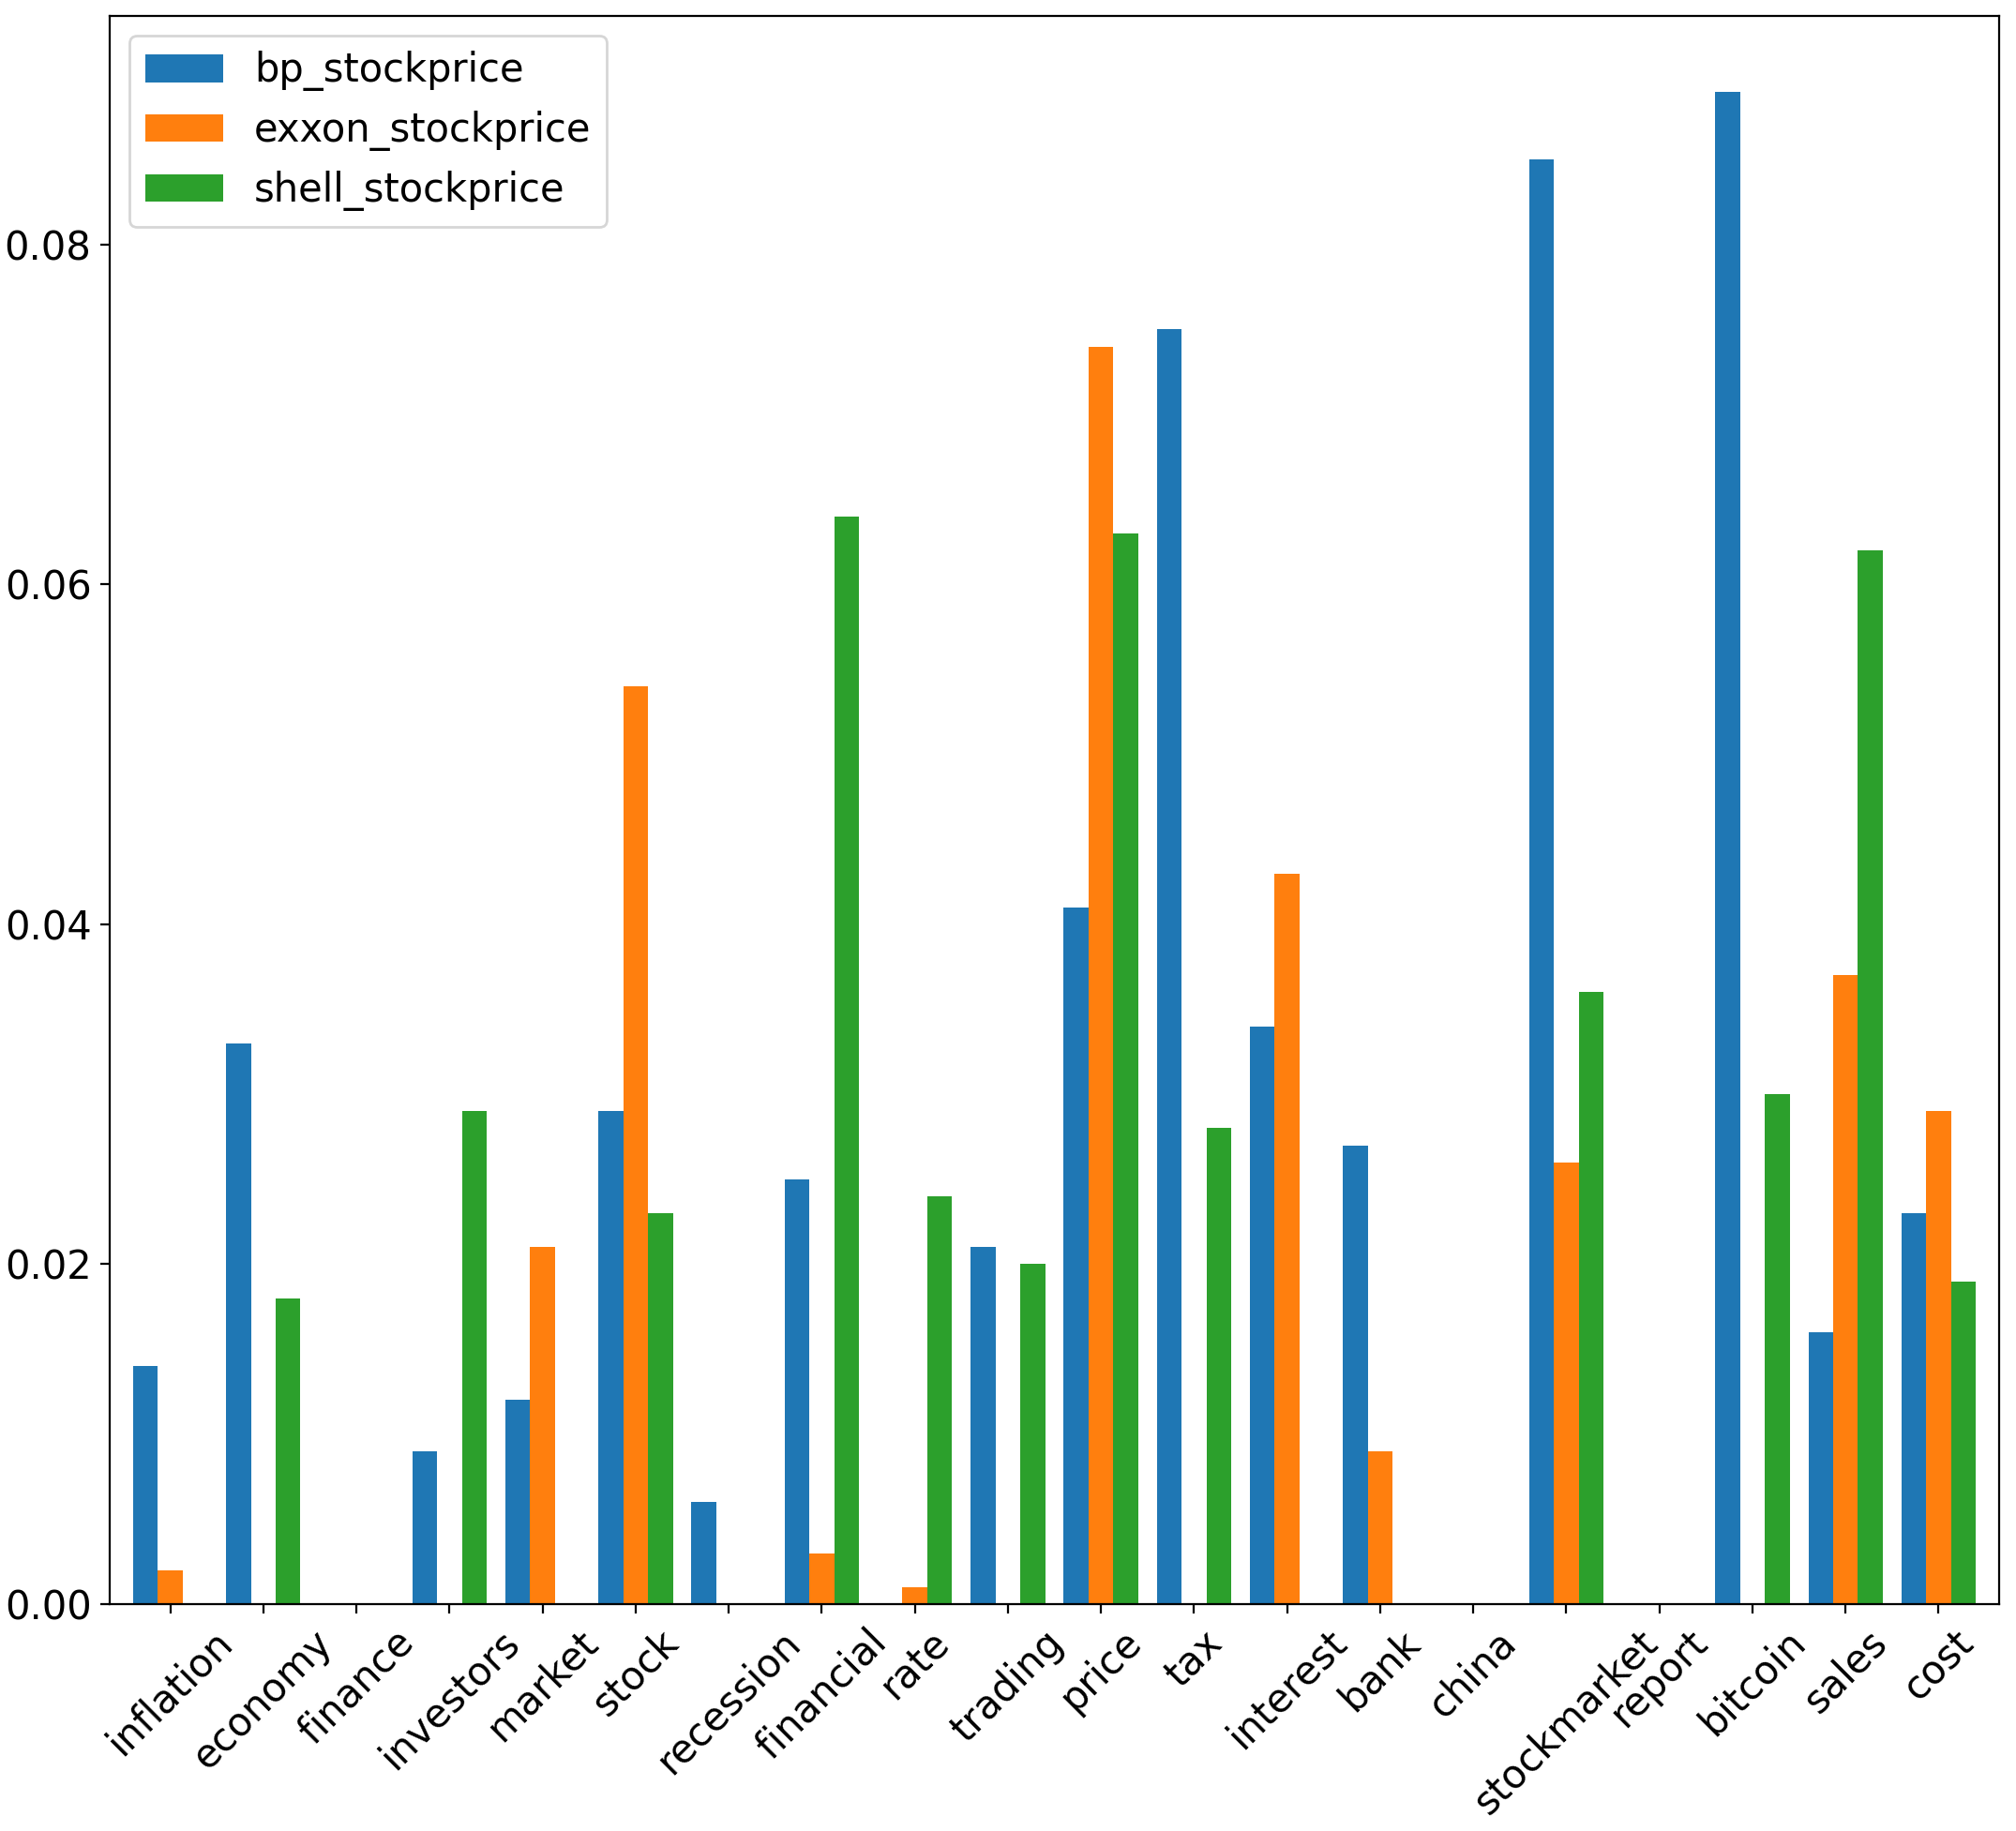
We highlight the highest uncertainty coefficient values between respective aspect sentiment scores and traditional energy stock prices. Specifically, from figure 8, we observe that between corresponding to the inflation aspect & (, , ), uncertainty coefficient values are relatively high at 0.159, 0.127 & 0.125 respectively. Relative to other aspects, uncertainty coefficient also has significant value, at 0.133 between corresponding to the aspect of bank & . Between corresponding to interest & , it also yields a uncertainty coefficient score of 0.111. Among all uncertainty coefficient corresponding to & sustainable energy stocks , uncertainty coefficient is highest between corresponding to (inflation, cost, report, tax) & , yielding values of 0.166, 0.143, 0.125 & 0.12 respectively. The next most significant is corresponding to (inflation, economy) & , where uncertainty coefficient values are at 0.119 & 0.116 respectively.
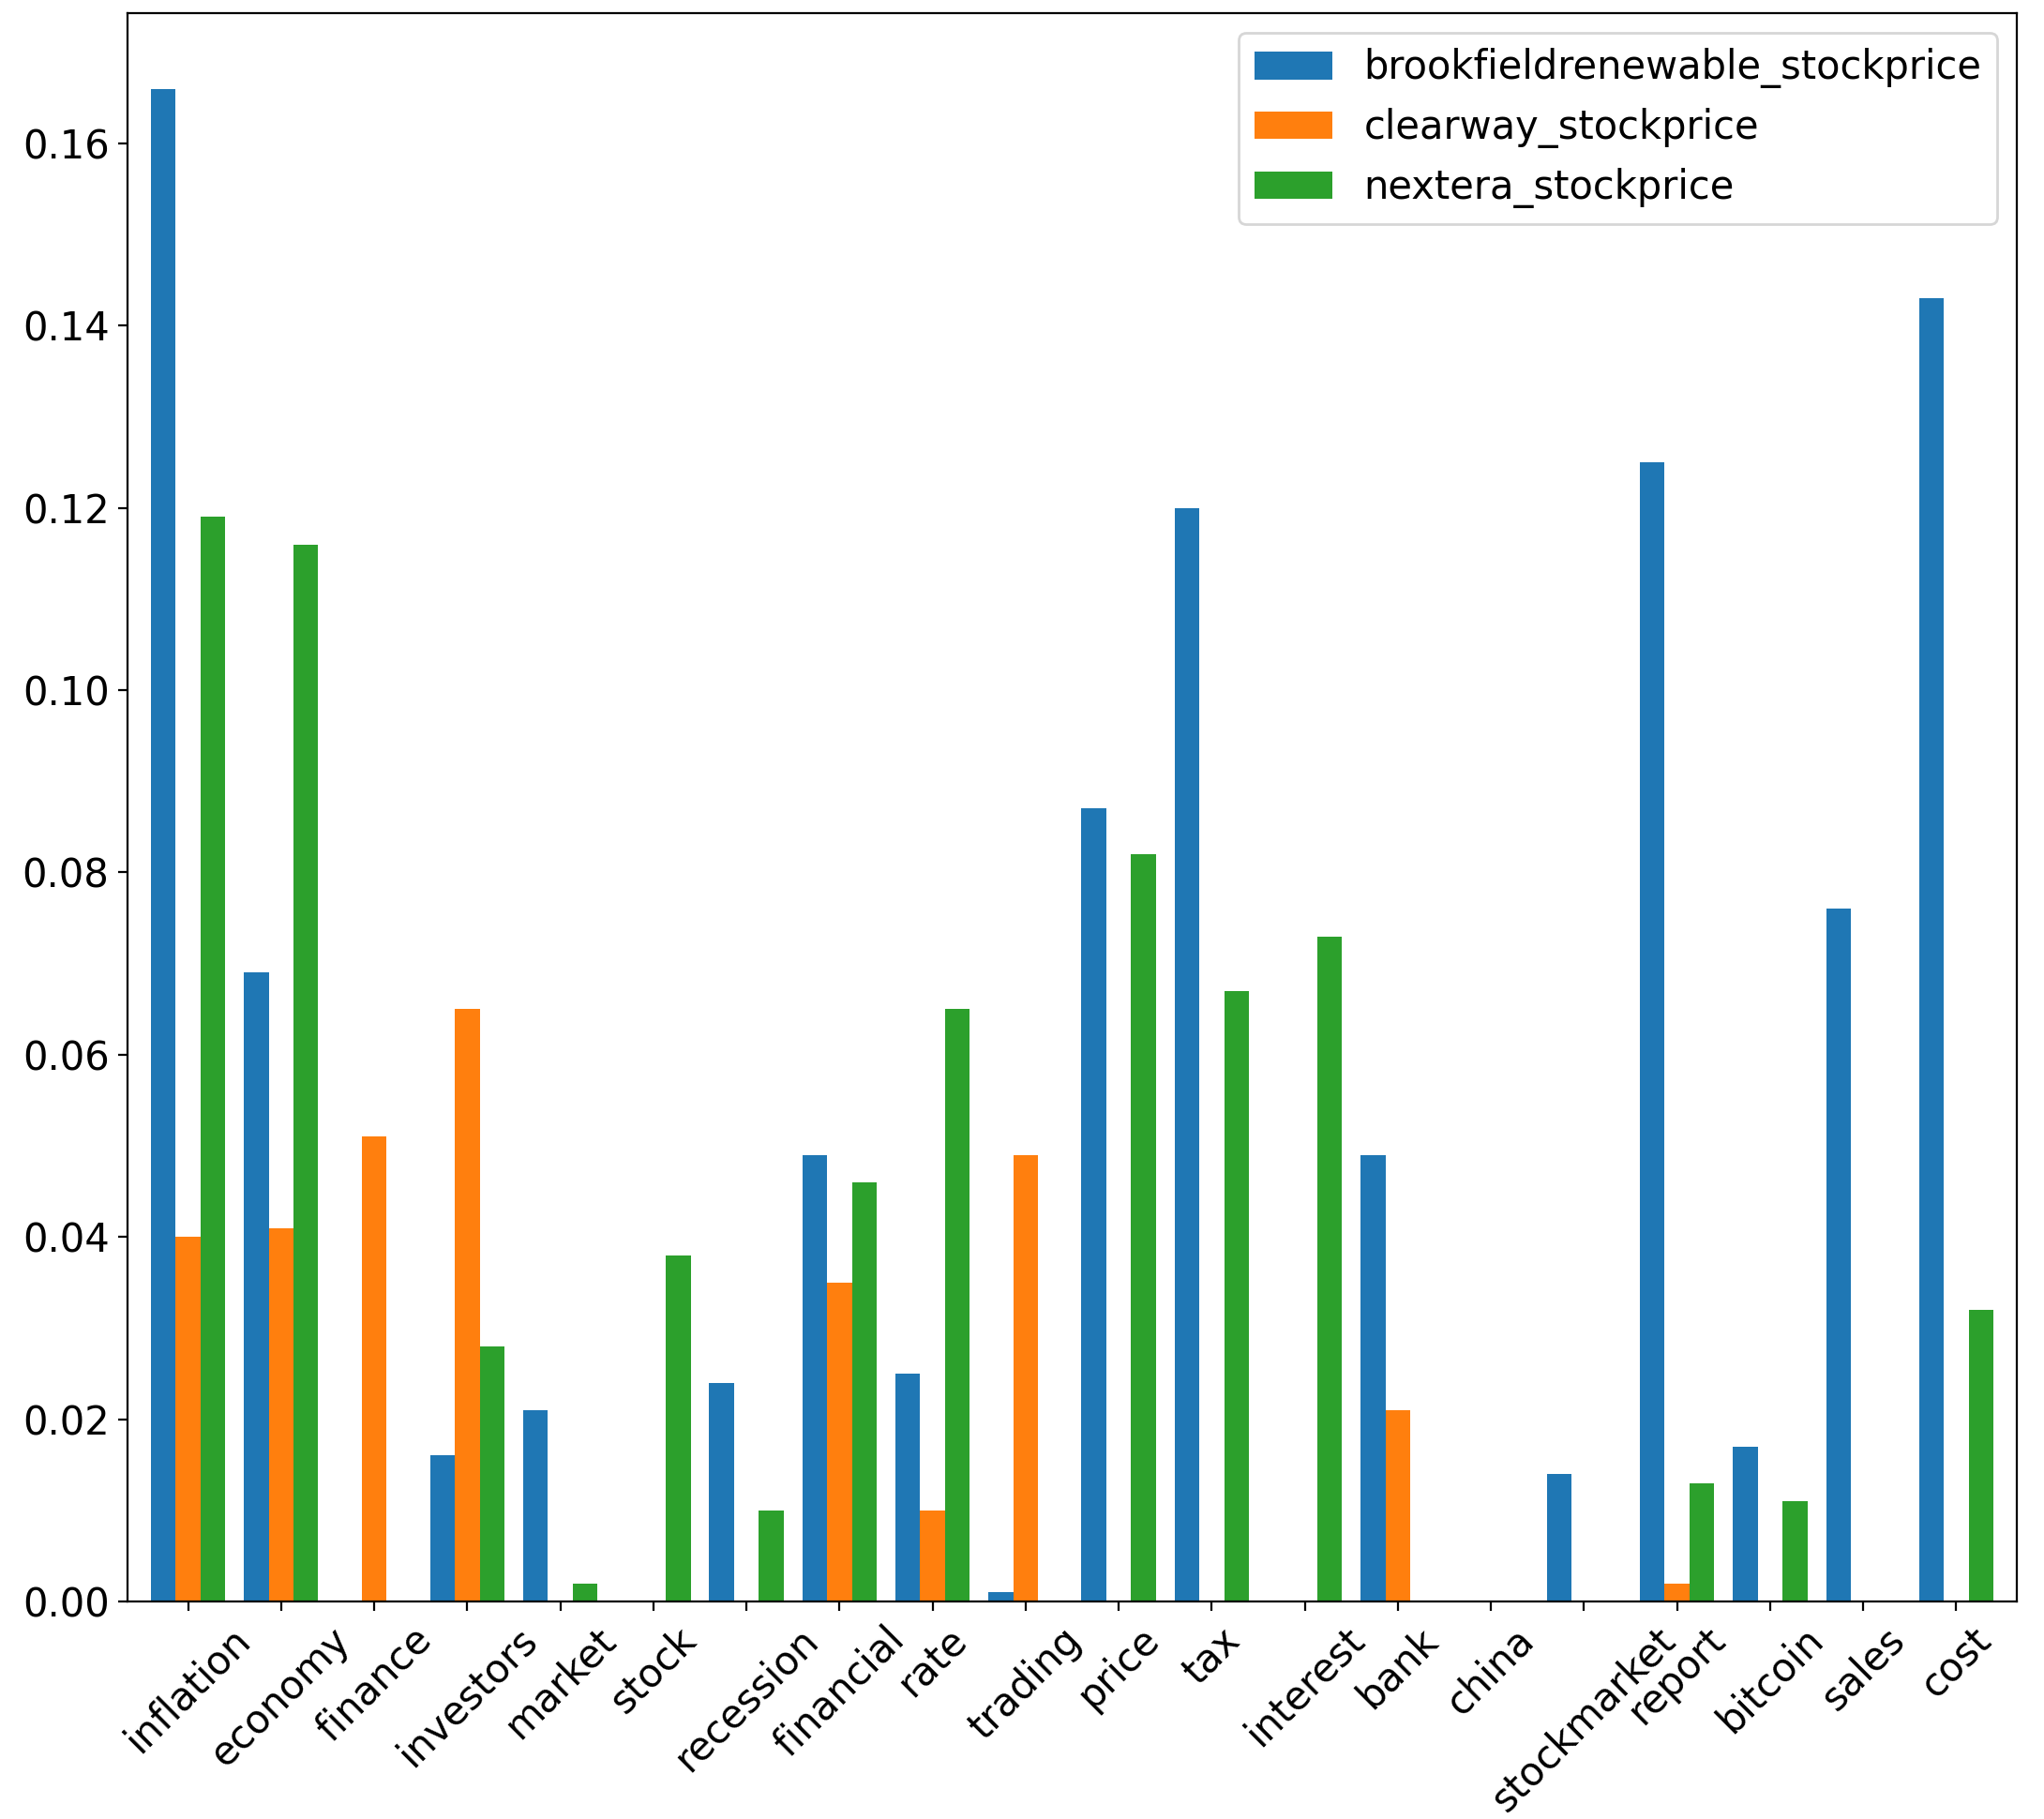
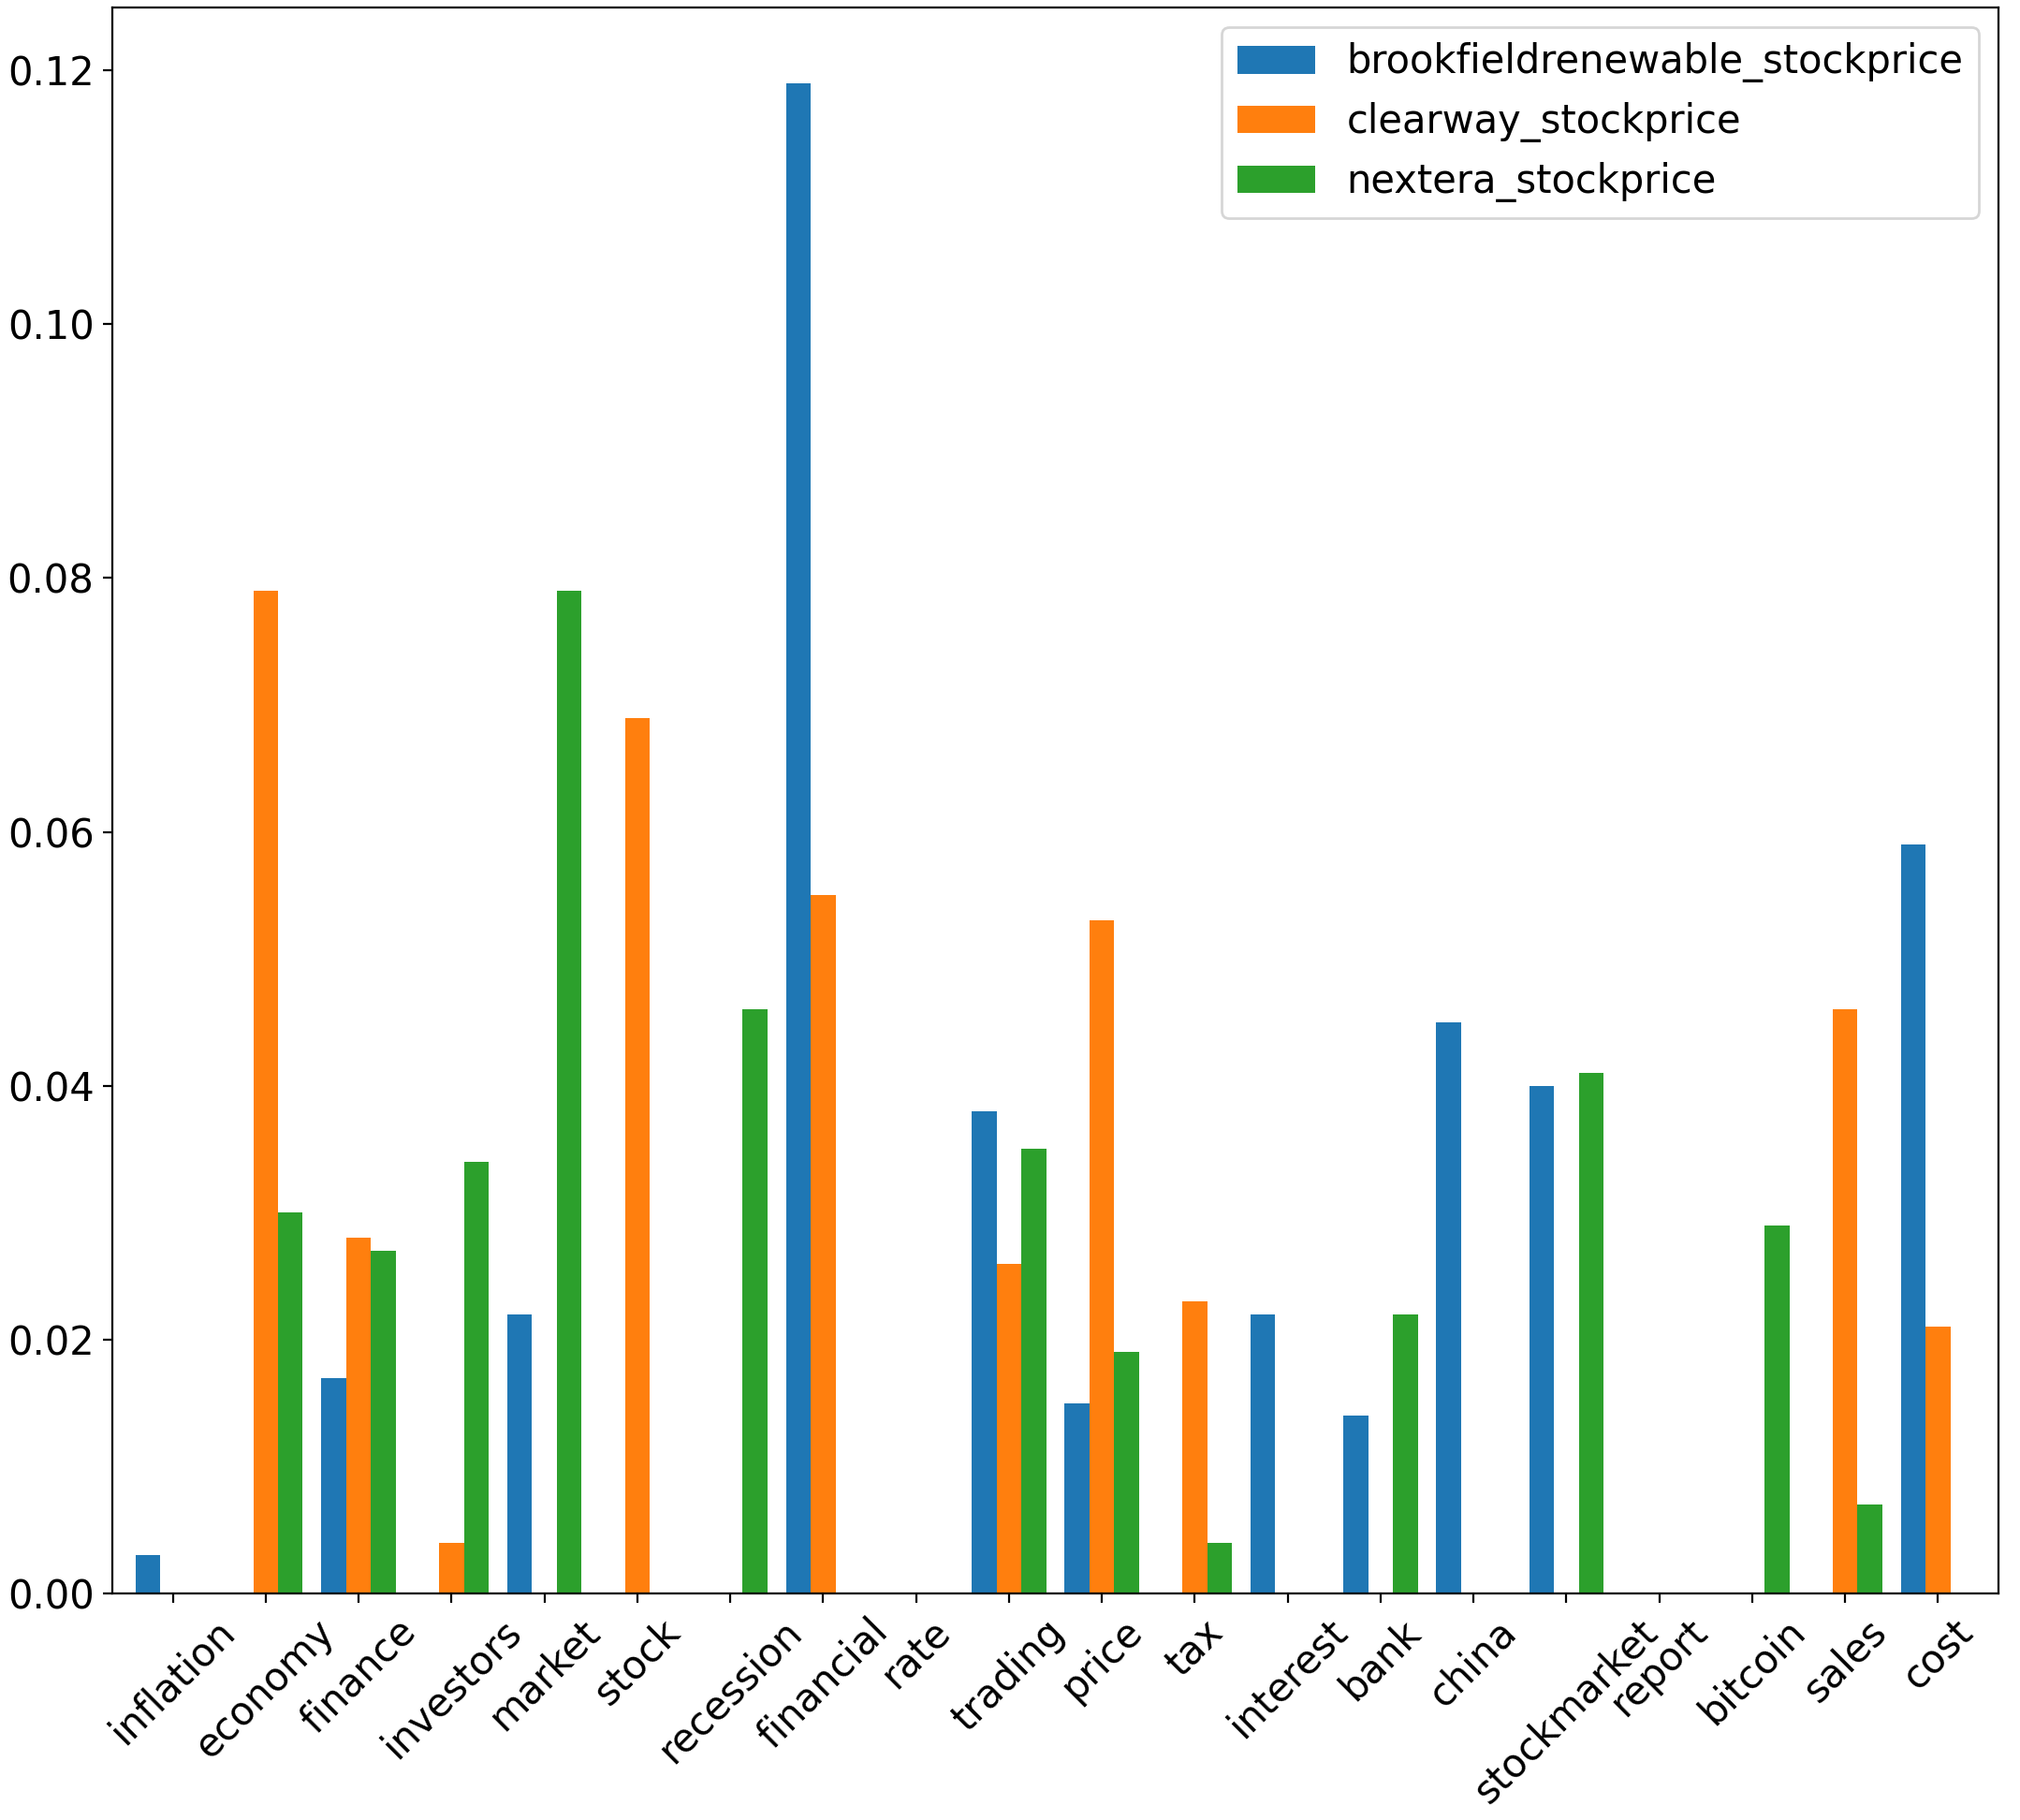
For uncertainty coefficient corresponding to & sustainable energy stocks , the uncertainty coefficient value is highest between corresponding to the aspect financial and , yielding a value of 0.119. Besides this, uncertainty coefficient values are also relatively significant between economy & , yielding a value of 0.079. Finally, uncertainty coefficient yields a value of 0.079 between market & . Lastly, for uncertainty coefficients derived from & sustainable energy stocks , the highest values are yielded between corresponding to (financial, bitcoin) & at 0.138 & 0.112 respectively.
IX-D Correlation results for traditional energy stocks
Of the traditional energy stocks analysed, British Petroleum and Shell consistently yield the greatest magnitude for Pearson correlation values.
For absolute aspect sentiment scores, (, ) have values of , & with corresponding to the inflation aspect. also has r values of , , & with corresponding to the (economy, inflation, tax, financial) aspects respectively. Additionally, has an r value of with corresponding to the financial aspect. has r values of , & with corresponding to the (economy, inflation, tax) aspects, respectively. For normalised aspect sentiment scores, (, & ) have values of respectively with corresponding to the stock aspect.
| BP | Exxon | Shell |
|---|---|---|
| financial | financial | stock |
| financial | trading | rate |
| recession | economy | |
| bitcoin | stock | |
| stock | cost | |
| inflation |
IX-E Granger causality results for traditional energy stocks
A greater number of aspect sentiment scores Granger cause traditional energy stock prices relative to sustainable energy stocks. Additionally, as highlighted in table III, more aspect sentiment scores Granger cause & compared to . Moreover, aspect sentiment scores pertaining to the financial aspect Granger cause traditional energy stock prices most frequently compared to sentiment scores corresponding to other aspects.
IX-F Uncertainty coefficient results for traditional energy stocks
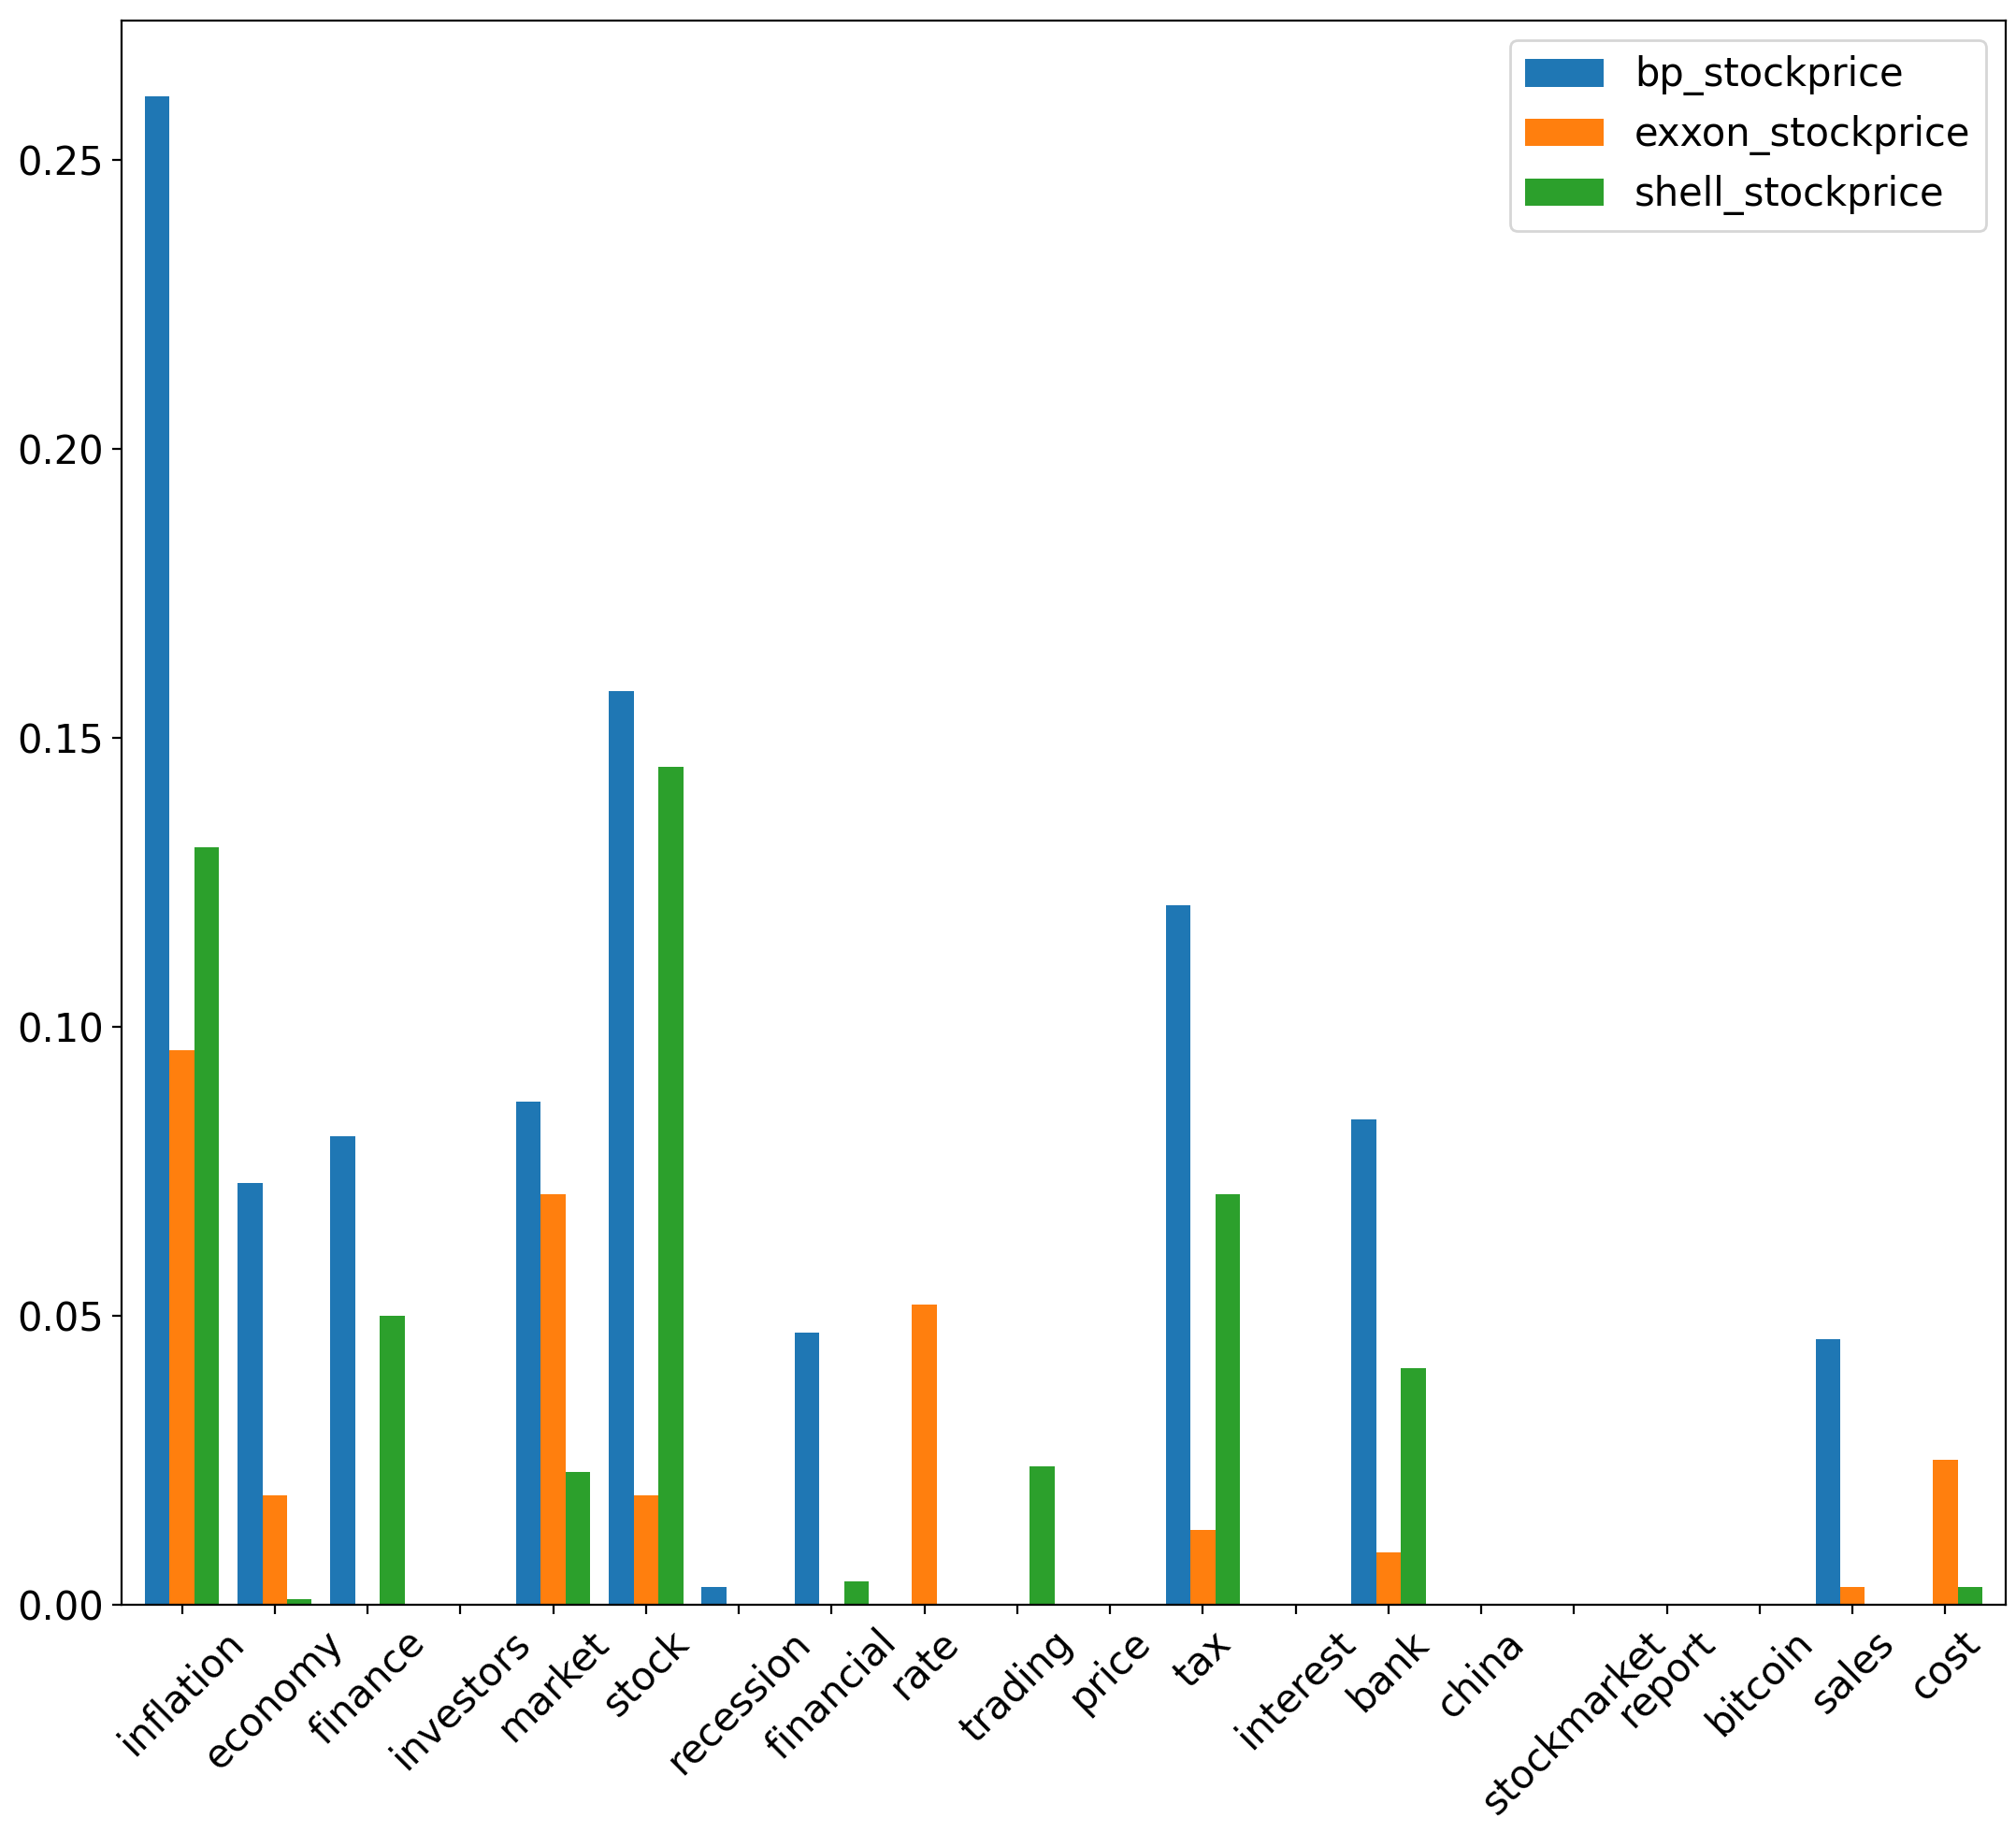
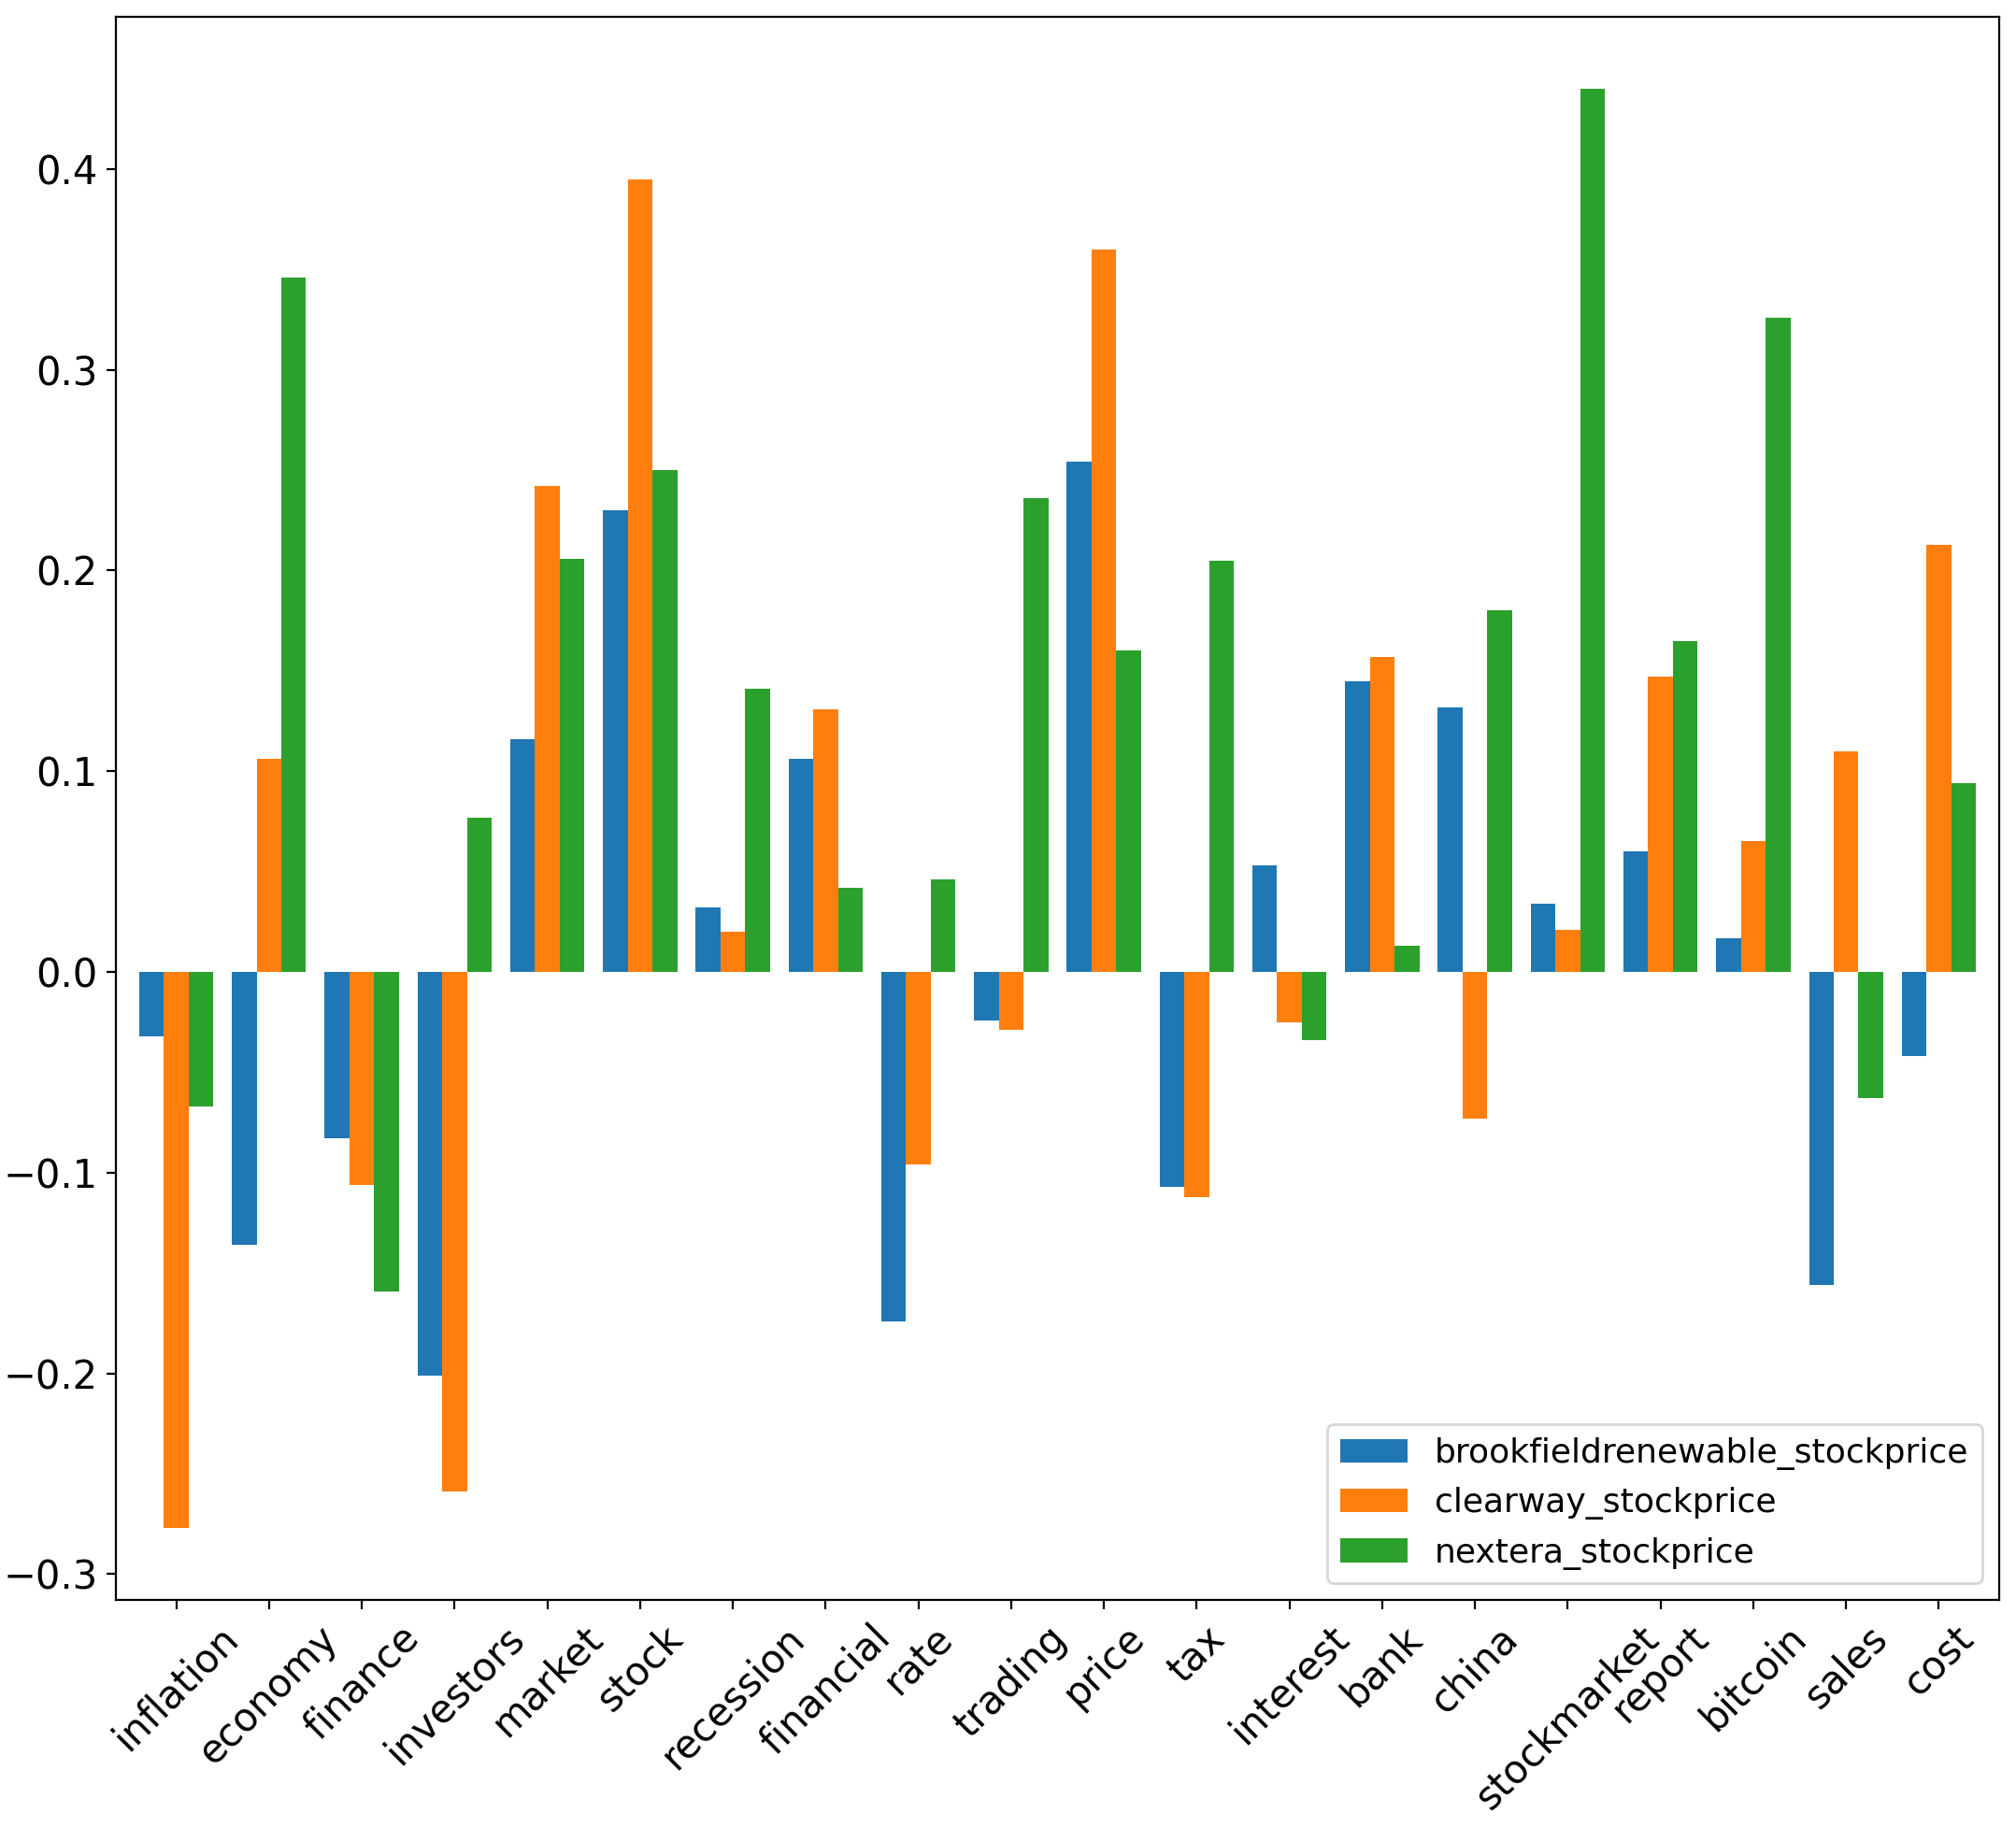
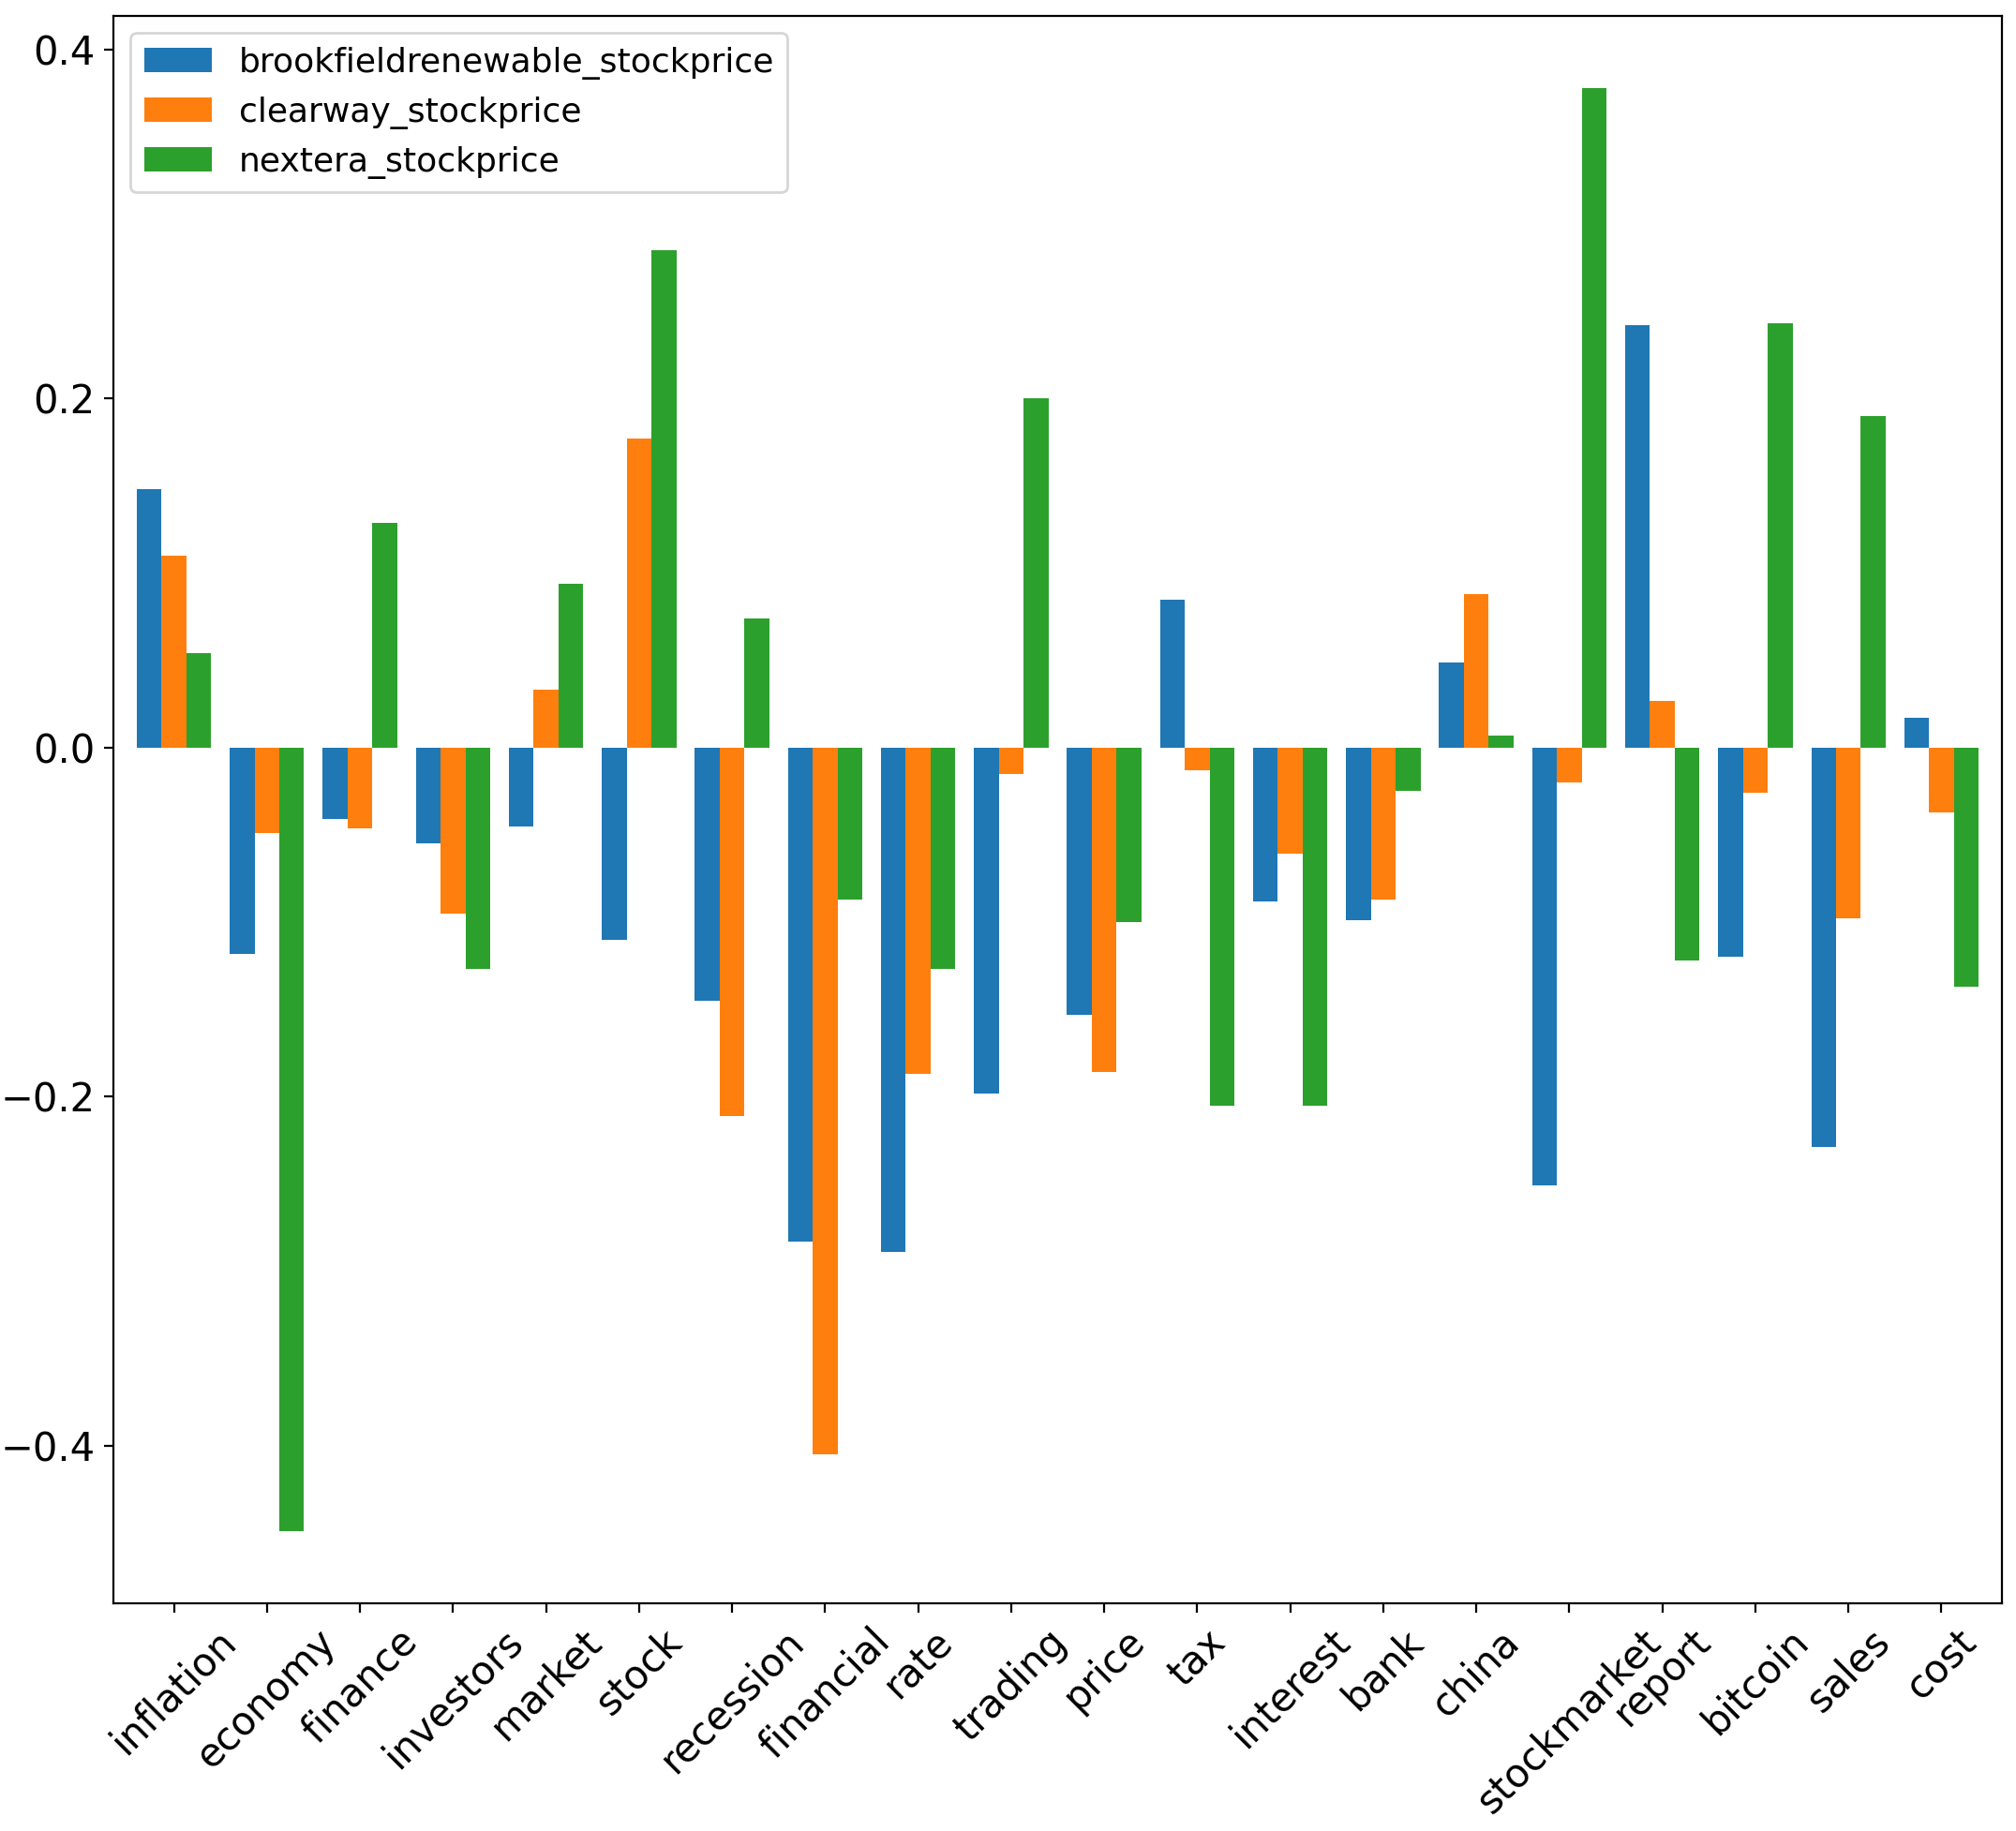
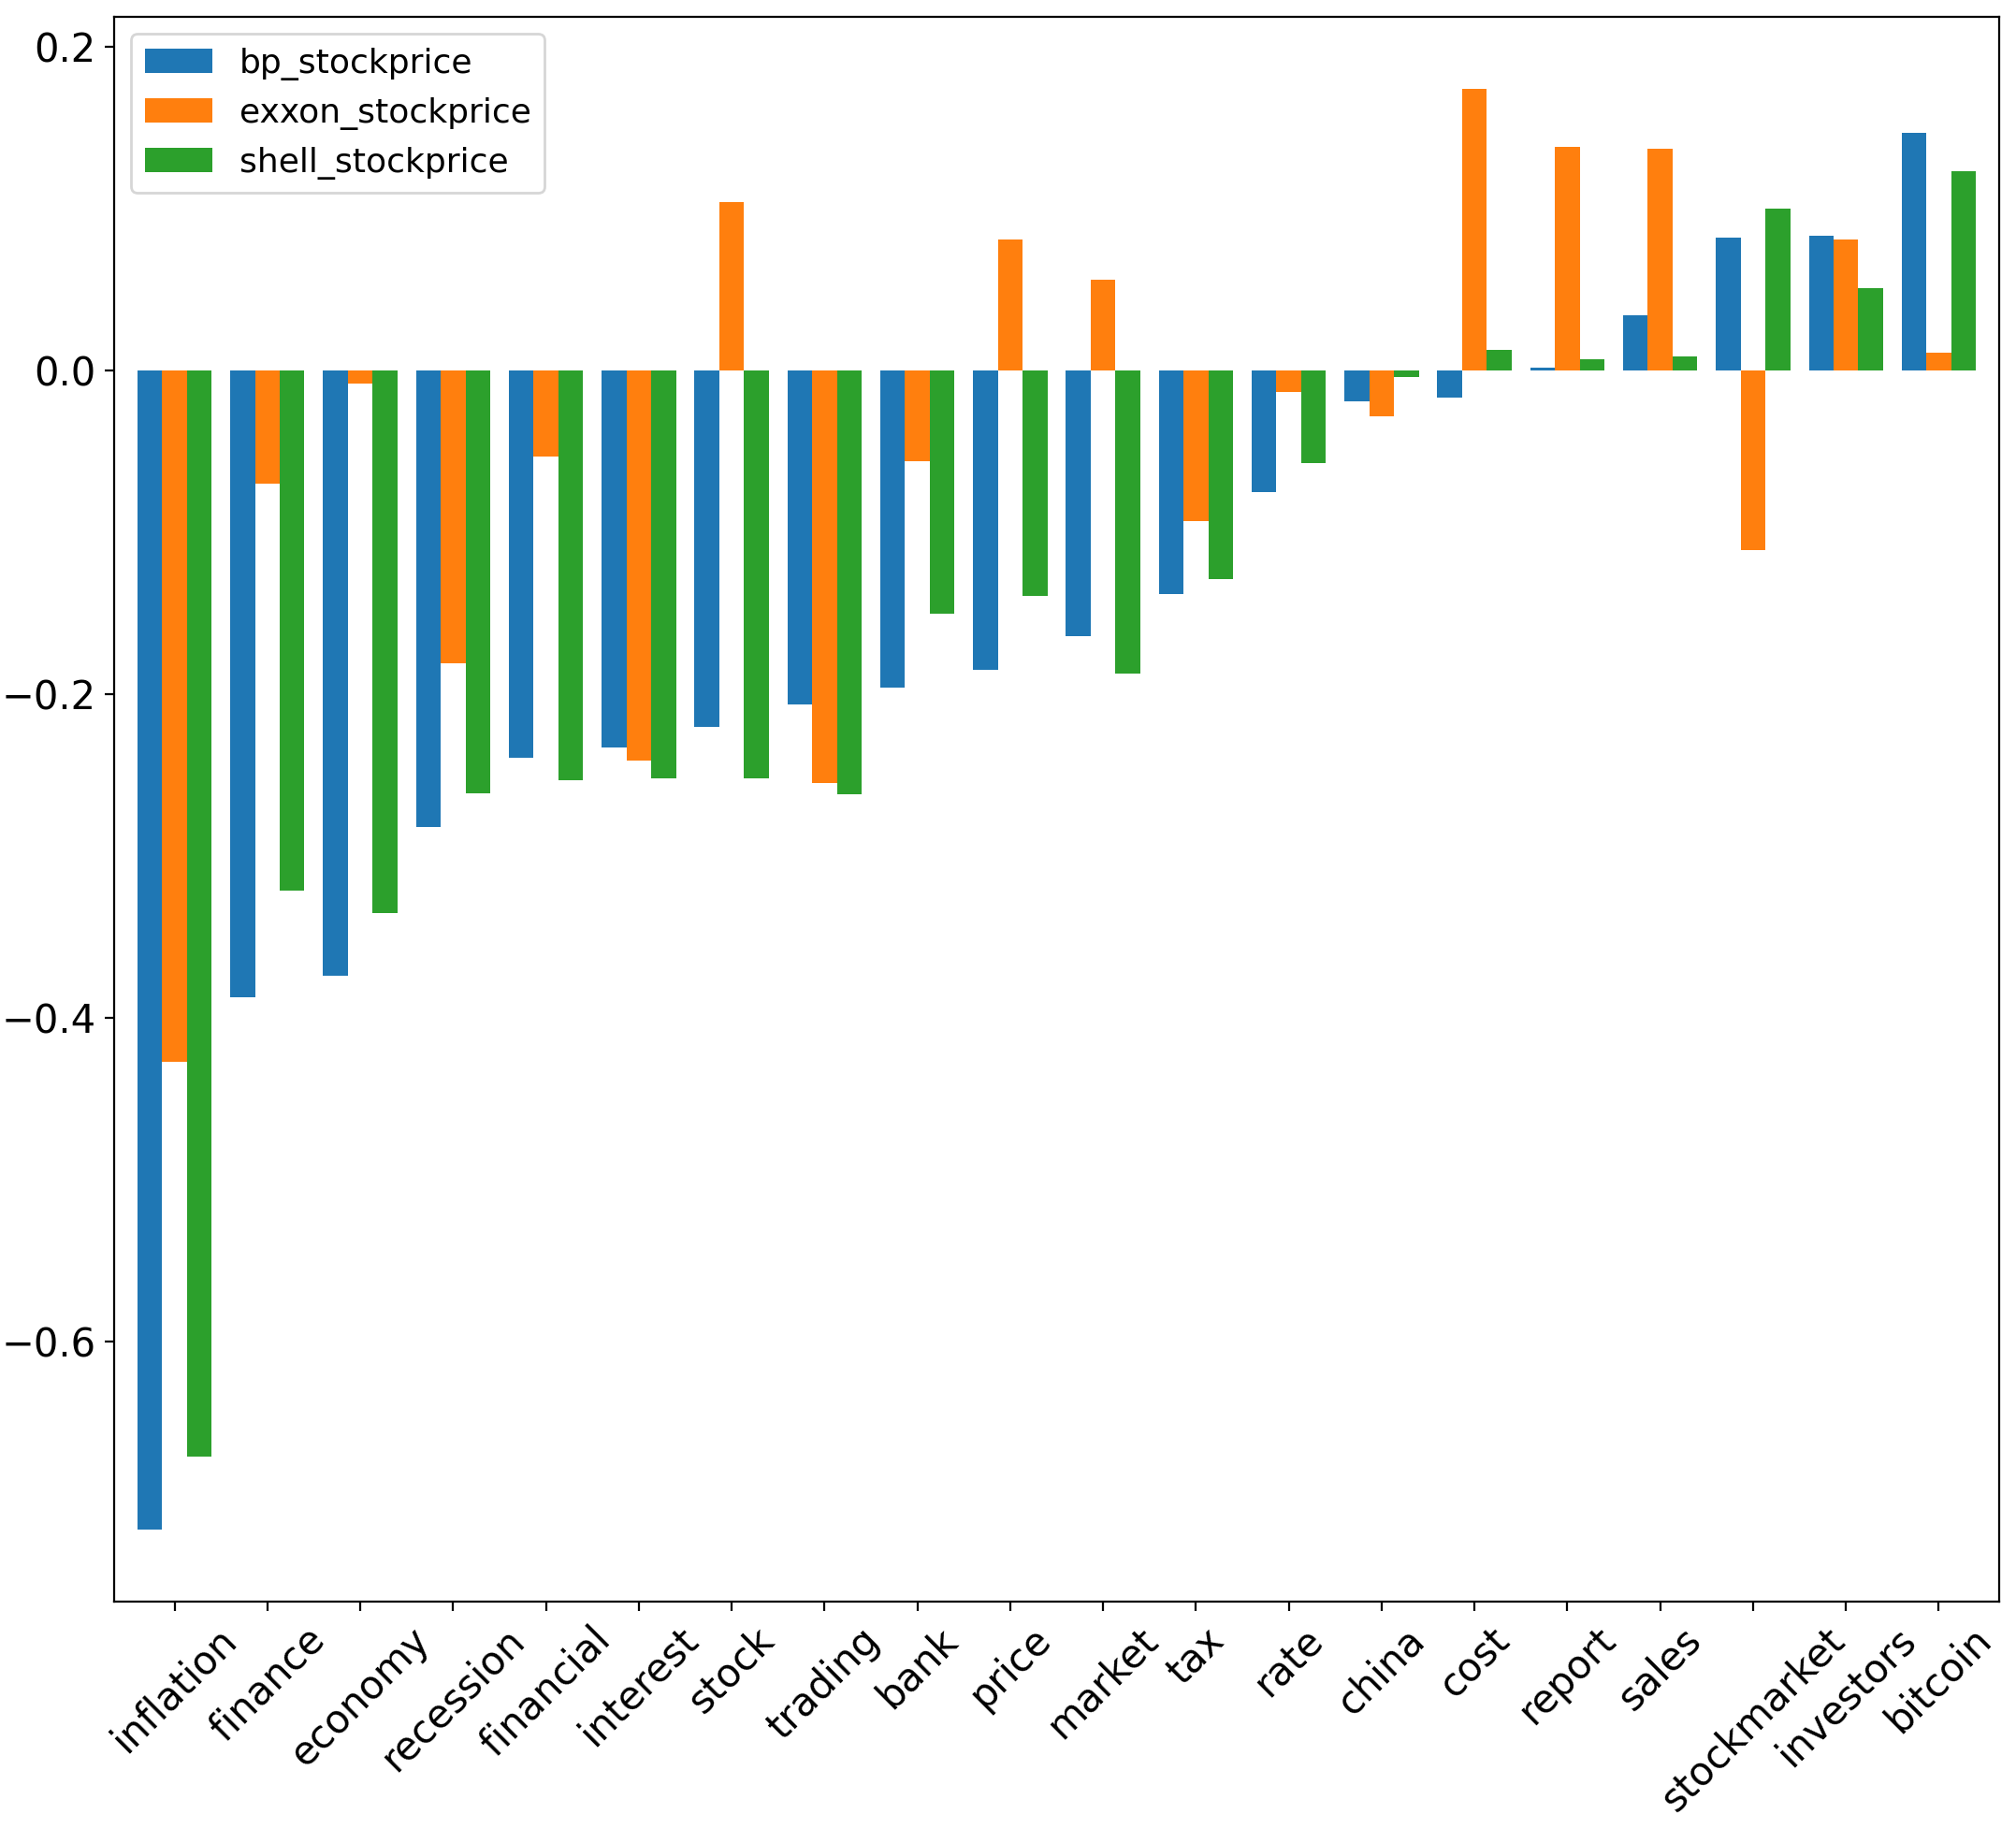
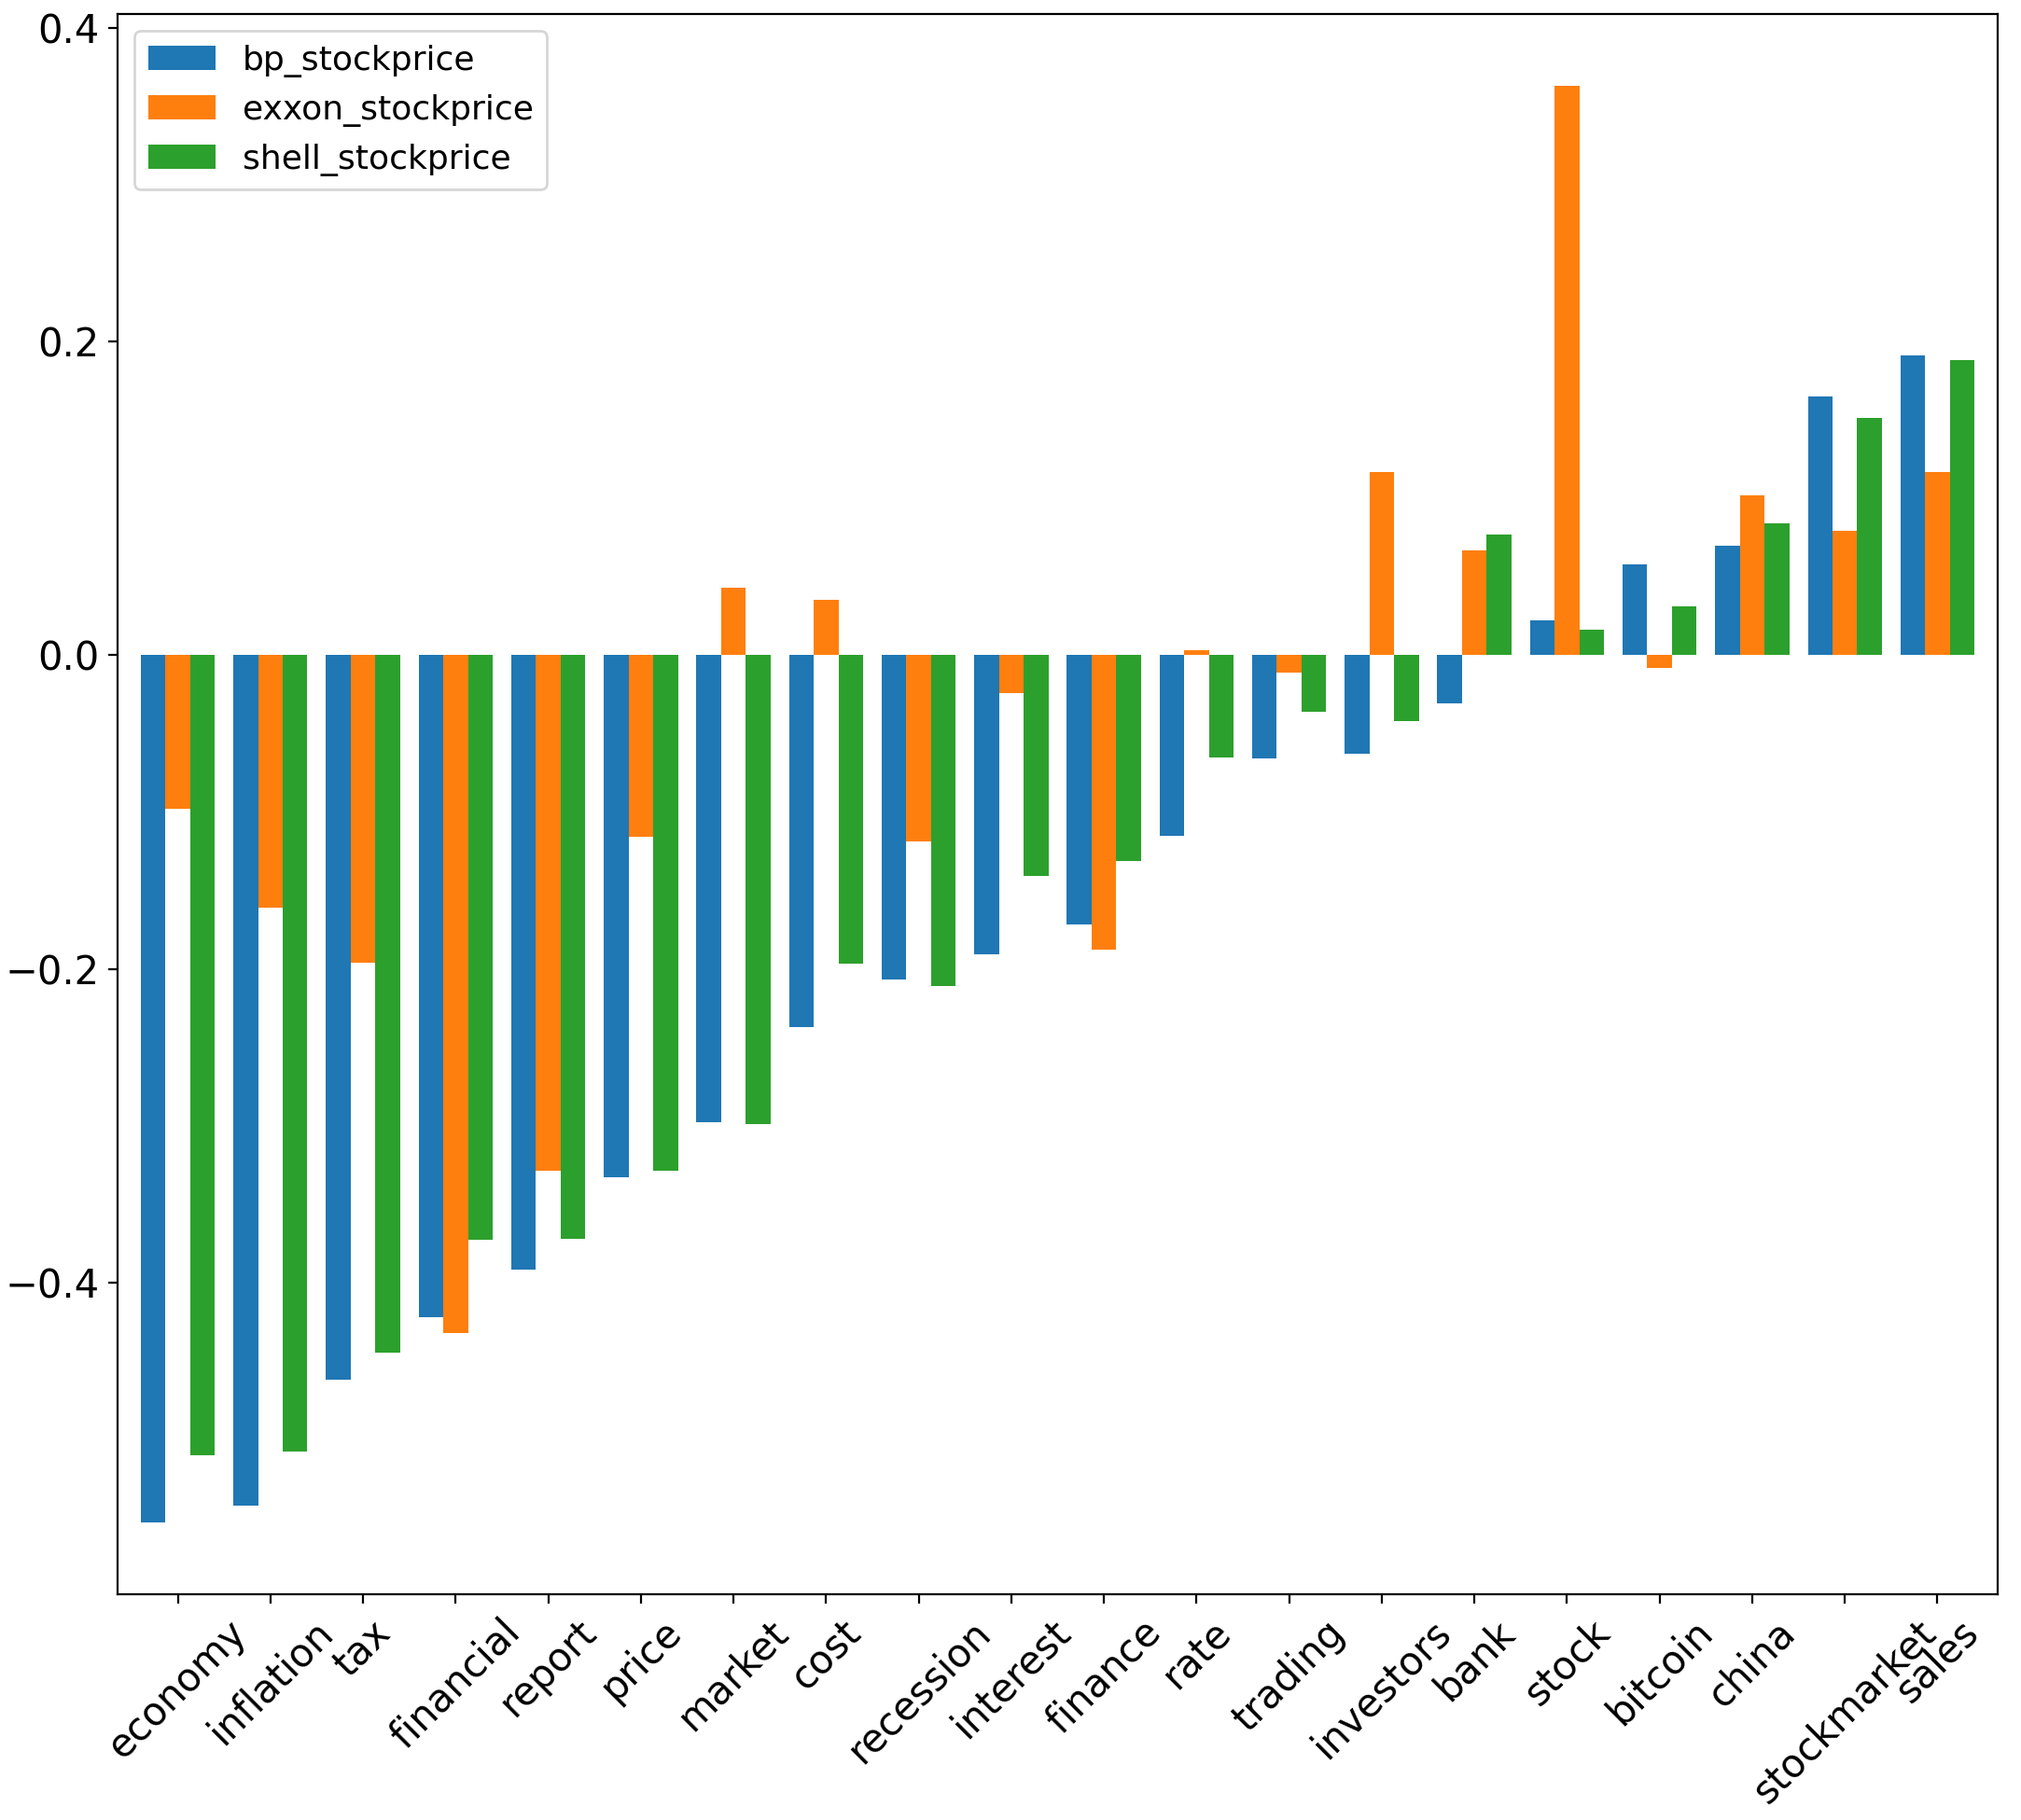
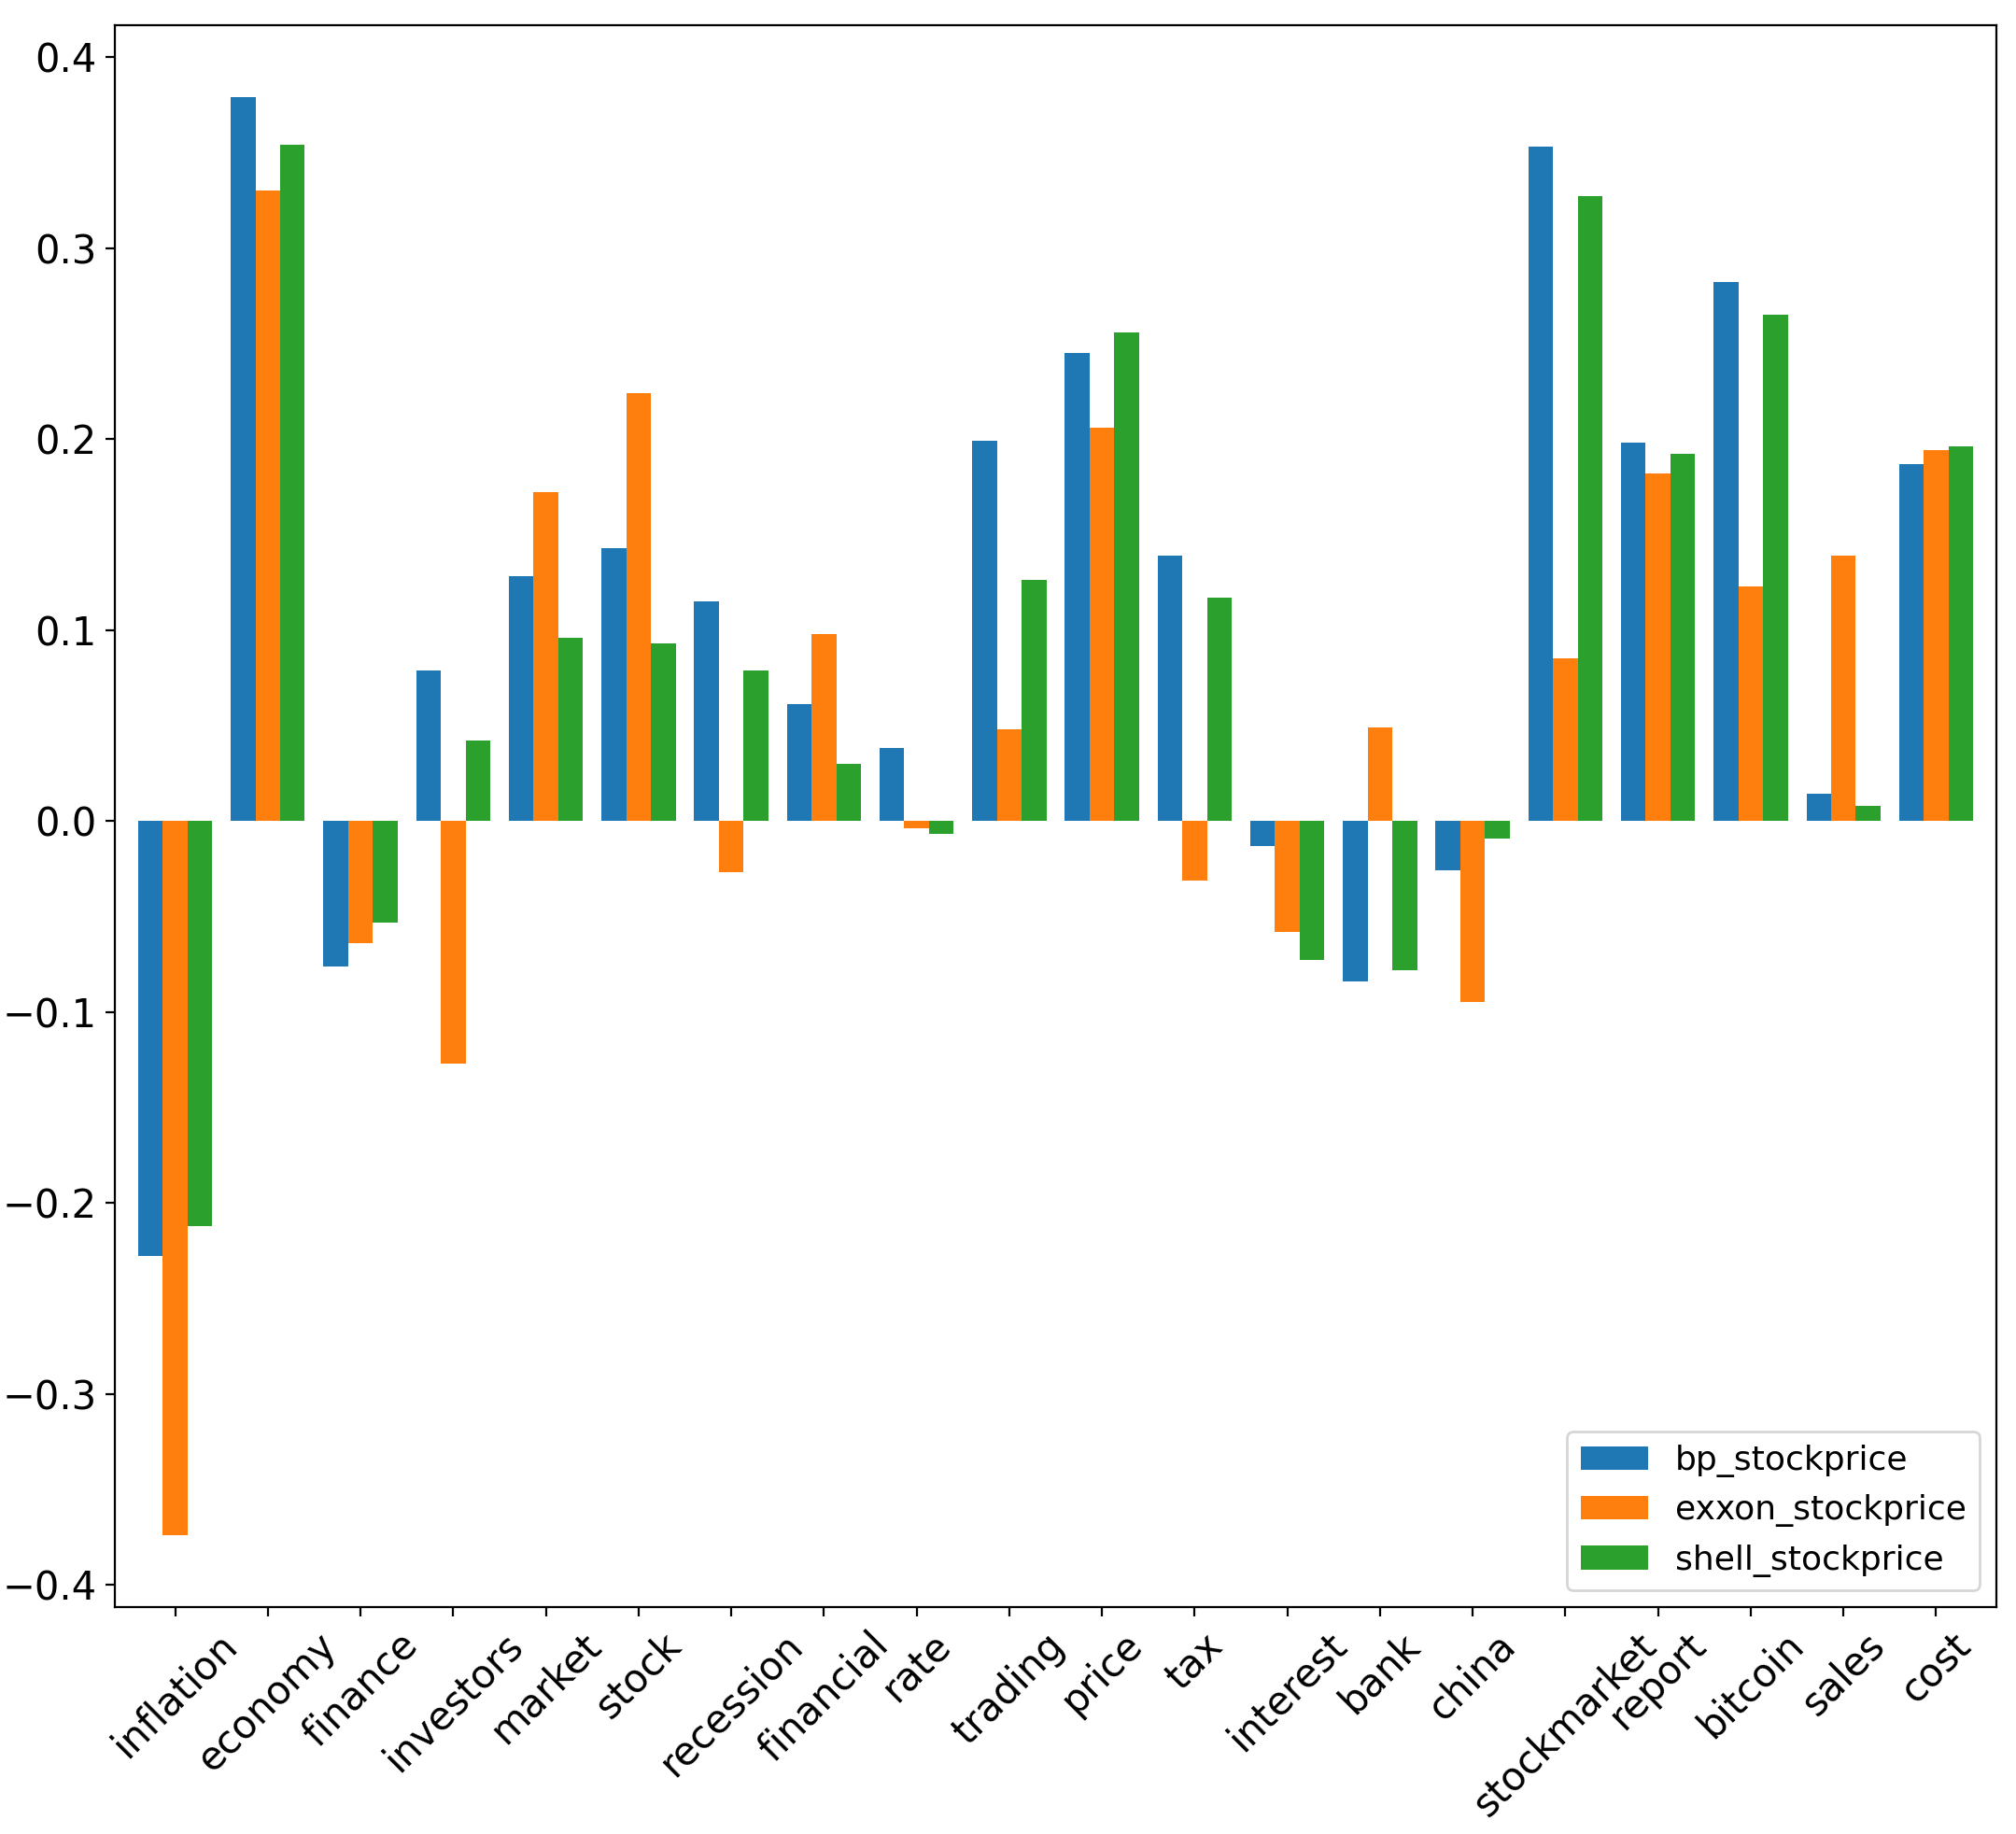
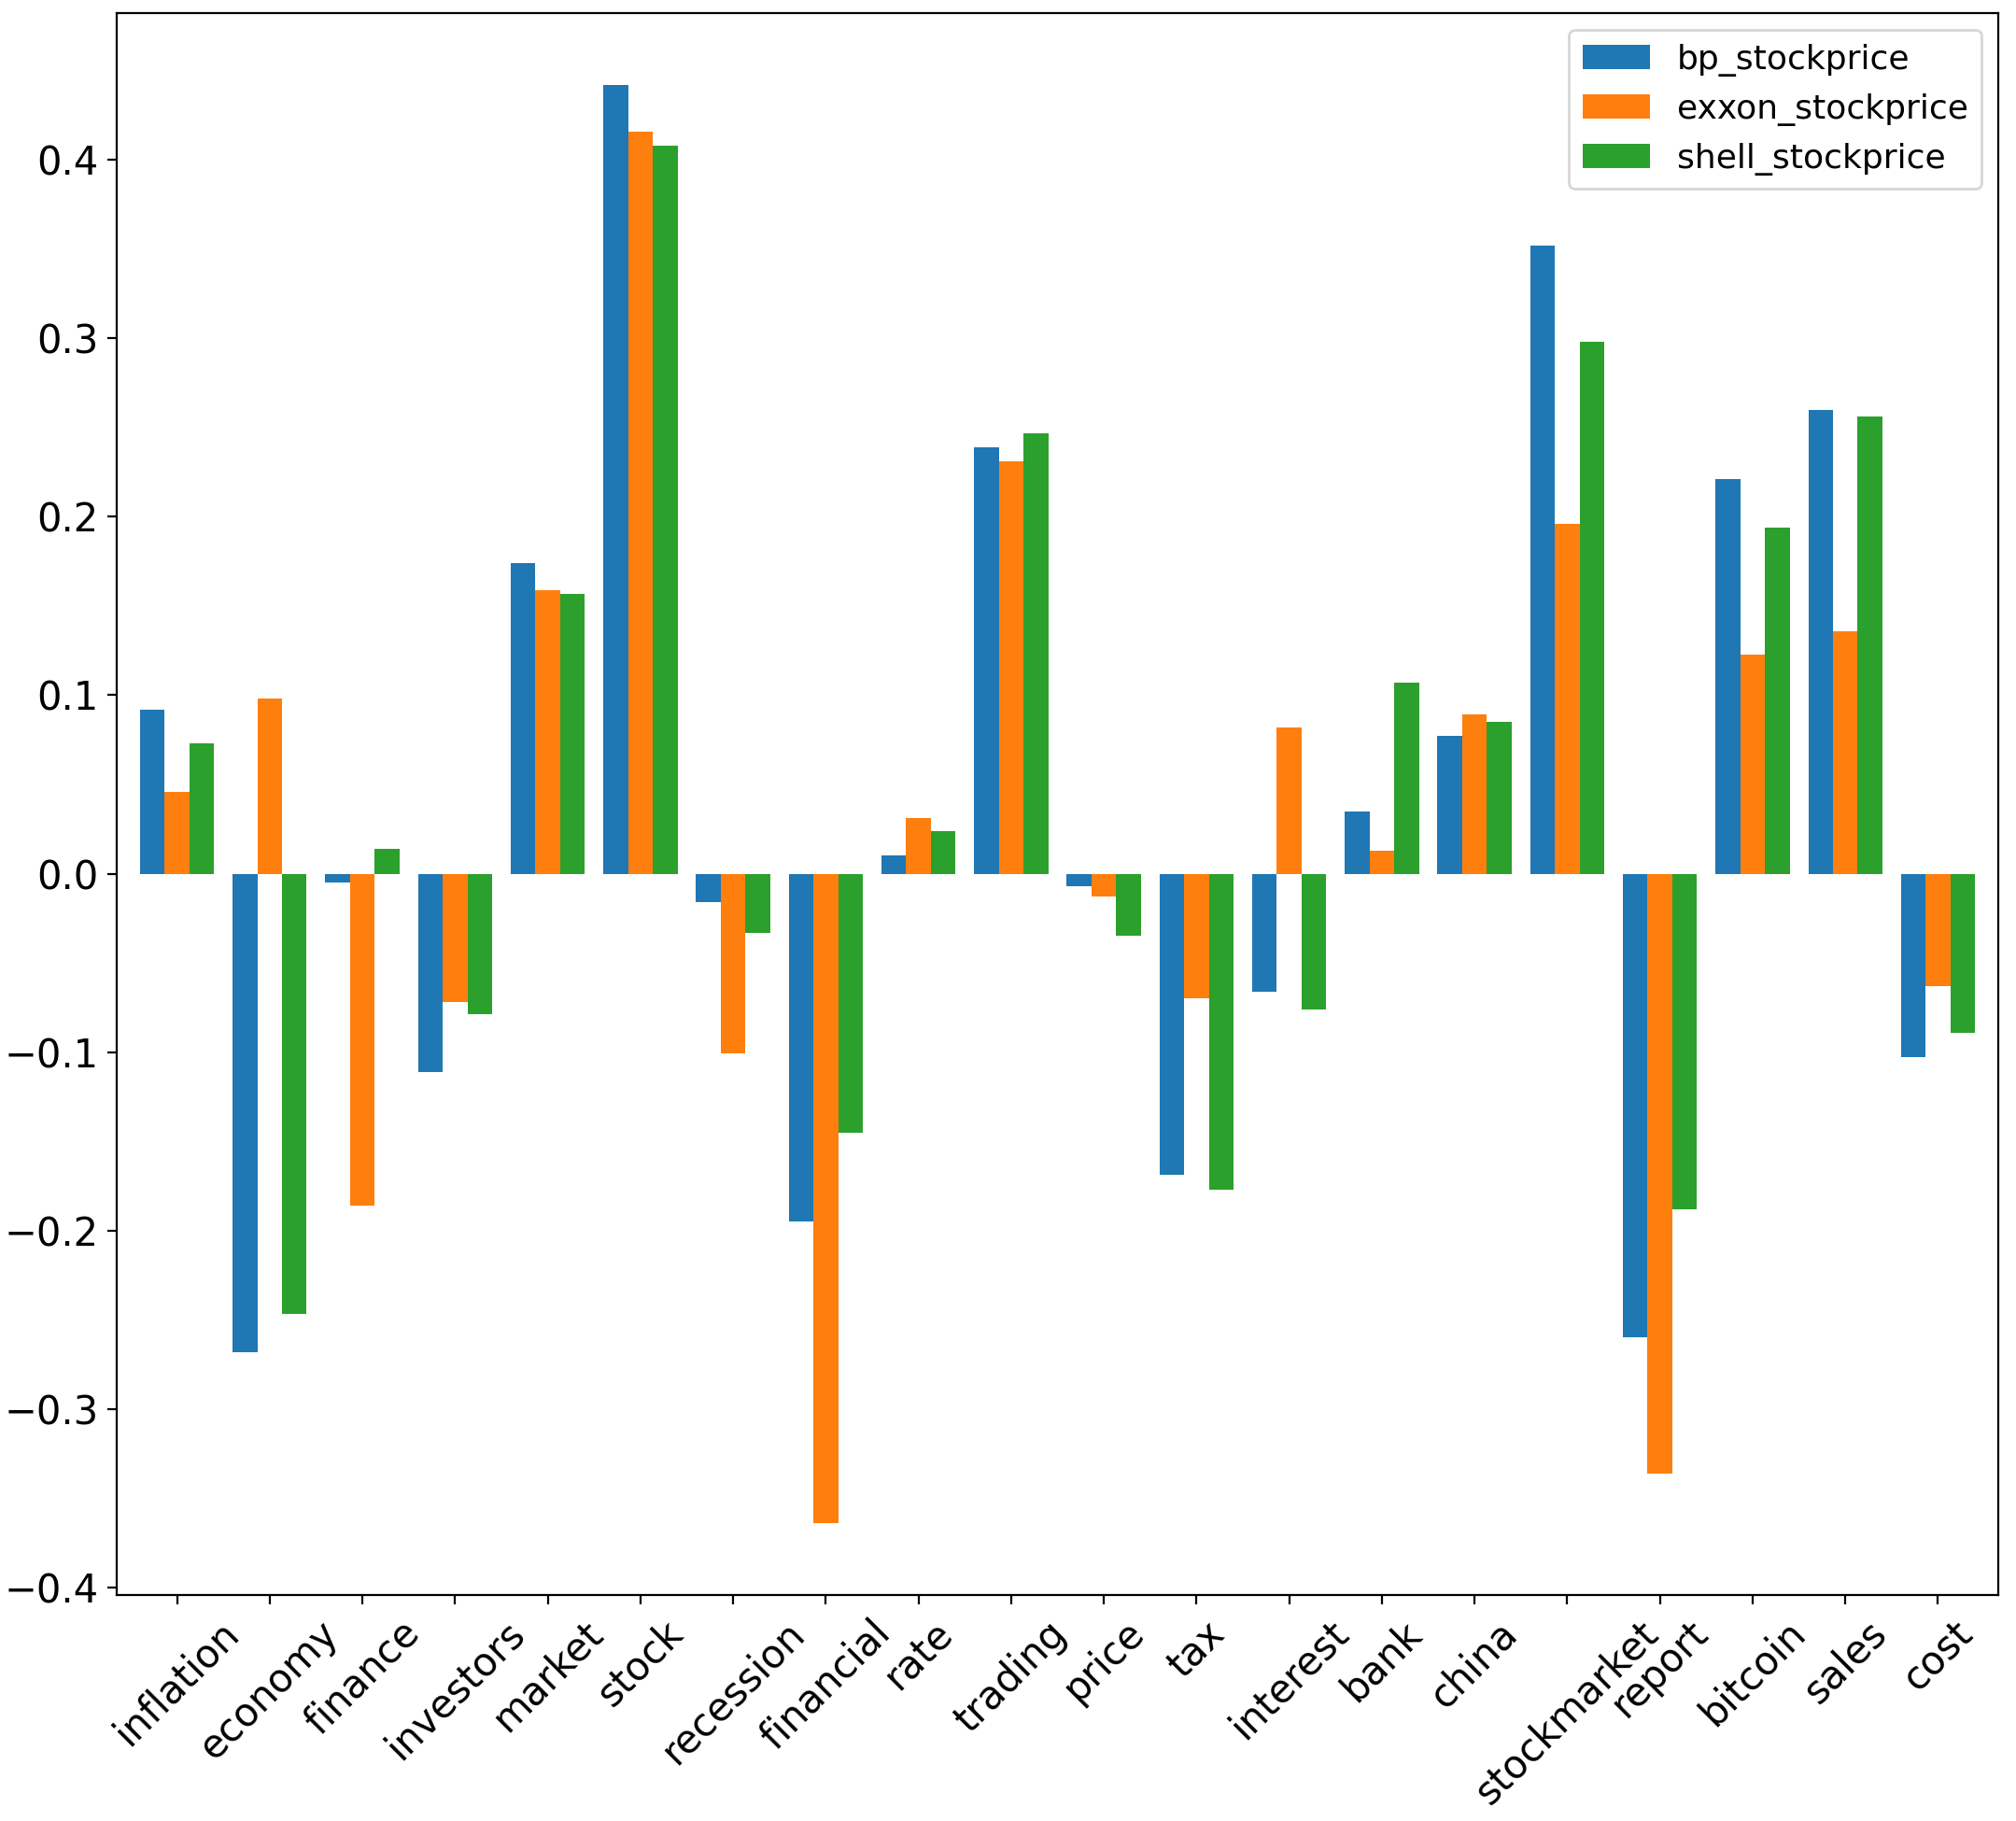
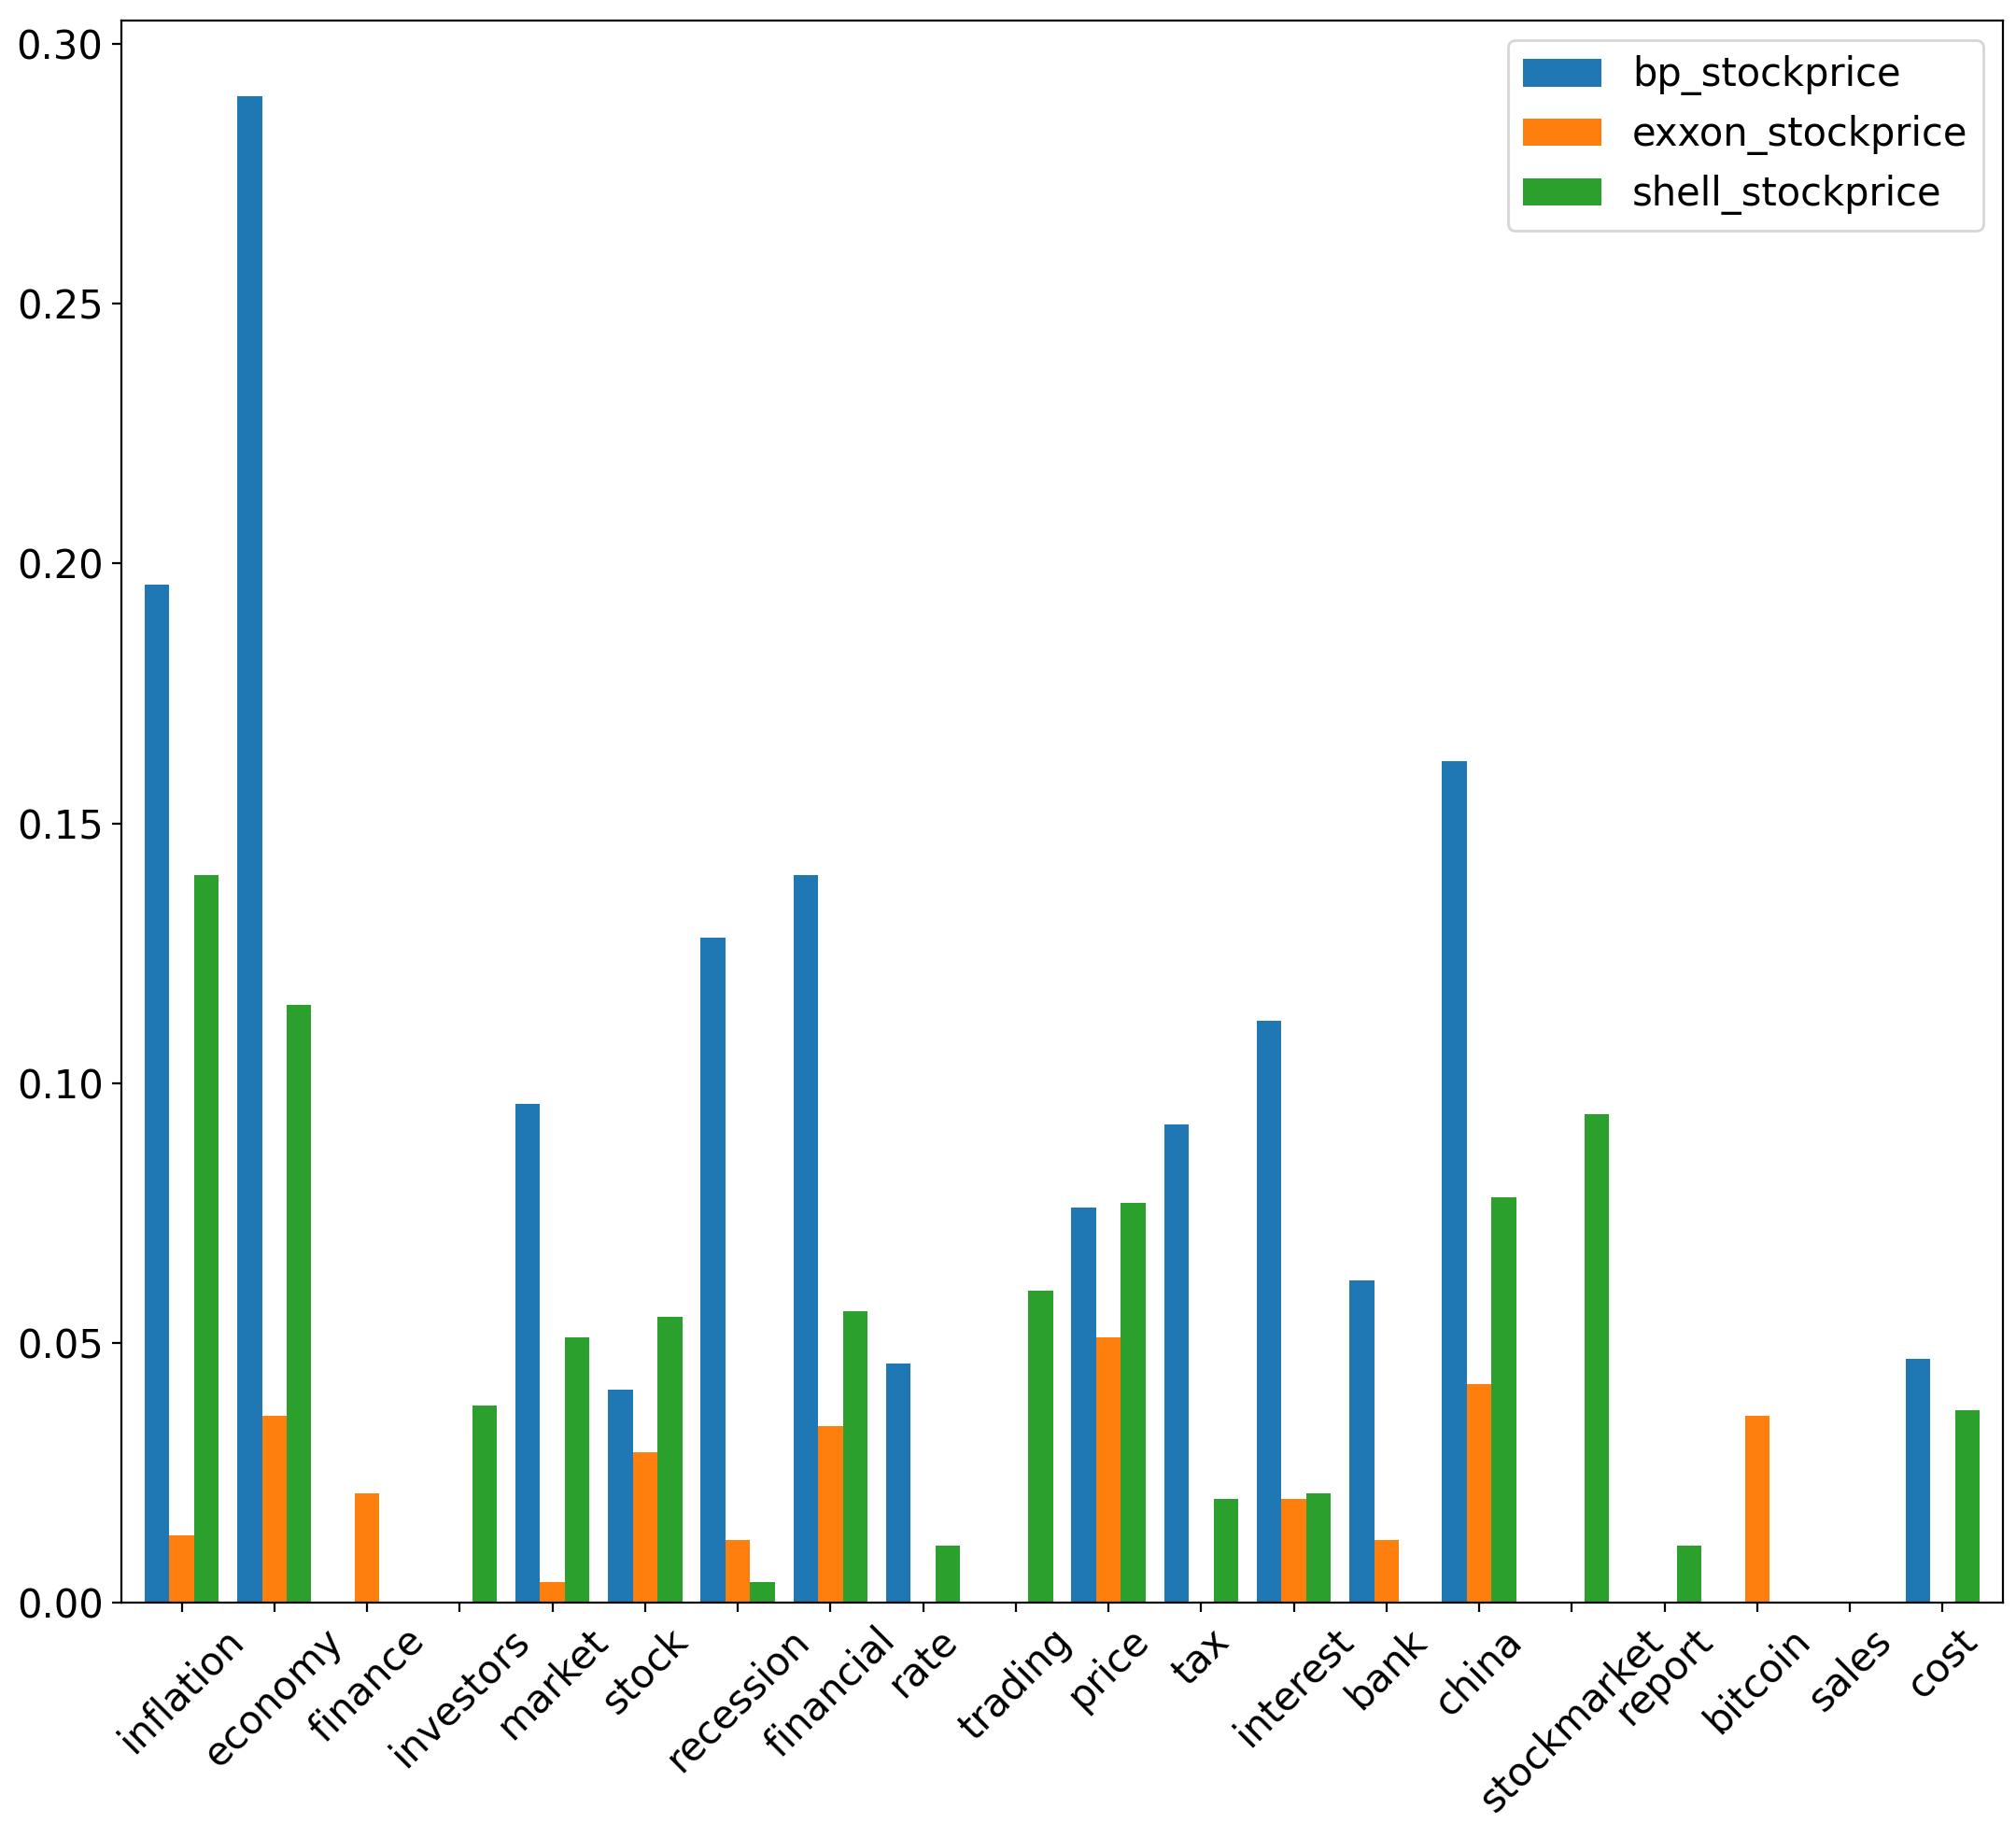
We highlight the greatest uncertainty coefficient values between sentiment scores and stock prices for traditional energy stocks. Specifically, among all uncertainty coefficient values corresponding to & , uncertainty coefficient values are greatest between corresponding to inflation & , at 0.261. Uncertainty coefficient values are also relatively high between corresponding to stock and ( & ), at 0.158 & 0.145, respectively. Among all uncertainty coefficient values corresponding to & , the uncertainty coefficient values between corresponding to (economy, inflation, china, financial) & are highest at 0.29, 0.196, 0.162 & 0.14 respectively. Additionally, the uncertainty coefficient value between corresponding to inflation & is relatively high at 0.14. These uncertainty coefficient values are significant compared to those yielded between corresponding to different aspects & of different traditional energy stocks.
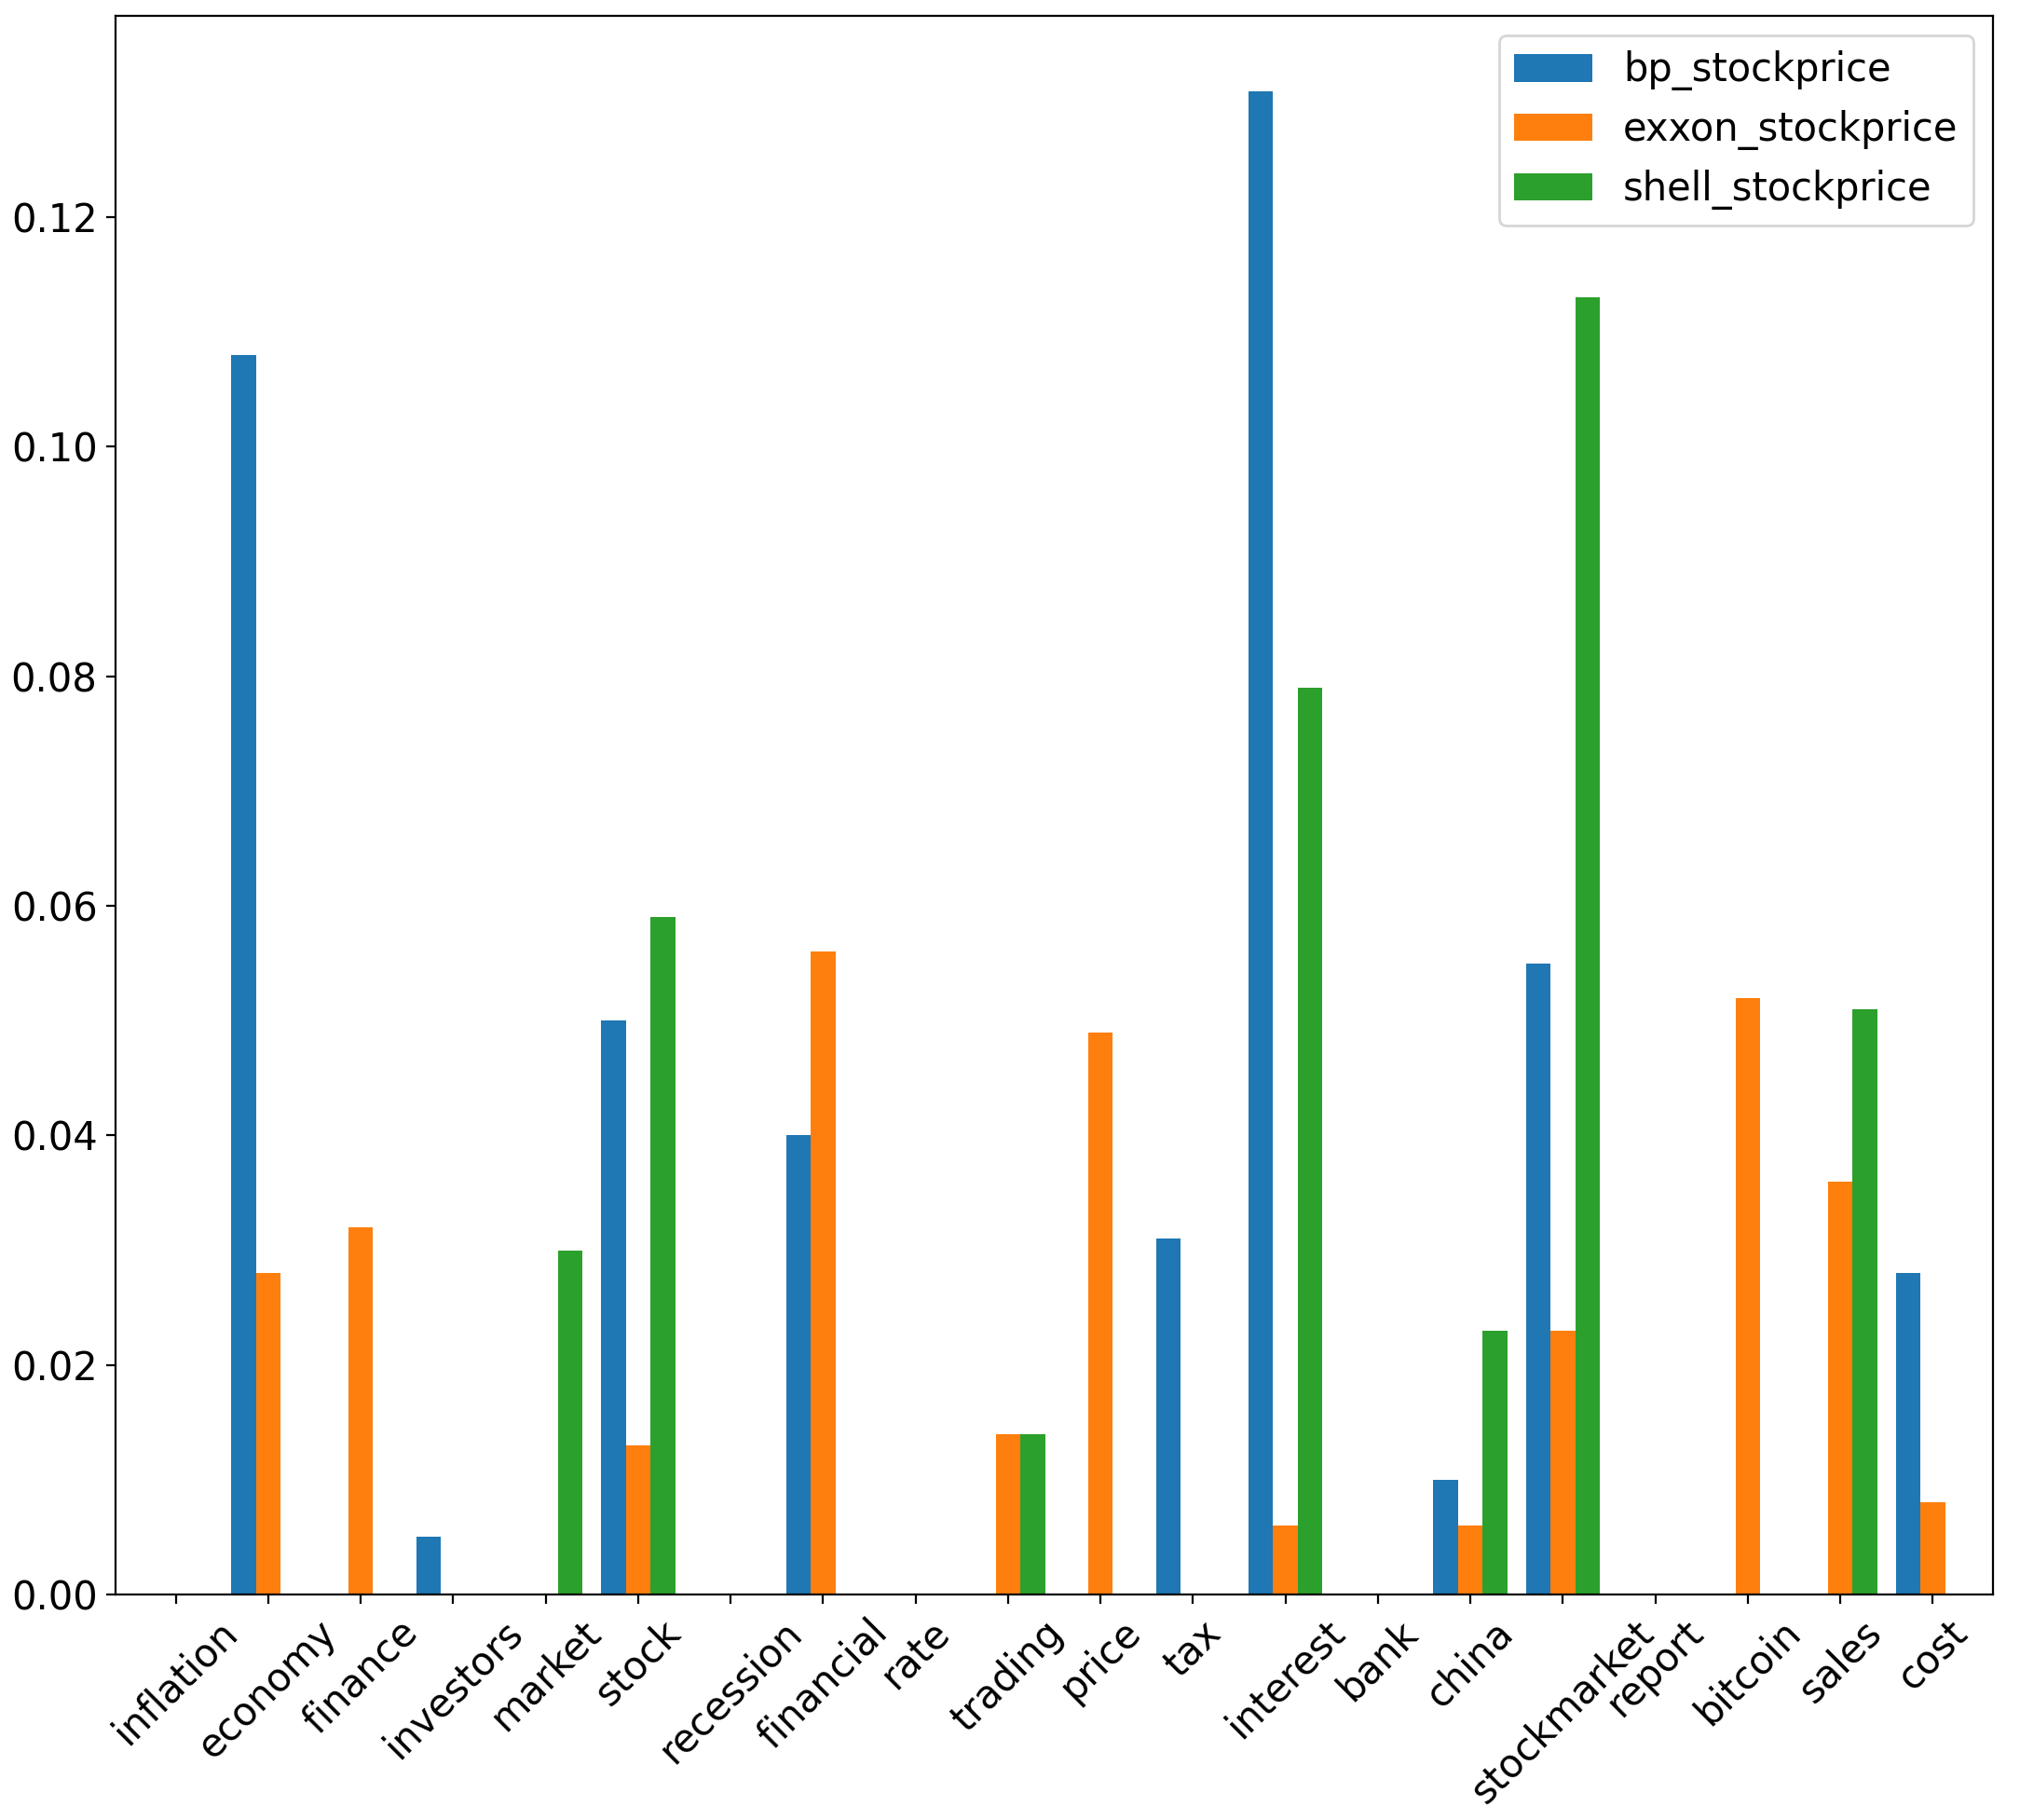
Between corresponding to (bitcoin, stockmarket, tax) & , uncertainty coefficient values are at 0.089, 0.085 & 0.075 respectively. Furthermore, for price & yields an uncertainty coefficient value of 0.074. These values are significant relative to uncertainty coefficents derived between of other aspects and different traditional energy . Between of (interest, economy) & , uncertainty coefficient values are at 0.131 & 0.108 respectively. Moreover, the uncertainty coefficient between stockmarket & is at 0.113. These values are significant relative to uncertainty coefficients derived between of other aspects and various traditional energy .
X Discussion
X-A Financially explainable correlations
We will interpret financially meaningful aspects that have a clear correlation, , between different aspect sentiment scores, , and stock prices . For the aspect tax, yields with , & . For price, yields with . For financial, yields with & , while yields with . For economy, yields with the , & , while yields significant with . In other words, a reduction in negative sentiment scores with respect to the aspects tax, price, financial, economy is correlated with an increase in prices for separate stocks. The economic interpretation of this is that higher stock prices are correlated with a reduction in pessimism (which essentially translates to more optimism) pertaining to the different components for economic and business conditions (taxes, prices, financial situation) as well as the economy in general. Additionally, for stockmarket, yields with . This indicates that greater positive sentiment about the stockmarket is correlated with a rise in nextera stock price.
Our results are consistent with the findings of [39], [40] & [41] which state that positive sentiments usually lead to rises in stock prices. However, our findings also add a greater level of granularity to this proven relationship, as through ABSA, we distinguished between the sentiment relating to different financial aspects. As such, these results possess the capacity to be made explainable and intelligible through economic and financial theory. To elaborate, our findings corroborate with [42], which describes how positive sentiment for economic and business conditions (i.e. tax, prices, financial situation), as well as the economy & stockmarket, can pertain to higher confidence amongst investors, delineating to increases in stock prices.
However, there are also correlation results whose interpretations are less clear. For instance, both and corresponding to inflation yields with , & . As they have similar r values, these stocks might be more strongly correlated with the frequency of occurrence of the inflation aspect as opposed to sentiment scores. Other aspects such as finance & stock also yield unexpected results. For finance, is yielded between & , while for the stock aspect, , & yield with . Pearson correlation shows a stronger link between aspect sentiment scores and traditional energy stocks than sustainable ones. Literature suggests Twitter sentiment has limited influence on renewable energy stock prices [43]. We plan to explore if this is because the sustainable energy sector is relatively nascent and its stocks may not align as closely with financial sentiment as traditional energy stocks.
X-B Granger causality of sentiment scores with stock prices
We reference Granger causality results to complement the Pearson correlation results we obtained. In addition to deriving explainable and significant correlations between various financial aspect sentiment scores and stock prices, Granger causality is indicative of the forecasting power of these sentiment scores for stock prices and confirms the interdependent relationship between them. We believe a more robust and useful analyses of correlation can be done by utilising Granger causality in tandem with Pearson correlation. Chiefly, we highlight specific aspect sentiment scores that are not only strongly correlated with stock prices, but also contain sufficient information to forecast future stock prices, highlighting an interdependent relationship. corresponding to the financial aspect Granger causes &, and an explainable and significant correlation is also present between them. On the other hand, for the stock aspect Granger causes and shows significant correlation as well.
X-C Interpreting the most statistically significant aspects via uncertainty coefficient
Studies have shown that the relationship between textual sentiment and stock pricing is intricate [44], and stock pricing is also driven by numerous (sentiment) features [45]. To clarify this complexity, we propose integrating ABSA with the uncertainty coefficient. We enhance interpretability by computing uncertainty coefficient. This variable measures the degree of information provided by aspect sentiment scores with regard to stock prices. As such, we aim to identify the most statistically significant aspect sentiment scores related to stock prices. Our findings indicate that uncertainty coefficient values are higher between absolute aspect sentiment scores and stock prices as compared to normalised sentiment scores, suggesting absolute sentiment scores offer more insight into stock prices. Additionally, uncertainty coefficient values are higher for traditional energy stocks compared to sustainable ones.
Next, we analyze the uncertainty coefficient values to assess which aspect sentiment scores offer the most valuable information regarding stock prices. Among all aspect sentiment scores and stock prices, the highest uncertainty coefficient is observed between related to the economy and . Following closely is the uncertainty coefficient between for inflation and . Furthermore, for , , and , sentiment scores related to inflation exhibit the highest uncertainty coefficient values. Lastly, when focusing on , sentiment scores for economy also possess among the highest uncertainty coefficients compared to other aspects.
In summary, sentiment scores concerning the economy and inflation consistently contain the most informative signals regarding various stock prices. Relative to sentiment scores for other aspects, they possess the greatest uncertainty coefficient values with respect to stock prices. Additionally, sentiment scores for other aspects, such as financial, china, stockmarket, interest, stock, tax, price, bitcoin, cost, bank, market, also exhibit elevated uncertainty coefficient values with stock prices. Notably, sentiment scores for financial show not only high uncertainty coefficient values but also a strong and explainable correlation and Granger causality with stock prices.
XI Conclusion & Future Work
This paper introduces an explainable financial analysis method using aspect-based sentiment analysis, Pearson coefficient, Granger causality, and uncertainty coefficient. It showcases the enhanced explainability and robustness achieved by integrating these statistical methods with aspect based sentiment analysis and stock prices.
The study has limitations, including its brief duration, focus on energy stocks, and use of generic social media data. Future endeavors will lengthen the study, target company-specific data, and delve into non-linear dynamics using interpretable neural networks. We also aim to incorporate microtext normalization [46], text mining, emotion metrics [47], and advanced interpretability methods [48]. Recent strides in neurosymbolic AI for sentiment analysis [49], [50], also offer promising avenues for enhancing explainability in financial AI applications.
References
- [1] C. Rudin, “Stop explaining black box machine learning models for high stakes decisions and use interpretable models instead,” Nature machine intelligence, vol. 1, no. 5, pp. 206–215, 2019.
- [2] B. Liang, H. Su, L. Gui, E. Cambria, and R. Xu, “Aspect-based sentiment analysis via affective knowledge enhanced graph convolutional networks,” Knowledge-Based Systems, vol. 235, p. 107643, 2022.
- [3] L. Oneto, F. Bisio, E. Cambria, and D. Anguita, “Statistical learning theory and ELM for big social data analysis,” IEEE Computational Intelligence Magazine, vol. 11, no. 3, pp. 45–55, 2016.
- [4] E. Cambria, A. Hussain, C. Havasi, and C. Eckl, “Common sense computing: From the society of mind to digital intuition and beyond,” in Biometric ID Management and Multimodal Communication, ser. Lecture Notes in Computer Science. Berlin Heidelberg: Springer, 2009, vol. 5707, pp. 252–259.
- [5] F. Xing, F. Pallucchini, and E. Cambria, “Cognitive-inspired domain adaptation of sentiment lexicons,” Information Processing and Management, vol. 56, no. 3, pp. 554–564, 2019.
- [6] E. Cambria, T. Mazzocco, A. Hussain, and C. Eckl, “Sentic medoids: Organizing affective common sense knowledge in a multi-dimensional vector space,” ser. Lecture Notes in Computer Science. Berlin Heidelberg: Springer-Verlag, 2011, vol. 6677, pp. 601–610.
- [7] E. Cambria, B. Schuller, B. Liu, H. Wang, and C. Havasi, “Statistical approaches to concept-level sentiment analysis,” IEEE Intelligent Systems, vol. 28, no. 3, pp. 6–9, 2013.
- [8] A. Valdivia, V. Luzón, E. Cambria, and F. Herrera, “Consensus vote models for detecting and filtering neutrality in sentiment analysis,” Information Fusion, vol. 44, pp. 126–135, 2018.
- [9] E. Cambria, R. Mao, M. Chen, Z. Wang, and S.-B. Ho, “Seven pillars for the future of AI,” IEEE Intelligent Systems, vol. 38, no. 6, 2023.
- [10] R. Mao and X. Li, “Bridging towers of multi-task learning with a gating mechanism for aspect-based sentiment analysis and sequential metaphor identification,” in Proceedings of the AAAI conference on artificial intelligence, vol. 35, no. 15, 2021, pp. 13 534–13 542.
- [11] K. He, R. Mao, T. Gong, C. Li, and E. Cambria, “Meta-based self-training and re-weighting for aspect-based sentiment analysis,” IEEE Transactions on Affective Computing, vol. 15, 2024.
- [12] H. Jangid, S. Singhal, R. R. Shah, and R. Zimmermann, “Aspect-based financial sentiment analysis using deep learning,” in Companion Proceedings of the The Web Conference 2018, 2018, pp. 1961–1966.
- [13] S. Yang, J. Rosenfeld, and J. Makutonin, “Financial aspect-based sentiment analysis using deep representations,” arXiv preprint arXiv:1808.07931, 2018.
- [14] X. Man, T. Luo, and J. Lin, “Financial sentiment analysis (FSA): A survey,” in 2019 IEEE International Conference on Industrial Cyber Physical Systems (ICPS). IEEE, 2019, pp. 617–622.
- [15] Y. Ma, R. Mao, Q. Lin, P. Wu, and E. Cambria, “Multi-source aggregated classification for stock price movement prediction,” Information Fusion, vol. 91, pp. 515–528, 2023.
- [16] Z. Wang, Z. Hu, F. Li, S.-B. Ho, and E. Cambria, “Learning-based stock trending prediction by incorporating technical indicators and social media sentiment,” Cognitive Computation, vol. 15, no. 3, pp. 1092–1102, 2023.
- [17] A. Picasso, S. Merello, Y. Ma, L. Oneto, and E. Cambria, “Technical analysis and sentiment embeddings for market trend prediction,” Expert Systems with Applications, vol. 135, pp. 60–70, 2019.
- [18] S. Gite, H. Khatavkar, K. Kotecha, S. Srivastava, P. Maheshwari, and N. Pandey, “Explainable stock prices prediction from financial news articles using sentiment analysis,” PeerJ Computer Science, vol. 7, p. e340, 2021.
- [19] L. Luo, X. Ao, F. Pan, J. Wang, T. Zhao, N. Yu, and Q. He, “Beyond polarity: Interpretable financial sentiment analysis with hierarchical query-driven attention.” in IJCAI, 2018, pp. 4244–4250.
- [20] E. Loginova, W. K. Tsang, G. van Heijningen, L.-P. Kerkhove, and D. F. Benoit, “Forecasting directional bitcoin price returns using aspect-based sentiment analysis on online text data,” Machine Learning, pp. 1–24, 2021.
- [21] Y. Ruan, A. Durresi, and L. Alfantoukh, “Using twitter trust network for stock market analysis,” Knowledge-Based Systems, vol. 145, pp. 207–218, 2018.
- [22] T.-H. Lee and W. Yang, “Granger-causality in quantiles between financial markets: Using copula approach,” International Review of Financial Analysis, vol. 33, pp. 70–78, 2014.
- [23] X. Chu, C. Wu, and J. Qiu, “A nonlinear granger causality test between stock returns and investor sentiment for chinese stock market: a wavelet-based approach,” Applied Economics, vol. 48, no. 21, pp. 1915–1924, 2016.
- [24] I. Hamraoui and A. Boubaker, “Impact of twitter sentiment on stock price returns,” Social Network Analysis and Mining, vol. 12, no. 1, p. 28, 2022.
- [25] K. Kim, D. Ryu, and H. Yang, “Information uncertainty, investor sentiment, and analyst reports,” International Review of Financial Analysis, vol. 77, p. 101835, 2021.
- [26] J. Birru and T. Young, “Sentiment and uncertainty,” Journal of Financial Economics, vol. 146, no. 3, pp. 1148–1169, 2022.
- [27] R. Satapathy, I. Chaturvedi, E. Cambria, S. S. Ho, and J. C. Na, “Subjectivity detection in nuclear energy tweets,” Computación y Sistemas, vol. 21, no. 4, pp. 657–664, 2017.
- [28] D. Rajagopal, E. Cambria, D. Olsher, and K. Kwok, “A graph-based approach to commonsense concept extraction and semantic similarity detection,” in WWW, 2013, pp. 565–570.
- [29] A. Salunkhe and S. Mhaske, “Aspect based sentiment analysis on financial data using transferred learning approach using pre-trained bert and regressor model,” Int. Res. J. Eng. Technol.(IRJET), vol. 6, pp. 1097–1101, 2019.
- [30] M. El-Haj, P. E. Rayson, S. E. Young, M. Walker, A. Moore, V. Athanasakou, and T. Schleicher, “Learning tone and attribution for financial text mining,” 2016.
- [31] Y. Chen, R. M. Rabbani, A. Gupta, and M. J. Zaki, “Comparative text analytics via topic modeling in banking,” in 2017 IEEE Symposium Series on Computational Intelligence (SSCI). IEEE, 2017, pp. 1–8.
- [32] J. Smailović, M. Grčar, N. Lavrač, and M. Žnidaršič, “Predictive sentiment analysis of tweets: A stock market application,” in Human-Computer Interaction and Knowledge Discovery in Complex, Unstructured, Big Data: Third International Workshop, HCI-KDD 2013, Held at SouthCHI 2013, Maribor, Slovenia, July 1-3, 2013. Proceedings. Springer, 2013, pp. 77–88.
- [33] C. W. Granger, “Investigating causal relations by econometric models and cross-spectral methods,” Econometrica: journal of the Econometric Society, pp. 424–438, 1969.
- [34] C. Hiemstra and J. D. Jones, “Testing for linear and nonlinear granger causality in the stock price-volume relation,” The Journal of Finance, vol. 49, no. 5, pp. 1639–1664, 1994.
- [35] A. Abhyankar, L. S. Copeland, and W. Wong, “Uncovering nonlinear structure in real-time stock-market indexes: the s&p 500, the dax, the nikkei 225, and the ftse-100,” Journal of Business & Economic Statistics, vol. 15, no. 1, pp. 1–14, 1997.
- [36] M. Abramowitz and I. Stegun, “Handbook of mathematical functions with formulas, graphs, and mathematical tables” edited by dover publications,” Inc., New York, Ninth Printing, 1970.
- [37] L. F. Kozachenko and N. N. Leonenko, “Sample estimate of the entropy of a random vector,” Problemy Peredachi Informatsii, vol. 23, no. 2, pp. 9–16, 1987.
- [38] G. Li, A. Zhang, Q. Zhang, D. Wu, and C. Zhan, “Pearson correlation coefficient-based performance enhancement of broad learning system for stock price prediction,” IEEE Transactions on Circuits and Systems II: Express Briefs, vol. 69, no. 5, pp. 2413–2417, 2022.
- [39] E. Ugurlu-Yildirim, B. Kocaarslan, and B. M. Ordu-Akkaya, “Monetary policy uncertainty, investor sentiment, and us stock market performance: New evidence from nonlinear cointegration analysis,” International Journal of Finance & Economics, vol. 26, no. 2, pp. 1724–1738, 2021.
- [40] J. B. De Long, A. Shleifer, L. H. Summers, and R. J. Waldmann, “Noise trader risk in financial markets,” Journal of political Economy, vol. 98, no. 4, pp. 703–738, 1990.
- [41] A. Siganos, E. Vagenas-Nanos, and P. Verwijmeren, “Facebook’s daily sentiment and international stock markets,” Journal of Economic Behavior & Organization, vol. 107, pp. 730–743, 2014.
- [42] H.-C. Shu and J.-H. Chang, “Investor sentiment and financial market volatility,” Journal of Behavioral Finance, vol. 16, no. 3, pp. 206–219, 2015.
- [43] J. C. Reboredo and A. Ugolini, “The impact of twitter sentiment on renewable energy stocks,” Energy economics, vol. 76, pp. 153–169, 2018.
- [44] C. Kearney and S. Liu, “Textual sentiment in finance: A survey of methods and models,” International Review of Financial Analysis, vol. 33, pp. 171–185, 2014.
- [45] R. Gupta and M. Chen, “Sentiment analysis for stock price prediction,” in 2020 IEEE conference on multimedia information processing and retrieval (MIPR). IEEE, 2020, pp. 213–218.
- [46] R. Satapathy, E. Cambria, A. Nanetti, and A. Hussain, “A review of shorthand systems: From brachygraphy to microtext and beyond,” Cognitive Computation, vol. 12, pp. 778–792, 2020.
- [47] C. Duong, V. Chithrra Raghuram, A. Lee, R. Mao, G. Mengaldo, and E. Cambria, “Neurosymbolic AI for mining public opinions about wildfires,” Cognitive Computation, 2023.
- [48] H. Turbé, M. Bjelogrlic, C. Lovis, and G. Mengaldo, “Evaluation of post-hoc interpretability methods in time-series classification,” Nature Machine Intelligence, vol. 5, no. 3, pp. 250–260, 2023.
- [49] F. Xing, I. Chaturvedi, E. Cambria, A. Hussain, and B. Schuller, “Guest editorial: Neurosymbolic AI for sentiment analysis,” IEEE Transactions on Affective Computing, vol. 14, no. 4, 2023.
- [50] E. Cambria, Q. Liu, S. Decherchi, F. Xing, and K. Kwok, “Senticnet 7: A commonsense-based neurosymbolic ai framework for explainable sentiment analysis,” in Proceedings of the Thirteenth Language Resources and Evaluation Conference, 2022, pp. 3829–3839.