Field-dependent specific heat of the canonical underdoped cuprate superconductor YBa2Cu4O8
The cuprate superconductor YBa2Cu4O8, in comparison with most other cuprates, has a stable stoichiometry, is largely free of defects and may be regarded as the canonical underdoped cuprate, displaying marked pseudogap behaviour and an associated distinct weakening of superconducting properties. This cuprate ‘pseudogap’ manifests as a partial gap in the electronic density of states at the Fermi level and is observed in most spectroscopic properties. After several decades of intensive study it is widely believed that the pseudogap closes, mean-field like, near a characteristic temperature, , which rises with decreasing hole concentration, . Here, we report extensive field-dependent electronic specific heat studies on YBa2Cu4O8 up to an unprecedented 400 K and show unequivocally that the pseudogap never closes, remaining open to at least 400 K where is typically presumed to be about 150 K. We show from the NMR Knight shift and the electronic entropy that the Wilson ratio is numerically consistent with a weakly-interacting Fermion system for the near-nodal states. And, from the field-dependent specific heat, we characterise the impact of fluctuations and impurity scattering on the thermodynamic properties.
Both the pseudogap Norman1 ; Timusk ; Tstar and the origins of superconductivity in the cuprates remain enigmatic and a source of continuing dispute, especially the former entrant . Still there is no consensus as to pseudogap’s phenomenology, at what doping the ground-state pseudogap ultimately vanishes, whether it really does close at , whether this closure might be a thermodynamic phase transition Bourges ; Xia ; Hashimoto ; He1 ; Shekhter ; Sato and whether it is causatively related to superconductivity entrant . The electronic specific heat captures the entire spectrum of low-energy excitations and in principle can adjudicate in all these matters. The key experimental challenge is to separate the electronic term from the much larger phonon term. In many previous experiments Loram2 ; Loram1 ; Loram4 and in the present report this can be done using a differential technique in which the specific heat is measured relative to a reference sample which, if closely related to the sample itself, automatically backs off most of the phonon contribution. The residual phonon contribution can be identified and removed by measuring a series of doping states in which the residual is found to scale linearly with the mass change of the doping process, usually changing oxygen content. Further details are given under Methods.
Electronic specific heat coefficient
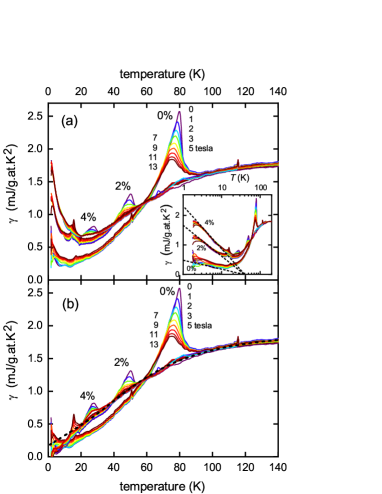
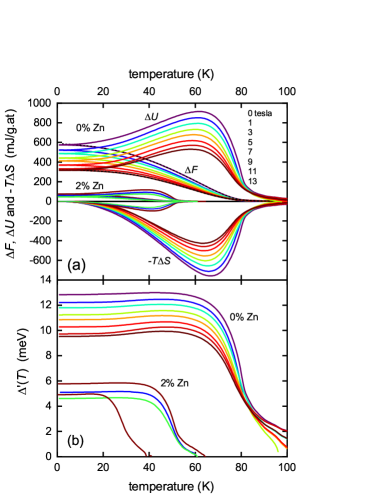
The measured electronic specific heat coefficient, is shown in Fig. 1(a) for YBa2Cu4O8 (Y124) with 0%, 2% and 4% planar Zn concentration at nine different applied fields, as annotated. As discussed later, the data extends to an unprecedented 400 K but we focus first on the transitions into the superconducting state. Because Zn substitutes only on the CuO2 planes and not on the chains Williams1 these compositions correspond to YBa2Cu4-yZnyO8 with 0, 0.04 and 0.08. It is immediately evident that is rapidly suppressed by Zn substitution (as observed previously in other cuprates Tallon_scattering ) and along with this a rapid reduction in the jump height at , . At the same time there is a rapid suppression in with applied field that becomes more extreme in the Zn-substituted samples. Further, at low , fans out to higher values with applied field in the ‘pure’ sample but not appreciably in the doped samples. This is due to the Volovik effect Volovik – the field-induced pairbreaking at the nodes due to Doppler shift of quasiparticle energies, as discussed below.
The most notable feature, however, is the low- upturn due to impurity scattering. The inset to Fig. 1(a) shows plotted versus and this reveals a common underlying energy scale given by the convergence of the dashed lines at 38 K. The dashed lines are subtracted from the raw data to give the versus plot in panel (b) and it is this that we proceed to analyze. (There is a small anomaly at 18 K, present in the Zn-doped samples but very weak in the pure; and another at 120 K, present only in the pure sample. The sample variability indicates unidentified impurities and these anomalies are ignored in the following).
Our first task is to identify the normal-state coefficient, , that would occur in the absence of superconductivity. This is very much constrained by the displayed data for because must follow each of the three data sets above their respective values. This is the black dashed curve. It is further tightly constrained by the requirement for entropy balance. Because the area under a curve is entropy then integrating from to some must give the same result as integrating from to . The fit function which satisfies these two requirements is
| (1) |
where meV (or K) and the exponent . The general form of this equation for arises analytically from inserting into Eq. 3, below, a triangular gap in the density of states (DOS) with a finite DOS at the Fermi level Tstar . The amplitude 0.913 (being less than unity) reflects the finite DOS at . This residual DOS is manifested in the finite value of mJ/g.at.K2 and is a signature of the ungapped Fermi arcs, or hole pockets, of a reconstructed Fermi surface Storey2 ; Kunisada .
K is typical of values reported for Y124 from transport Bucher and NMR relaxation Raffa measurements but we emphasize this reflects an energy scale not a temperature entrant . An important implication of Fig. 1 is that there is no coupling between superconductivity and the pseudogap in the sense that the onset of superconductivity does not weaken the pseudogap. This is evident from the fact that a single curve fits all three samples i.e. is the same for 4% and 0% Zn even in the temperature range below for 0% Zn so that the onset of superconductivity in the latter case does not alter the underlying pseudogap energy scale, . Close scrutiny of the -dependent gap in Bi2212, as measured by angle-resolved photoelectron spectroscopy (ARPES) Vishik , (which allows separation of the antinodal pseudogap from the nodal superconducting gap on the Fermi arcs) confirms that the pseudogap amplitude does not alter on cooling below .
NMR Knight shift and entropy
Next, we note that the spin susceptibility and electronic entropy are closely related. To see this consider the entropy for a weakly-interacting Fermi liquid Padamsee :
| (2) |
where is the Fermi function and is the electronic DOS for one spin direction. This is just a weighted integral of the DOS with the ‘Fermi window’ .
On the other hand, the spin susceptibility for a weakly-interacting Fermion system is:
| (3) |
Therefore, like the entropy, the susceptibility is an integral of the DOS where the Fermi window is now the function . It turns out that is essentially identical to if in the former is stretched in temperature by a factor 1.187 Loram_IRC . It is therefore not surprising that and are related. This relationship is expressed by the Wilson ratio, , such that , where
| (4) |
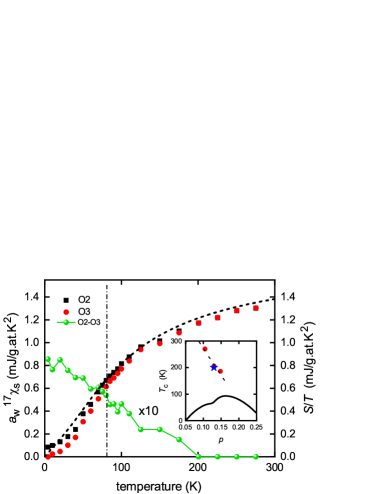
We will now test this relationship in the present case of Y124. By integrating from to we obtain the normal-state entropy and this is plotted as by the black dashed curve in Fig. 2. For fully-oxygenated Y123 is essentially independent of temperature Loram3 , reflecting the fact that the pseudogap has closed at maximal doping ( holes/Cu). But for Y124 there is a large pseudogap present which suppresses at low . This is also seen in the -dependent NMR Knight shift which is linearly related to the spin susceptibility. To illustrate, we show in Fig. 2 the 17O Knight shift, referenced to the chemical shift, as reported by Tomeno et al. Tomeno . These authors also report the bulk susceptibility as a function of the Knight shift, thus enabling calibration of the spin susceptibility from the Knight shift. As a final step we multiply the spin susceptibility by the Wilson ratio, , in order to express the -dependent part of the Knight shift in entropy/ units.
It can be seen in Fig. 2 that, not only the shape, but the absolute magnitude concurs remarkably well with the derived suggesting, as already noted for the bulk susceptibility Loram , that the near-nodal states are consistent with a weakly interacting Fermionic system. Of especial interest is the fact that the O2 and O3 Knight shifts begin to diverge below 200 K. The difference in shift, , expressed in entropy units, is also shown in the figure (10). This shows an abrupt onset in nematicity, consistent with that reported by the Matsuda group Sato using torque magnetometry. Its location at (=0.13, =200) is precisely consistent with the three data points in the (,) plane reported by the Matsuda group for Y123. (For the doping state of 0.13 see Materials). These are plotted in the inset to Fig. 2 by the red data points. Their susceptibility data was presented as evidence for a thermodynamic “phase transition at the onset of the pseudogap” however it is clear from Fig. 2 that the pseudogap is already open far above , having already depleted half of the spin susceptibility. We observe no anomaly in at or near 200 K to suggest a phase transition. It must be very weak. We will see below that the pseudogap in fact extends at least to well above 400 K. Consequently this nematic phase transition occurs within a preexisting pseudogap state that extends far above and is not a transition into the pseudogap state, contrary to what has been claimed Sato .
Volovik effect
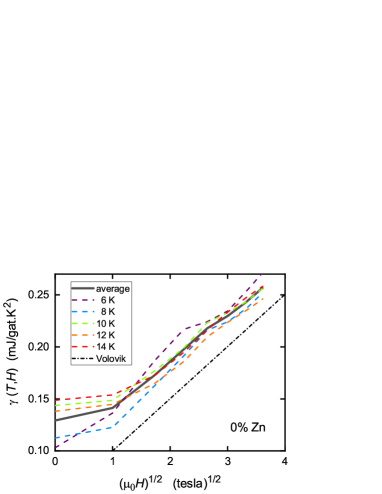
We now consider the field-dependent low- behaviour of for the pure sample. Fig. 3 shows plotted as a function of for = 6, 8, 10, 12 and 14 K. Above 1 tesla the behaviour is linear, consistent with the expected phenomenology of the Volovik effect. Such behaviour has been seen in the specific heats of single-crystal Y123 Junod and La2-xSrxCuO4 Wang , and in interlayer tunneling in Bi2212 Benseman . For -wave symmetry, in the superconducting state the finite ground-state specific heat coefficient is Wang
| (5) |
in units of mJ/g.at.K2, where is the molar volume, the unit cell length, the flux quantum, is the antinodal amplitude of the -wave gap, and the Fermi wave vector at the node along the (,) direction. For 30 meV the dash/dot line in Fig. 3 shows the expected slope. The data is very consistent with this expectation. The averaged slope of 0.0443 mJ/g.at.K2T1/2 implies a gap amplitude of 34 meV. We have used the value m Sebastian .
Free energy and superconducting gap
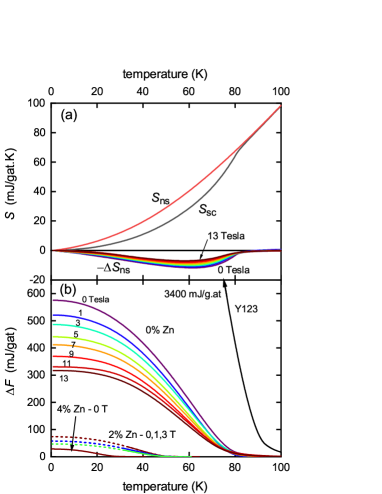
Fig. 4(a) shows the normal-state and superconducting state entropy below 100 K obtained by integrating and , respectively (as displayed in Fig. 1(b)) from 0 to . The curves shown are for pure Y124 in zero field and they are denoted and , respectively. The difference is the condensation entropy . This is plotted underneath for fields of = 0, 1, 3, 5, 7, 9, 11 and 13 T, colour-coded as in panel (b). Clearly the condensation entropy is rapidly suppressed in field. Another feature of note is the presence of fluctuations around which broadens the transition somewhat. This will be discussed later.
By integrating from a temperature , sufficiently above the fluctuation regime that , down to a temperature, , one obtains the condensation free energy . However, a more efficient way of calculating the condensation free energy using just a single integration is given by:
| (6) |
where the first term is the condensation internal energy, , and the second term is the condensation entropy term, . The condensation free energy calculated in this way is plotted in Fig. 4(b) for 0%, 2% and 4% Zn and for the various annotated fields. and its components and are plotted in Fig. 5. Also plotted in Fig. 4(b) is the condensation energy for fully oxygenated Y123 which rises to a ground-state value of 3400 mJ/g.at - a full six-fold greater than for pure Y124. This shows the full impact of the pseudogap for Y124 in weakening superconductivity. Also evident is the dramatic effect of impurity scattering in further reducing the condensation energy (which is particularly marked in underdoped cuprates where the pseudogap is present Tallon_scattering ). for the 4% Zn-doped sample in zero field is just 28 mJ/g.at - 125 times smaller than for pure Y123. The curves for 2% Zn are dashed below 30 K and this is because is a little noisy at low and in some cases does not fall exactly to zero, as it must. We find the first 20 K of the data scales precisely with for the 0% Zn sample, and so we assumed that this scaling continues down to thus enforcing to fall to zero as . Any errors introduced are very small - of the order of the thickness of the curves and of no consequence in the following analysis.
As mentioned, Fig. 5(a) shows and its components and . It is striking that fluctuations persist high above in both and while they are almost completely cancelled in . The superconducting gap function may be calculated from these components of the free energy using Tallon2
| (7) |
where = 1 for -wave and 1/2 for -wave. The calculated values are plotted in Fig. 5(b). The gap is the magnitude of the order parameter, , rather than the spectral gap, , which is higher Loram1 . Roughly speaking, Loram1 . From the impurity suppression of superfluid density Tallon7 we estimate meV while from the high- entropy suppression we determine meV. The quadratic relation above then implies meV, very consistent with the values in Fig. 5(b). The values of are seen to descend towards zero at then persist with a more slow decline above . Here the pairing is incoherent Storey1 ; Kondo and is a feature of the strong superconducting fluctuations above .
Comparison of Y124 with Y123
It is highly instructive to compare the measured data for Y124 with that for Y123. This is shown for in Fig. 6(a) and for in Fig. 6(b). The Y123 data is taken from ref. Loram_IRC which, in contrast to earlier reports Loram1 ; Cooper1 , includes a small correction for the background DOS in the undoped state. We also show the entropy-conserving normal-state functions as well. Two features are prominent. (i) the size of the specific heat jump for Y124 is much smaller than for Y123 due to the presence of the pseudogap in the former. (ii) while the curves converge above the curves remain separated and parallel to the highest temperature. This is clear evidence that the pseudogap remains present in Y124 to the highest temperatures measured - here 400 K.
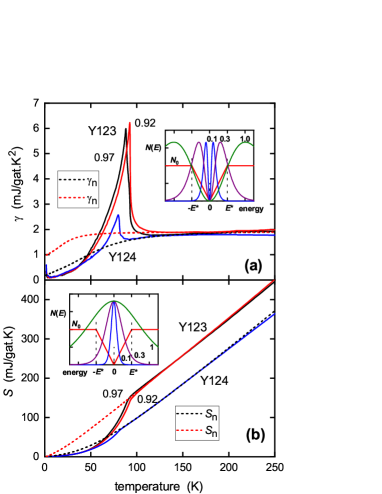
To see this, consider the Fermi window for the entropy given in Eq. 2. This is the single-peaked function shown in the inset to Fig. 6(b). Three different temperatures of 0.1, 0.3 and 1.0 are displayed, where is the magnitude of the triangular gap shown in the figure as a representation of the pseudogap. Provided that the pseudogap remains open, this Fermi window always sees the gap and at higher temperatures loses a fixed fraction of states so that is displaced down in parallel fashion relative to that for Y123 - as evidenced in Fig. 6(b), and again in Fig. 7(b). In contrast, because , the Fermi window for is the -derivative of that for . This is a double-peaked function as shown in the inset to Fig 6(a). It can be seen that at high enough temperature this Fermi window falls outside of the gap. Therefore recovers its full ungapped magnitude at high , despite the presence of the gap. The data in Fig. 6(a) and (b) are entirely consistent with this picture. The two systems have essentially the same background DOS. In the normal-state Y123 is ungapped while Y124 is gapped to the highest temperature as evidenced by the parallel suppression of . If the gap were to close with increasing then for Y124 would recover to that for Y123. It does not. By extrapolating back to the ordinate axis one can read off the normal-state gap magnitude. For a triangular gap, as in the insets to Fig. 6, but with a finite DOS of at and a constant DOS of above this negative intercept is , where is the molar volume. The finite value of at is given by , while at high we have . From these we obtain meV and states/meV/cell.
High-temperature susceptibility and entropy
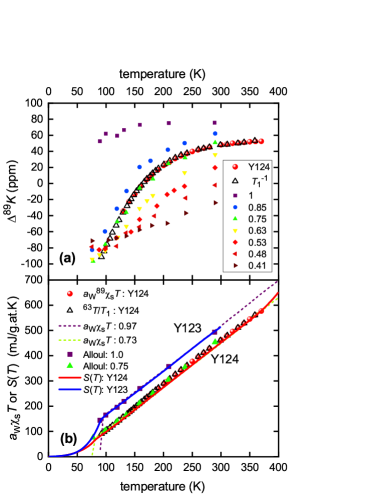
We now extend this comparison to 400 K, a range never previously achieved in differential measurements. We combine this data with 89Y Knight shift data, bulk susceptibility measurements and data in such a way that demonstrates, individually and collectively, the persistence of the pseudogap to 400 K and beyond. 89K probes the spin susceptibility of the CuO2 planes that sandwich the Y atom in Y123 and Y124 Alloul . The 89Y nucleus has the additional benefit of having no quadrupole moment so there is no quadrupole splitting of the resonance arising from electric field gradients. Further, the use of magic-angle spinning (MAS) enables extremely narrow line widths as will be used below Williams . The relaxation rate is a weighted sum over q of the imaginary part of the spin susceptibility, , where, for the 63Cu nucleus, the weighting form factor is strongly enhanced near the antiferromagnetic wave vector, Crossover and hence is dominated by the antinodal pseudogap.
Fig. 7(a) shows the 89Y Knight shift 89K for YBa2Cu3O6+x as reported by Alloul et al. Alloul , with values of annotated. Also plotted is MAS 89K for samples of Y124 from our laboratory Williams2 (red spheres), along with the data from Raffa et al. Raffa (up triangles) which we showed Williams2 scales precisely with 89K, as can be seen. (The conversion scale is 89K.) Notably, there is an excellent match over the entire temperature range with Alloul’s data for (green up-triangles) where the doping state (0.13) and for Y123 are much the same as those of Y124. As in Fig. 2, we convert 89K to spin susceptibility using the calibration of Alloul et al. Alloul (see Methods for more detail) and multiply by to express in units. We find an excellent agreement between Alloul’s 89K and the measured entropy for Y123 across a wide range of doping and temperature (see Fig. S4 in Supplementary Information, SI).
In Fig. 7(b) we assemble four distinct data sets (, 89K, , and from the bulk susceptibility) for Y123 at near full oxygenation (), and for Y124. All are expressed in entropy units, in this case using the factor to convert susceptibilities (including the data expressed as a susceptibility). The data is shown for Y123 with and (purple and green dashed curves, respectively, the latter as a proxy for Y124) and is taken from Loram et al. Loram_IRC . Evidently (blue solid curve), (purple squares) and (purple dashed curve) for Y123 at full oxygenation all track linearly to the origin indicating the absence of the pseudogap. For Y124 on the other hand, (red solid curve - this work), (red spheres) and (open black triangles), together with Alloul’s (solid green triangles) for Y123 with and (dashed green curve) for Y123 with , both as proxies for Y124, all reveal a linear high-temperature behaviour that extrapolates to a negative intercept on the -axis indicating the presence of a gap - the pseudogap. For Y124 the entropy curve almost completely overlays the bulk susceptibility green-dashed curve which is barely visible, so the figure is reproduced in the SI with the green-dashed curve overlaying the entropy. Evidently, the agreement over the full temperature range is excellent. Importantly, our entropy data extends to 400 K as does the data, and the 89K data extends to 370 K. Fig. 7(b) represents the central result of this work. There is no indication, at any temperature, of the entropy recovering to the gap-less curve observed for fully-oxygenated Y123 that would signify the closing of the pseudogap at, or around, some value. The small upturn in near 400 K simply represents the limitations of the present differential technique at such a high temperature and is not seen in the data. We conclude that the pseudogap does not close at some postulated in the range 150 to 200 K but remains open to the highest temperature investigated - 400 K. A similar conclusion has recently been drawn from planar oxygen NMR relaxation data for a number of cuprates Haase . We showed the same long ago Tstar for the in-plane resistivity and similarly for the -axis resistivity entrant ; Bernhard1 .
Scattering resonance
Finally, we wish to discuss the upturn in the raw data at low seen in Fig. 1(a). This is in fact a peak rather than an upturn and may be identified with an impurity resonance Pan . Scanning tunneling spectroscopy (STS) measurements in lightly Zn-doped Bi2Sr2CaCu2O8+δ reveal resonance spots in spatial maps at low energy and low temperature Pan . Away from these spots, tunneling spectra reveal a well-formed -wave superconducting gap with sharp coherence peaks. Tunneling spectra collected on the spots (the location of individual Zn atoms) show a nearly full suppression of both the gap and the coherence peaks with, instead, a sharp resonance appearing at meV. To calculate the entropy contribution arising from this resonance we replace the DOS in Eq. 2 by a delta function, . The equation integrates to give:
| (8) |
where the amplitude .
In view of the relationship between entropy and spin susceptibility discussed above, it is highly instructive to contrast this resonance component of with that of the susceptibility. Again, replacing the DOS in Eq. 3 by we find:
| (9) |
where the amplitude . The interesting point in relation to Eqs. 8 and 9 is that falls off rapidly as while falls off more slowly as . This is borne out by our experimental data. Experimental evidence from the magnetic susceptibility for a Zn-induced resonance within the pseudogap was discussed previously in relation to Y124 Williams1 and La2-xSrxCuO4 Islam .
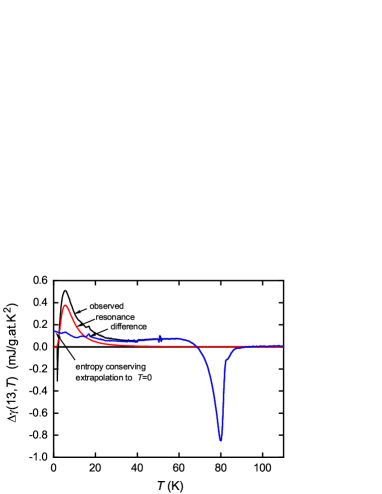
Fig. 8 shows the as-measured field-induced change in specific heat coefficient, . Recall that this difference contains no correction for the residual phonon contribution so is free of any imposed model. As well as the suppression of fluctuations around the specific heat anomaly near the low-temperature resonance is evident. We fit this using Eq. 8 with the parameters mJ/g.at.K2 and meV, the latter value being nicely consistent with the STS result for Bi2Sr2CaCu2O8+δ Pan . This fit is the red curve in Fig. 8 and the difference is shown by the blue curve. The calculated resonance response is an excellent fit and shows the rapid decay at higher temperatures associated with the tail. The difference is close to entropy conserving and requires a straightforward extrapolation below 2.8 K of its trend above 2.8 K to achieve exact entropy conservation. This rapid decay of the resonance in contrasts the predicted much slower decay in the resonance part of the spin susceptibility. We have previously investigated the 89Y NMR Knight shift in Zn-doped Y124 Williams1 . The Zn resonance contribution to the spin susceptibility is seen in a satellite peak which has a slowly-decaying Curie temperature dependence observable all the way up to 300 K, thus nicely confirming the behaviour predicted by Eq. 9.
Conclusions
In conclusion, we have measured the electronic specific heat of YBa2Cu4-xZnxO8 using a precision differential technique that allows separation of the electronic term from the lattice term up to an unprecedented 400 K. The pure sample reveals the expected Volovik effect which is fully suppressed in the Zn-doped samples. We show that the pseudogap, characteristic of underdoped cuprates, always remains open to above 400 K, far above the nominal pseudogap onset temperature usually proposed, 150 - 200 K. Weak thermodynamic transitions reported at , for example the onset of susceptibility nematicity, occur within the already fully established pseudogap and are not transitions into the pseudogap state as widely claimed. The spin susceptibility, derived from the 17O and 89Y Knight shift and expressed in entropy units, is numerically the same as the electronic entropy divided by temperature, indicating that the near-nodal states are those of weakly-interacting Fermions. We derive the field-dependent condensation energy and superconducting energy gap. These expose the presence of strong pairing fluctuations extending well above as well as canonical impurity scattering behaviour, including the expected low-temperature resonance response which in the entropy channel decays rapidly as , but in the spin channel decays slowly as . The measurements and analysis reveal the remarkable utility of the differential specific heat technique in exposing the rich physics of strongly-correlated electronic materials.
.1 Methods
Materials. The samples were prepared from stoichiometric proportions of high purity Y2O3, dried Ba(NO3)2, ZnO and CuO, pressed as pellets and reacted for 16 hours at 935∘C under an oxygen pressure of 60 bar. The samples were ground finely and the process repeated three more times. X-ray diffraction revealed single-phase YBa2Cu4O8 (see Fig. S1) with impurity less than 2% (only CuO identified). Lattice parameters were found to be nm, nm, and nm under Ammm symmetry with a preferred alignment of the -axis normal to the plane of the pellets. The values, determined from sharp diamagnetic onset were 81.2 K (0% Zn), 51.8 K (2% Zn) and 29.2 K (4% Zn). The quoted Zn concentrations are those referred to the CuO2 plane as essentially no Zn resides on the chains. Thus 2% Zn refers to the composition YBa2Cu3.96Zn0.04O8 and 4% refers to YBa2Cu3.92Zn0.08O8. Thermoelectric power measurements at 290 K give 6.95 V/K (0% Zn), 6.89 V/K (2% Zn) and 6.93 V/K (4% Zn). From the correlation of thermoelectric power with doping Obertelli this amounts to essentially identical doping states of 0.130 holes/Cu for each.
The suppression of with Zn substitution is very much in line with that for underdoped Y123 at the same doping state. Fig. S2 shows as a function of doping for 0, 2, 4 and 6% planar Zn substitution for Y0.8Ca0.2Ba2Cu3O7-δ while the red stars show the data for Zn-substituted Y124. They are very consistent. The rapid suppression of for underdoped samples (open symbols) compared with overdoped (filled symbols) is a signature of the pseudogap which lowers the DOS at the Fermi level and hence raises the scattering rate Tallon_scattering . Fig. S3 shows as a function of planar Zn concentration for Y0.8Ca0.2Ba2Cu3O7-δ at various doping states while red stars show the same data for Y124. Again they are very consistent. Typically, for higher Zn concentrations, the value sits higher than that expected from Abrikosov-Gorkov pairbreaking due to the statistical overlap of nearest neighbours to the Zn substituent Tallon_scattering .
Spin susceptibility and Knight shift. The spin susceptibility, , is related to the bulk magnetic susceptibility, , by where the constant comprises diamagnetic and van Vleck terms and is evaluated for Y123 by Alloul et al. Alloul . The measured Knight shift, 89K, is given by 89K = , where is the -independent chemical shift and is the relevant hyperfine coupling constant and, as indicated, both change only with oxygen content, . For each therefore, , and 89K are linearly related to within an additive constant. We used values of reported by Alloul Alloul , while for each the additive constant was determined by matching the data to our bulk susceptibility data, Loram_IRC . This fixed the value of the constant which differed somewhat from those of Alloul but other literature values also reflect those differences Williams2 . The overall -dependence (independent of ) was an excellent match.
Acknowledgements
We are grateful to Dr. J. R. Cooper for helpful comments on the Knight shift and spin susceptibility. We also thank Dr Martin Ryan for assistance with the x-ray diffraction analysis.
Author contributions
JLT synthesized and characterized the samples, JWL carried out the specific heat measurements and the initial analysis to extract the electronic specific heat. JLT analyzed the data and wrote the paper.
‡ deceased November 2017.
References
- (1) Norman, M. R., Pines, D. & Kallin, C. The pseudogap: friend or foe of high-. Adv. Phys. 54, 715–733 (2005).
- (2) Timusk, T. & Statt, B. The pseudogap in high-temperature superconductors: an experimental survey. Rep. Progr. Phys. 62, 61-122 (1999).
- (3) Tallon, J. L. & Loram, J. W. The doping dependence of – what is the real high- phase diagram? Physica C 349, 53 (2001).
- (4) Tallon, J. L., Storey, J. G., Cooper, J. R. & Loram, J. W. Locating the pseudogap closing point in cuprate superconductors: absence of entrant or reentrant behavior. Phys. Rev. B 101, 174512 (2020).
- (5) Fauqué, B., Sidis, Y., Hinkov, V., Pailhès, S. Lin, C. T., Chaud, X. & Bourges, P. Magnetic order in the pseudogap phase of high- superconductors. Phys. Rev. Lett. 96, 197001 (2006).
- (6) Xia, J. et al. Polar Kerr-effect measurements of the high-temperature YBa2Cu3O6+x superconductor: evidence for broken symmetry near the pseudogap temperature. Phys. Rev. Lett. 100, 127002 (2008).
- (7) Hashimoto, M. et al., Particle–hole symmetry breaking in the pseudogap state of Bi2201. Nature Phys. 6, 414-418 (2010).
- (8) He, R.-H. et al. From a single-band metal to a high-temperature superconductor via two thermal phase transitions. Science 331, 15791583 (2011).
- (9) Shekhter, A. et al. Bounding the pseudogap with a line of phase transitions in YBa2Cu3O6+δ. Nature 498, 75-77 (2013).
- (10) Sato, Y. et al. Thermodynamic evidence for a nematic phase transition at the onset of the pseudogap in YBa2Cu3Oy. Nature Phys. 13, 1074-1078 (2017).
- (11) Loram, J. W., Mirza, K. A., Cooper, J. R. & Liang, W. Y. Electronic specific heat of YBa2Cu3O6+x from 1.8 to 300 K. Phys. Rev. Lett. 71, 1740-1743 (1993).
- (12) Loram, J. W., Mirza, K. A., Cooper, J. R., Liang, W. Y. & Wade, J. M. Electronic specific heat of YBa2Cu3O6+x from 1.8 to 300 K. J. Supercon. 7, 243-249 (1994).
- (13) Loram, J. W., Luo, J. L., Cooper, J. R., Liang, W. Y. & Tallon, J. L. The condensation energy and pseudogap energy scale of Bi:2212 from the electronic specific heat. Physica C 341-348, 831 (2000).
- (14) Williams, G. V. M., Talion, J. L., Meinhold, R. & Jánossy, A. 89Y NMR study of the effect of Zn substitution on the spin dynamics of YBa2Cu408. Phys. Rev. B 51 16503-16506 (1995).
- (15) Tallon, J. L., Bernhard, C., Williams, G. V. M. & Loram, J. W. Zn-induced Reduction in High- Superconductors: Scattering in the Presence of a Pseudogap. Phys. Rev. Lett. 79, 5294-5297 (1997).
- (16) Volovik, G. E. JETP Lett. 58, 469-473 (1993).
- (17) Chen, S.-D., Hashimoto, M., He, Y., Song, D., Xu, K.-J., He, J.-F., Devereaux, T. P., Eisaki, H., Lu, D.-H., Zaanen, J. & Shen, Z.-X. Incoherent strange metal sharply bounded by a critical doping in Bi2212, Science 366, 1099-1102 (2019).
- (18) Storey, J.G. Hall effect and Fermi surface reconstruction via electron pockets in the high- cuprates, Europhys. Lett. 113, 27003 (2016).
- (19) Kunisada, S. et al. Observation of small Fermi pockets protected by clean CuO2 sheets of a high- superconductor. Science 369, 833-838 (2020).
- (20) Bucher, B., Steiner, P., Karpinski, J., Kaldis, E. & Wachter, P. Influence of the Spin Gap on the Normal State Transport in YBa2Cu408. Phys. Rev. Lett. 70, 2012-2015 (1993).
- (21) Raffa, F., Ohno, T., Mali, M., Roos, J., Brinkmann, D., Conder, K. & Eremin, M. Isotope Dependence of the Spin Gap in YBa2Cu408 as Determined by Cu NQR Relaxation. Phys. Rev. Lett. 81, 5912-5915 (1998).
- (22) Vishik, I. M. et al. Phase competition in trisected superconducting dome. Proc. Nat. Acad, Sci. 109, 18332-18337 (2012).
- (23) Padamsee, H., Neighbor, J. E. & Shiffman, C. A. Quasiparticle Phenomenology for Thermodynamics of Strong-Coupling Superconductors. J. Low Temp. Phys. 12, 387-411 (1973).
- (24) Loram, J. W., Mirza, K. A. & Cooper, J. R. Properties of the superconducting condensate and normal-state pseudogap in high- superconductors derived from the electronic specific heat. IRC in Superconductivity Research Review Cambridge University (1998).
- (25) Loram, J. W., Mirza, K. A., Wade, J. M., Cooper, J. R. & Liang, W. Y. The Electronic Specific Heat of Cuprate Superconductors. Physica C 235-240, 134-137 (1994).
- (26) Tomeno, I., Machi, T., Tai, K., Koshizuka, N., Karnbe, S., Hayashi, A., Ueda, Y. & Yasuoka, H. NMR study of spin dynamics at planar oxygen and copper sites in YBa2Cu408. Phys. Rev. B 49, 15327-15334 (1994).
- (27) Loram, J. W., Luo, J. L., Cooper, J. R., Liang, W. Y. & Tallon, J. L. Evidence on the pseudogap and condensate from the electronic specific heat. J. Phys. Chem. Solids 62, 59-64 (2001).
- (28) Wang, Y., Revaz, B., Erb, A. & Junod, A. Direct observation and anisotropy of the contribution of gap nodes in the low-temperature specific heat of YBa2Cu3O7. Phys. Rev. B 63, 094508 (2001).
- (29) Wang, Y., Yan, J., Shan, L., Wen, H.-H., Tanabe, Y., Adachi, T. & Koike, Y. Weak-coupling -wave BCS superconductivity and unpaired electrons in overdoped La2-xSrxCuO4 single crystals. Phys. Rev. B 76, 064512 (2007)
- (30) Benseman, T. M., Cooper, J. R. & Balakrishnan, G. Temperature and field dependence of the intrinsic tunnelling structure in overdoped Bi2Sr2CaCu2O8+δ, Phys. Rev. B 98, 014507 (2018).
- (31) Sebastian, S. E., Harrison, N., Liang, R., Bonn, D. A., Hardy, W. N., Mielke, C. H. & Lonzarich, G. G. Quantum Oscillations from Nodal Bilayer Magnetic Breakdown in the Underdoped High Temperature Superconductor YBa2Cu3O6+x. Phys. Rev. Lett. 108, 196403 (2012).
- (32) Tallon, J. L., Barber, F., Storey, J. G. & Loram, J. W. Coexistence of the superconducting energy gap and pseudogap above and below the transition temperature of cuprate superconductors. Phys. Rev. B 87, 140508(R) (2013).
- (33) Storey, J. G. Incoherent superconductivity well above in high- cuprates – harmonizing the spectroscopic and thermodynamic data. New J. Phys. 19, 073026 (2017).
- (34) Kondo, T., Malaeb, W., Ishida, Y., Sasagawa, T., Sakamoto, H., Takeuchi, T., Tohyama, T. & Shin, S. Point nodes persisting far beyond in Bi2212. Nature Commun. 6, 7699 (2015).
- (35) Cooper, J. R. & Loram, J. W. Some Correlations Between the Thermodynamic and Transport Properties of High Oxides in the Normal State. J. Phys. I France 6, 2237-2263 (1996).
- (36) Alloul, H., Ohno, T. & Mendels, P. 89Y NMR evidence for a fermi-liquid behavior in YBa2Cu3O6+x. Phys. Rev. Lett. 63, 1700-1703 (1989).
- (37) Williams, G. V. M., Tallon, J. L., Quilty, J. W., Trodahl, H. J. & Flower, N. E. Absence of an Isotope Effect in the Pseudogap in YBa2Cu4O8 as Determined by High-Resolution 89Y NMR. Phys. Rev. Lett. 80, 377-380 (1998).
- (38) Williams, G. V. M., Tallon, J. L. & Loram, J. W. Crossover temperatures in the normal-state phase diagram of high- superconductors. Phys. Rev. B 58, 15053-15061 (1998).
- (39) Williams, G. V. M., Pringle, D. J. & Tallon, J. L. Contrasting oxygen and copper isotope effects in YBa2Cu4O8 superconducting and normal states. Phys. Rev. B 61, 9257-9260(R) (2000).
- (40) Tallon, J. L., Bernhard, C., Binninger, U., Hofer, A., Williams, G. V. M., Ansaldo, E. J., Budnick, J. I. & Niedermayer, Ch. In-plane anisotropy of the penetration depth due to superconductivity on the CuO chains in YBa2Cu3O7-δ, Y2Ba4Cu7O15-δ and YBa2Cu4O8. Phys. Rev. Lett. 74, 1008-1011 (1995).
- (41) Nachtigal, J., Avramovska, M., Erb, A., Pavicevic, D., Guehne, R. & Haase, J. Temperature independent cuprate pseudogap from planar oxygen NMR. Condens. Matter 5, 66 (2020).
- (42) Yu, Li, Munzar, D., Boris, A. V., Yordanov, P., Chaloupka, J., Wolf, Th., Lin, C. T., Keimer, B. & Bernhard, C. Evidence for two separate energy gaps in underdoped high-temperature cuprate superconductors from broadband infrared ellipsometry. Phys. Rev. Lett. 100, 177004 (2008).
- (43) Pan, S. H., Hudson, E. W., Lang, K. M., Eisaki, H., Uchida, S. & Davis, J. C. Imaging the effects of individual zinc impurity atoms on superconductivity in Bi2Sr2CaCu2O8+δ. Nature 403, 746-750 (2003).
- (44) Islam, R. S., Cooper, J. R., Loram, J. W. & Naqib, S. H. Pseudogap and doping-dependent magnetic properties of La2-xSrxCu1-yZnyO4. Phys. Rev. B 81 054511-8 (2010).
- (45) Obertelli, S. D., Cooper, J. R. & Tallon, J. L. Systematics in the Thermoelectric power of High- Oxides. Phys. Rev. B 46, 14928-14931 (1992).