Extending the Range of Drone-based Delivery Services by Exploration
Abstract
Drones have a fairly short range due to their limited battery life. We propose an adaptive exploration techniques to extend the range of drones by taking advantage of physical structures such as tall buildings and trees in urban environments. Our goal is to extend the coverage of a drone delivery service by generating paths for a drone to reach its destination while learning about the energy consumption on each edge on its path in order to optimize its range for future missions. We evaluated the performance of our exploration strategy in finding the set of all reachable destinations in a city, and found that exploring locations near the boundary of the reachable sets according to the current energy model can speed up the learning process.
I Introduction
A delivery drone is an unmanned aerial vehicle for transporting packages. Some companies such as Amazon have started to use delivery drones to deliver packages to their customers. However, drones owned by these companies have a very limited range due to their short battery life, causing them to be unable to deliver packages beyond a couple of miles. The question of how to extend the range of drones is a major obstacle in the deployment of drone-based delivery in the real world. Although some new drone technology have been proposed to extend the range of drones (e.g., Google X’s Project Wing and gas-powered drones), these drones still have a finite range since they rely on fuel tanks or batteries with limited capacity. Some companies have been looking for ways to recharge or swap batteries (e.g., the automatic landing stations developed by Matternet). The drawback of landing the drones for recharging or battery swapping is the increase of the delivery time. Hence, how to extend the range of drones on a single charge remains an important issue.
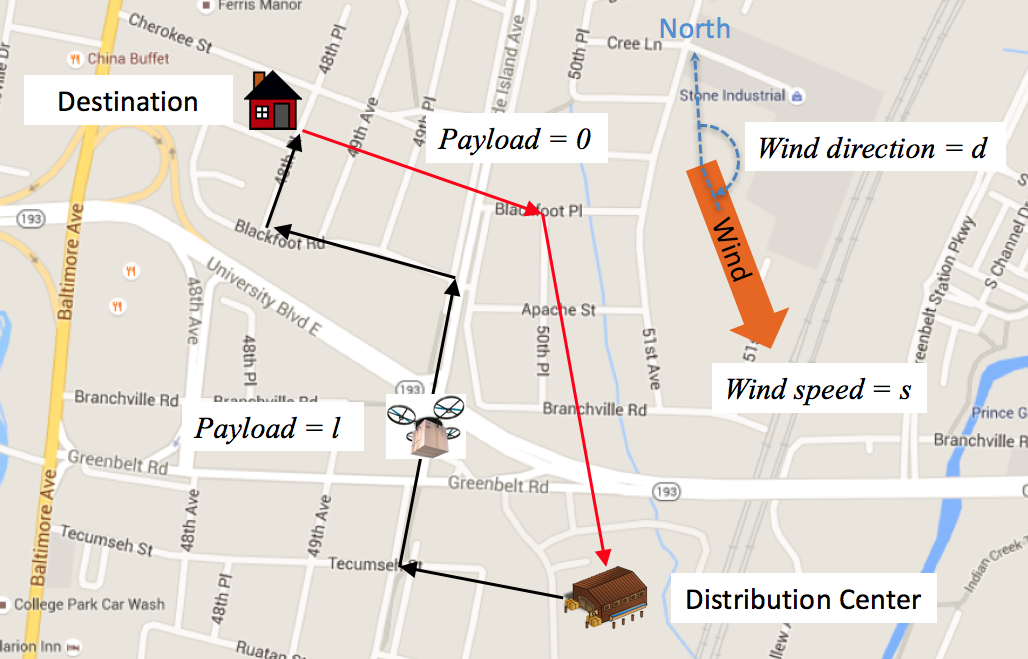
One way to extend the range of drones is to take advantage of physical structures such as tall buildings and trees in urban environments while taking the wind direction and wind speed into account. A drone is a lightweight machine whose power usage is greatly affected by the airflow, which is influenced by physical structures in the environment. A drone flying in an urban area can take advantage of these structures by flying between buildings in order to fly downwind as much as possible while avoid flying into the headwind. As an example, suppose we need to send a drone to deliver a package to a destination as shown in Figure 1. Instead of flying directly to the destination, the drone can save energy by flying between the buildings (the black arrows) in order to avoid flying against the headwind. On its way to fly back to the distribution center, the drone can fly high in order to take advantage of the downwind (the red arrows). The energy saving can be translated into an extended range since the drone can now serve a larger area.
Our goal is to extend the coverage of delivery service—the set of destinations that are reachable from a distribution center given a finite amount of energy. A coverage is maximum if it includes all reachable destinations. If we can accurately predict the energy consumption of the drone, we can easily compute the maximum coverage by using all-pairs shortest path algorithms. However, it is difficult to estimate the energy consumption under the influence of wind and structures in the environment since the interaction between a drone and an environment can be quite complicated. Deliberately sending drones to collect data to construct an accurate energy consumption model for a large area under all kinds of wind conditions will take too much time that cause downtime to delivery service. Moreover, if the environment changes (e.g., a tree falls down or a new building is constructed), the model may no longer be accurate. We therefore propose to learn a model of energy consumption online by exploring the environment while sending drones to deliver packages. In this paper, we propose a new exploration strategy that strategically explores the locations that are currently out of reach. According to our experiments, our strategy outperforms the one in Nguyen and Au [1] in the task of finding the maximum reachable set in a graph.
II Related Work
Route planning problems for UAVs can be formulated as Dubins Traveling Salesman Problems (DTSPs) [2] and [3], in which routes are optimized while satisfying the Dubins vehicle’s curvature constraints. As the optimization for Dubins curves is achieved with respect to distances, the optimized route plan for a DTSP is only optimal in terms of distance. However, a trajectory with minimum fuel consumption for other type of UAVs may differ from the minimum distance trajectory and a minimum distance route plan may not be fuel optimal [4]. Therefore, more research on minimizing energy consumption for battery-powered UAVs is needed.
Previous research often considered the problem of optimizing static soaring trajectories to minimize energy loss in order to extend the UAV’s operating coverage [5, 6]. More recent research addressed the dynamic soaring problem by introducing computational optimization techniques [7, 8]. The increasing popularity of UAVs attracted more research on the soaring problem. For example, [9] and [10] introduced an energy mapping that indicates the lower bound of necessary energy to reach the goal from any starting point to any ending point in the map with known wind information. Exploiting this map can provide a path from a starting point to a goal with the optimal speed and the heading to fly over each cell in the path. An alternative is to use soaring mechanisms to utilize observations to determine optimal flight [11, 12]. A further alternative is to define a wind model and utilize on-the-fly observations to fit this model. However, there has been little research focusing on building a mapping from wind condition and payload to energy consumption and simultaneously using that information to generate paths from a base point to target points. [13] presented a Gaussian process regression approach to estimate the wind map but they devised a reward function to automatically balance the tradeoff between exploring the wind field and exploiting the current map to gain energy. Moreover, their problem differs from ours because their problem aims to drive the gliders to predefined locations. In contrast, our work aims to find all locations at which a delivery drone can arrive (i.e., the maximum coverage) and return to the distribution center with different payload and wind conditions. To our knowledge, no existing work specifically focuses on using learning to find a reachable set in a graph under energy constraints; instead, most work aims to find the shortest path to a node, which is different from finding all reachable nodes. For example, [14] focuses on building a policy for an aircraft to get to a single destination while taking advantage of initially unknown but spatially correlated environmental conditions. [15] and [16] presented an energy-constrained planning algorithm for information gathering with an aerial glider. However, the mapping problem is somewhat different from ours with different objectives and a lot more physical constraints. [17] also presented a frontier-based exploration approach which, unlike ours, does not aim to explore the entire map to find the reachable set.
There exists a rich literature on finding traversal cost between locations in a map for ground vehicles. For example, [18] provided a scenario in which a taxi driver learns about a city map in trips that eventually return to the base. Yet, this work’s objective is to learn the traversal cost of the whole map with a minimum number of edges traversal. [19] proposed to find a minimum-cost route from a start cell to a destination cell, based on an assumption that a digitized map of terrain with connectivity is known. The route’s cost is defined as the weighted sum of three cost metrics: distance, hazard, and maneuvering. However, they do not address the problem of balancing the tradeoff between exploration and exploitation. [20] and [21] utilized visual information and a robot’s on-board perception system to interpret the environmental features and learn the mapping from these features to traversal costs in order to predict traversal costs in other locations where only visual information is available. Our work, however, does not utilize any visual information.
Some previous works are concerned with balancing exploration and exploitation in learning and planning. [22] dealt with the problem of learning the roughness of a terrain that the robot travels on. [23] studied an optimal sensing scenario in which the robot’s objective is to gather sensing information about an environment as much as possible. They devised Bayesian optimization approaches to dynamically trade off exploration (minimizing uncertainty in unknown environments) and exploitation (utilizing the current best solution). [24] optimized trajectories using reinforcement learning in order address the problem of how a robot should plan to explore an unknown environment and collect data in order to maximize the accuracy of the resulting map. However, the problems in these papers are different from ours as our objective of learning traversal cost map is to generate optimal energy paths for drones to extend their range.
III Energy-Bounded Delivery Drone Problems
We consider a scenario in which a company sets up a base (i.e., a distribution center) to serve a community of households as shown in Figure 1. The base has one drone for package delivery to the households. The drone, which has a maximum energy , must fly on some designated trajectories connecting the base to the households. The trajectories can be segmented into edges such that the trajectories form a connected, directed graph , where is a set of nodes and is a set of directed edges among the nodes in . Let be the location of the base and be the set of all nodes corresponding to the locations of the households.
From time to time, the base receives requests from the households to deliver packages to their houses. For our purpose, a request is a pair , where is called the destination which is the location of the household and is the payload which is the weight of the package. Upon receiving a request , the base will first decide whether it is feasible to deliver a package using a drone, and then send out a drone if it is feasible. The feasibility depends on whether there exists a cycle in , where is a path connecting to and is a path connecting to , such that the drone has enough energy to fly to on with a payload and then fly back to on with a zero payload after dropping the package at . We call the cycle a trip.
When a drone traverses an edge in , it consumes a certain amount of energy. There are three factors that affect the energy consumption: 1) the payload , 2) the wind speed , and 3) the wind direction , which is an angle relative to the north direction. We say is a configuration. We assume that the energy needed to traverse an edge under a particular configuration does not change over time. Hence, we use to denote the energy consumption for traversing an edge under . While our model considers the energy consumption for traversing an edge, we can actually model the effect of individual trees or buildings on an edge by replacing the edge with multiple edges, each of them corresponding to a structure on the edge. Notice that for any two adjacent nodes and , the energy consumption for flying from to can be very different from flying from and , especially if the drone flies downwind in one direction but flies against a headwind in the other direction.
To simplify our analysis, we assume that the wind speed and the wind direction do not change during delivery since the flight duration is usually not too long. However, the wind speed and direction can be different for different requests made at different time. Before a drone departs from the base, we assume we can obtain the current wind speed and the current wind direction from an external information source. Given a path , let be the total energy a drone consumes when traversing under . Let be a trip to a destination such that is a path connecting to and is a path connecting to . The total energy consumption on under is . Then we say a trip to is successful under if .
A destination is reachable under if there exists a successful trip for . We also say is -reachable. It is easy to check whether is -reachable if and are known for every edge . First, find the shortest path from to given . Second, find the shortest path from to given . Then is -reachable if and only if
| (1) |
At the beginning, we do not know which destinations satisfy Equation 1 since we do not necessarily know and before exploration, even though we know the structure of the graph. However, we assume drones are equipped with devices that can measure their energy consumption along an edge. As we make more and more deliveries, we collect more and more measurements and hence we will gradually identify more and more destinations that are -reachable. This knowledge effectively extends the range of a drone as we can now confidently serve destinations that are further away from the base. Ultimately, our goal is to find the set for all possible configurations such that all are -reachable. We call the reachable set under , which represents the maximum coverage of the base under .
IV Energy Models and Current Reachable Sets
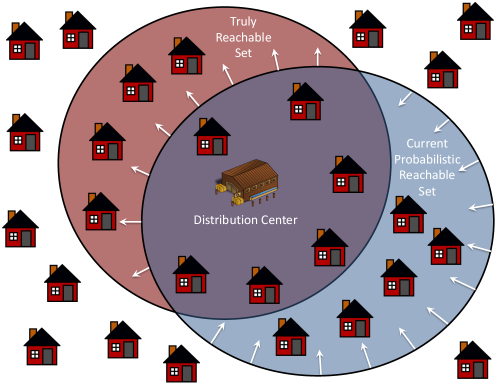
Given a configuration , we partition the set of edges into two sets: and , where is the set of all edges whose energy consumption under have been measured by the drone, and is the set of all edges whose energy consumption are currently unknowns. For each , let be a random variable for . Let be the set of all random variables for all edges in for a configuration . To simplify our discussion, we assume these random variables are independent, though it is possible to modify our problem formulation to consider covariances among the random variables. Suppose the drone maintains an energy model that is used to predict the values of the random variables in . Let be an energy model at the current time . yields an assignment to the random variables in , which can then be used to compute the current reachable set according to Equation 1. Clearly, if some predicted values for some are different from which is the true energy consumption, the current reachable set can be different from the truly reachable set based on the true energy consumption, as shown in Figure 2.
At the beginning, we are given a prior energy model , which provides a rough estimation of the energy consumption. Upon gathering more measurements, the energy model evolves over time. Figure 2 illustrates the desirable direction of the evolution: we want the current reachable set eventually become the truly reachable set by removing false positives from and adding false negatives to .
Suppose the base sends a drone to deliver a package to at time , and the drone follows a trip , which is generated from using an exploration strategy, where is a path connecting to and is a path connecting to . As the drone traverses , it measures the energy consumption of the set of unknowns and on and , respectively. The measurement will then be used to update the energy model to create . Suppose the drone measures for . First, we remove from since is no longer an unknown. Second, we update the energy consumption of other unknowns using . One simple way is to use a multivariate linear regression model trained with the known energy consumption and the characteristics of the edges to project the energy consumption of the unknowns. For any edge , we estimate by this equation:
| (2) |
where is the length of , is the angle between and the north direction, and is a multivariate linear regression model trained with the edges with known energy consumption, including , to predict the energy consumption of an edge given the parameters ,,, , and . This estimation is discounted by a weight , where is the distance between the middle point of and the middle point of , and and are constants.
V Exploration Strategies
Nguyen and Au presented an exploration strategy called ShortestPath, which biases the search along with the shortest paths between the base and the destination using the updated energy model in the previous trip [1]. Initially, the strategy is given a prior energy model , which was initialized with a rough estimate of the energy consumption of all edges under . In our experiments, the prior energy model simply sets the energy consumption on an edge to a value proportional to the length of the value with a small random noise. For each possible configuration , there is a . Upon receiving a request to visit a destination under , ShortestPath checks whether a trip exists to reach . In addition to and , the input parameters of ShortestPath include the maximum energy , the starting node , and a probability threshold . ShortestPath will then use a shortest path algorithm such as Dijkstra’s algorithm to compute the shortest paths to and from the destination according to and . The shortest paths are combined to form a trip . If the probability of success given a maximum energy is greater than or equal to , ShortestPath will accept the request and return ; otherwise, it rejects the request. If ShortestPath returns , the energy models will be updated according to the measurements during the traversal of .
In this paper, we present another strategy called Frontier, which improves ShortestPath by modifying the trip if , where is the acceptance rate which is zero unless stated otherwise. The pseudo-code of Frontier is shown in Algorithm 1. The idea is that may be only slightly smaller than , which means that may actually be quite near the boundary (i.e., the frontier) of the current reachable set as depicted as the boundary of the blue circle in Figure 2. If it is the case, has a high chance to be in the truly reachable set even though the current reachable set, according to the current energy model, does not include . Therefore, we propose a step called frontier expansion, in which Frontier returns , where and are two randomly-chosen neighbors of in , is the shortest path from to according to , and is the shortest path from to according to . Hence, Frontier takes the risk to explore the neighbors of so as to check whether is reachable. The effect is to expand the frontier of the current reachable set in the direction of the arrows in Figure 2. There is a non-zero probability of to perform frontier expansion regardless of the shortest paths to (Line 5). Note that the condition that at Line 13 is to make sure that and are not too far away from the current reachable set.
V-A Convergence Analysis
The fact that Frontier ignores the energy consumptions of edges and at Line 13 in Algorithm 1 guarantees that Frontier will eventually visit all reachable nodes as long as every node will request delivery indefinitely.
Theorem 1
Given a configuration and , the probabilistic reachable set will eventually converge to the true reachable set (i.e., there exist a time such that ), if every node has a non-zero probability to make a request at every time step.
Theorem 1 provides a guarantee that the true reachable set can be always found despite of the randomness of the environment and the exploration process. Hence, there will be no missing reachable destination under this exploration strategy. The exploration strategy ShortestPath, introduced in [1], cannot provide such guarantee. This property is important in practice because we want to maximize the coverage of the service. To the best of our knowledge, there is no other exploration strategy in the literature that can guarantee convergence.
Notice that this theorem can provide such guarantee for a given configuration only. Since , , and are continuous values, the drone has to keep track of the energy model of different in order to guarantee convergence for any configuration.
VI Empirical Evaluation
We conducted simulation experiments to compare ShortestPath with Frontier to see whether extending frontiers can improve the performance. We implemented a Java simulator which simulates a drone flying in a city. The simulation uses a physical model of energy consumption to compute the energy consumption when a drone flies along an edge under the influence of wind and buildings. Since we cannot find such model in the literature, we developed an simplified energy model based on the following equations:
| (3) |
where , , is the velocity of the drone, is the maximum velocity of the drone, is the angle between the thrust direction and the edge, is the length of the edge, is the weight of the drone without payload, and , and are constants. This equation provides a rough estimation of the energy consumption under of the effect of wind in the simulation. Notice that the drone does not have any knowledge about this equation in our experiments.
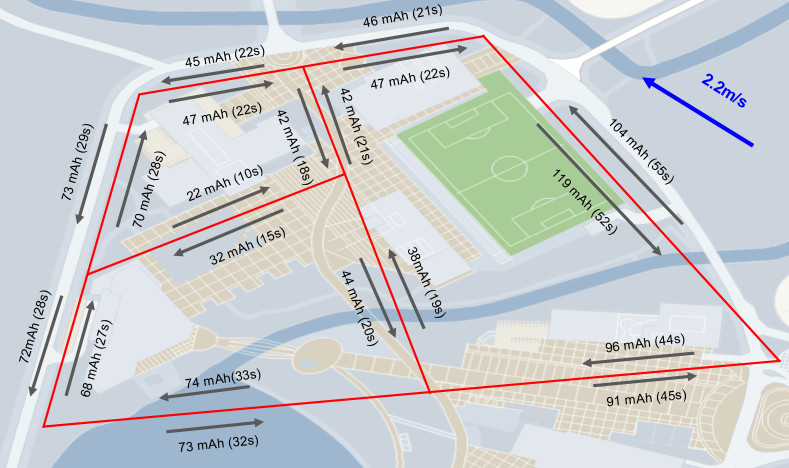
This model is calibrated based on real data. Figure 3 shows the energy consumption data we collected in a flight. While the wind speed and the wind direction of the location changes throughout a day, they are quite steady in a short flight duration. Nonetheless, we recorded the average wind speed and the average wind direction. After we collected the energy consumption data of a number of such flights in the real world, we tuned the constants in Equation 3 such that the error between the energy consumption predicted by the equation and the real data is minimized. Note that in our experiments as well as the flight in the real world, we assume drones always fly as fast as possible on an edge. This gives a unique value of energy consumption on all edges.
Three types of maps were considered: random graphs, grids, and road networks in the real world. Ten random graphs were generated by randomly choosing 200 locations as nodes in a 2-D area of size 1000 meters 1000 meters, and then connecting each node to five nearest nodes. Each of the ten grids we generated is a square mesh in which all edges have a length of 100 meters. A road network is a graph that is constructed from the map data on OpenStreetMap (https://www.openstreetmap.org). The cities we considered are Berlin, Los Angeles, London, New York City, Seoul, Astana, Sydney, and Dubai. The size of the chosen region of the road networks for the first five cities is 2km 2km, whereas the size for the remaining three cities is 5km 5km. A total of 28 maps were used in our experiments. In all maps, the node closest to the center of the area is chosen to be the distribution center, and buildings are randomly put along the edges. Furthermore, we chose the maximum energy such that approximately 60% of the nodes are reachable; hence the size of the map does not matter since drones have more energy in larger maps.
In addition to ShortestPath with Frontier, we implemented the optimal strategy—a strategy that generates trips based on full knowledge of the true energy consumption of all edges—and a random strategy—a strategy that randomly generates a trip to the destination–as baselines. Given a map and an exploration strategy, the simulator proceeded by generating a sequence of delivery requests with random configurations (i.e., the wind speeds, directions, and payloads can be different in different requests) at random nodes, including both reachable and unreachable. The payloads, wind speeds and wind directions in these configurations were drawn randomly from a uniform distribution. Internally, the drone discretized configurations into 100 different configurations (5 values for wind speed, 5 values for wind direction, and 4 values for payload), and it learns 100 energy models of these configurations in parallel. The contribution of a measurement of the energy consumption of an edge to every edge in every model is determined by Equation 2 as described in Section IV. Frontier will only use one of the energy models whose configuration is the closest to a given configuration.
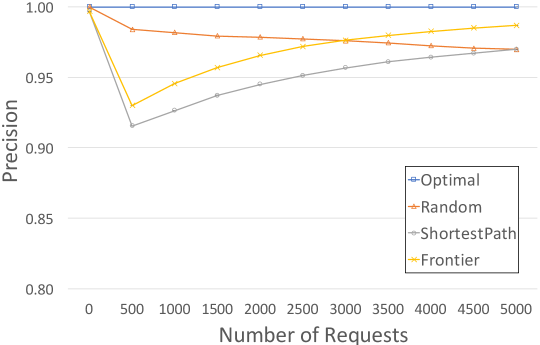
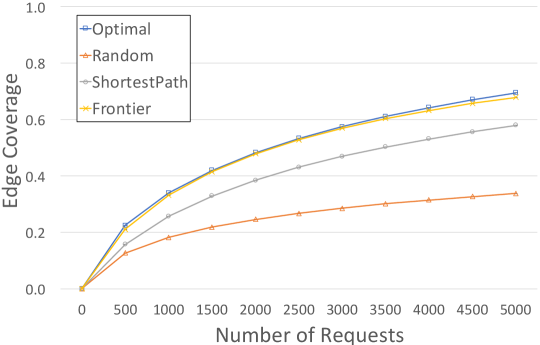
At the beginning, the prior energy models in ShortestPath and Frontier are initialized by setting the energy consumption of an edge to be a random number in , where is the length of the edge and is a constant. Upon receiving a request, a strategy can decide whether to accept the request. After each flight, the simulator records whether the delivery is successful and asks the strategy for the current probabilistic reachable set , where is 0.95. The probability of frontier expansion is 0.05. Then we compare with the truly reachable set. The main criteria of the comparison are recall—how many nodes in the truly reachable set are present in the probabilistic reachable set—and precision—how many nodes in the probabilistic reachable set are truly reachable. We also compare their edge coverage—how many visited edges are on the shortest paths to any truly reachable destinations. Note that we do not report the number of unsuccessful delivery separately because these unsuccessful delivery will lower the learning speed, and thus their negative effects have been reflected in the learning rate. All drones return to the base safely in our experiments.
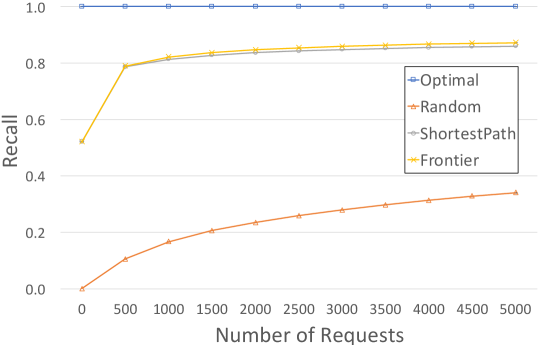
We conducted an experiment to compare the exploration strategies as the number of requests increases (see Figure 4). Notice that each data point in these figures is an average of 600 numbers. The 95% confidence intervals are shown as the tiny error bars at the data points in these figures. According to Figure 4, the precision and the edge coverage of Frontier were much better than ShortestPath as shown in Figure 4, while the recalls were almost the same. Moreover, the edge coverage of Frontier seems to be quite close to the edge coverage of the optimal strategy, which means that the set of edges visited by Frontier and the optimal strategy are nearly the same. However, we anticipate that as the number of requests increases, the edge coverage of Frontier cannot reach 100% as the optimal strategy does, because there are some edges visited by the optimal strategy that would be difficult for Frontier to explore. However, if we implement the random exploration scheme as described at the end of the last section, Frontier will eventually explore all edges to all reachable nodes in a graph, and hence give the same result as the optimal strategy in the long run.
Our second experiment focused on the effect of virtually increasing the maximum energy of a drone when deciding whether a trip is acceptable. Let be the percentage of the increase of the maximum energy as defined previously. A large value of will allow the drone to accept more requests, meaning that there will be more “risky” exploration—flying to destinations even though the current energy model suggests that there is not enough energy to fly to these destinations. The experiment setting was the same as the setting in the first experiment except that the number of requests was reduced to . Apart from recall and precision, we also report the acceptance rate of requests (i.e., how many requests have been accepted for delivery), the success rate of requests (i.e., among all accepted requests, how many delivery have been successful), and the delivery rate (i.e., among all requests, how many delivery have been successful). Notice that the delivery rate is equal to the acceptance rate times the success rate of requests.
Table I shows the results after requests. Each number in Table I is an average of 600 numbers. As can be seen, all statistics except the success rate and the recall increases as increases. It is because more exploration were encouraged as the drone thinks it has more energy than it actually has, and that helps the drone to gather more accurate information about the actual energy consumption to increase the precision. The success rate of delivery decreases because some of these exploration will fail due to the lack of energy. However, the delivery rate only increases little even after we accept more requests. This means that many of the new risky exploration end up in failure. Nonetheless, a larger value of does have a positive effect on precision and the delivery rate, hence if we do not mind many delivery will fail, we should set to a larger value. But the downside is that the recall slightly decreases as the strategy behave more like a random strategy whose recall is low.
| ShortestPath | |||||
|---|---|---|---|---|---|
| Accept | Success | Delivery | Recall | Precision | |
| 0% | 0.534 | 0.857 | 0.458 | 0.836 | 0.946 |
| 10% | 0.645 | 0.752 | 0.458 | 0.849 | 0.958 |
| 20% | 0.755 | 0.654 | 0.494 | 0.850 | 0.969 |
| 30% | 0.843 | 0.585 | 0.493 | 0.845 | 0.976 |
| 40% | 0.909 | 0.542 | 0.492 | 0.838 | 0.981 |
| 50% | 0.950 | 0.518 | 0.492 | 0.834 | 0.983 |
| Frontier | |||||
|---|---|---|---|---|---|
| Accept | Success | Delivery | Recall | Precision | |
| 0% | 0.724 | 0.658 | 0.477 | 0.846 | 0.965 |
| 10% | 0.965 | 0.588 | 0.487 | 0.842 | 0.974 |
| 20% | 0.903 | 0.543 | 0.490 | 0.836 | 0.980 |
| 30% | 0.950 | 0.518 | 0.492 | 0.831 | 0.983 |
| 40% | 0.975 | 0.504 | 0.491 | 0.829 | 0.984 |
| 50% | 0.989 | 0.498 | 0.492 | 0.827 | 0.985 |
VII Conclusions and Future Work
We addressed the drone exploration problem put forth by [1] and proposed a new exploration strategy called Frontier, which encourages exploration near the frontier to speed up the learning process. Unlike the ShortestPath strategy in [1], Frontier guarantees to converge to the truly reachable set. While this paper focuses mainly on solving a real-world problem for delivery drones, the underlying problem of finding all reachable nodes in an unknown graph is theoretically interesting by itself since previous works mostly focus on finding one reachable node only in an unknown graph. While we considered flying one drone at a time, our framework allows multiple drones to fly at the same time. If there are drones flying in parallel all the time, we expect the learning rate can speed up by a factor of . In the future, we intend to leverage the shared knowledge among multiple drones to speed up the learning process.
Acknowledgments
This work has been taken place in the ART Lab at Ulsan National Institute of Science & Technology. ART research is supported by NRF (2.190315.01 and 2.180557.01).
References
- [1] T. Nguyen and T.-C. Au, “Extending the range of delivery drones by exploratory learning of energy models,” in AAMAS, 2017, pp. 1658–1660.
- [2] M. Shanmugavel, A. Tsourdos, R. Zbikowski, and B. A. White, “Path planning of multiple uavs using dubins sets,” in AIAA Guidance, Navigation, and Control Conference and Exhibit, San Francisco, CA, Aug. 15, vol. 18, 2005. [Online]. Available: http://arc.aiaa.org/doi/pdf/10.2514/6.2005-5827
- [3] X. Ma and D. A. Castanon, “Receding horizon planning for Dubins traveling salesman problems,” in IEEE Conference on Decision and Control, 2006, pp. 5453–5458. [Online]. Available: http://ieeexplore.ieee.org/xpls/abs˙all.jsp?arnumber=4177966
- [4] M. Zhou and J. V. R. Prasad, “3d Minimum Fuel Route Planning and Path Generation for a Fuel Cell Powered UAV,” Unmanned Systems, vol. 02, no. 01, pp. 53–72, Jan. 2014. [Online]. Available: http://www.worldscientific.com/doi/abs/10.1142/S2301385014500046
- [5] M. B. Boslough, “Autonomous dynamic soaring platform for distributed mobile sensor arrays,” Sandia National Laboratories, Sandia National Laboratories, Tech. Rep. SAND2002-1896, 2002. [Online]. Available: https://cfwebprod.sandia.gov/cfdocs/CompResearch/docs/02-1896˙MobileSensorArrays.pdf
- [6] Y. J. Zhao, “Optimal patterns of glider dynamic soaring,” Optimal control applications and methods, vol. 25, no. 2, pp. 67–89, 2004. [Online]. Available: http://onlinelibrary.wiley.com/doi/10.1002/oca.739/abstract
- [7] Y. J. Zhao and Y. C. Qi, “Minimum fuel powered dynamic soaring of unmanned aerial vehicles utilizing wind gradients,” Optimal control applications and methods, vol. 25, no. 5, pp. 211–233, 2004. [Online]. Available: http://onlinelibrary.wiley.com/doi/10.1002/oca.744/abstract
- [8] G. Sachs, “Minimum shear wind strength required for dynamic soaring of albatrosses,” Ibis, vol. 147, no. 1, pp. 1–10, 2005. [Online]. Available: http://onlinelibrary.wiley.com/doi/10.1111/j.1474-919x.2004.00295.x/full
- [9] A. Chakrabarty and J. W. Langelaan, “Energy maps for long-range path planning for small-and micro-uavs,” in Guidance, Navigation and Control Conference, vol. 2009, 2009, p. 6113. [Online]. Available: http://arc.aiaa.org/doi/pdf/10.2514/6.2009-6113
- [10] ——, “Energy-Based Long-Range Path Planning for Soaring-Capable Unmanned Aerial Vehicles,” Journal of Guidance, Control, and Dynamics, vol. 34, no. 4, pp. 1002–1015, 2011. [Online]. Available: http://dx.doi.org/10.2514/1.52738
- [11] P. Lissaman, “Wind energy extraction by birds and flight vehicles,” AIAA paper, vol. 241, 2005. [Online]. Available: http://arc.aiaa.org/doi/pdf/10.2514/6.2005-241
- [12] J. W. Langelaan, “Gust energy extraction for mini and micro uninhabited aerial vehicles,” Journal of guidance, control, and dynamics, vol. 32, no. 2, pp. 464–473, 2009. [Online]. Available: http://arc.aiaa.org/doi/pdf/10.2514/1.37735
- [13] N. R. Lawrance and S. Sukkarieh, “Autonomous exploration of a wind field with a gliding aircraft,” Journal of Guidance, Control, and Dynamics, vol. 34, no. 3, pp. 719–733, 2011. [Online]. Available: http://arc.aiaa.org/doi/pdf/10.2514/1.52236
- [14] D. Dey, A. Kolobov, R. Caruana, E. Kamar, E. Horvitz, and A. Kapoor, “Gauss meets canadian traveler: Shortest-path problems with correlated natural dynamics,” in Proceedings of the International Joint Conferenceon Autonomous Agents and Multi Agent Systems (AAMAS), 2014, pp. 1101–1108.
- [15] J. L. Nguyen, N. R. Lawrance, R. Fitch, and S. Sukkarieh, “Energy-constrained motion planning for information gathering with autonomous aerial soaring,” in ICRA, 2013, pp. 3825–3831.
- [16] J. L. Nguyen, N. R. Lawrance, and S. Sukkarieh, “Nonmyopic planning for long-term information gathering with an aerial glider,” in ICRA, 2014, pp. 6573–6578.
- [17] B. Yamauchi, “A frontier-based approach for autonomous exploration,” in IEEE International Symposium on Computational Intelligence in Robotics and Automation, 1997, pp. 146–151.
- [18] M. Betke, R. L. Rivest, and M. Singh, “Piecemeal learning of an unknown environment,” Machine Learning, vol. 18, no. 2-3, pp. 231–254, 1995. [Online]. Available: http://link.springer.com/article/10.1007/BF00993411
- [19] S. Al-Hasan and G. Vachtsevanos, “Intelligent route planning for fast autonomous vehicles operating in a large natural terrain,” Robotics and Autonomous Systems, vol. 40, no. 1, pp. 1–24, 2002.
- [20] B. Sofman, E. Lin, J. A. Bagnell, J. Cole, N. Vandapel, and A. Stentz, “Improving robot navigation through self-supervised online learning,” Journal of Field Robotics, vol. 23, no. 11-12, pp. 1059–1075, 2006.
- [21] M. Ollis, W. H. Huang, and M. Happold, “A bayesian approach to imitation learning for robot navigation,” in IROS, 2007, pp. 709–714.
- [22] J. Souza, R. Marchant, L. Ott, D. Wolf, and F. Ramos, “Bayesian optimisation for active perception and smooth navigation,” in 2014 IEEE International Conference on Robotics and Automation (ICRA), May 2014, pp. 4081–4087.
- [23] R. Martinez-Cantin, N. d. Freitas, E. Brochu, J. Castellanos, and A. Doucet, “A Bayesian exploration-exploitation approach for optimal online sensing and planning with a visually guided mobile robot,” Autonomous Robots, vol. 27, no. 2, pp. 93–103, Aug. 2009. [Online]. Available: http://link.springer.com/article/10.1007/s10514-009-9130-2
- [24] T. Kollar and N. Roy, “Trajectory optimization using reinforcement learning for map exploration,” International Journal of Robotics Research, vol. 27, no. 2, pp. 175–196, 2008.