Experimental Upper Bounds for Resonance-Enhanced Entangled Two-Photon Absorption Cross Section of Indocyanine Green
Abstract
Resonant intermediate states have been proposed to increase the efficiency of entangled two-photon absorption (ETPA). Although resonance-enhanced ETPA (r-ETPA) has been demonstrated in atomic systems using bright squeezed vacuum, it has not been studied in organic molecules. We investigate for the first time r-ETPA in an organic molecular dye, indocyanine green (ICG), when excited by broadband entangled photons in near-IR. Similar to many reported virtual state mediated ETPA (v-ETPA) measurements, no r-ETPA signals are measured, with an experimental upper bound for the cross section placed at cm2/molecule. In addition, the classical resonance-enhanced two-photon absorption (r-TPA) cross section of ICG at 800 nm is measured for the first time to be GM, suggesting that having a resonant intermediate state does not significantly enhance two-photon processes in ICG. The spectrotemporally resolved emission signatures of ICG excited by entangled photons are also presented to support this conclusion.
I Introduction
Research on molecular entangled two-photon absorption (ETPA) has gained momentum over the past decade due to its potential application in nonlinear spectroscopy and bioimaging. While multiple theoretical predictions on ETPA cross sections have been made Landes et al. (2021a); Schlawin (2022); Kang et al. (2020); Burdick et al. (2018); Wittkop, Marmolejo-Tejada, and Mosquera (2023), the predicted values vary by orders of magnitude, and the formulations emphasize different parameters of the excitation flux. Although reported ETPA cross sections could be as high as cm2/molecule Harpham et al. (2009); Guzman et al. (2010); Upton et al. (2013), recent measurements of ETPA cross sections reported values lower than cm2/molecule for organic molecules with virtual intermediate states, even in dyes with near-unity quantum yields which facilitate fluorescence detection such as rhodamine 6G (R6G) Tabakaev et al. (2022); Parzuchowski et al. (2021); Landes et al. (2021b); Mikhaylov et al. (2022); Hickam et al. (2022), and quantum dot systems with large classical two-photon absorption (TPA) cross sections Gäbler et al. (2023). The measured fluorescence signals from ETPA are usually in the tens per second to tens per hour count rate range, which hinders many potential applications in imaging and sensing.
For classical TPA, it is known that a real intermediate state increases the cross section by 1-2 orders of magnitude Terenziani et al. (2008); Kobayashi, Mutoh, and Abe (2018); Drobizhev et al. (2002); Makarov et al. (2007); Hahn et al. (2021). Resonance-enhanced ETPA (r-ETPA) is predicted to be enhanced by similar orders of magnitude in atomic systems Oka (2018); Kang et al. (2020); Schlawin and Buchleitner (2017); Li and Hofmann (2023). While r-ETPA in atomic cesium Georgiades et al. (1995) and atomic rubidium Dayan et al. (2004) have been observed when excited by bright squeezed vacuum, the quantum enhancement on the resonance-enhanced TPA (r-TPA) cross sections was not quantified. Moreover, atoms generally have classical TPA cross sections in the range of cm4 s, which are 7-15 orders of magnitude larger than those of organic molecules ( cm4 s) Sulham, Pitz, and Perram (2010); Davila (2018); Bjorkholm and Liao (1974); Xu et al. (2020); Terenziani et al. (2008); Nociarová et al. (2021). Atoms also have longer-lived excited state coherences than molecules Deutsch et al. (2010); Boyd et al. (2006); Young et al. (2020); Gustin et al. (2023); Hildner, Brinks, and van Hulst (2011); Paulus et al. (2020) which could facilitate coherent biphoton processes. To date, experimental studies in organic molecules have only focused on virtual state-mediated ETPA (v-ETPA) instead of r-ETPA processes Lee and Goodson (2006); Harpham et al. (2009); Guzman et al. (2010); Upton et al. (2013); Villabona-Monsalve et al. (2017, 2018); Eshun et al. (2018); Villabona-Monsalve, Burdick, and Goodson (2020); Tabakaev et al. (2021); Varnavski and Goodson (2020); Parzuchowski et al. (2021); Landes et al. (2021a, c); Mikhaylov et al. (2022); Burdick, Schatz, and Goodson (2021); Corona-Aquino et al. (2022); Tabakaev et al. (2022); Villabona-Monsalve et al. (2022); Triana-Arango, Ramos-Ortiz, and Ramírez-Alarcón (2023); Varnavski et al. (2023).
The experimental challenge in measuring molecular r-ETPA is that signals from the first singlet excited state (S1) can mask signals from the subsequent, weaker excitation to the second singlet excited state (S2). Traditional TPA measurement approaches such as transmission measurements, pump versus pairs power attenuation test Tabakaev et al. (2022); Mikhaylov et al. (2022); Dayan et al. (2005), and z-scans Sengupta et al. (2000); Ajami et al. (2010); Nag, De, and Goswami (2009) therefore become more difficult. Indocyanine green (ICG), however, is a unique case for r-ETPA because it has both an S1-S0 emission at 850 nm and an S2-S0 emission at 550 nm Kumari and Gupta (2019); Das et al. (2013); Pu et al. (2014), as shown in Figure 1. The S2:S1 fluorescence ratio allows quantitative comparison between the r-ETPA cross section and the classical one-photon absorption cross section. ICG is also important in medical imaging as the first FDA-approved near-IR contrast agent noa (2023a). Although traditionally used as a one-photon dye, ICG will have further medical applications in deep tissue imaging if it exhibits significantly enhanced r-ETPA.

In this work, spectrotemporally resolved emission signatures of ICG are measured when photoexcited by broadband entangled photons in the near-IR region. No r-ETPA signals are measured within the detection limits of the measurements, allowing us to place an experimental upper bound on the r-ETPA cross section of ICG at cm2/molecule. For comparison, the classical r-TPA cross section is also measured to be GM where 1 GM equals cm4 s/molecule. The results suggest that having a resonant intermediate state does not significantly enhance the ETPA cross section of ICG in this case. The findings indicate that current measurement schemes with non-diffraction-limited focusing conditions, fluorescence collection efficiencies, and photons/s dark counts are not sufficiently sensitive for detecting r-ETPA signals in organic molecules with 20 GM classical TPA cross sections. The measured sequential absorption cross section for ICG is reported for the first time, and this may still be useful for future imaging and sensing applications.
II Methods
II.1 Measuring r-ETPA cross sections

A previously described continuous-wave (CW) laser-pumped, broadband entangled photon source is used in the experiments Szoke et al. (2021); Hickam et al. (2022). Briefly, as shown in Figure 2, a 400-mW CW laser diode (Coherent) with a center wavelength of 403 nm is focused by a 400 mm plano-convex lens through a temperature-controlled Type 0 periodically poled lithium tantalate (ppLT) crystal. This produces collinear entangled photons centered around 806 nm with a bandwidth of 200 nm via spontaneous parametric down-conversion (SPDC). To minimize hot-band absorption Mikhaylov et al. (2022) and one-photon scatter Hickam et al. (2022), edgepass filters are used to limit the bandwidth of the entangled photon excitation flux to 750-850 nm. Coincidence counting within the linear response range of the single photon avalanche diodes (SPAD, Laser Components) is used to verify that SPDC pairs rate scales linearly with pump power. The maximum SPDC pairs rate used here is pairs/s, corresponding to 9.2 nW of pairs flux and an SPDC efficiency of .
Two different detection schemes are used to measure fluorescence from r-ETPA in ICG. Each scheme has its advantages and drawbacks. The first detection scheme, as shown in Figure 2a, uses a Michelson interferometer to introduce time delays () between the signal and idler photons in the excitation flux. A grating spectrometer and an electron-multiplying intensified charge-coupled device (emICCD, Princeton Instruments) measure any fluorescence signal. An achromatic lens with a 100 mm focal length focuses excitation flux down to 200 m beam waist into a 10-mm thick cuvette. The cuvette holds an aqueous solution of 1 mM ICG. The second detection scheme (Figure 2b) is an epifluorescence scheme with a SPAD. Compared with literature Tabakaev et al. (2022), a motorized beam block is also added to the pump path that blocks and unblocks the pump laser every 1 min to allow subtraction of dark counts and eliminate drift over long integration times. Also, instead of using different optical components to vary the pump and pairs rate, there are two locations along the beam path where a continuously variable metallic neutral density (ND) filter wheel is placed. The 2-mm thick ND wheel minimally affects the direction of beam propagation and introduces negligible dispersion. An aspheric lens with a 4.51 mm focal length and 0.55 numerical aperture (NA) focuses the excitation flux down to 35 m beam waist into a sample cuvette, measured by a laser beam profiler (Femto Easy). The cuvette is 1 mm thick to reduce fluorescence reabsorption, and the solvent is changed to DMSO for improved quantum yield Berezin et al. (2007) while the dye concentration remains 1 mM.
The Michelson scheme eliminates false signals caused by uncorrelated photon pairs and one-photon events by analyzing the interference pattern in the spectrotemporally recorded signal Hickam et al. (2022). The disadvantage of the scheme is its loss and complexity. The nondeterministic splitting of the entangled pairs by the Michelson interferometer incurs a 75% loss of visibility, and the spectrometer slit and grating induces another 50% loss. The emICCD’s high dark counts (/s/pixel) add an extra source of noise and are not ideal for detecting single photons. Overall, the interferometer’s long-term instability prevents acquisition times longer than a few minutes per data point. The main advantage of the epifluorescence and SPAD measurement is that it improves fluorescence collection efficiency by at least an order of magnitude to 1.5% compared with the Michelson setup. Hours-long integration times per data point are also possible with the SPAD. The disadvantage is that the SPAD is a bucket detector and cannot discern false signals from one-photon scatter or residual pump leakage. Heavy optical filtering must instead be relied on. A total of 20 OD of optical filtering from stacked longpass filters is used to remove the 403 nm CW pump beam after SPDC. A total of 8 OD of shortpass filters are placed in front of the SPAD to minimize one-photon SPDC scatter into the detector.
II.2 Measuring classical r-TPA cross sections
To benchmark the quantum enhancement of r-ETPA, the classical r-TPA cross section of ICG at 800 nm is first measured as it is not widely reported in the literature. Two-photon fluorescence from ICG is compared with that from a reference sample of R6G with known TPA cross sections Makarov, Drobizhev, and Rebane (2008). Both ICG and R6G are dissolved in DMSO and have the same concentration of 2.5 M. The r-TPA cross section of ICG can be derived from the following formula Deng et al. (2020):
| (1) |
where is the two-photon fluorescence quantum yield of ICG or R6G, is the TPA cross section of ICG or R6G at 800 nm excitation, is the measured two-photon fluorescence flux from ICG or R6G excited by an 800 nm laser, and is the excitation power used on ICG or R6G.
Classical two-photon fluorescence is measured by a calibrated, commercial Zeiss LSM 880 confocal laser scanning microscope with a 140-fs pulse width multiphoton tunable laser (Coherent). The sample solution is mounted into an imaging well formed by a 1-mm thick silicone spacer (CultureWell) securely placed on a glass slide and covered by a #1.5 coverslip. The sample is then placed on the translation stage of the microscope, where a 40x C‐apochromat water immersion objective (1.2 NA) is used to excite the sample and collect fluorescence. The microscope is equipped with appropriate emission filters, a series of diffraction gratings, and 32 photomultiplier tubes for TPA fluorescence detection. The built-in photon counting mode of the microscope is used to measure the fluorescence count rate, and the measurement is averaged over 50 repetitions of 1 s integration time. The fluorescence flux values in Equation 1 for ICG and R6G are obtained by subtracting the background count rate of pure DMSO from the sample count rates. The excitation power ratio between R6G and ICG is calculated from the pulsed laser output powers, assuming linear losses of the laser power through the optical path before the sample plane. Specifically, to ensure the measured classical TPA fluorescence count rates are within the photomultiplier tubes’ dynamic range, a ratio of 0.5 is used since ICG fluorescence quantum yield is lower than that of R6G. The built-in spectral detection mode of the microscope (9 nm resolution) is also used to qualitatively measure the r-TPA fluorescence spectrum of ICG, with an optical filter cutoff at 647 nm.
III Results and Discussion
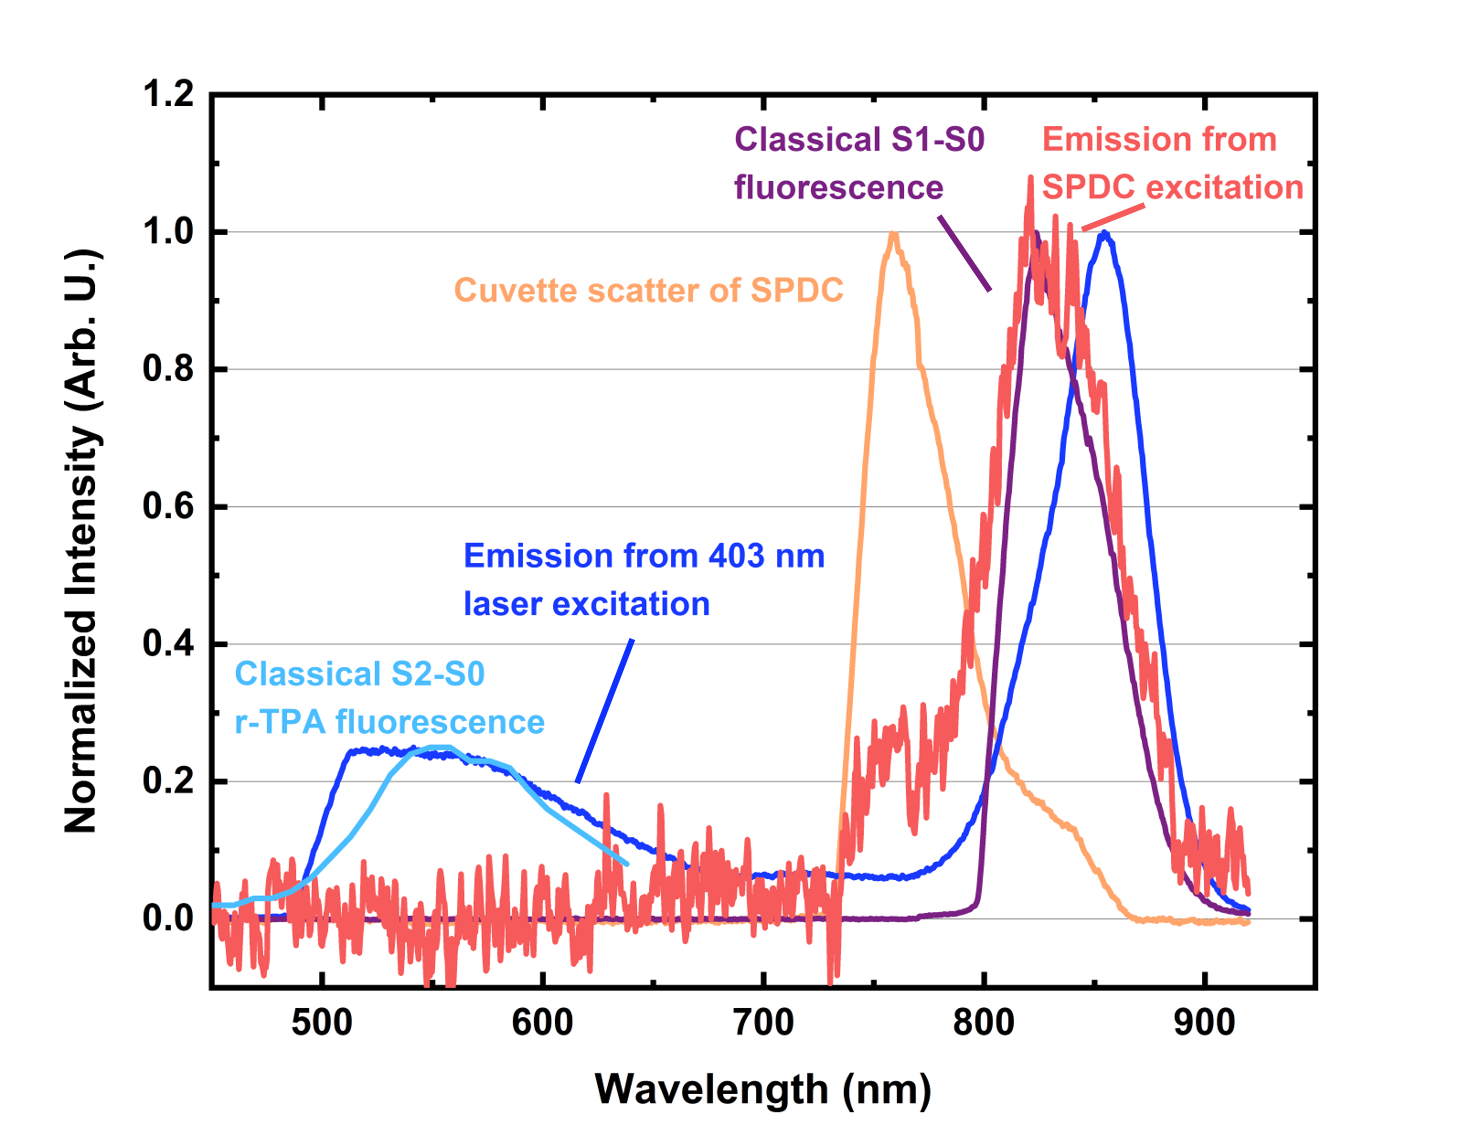
Figure 3 compares the emission spectrum of ICG excited by the SPDC flux (red) with ICG’s classical r-TPA S2-S0 fluorescence spectrum (light blue) and classical S1-S0 fluorescence spectrum (purple). The S2-S0 and S1-S0 emission peaks by 403 nm excitation (deep blue) are spectrally separated so their peak intensity ratio is used to estimate the S2-S0 fluorescence quantum yield of ICG for later calculation of the classical r-TPA cross section. Specifically, the intensity values at 555 nm (S2-S0 fluorescence peak) and 850 nm (S1-S0 fluorescence peak) are scaled by the quantum efficiencies (QEs) of the spectrometer grating noa (2023b) and CCD camera noa (2023c). The ratio of the QE-corrected intensities is then multiplied by ICG S1-S0 fluorescence quantum yield of 0.12 in DMSO Berezin et al. (2007), resulting in an estimated ICG S2-S0 fluorescence quantum yield of 0.02. The emission spectrum from SPDC excitation (red) at 20 s integration time does not have an apparent S2-S0 emission peak. Therefore, the more spectrally sensitive Michelson interference scheme (Figure 2a) is employed to examine if one- versus two-photon signals can be separated.
Figure 4 compares the CCD interferograms of the ICG S1-S0 (purple) and S2-S0 (red) emission regions as a function of time delay. Coincidence rates from the SPDC flux, measured by a pair of SPADs and a timing circuit, are also shown in orange. Each data point at a certain time delay in the S1-S0 emission region (820-920 nm) represents a summed signal count accumulated over 10 s, and each data point in the S2-S0 emission region (450-650 nm) represents a summed signal count accumulated over 100 s. In the two-photon coincidence interferogram, for an entangled state, the peak amplitudes are larger than the valley amplitudes near time zero. In a TPA event, the interferogram of the fluorescence will follow that of the SPDC coincidences. For a one-photon absorption event, the interferogram’s peak and valley components have equal amplitudes, which is the case for the ICG S1-S0 emission pattern Figure 4a. On the other hand, the interferogram for the S2-S0 emission region is at or near noise level, indicating that no one- or two-photon signals exist within the spectral region despite this approach’s higher signal-to-noise ratio compared with the spectral measurement of Figure 3. The conclusions are further reinforced by the Fourier transforms of the interferograms Figure 4b, where only the SPDC coincidences have a strong 2f peak at 403 nm, and no peaks are measured in the S2-S0 emission region.

Finally, an epifluorescence and SPAD measurement scheme (Figure 2b) is used to confirm the lack of a two-photon induced signal at even longer integration times than possible with the Michelson scheme. The approach was previously used to successfully measure v-ETPA signals of R6G with 5+ hours of integration time Tabakaev et al. (2022). Error analysis is first performed using 1 mM R6G to determine the optimal integration time that stabilizes the standard deviation of the SPAD measurements. Three hundred sets of repeated measurements are used. Within each set, SPAD counts are measured for 1 minute in the laser-off configuration, followed by 1 minute of measurement in the laser-on configuration. A mean counts/s value is then calculated from each 1-min bin. The 150 repeated laser-off and 150 laser-on measurements are then analyzed separately to confirm that each accumulated standard deviation of the mean is proportional to where is the number of repeated 1-min measurements Skoog, Holler, and Crouch . The data indicates that 50 min of integration time stabilizes time-dependent fluctuations and is still practical for performing multiple ETPA measurements.
Figure 5a shows a comparison between the SPAD counts from 1 mM R6G, 1 mM ICG, and solvent DMSO when excited by entangled photons. A wavelength range of 500-650 nm is selected by 8 OD of interference filters at the SPAD entrance, which encompasses both ICG’s S2-S0 r-TPA emission region and R6G’s S1-S0 v-TPA emission region.Although each signal in Figure 5a is already dark-count-subtracted, the solvent DMSO still shows positive counts, possibly indicating molecular Rayleigh scattering Miles, Lempert, and Forkey (2001) of residual CW pump or SPDC. The ICG signal is statistically indistinguishable from the DMSO signal, confirming that r-ETPA is undetectable with an upper bound of cm2/molecule for the cross section as later discussed. The R6G signal has a statistically significant signal above the solvent scatter. A pump versus pairs attenuation power study Tabakaev et al. (2022); Mikhaylov et al. (2022); Dayan et al. (2005) using an ND filter wheel is performed to determine whether the signal is from one- or two-photon events. The measurement approach verifies ETPA when the fluorescence signal scales linearly with varying pump power but quadratically with pairs attenuation because the loss of one photon within an entangled pair destroys the entanglement. However, Figure 5b shows that the R6G signal counts scale linearly with both pump attenuation and pairs attenuation, indicating the presence of one-photon processes such as hot-band absorption Mikhaylov et al. (2022) instead of ETPA. While the pairs attenuation curve is shifted up with respect to the pump attenuation curve, we attribute this discrepancy as an artifact from the placement of the ND filter wheel in the beam path between pump and pair measurements. When moved, the ND wheel can alter background scatter at few photons per second levels. The results are, therefore, too close to the instrument noise floor to draw statistically sound conclusions about ETPA fluorescence in either ICG or R6G.

Experimental upper bounds can be placed on the r-ETPA cross section () of ICG based on the two measurement schemes, as summarized in Table 1. Each scheme’s excitation flux, focusing conditions, collection efficiency, and the optical properties of ICG are used in the calculation Hickam et al. (2022). Additionally, the classical r-TPA cross section of ICG () is calculated to be GM according to Equation 1, and is included in the table for comparison. The measured value is Hz, and the value is Hz. To arrive at the value, the following approximations are made: 1) because reported TPA cross sections of R6G vary by up to 1 order of magnitude, regardless of solvent and excitation conditions Makarov, Drobizhev, and Rebane (2008); Oulianov et al. (2001), GM is used as an estimate for ; 2) is estimated as 0.02 as explained earlier; 3) is approximated to be 0.95 Kubin and Fletcher (1982); Magde, Wong, and Seybold (2002). Because of the approximations, the calculated r-TPA cross section of ICG is emphasized as an order-of-magnitude estimation.
| Michelson scheme detection limits | SPAD scheme detection limits | ||||
| Molecule | Classical | Equivalent 111Calculated from excitation fluxes and focusing areas. | Equivalent | ||
| (GM) | (cm2) | (GM) | (cm2) | (GM) | |
| ICG | 222Measured relative to R6G with 800 nm excitation. | ||||
| R6G | 333Based on literature Makarov, Drobizhev, and Rebane (2008); Oulianov et al. (2001). | ||||
Using the excitation fluxes and focusing areas of the two measurement schemes, the r-ETPA cross section detection limits can be converted noa (2023d) to equivalent values of GM and GM, as shown in Table 1. Comparing these values with ICG’s classical r-TPA cross section of GM, we conclude that having a resonant intermediate state must enhance ICG’s ETPA cross section by less than 11 orders of magnitude. The conclusion is supported by previous theories Oka (2018); Li and Hofmann (2023) suggesting that ETPA would only offer up to 4 orders of magnitude enhancement on the excited state population in atomic systems, and r-TPA may only be 1.7 times more prone to quantum enhancement than v-TPA when excited by 100 nm bandwidth of SPDC photons as used in our work Oka (2018). The determined cross section upper limits for R6G are also listed in Table 1. These detection limits agree with theoretical predictions Landes et al. (2021a) and previous experiments Parzuchowski et al. (2021); Hickam et al. (2022), suggesting that the measured upper bounds on ICG in this work are reasonable. The ICG detection limits differ from the R6G detection limits by 1 order of magnitude mainly because ICG’s absorption bands are broad and heavily overlap with emission bands, leading to a higher chance of fluorescence reabsorption. ICG also has a lower quantum yield than R6G. Note that the correlation time of the entangled photons is 50 fs (Figure 4a), which is much shorter than the sub-ns lifetime of ICG Berezin et al. (2007). Therefore, if present, ICG’s S1-S2 transition is not significantly hindered by the decay of the intermediate state.
The results are intended as upper bounds specific to the described experimental configurations, which have proven helpful in other studies of ETPA Hickam et al. (2022); Parzuchowski et al. (2021). In the future, if near UV to deep UV entangled photons can be created, molecules with higher S2-S0 quantum yields can be studied, such as azulenes, aromatic acenes, polyenes, and metalloporphyrins Itoh (2012). Earlier in the field, theories have predicted that maximizing the bandwidth of the entangled photon source, which in turn maximizes the brightness and minimizes the entangled photon correlation time, would be the best approach to increasing ETPA efficiency Oka (2018); Dayan et al. (2005); Landes et al. (2021a). However, experimentally, the broad momentum matching cone is difficult to collimate, leading to focused spot sizes that are still 1-2 orders of magnitude away from the diffraction limit Szoke et al. (2021). Furthermore, maintaining the single-photon-per-mode limit in nonlinear light-matter interactions may not even be critical. Bright squeezed vacuum, a class of SPDC fluxes that saturate the single-photon-per-mode limit, also exhibits many quantum-enhanced properties in two-photon absorption Georgiades et al. (1995); Dayan et al. (2004), optical harmonics generation Spasibko et al. (2017), and ultrafast spectroscopy Cutipa et al. (2022). Future experiments using bright squeezed vacuum sources generated in a single, waveguided spatial mode could further improve the detection limits for entangled multiphoton processes.
IV Conclusion
We investigated the validity of r-ETPA in ICG and placed upper bounds on the possible enhancement. We measured the spectrotemporally resolved emission signatures of ICG excited by broadband entangled photons in near-IR. Similar to many reported v-ETPA measurements, no r-ETPA signals are measured, with an upper bound for the cross section placed at cm2/molecule. In addition, the classical r-TPA cross section of ICG at 800 nm is measured to be GM. The same measurements are performed on R6G for bench-marking. The results suggest that having a resonant intermediate state does not significantly enhance the ETPA cross section of ICG beyond the detection limits of this study. The findings indicate that current measurement schemes with non-diffraction-limited focusing conditions, fluorescence collection efficiencies, and photons/s dark counts are not sufficiently sensitive for detecting r-ETPA signals in organic molecules with small classical TPA cross sections. Further improvements to lower the instrument detection limits will be the key to the successful detection of r-ETPA as well as v-ETPA signatures.
Acknowledgements.
This material is based upon work supported by the U.S. Department of Energy, Office of Science, Office of Basic Energy Sciences, under Grant DE-SC0020151 (S.K.C.).Conflict of Interest Statement
The authors have no conflicts to disclose.
Author Contributions
Manni He: Conceptualization (equal), Data Curation (lead), Formal Analysis (lead), Methodology (equal), Resources (lead), Software (equal), Writing/Original Draft Preparation (equal), Writing/Review & Editing (equal).
Bryce P. Hickam: Conceptualization (supporting), Data Curation (supporting), Formal Analysis (supporting), Methodology (equal), Resources (supporting), Software (equal).
Nathan Harper: Formal Analysis (supporting), Methodology (supporting), Resources (supporting), Writing/Review & Editing (equal).
Scott K. Cushing: Conceptualization (equal), Funding Acquisition (lead), Methodology (supporting), Writing/Original Draft Preparation (equal), Writing/Review & Editing (equal).
Data Availability Statement
The data that support the findings of this study are available within the article. Additional data are available from the corresponding author upon reasonable request.
References
- Landes et al. (2021a) T. Landes, T. Landes, M. G. Raymer, M. G. Raymer, M. Allgaier, M. Allgaier, S. Merkouche, S. Merkouche, B. J. Smith, B. J. Smith, A. H. Marcus, and A. H. Marcus, “Quantifying the enhancement of two-photon absorption due to spectral-temporal entanglement,” Optics Express 29, 20022–20033 (2021a).
- Schlawin (2022) F. Schlawin, “Polarization-Entangled Two-Photon Absorption in Inhomogeneously Broadened Ensembles,” Frontiers in Physics 10 (2022).
- Kang et al. (2020) G. Kang, K. Nasiri Avanaki, M. A. Mosquera, R. K. Burdick, J. P. Villabona-Monsalve, T. Goodson, and G. C. Schatz, “Efficient Modeling of Organic Chromophores for Entangled Two-Photon Absorption,” Journal of the American Chemical Society 142, 10446–10458 (2020).
- Burdick et al. (2018) R. K. Burdick, O. Varnavski, A. Molina, L. Upton, P. Zimmerman, and T. Goodson, “Predicting and Controlling Entangled Two-Photon Absorption in Diatomic Molecules,” The Journal of Physical Chemistry A 122, 8198–8212 (2018).
- Wittkop, Marmolejo-Tejada, and Mosquera (2023) M. Wittkop, J. M. Marmolejo-Tejada, and M. A. Mosquera, “Multichromatic quantum superpositions in entangled two-photon absorption spectroscopy,” Organic Electronics 120, 106858 (2023).
- Harpham et al. (2009) M. R. Harpham, . Süzer, C.-Q. Ma, P. Bäuerle, and T. Goodson, “Thiophene Dendrimers as Entangled Photon Sensor Materials,” Journal of the American Chemical Society 131, 973–979 (2009).
- Guzman et al. (2010) A. R. Guzman, M. R. Harpham, . Süzer, M. M. Haley, and T. G. Goodson, “Spatial Control of Entangled Two-Photon Absorption with Organic Chromophores,” Journal of the American Chemical Society 132, 7840–7841 (2010).
- Upton et al. (2013) L. Upton, M. Harpham, O. Suzer, M. Richter, S. Mukamel, and T. Goodson, “Optically Excited Entangled States in Organic Molecules Illuminate the Dark,” The Journal of Physical Chemistry Letters 4, 2046–2052 (2013).
- Tabakaev et al. (2022) D. Tabakaev, A. Djorović, L. La Volpe, G. Gaulier, S. Ghosh, L. Bonacina, J.-P. Wolf, H. Zbinden, and R. Thew, “Spatial Properties of Entangled Two-Photon Absorption,” Physical Review Letters 129, 183601 (2022).
- Parzuchowski et al. (2021) K. M. Parzuchowski, A. Mikhaylov, M. D. Mazurek, R. N. Wilson, D. J. Lum, T. Gerrits, C. H. Camp, M. J. Stevens, and R. Jimenez, “Setting Bounds on Entangled Two-Photon Absorption Cross Sections in Common Fluorophores,” Physical Review Applied 15, 044012 (2021).
- Landes et al. (2021b) T. Landes, M. Allgaier, S. Merkouche, B. J. Smith, A. H. Marcus, and M. G. Raymer, “Experimental feasibility of molecular two-photon absorption with isolated time-frequency-entangled photon pairs,” Physical Review Research 3, 033154 (2021b).
- Mikhaylov et al. (2022) A. Mikhaylov, R. N. Wilson, K. M. Parzuchowski, M. D. Mazurek, C. H. J. Camp, M. J. Stevens, and R. Jimenez, “Hot-Band Absorption Can Mimic Entangled Two-Photon Absorption,” The Journal of Physical Chemistry Letters 13, 1489–1493 (2022).
- Hickam et al. (2022) B. P. Hickam, M. He, N. Harper, S. Szoke, and S. K. Cushing, “Single-Photon Scattering Can Account for the Discrepancies among Entangled Two-Photon Measurement Techniques,” The Journal of Physical Chemistry Letters 13, 4934–4940 (2022).
- Gäbler et al. (2023) T. B. Gäbler, P. Hendra, N. Jain, and M. Gräfe, “Photon Pair Source based on PPLN-Waveguides for Entangled Two-Photon Absorption,” Advanced Physics Research , 2300037 (2023).
- Terenziani et al. (2008) F. Terenziani, C. Katan, E. Badaeva, S. Tretiak, and M. Blanchard-Desce, “Enhanced Two-Photon Absorption of Organic Chromophores: Theoretical and Experimental Assessments,” Advanced Materials 20, 4641–4678 (2008).
- Kobayashi, Mutoh, and Abe (2018) Y. Kobayashi, K. Mutoh, and J. Abe, “Stepwise two-photon absorption processes utilizing photochromic reactions,” Journal of Photochemistry and Photobiology C: Photochemistry Reviews 34, 2–28 (2018).
- Drobizhev et al. (2002) M. Drobizhev, A. Karotki, M. Kruk, and A. Rebane, “Resonance enhancement of two-photon absorption in porphyrins,” Chemical Physics Letters 355, 175–182 (2002).
- Makarov et al. (2007) N. Makarov, M. Drobizhev, A. Rebane, D. Peone, H. Wolleb, H. Spahni, E. A. Makarova, and E. A. Lukyanets, “Resonance enhancement of two-photon absorption of phthalocyanines for 3D optical storage in the presence of hot-band absorption,” in Organic Photonic Materials and Devices IX, Vol. 6470 (SPIE, 2007) pp. 147–158.
- Hahn et al. (2021) V. Hahn, T. Messer, N. M. Bojanowski, E. R. Curticean, I. Wacker, R. R. Schröder, E. Blasco, and M. Wegener, “Two-step absorption instead of two-photon absorption in 3D nanoprinting,” Nature Photonics 15, 932–938 (2021).
- Oka (2018) H. Oka, “Two-photon absorption by spectrally shaped entangled photons,” Physical Review A 97, 033814 (2018).
- Schlawin and Buchleitner (2017) F. Schlawin and A. Buchleitner, “Theory of coherent control with quantum light,” New Journal of Physics 19, 013009 (2017).
- Li and Hofmann (2023) B. Li and H. F. Hofmann, “Enhancement of broadband entangled two-photon absorption by resonant spectral phase flips,” Physical Review A 108, 013706 (2023).
- Georgiades et al. (1995) N. P. Georgiades, E. S. Polzik, K. Edamatsu, H. J. Kimble, and A. S. Parkins, “Nonclassical Excitation for Atoms in a Squeezed Vacuum,” Physical Review Letters 75, 3426–3429 (1995).
- Dayan et al. (2004) B. Dayan, A. Pe’er, A. A. Friesem, and Y. Silberberg, “Two Photon Absorption and Coherent Control with Broadband Down-Converted Light,” Physical Review Letters 93, 023005 (2004).
- Sulham, Pitz, and Perram (2010) C. V. Sulham, G. A. Pitz, and G. P. Perram, “Blue and infrared stimulated emission from alkali vapors pumped through two-photon absorption,” Applied Physics B 101, 57–63 (2010).
- Davila (2018) R. C. Davila, Two-Photon Excitation of Cesium Alkali Metal Vapor 72D, 82D Kinetics and Spectroscopy, Ph.D. thesis, Air Force Institute of Technology (2018).
- Bjorkholm and Liao (1974) J. E. Bjorkholm and P. F. Liao, “Resonant Enhancement of Two-Photon Absorption in Sodium Vapor,” Physical Review Letters 33, 128–131 (1974).
- Xu et al. (2020) L. Xu, J. Zhang, L. Yin, X. Long, W. Zhang, and Q. Zhang, “Recent progress in efficient organic two-photon dyes for fluorescence imaging and photodynamic therapy,” Journal of Materials Chemistry C 8, 6342–6349 (2020).
- Nociarová et al. (2021) J. Nociarová, P. Osuský, E. Rakovský, D. Georgiou, I. Polyzos, M. Fakis, and P. Hrobárik, “Direct Iodination of Electron-Deficient Benzothiazoles: Rapid Access to Two-Photon Absorbing Fluorophores with Quadrupolar D--A--D Architecture and Tunable Heteroaromatic Core,” Organic Letters 23, 3460–3465 (2021), publisher: American Chemical Society.
- Deutsch et al. (2010) C. Deutsch, F. Ramirez-Martinez, C. Lacroûte, F. Reinhard, T. Schneider, J. N. Fuchs, F. Piéchon, F. Laloë, J. Reichel, and P. Rosenbusch, “Spin Self-Rephasing and Very Long Coherence Times in a Trapped Atomic Ensemble,” Physical Review Letters 105, 020401 (2010).
- Boyd et al. (2006) M. M. Boyd, T. Zelevinsky, A. D. Ludlow, S. M. Foreman, S. Blatt, T. Ido, and J. Ye, “Optical Atomic Coherence at the 1-Second Time Scale,” Science 314, 1430–1433 (2006).
- Young et al. (2020) A. W. Young, W. J. Eckner, W. R. Milner, D. Kedar, M. A. Norcia, E. Oelker, N. Schine, J. Ye, and A. M. Kaufman, “Half-minute-scale atomic coherence and high relative stability in a tweezer clock,” Nature 588, 408–413 (2020).
- Gustin et al. (2023) I. Gustin, C. W. Kim, D. W. McCamant, and I. Franco, “Mapping electronic decoherence pathways in molecules,” Proceedings of the National Academy of Sciences 120, e2309987120 (2023).
- Hildner, Brinks, and van Hulst (2011) R. Hildner, D. Brinks, and N. F. van Hulst, “Femtosecond coherence and quantum control of single molecules at room temperature,” Nature Physics 7, 172–177 (2011).
- Paulus et al. (2020) B. C. Paulus, S. L. Adelman, L. L. Jamula, and J. K. McCusker, “Leveraging excited-state coherence for synthetic control of ultrafast dynamics,” Nature 582, 214–218 (2020).
- Lee and Goodson (2006) D.-I. Lee and T. Goodson, “Entangled Photon Absorption in an Organic Porphyrin Dendrimer,” The Journal of Physical Chemistry B 110, 25582–25585 (2006).
- Villabona-Monsalve et al. (2017) J. P. Villabona-Monsalve, O. Calderón-Losada, M. Nuñez Portela, and A. Valencia, “Entangled Two Photon Absorption Cross Section on the 808 nm Region for the Common Dyes Zinc Tetraphenylporphyrin and Rhodamine B,” The Journal of Physical Chemistry A 121, 7869–7875 (2017).
- Villabona-Monsalve et al. (2018) J. P. Villabona-Monsalve, O. Varnavski, B. A. Palfey, and T. I. Goodson, “Two-Photon Excitation of Flavins and Flavoproteins with Classical and Quantum Light,” Journal of the American Chemical Society 140, 14562–14566 (2018).
- Eshun et al. (2018) A. Eshun, Z. Cai, M. Awies, L. Yu, and I. I. I. T. Goodson, “Investigations of Thienoacene Molecules for Classical and Entangled Two-Photon Absorption,” The Journal of Physical Chemistry A (2018).
- Villabona-Monsalve, Burdick, and Goodson (2020) J. P. Villabona-Monsalve, R. K. Burdick, and T. I. Goodson, “Measurements of Entangled Two-Photon Absorption in Organic Molecules with CW-Pumped Type-I Spontaneous Parametric Down-Conversion,” The Journal of Physical Chemistry C 124, 24526–24532 (2020).
- Tabakaev et al. (2021) D. Tabakaev, M. Montagnese, G. Haack, L. Bonacina, J.-P. Wolf, H. Zbinden, and R. T. Thew, “Energy-time-entangled two-photon molecular absorption,” Physical Review A 103, 033701 (2021).
- Varnavski and Goodson (2020) O. Varnavski and T. Goodson, “Two-Photon Fluorescence Microscopy at Extremely Low Excitation Intensity: The Power of Quantum Correlations,” Journal of the American Chemical Society 142 (2020).
- Landes et al. (2021c) T. Landes, M. Allgaier, S. Merkouche, B. J. Smith, A. H. Marcus, and M. G. Raymer, “Experimental Bounds on Entangled Two Photon Absorption in Rhodamine 6G,” in Conference on Lasers and Electro-Optics (2021), paper FM3N.3 (Optica Publishing Group, 2021) p. FM3N.3.
- Burdick, Schatz, and Goodson (2021) R. K. Burdick, G. C. Schatz, and T. I. Goodson, “Enhancing Entangled Two-Photon Absorption for Picosecond Quantum Spectroscopy,” Journal of the American Chemical Society 143, 16930–16934 (2021).
- Corona-Aquino et al. (2022) S. Corona-Aquino, O. Calderón-Losada, M. Y. Li-Gómez, H. Cruz-Ramirez, V. Álvarez Venicio, M. d. P. Carreón-Castro, R. de J. León-Montiel, and A. B. U’Ren, “Experimental Study of the Validity of Entangled Two-Photon Absorption Measurements in Organic Compounds,” The Journal of Physical Chemistry A 126, 2185–2195 (2022).
- Villabona-Monsalve et al. (2022) J. P. Villabona-Monsalve, N. A. Tcyrulnikov, E. R. Lorenzo, N. LaBine, R. Burdick, M. D. Krzyaniak, R. M. Young, M. R. Wasielewski, and T. I. Goodson, “Two-Photon Absorption in Electron Donor–Acceptor Dyads and Triads Using Classical and Entangled Photons: Potential Systems for Photon-to-Spin Quantum Transduction,” The Journal of Physical Chemistry C 126, 6334–6343 (2022).
- Triana-Arango, Ramos-Ortiz, and Ramírez-Alarcón (2023) F. Triana-Arango, G. Ramos-Ortiz, and R. Ramírez-Alarcón, “Spectral Considerations of Entangled Two-Photon Absorption Effects in Hong–Ou–Mandel Interference Experiments,” The Journal of Physical Chemistry A 127, 2608–2617 (2023).
- Varnavski et al. (2023) O. Varnavski, S. K. Giri, T.-M. Chiang, C. J. Zeman, G. C. Schatz, and T. Goodson, “Colors of entangled two-photon absorption,” Proceedings of the National Academy of Sciences 120, e2307719120 (2023).
- Dayan et al. (2005) B. Dayan, A. Pe’er, A. A. Friesem, and Y. Silberberg, “Nonlinear Interactions with an Ultrahigh Flux of Broadband Entangled Photons,” Physical Review Letters 94, 043602 (2005).
- Sengupta et al. (2000) P. Sengupta, J. Balaji, S. Banerjee, R. Philip, G. R. Kumar, and S. Maiti, “Sensitive measurement of absolute two-photon absorption cross sections,” The Journal of Chemical Physics 112, 9201–9205 (2000).
- Ajami et al. (2010) A. Ajami, W. Husinsky, R. Liska, and N. Pucher, “Two-photon absorption cross section measurements of various two-photon initiators for ultrashort laser radiation applying the Z-scan technique,” JOSA B 27, 2290–2297 (2010).
- Nag, De, and Goswami (2009) A. Nag, A. K. De, and D. Goswami, “Two-photon cross-section measurements using an optical chopper: z-scan and two-photon fluorescence schemes,” Journal of Physics B: Atomic, Molecular and Optical Physics 42, 065103 (2009).
- Kumari and Gupta (2019) A. Kumari and S. Gupta, “Two-photon excitation and direct emission from S2 state of U.S. Food and Drug Administration approved near-infrared dye: Application of anti-Kasha’s rule for two-photon fluorescence imaging,” Journal of Biophotonics 12, e201800086 (2019).
- Das et al. (2013) D. K. Das, K. Makhal, S. Singhal, and D. Goswami, “Polarization induced control of multiple fluorescence from a molecule,” Chemical Physics Letters 579, 45–50 (2013).
- Pu et al. (2014) Y. Pu, L. Shi, S. Pratavieira, and R. R. Alfano, “Enhancing the depth of tissue microscope imaging using two-photon excitation of the second singlet state of fluorescent agents,” in Optical Biopsy XII, Vol. 8940 (SPIE, 2014) pp. 176–182.
- noa (2023a) “Is indocyanine green (ICG) FDA approved?” (Accessed 25 August 2023a), by AAT Bioquest. https://www.aatbio.com/resources/faq-frequently-asked-questions/Is-indocyanine-green-ICG-FDA-approved.
- Szoke et al. (2021) S. Szoke, M. He, B. P. Hickam, and S. K. Cushing, “Designing high-power, octave spanning entangled photon sources for quantum spectroscopy,” The Journal of Chemical Physics 154, 244201 (2021).
- Berezin et al. (2007) M. Y. Berezin, H. Lee, W. Akers, and S. Achilefu, “Near Infrared Dyes as Lifetime Solvatochromic Probes for Micropolarity Measurements of Biological Systems,” Biophysical Journal 93, 2892–2899 (2007).
- Makarov, Drobizhev, and Rebane (2008) N. S. Makarov, M. Drobizhev, and A. Rebane, “Two-photon absorption standards in the 550–1600 nm excitation wavelength range,” Optics Express 16, 4029–4047 (2008).
- Deng et al. (2020) X. Deng, C. He, H. Cheng, J. Li, Y. Lu, P. Qiu, and K. Wang, “Measurement of two-photon properties of indocyanine green in water and human plasma excited at the 1700-nm window,” Journal of Biophotonics 13, e202000299 (2020).
- noa (2023b) “IsoPlane,” (Accessed 20 December 2023b), by Teledyne Princeton Instruments. https://www.princetoninstruments.com/products/isoplane-family/isoplane.
- noa (2023c) “PI MAX 4,” (Accessed 20 December 2023c), by Teledyne Princeton Instruments. https://www.princetoninstruments.com/products/pi-max-family/pi-max.
- (63) D. A. Skoog, F. J. Holler, and S. R. Crouch, Principles of Instrumental Analysis, 7th ed. (Cengage).
- Miles, Lempert, and Forkey (2001) R. B. Miles, W. R. Lempert, and J. N. Forkey, “Laser Rayleigh scattering,” Measurement Science and Technology 12, R33 (2001).
- Oulianov et al. (2001) D. A. Oulianov, I. V. Tomov, A. S. Dvornikov, and P. M. Rentzepis, “Observations on the measurement of two-photon absorption cross-section,” Optics Communications 191, 235–243 (2001).
- Kubin and Fletcher (1982) R. F. Kubin and A. N. Fletcher, “Fluorescence quantum yields of some rhodamine dyes,” Journal of Luminescence 27, 455–462 (1982).
- Magde, Wong, and Seybold (2002) D. Magde, R. Wong, and P. G. Seybold, “Fluorescence Quantum Yields and Their Relation to Lifetimes of Rhodamine 6G and Fluorescein in Nine Solvents: Improved Absolute Standards for Quantum Yields,” Photochemistry and Photobiology 75, 327–334 (2002).
- noa (2023d) “Two-photon absorption,” (Accessed 20 December 2023d), by Clean Energy Wiki. Center for Materials and Devices for Information Technology Research https://cleanenergywiki.org/index.php?title=Two_Photon_Absorption.
- Itoh (2012) T. Itoh, “Fluorescence and Phosphorescence from Higher Excited States of Organic Molecules,” Chemical Reviews 112, 4541–4568 (2012).
- Spasibko et al. (2017) K. Y. Spasibko, D. A. Kopylov, V. L. Krutyanskiy, T. V. Murzina, G. Leuchs, and M. V. Chekhova, “Multiphoton Effects Enhanced due to Ultrafast Photon-Number Fluctuations,” Physical Review Letters 119, 223603 (2017).
- Cutipa et al. (2022) P. Cutipa, P. Cutipa, M. V. Chekhova, and M. V. Chekhova, “Bright squeezed vacuum for two-photon spectroscopy: simultaneously high resolution in time and frequency, space and wavevector,” Optics Letters 47, 465–468 (2022).