Exotic Dirac Cones on the Band Structure of -STF2I3 at Ambient Temperature and Pressure
Abstract
The quasi-two-dimensional molecular semimetallic conductor -STF2I3 is isostructural with -ET2I3. The latter possesses a unique band structure showing a zero-gap state with Dirac cones under high pressure, whereas the band structure of the former has been elusive because of heavy disorder at all the donor sites. To elucidate the band structure of -STF2I3, a theoretical method based on the observed atomic parameters at 296 K and 1 bar has been proposed. The results suggest that the STF salt should have a band structure with Dirac cones under ambient pressure and temperature, which should promote future experimental studies on this system. Using the extended Hückel method, we demonstrate that the Dirac points of -STF2I3 are aligned to be symmetric with respect to a time reversal invariant momentum (TRIM). Such novel Dirac cones, where the energy difference between the conduction and valence bands has considerable anisotropy, are clarified in terms of the parity of the wavefunction at the TRIM. We propose the conductivity measurement on the present -STF2I3, which is expected to show a large anisotropy as a characteristic of the present Dirac electrons.
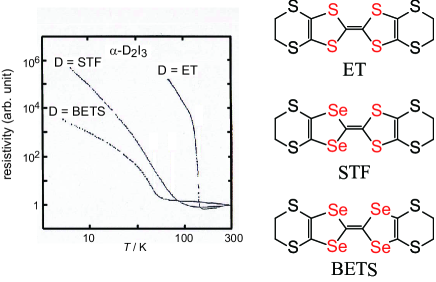
In a recent development in organic conductors,[1, 2] Dirac electrons have been studied extensively since the zero-gap state with Dirac cones [3] has been found in -ET2I3 (ET = BEDT-TTF = bis(ethylenedithio)tetrathiafulvalene) under high pressure (1.5 GPa) using a tight-binding model with transfer integrals.[2, 4, 5, 6, 7] -ET2I3 is isostructural with -BETS2I3[8] and -STF2I3 as the salt,[9, 10, 11, 12] (BETS = BEDT-TSF = bis(ethylenedithio)tetraselenafulvalene). They share a three-quarter-filled band and four molecules per unit cell. The organic donor STF, [9, 10, 11, 12] where STF is bis(ethylenedithio)diselenadithiafulvalene, is an analogue of ET and BETS, has produced a number of salts isostructural with those of ET and BETS, including -D2I3 (D = ET, STF, and BETS) (Fig. 1).
The most important difference between STF and the other organic donors (ET and BETS) lies in the molecular symmetry. Because of the lower symmetry, all the known STF salts include orientational disorder at the donor sites in the crystals. However, regarding electrical, magnetic, and optical properties in the solid states, many of the STF salts exhibit intermediate behavior between the isostructural ET and BETS salts, as if the solids do not contain any disorder but consist of a symmetrical donor containing imaginary atoms between selenium and sulfur at the inner chalcogen atoms. [9, 10, 11, 12] The observation suggests that STF salts should lie between the isostructural ET and BETS salts with stronger/weaker intermolecular interactions among donor molecules than the ET/BETS salts. A typical example is -D2I3 (D = ET, STF, BETS), where one can recognize systematic variation in the electrical behavior in the three salts as shown in Fig. 1. [10]
For -BETS2I3, the temperature dependence of the spin susceptibility[13, 14] shows a marked decrease even in the normal state, suggesting an unusual electronic state ascribed to the peculiar energy band. The band calculation indicates that there should be a Dirac point with overtilted cones, and that -BETS2I3 should remain metallic. [15] The zero-gap state is studied by adding a site potential [15] or taking account of the correlation, [16] where the latter shows the Dirac point near the insulating state followed by the merging of Dirac points at one of the time reversal invariant momenta (TRIMs). In this context, the mechanism to produce Dirac points should be more complicated in -BETS2I3 than in -ET2I3, although a Dirac point by itself originates from the intrinsic property of band crossing. Although -STF2I3 is also expected to show such an electronic state owing to the close similarities in the molecular structures, the band structure is yet to be clarified.
In this Letter, we demonstrate the zero-gap state with the Dirac cone in -STF2I3 by a modified method of estimation of transfer integrals, which is based on single-crystal X-ray structural analysis [Fig. 2(a)].[10] The paper is organized as follows. First, we propose a tentative new method for -STF2I3 to obtain the transfer integrals for the tight-binding model. Next, on the basis of this model, we show theoretically the zero-gap state with Dirac cones, where the Dirac points are aligned toward a TRIM.
In the band calculation of -STF2I3, the most difficult problem is to satisfy the crystallographic requirements in symmetries, which could not be done by locating unsymmetrical donor wavefunctions at the STF sites. To calculate the band structure, it is crucial to retain the crystallographic symmetries required for both a particular donor site and the entire donor arrangement.
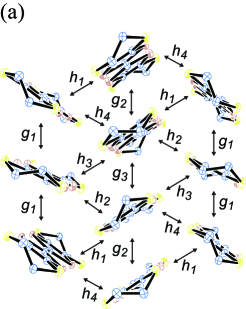
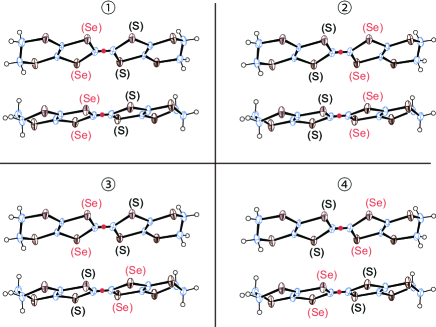
In this study, we have noticed that all the occupancies at the inner chalcogen atoms are 50:50 = S:Se in the STF salt (Tables S1 and S2 in Ref. \citena12). Thus, we carried out a band structure calculation, assuming that the effective transfer integrals () between disordered STF molecules should be treated approximately using the averaged values of all the possible orientations, i.e., four patterns of molecular arrangements in each pair of interacting STF molecules (Fig. 3). The grounds for this assumption are obtained from the single-crystal X-ray structural analysis on -STF2I3[17] [Fig. 2(a)][10]. The asymmetric unit contains two STF molecules in total: an entire STF at a general position plus two halves of STF on the inversion centers, all of which are disordered in the molecular orientation (Fig. 3). The occupancies of S/Se in the inner chalcogen atoms of STF are all 50%/50%. This means that the electron densities of the inner four chalcogen atoms in every STF molecule are averaged to satisfy the inversion symmetry. The obtained transfer integrals corresponding to , and in Figs. 2(a) and 2(b) are summarized in Table S4 (Model A) in Ref. \citena12 based on the Hückel parameters in Table S3 in Ref. \citena12. We also examined the parameter dependence of the results, and have confirmed that a different set of atomic parameters obtained from independent structural analysis also gave qualitatively the same results: a band structure with Dirac cones [Tables S2 and S4 (Model B), and Figs. S1(a) – S1(c)]. [17] As shown in Figs. 4, 5(a), and 5(b), the calculation suggested that -STF2I3 should have a band structure characterized by its Dirac cones at 296 K and 1 bar. The tight-binding band structure obtained on the basis of these transfer integrals qualitatively accounts for the electrical and magnetic properties of -STF2I3, which should also be further examined experimentally.
Here, we make a brief comment on the effect of disorder on the band structure and electronic properties. The disorder should affect the intrinsic electronic properties of Dirac cones and those of a zero-gap semiconductor in -STF2I3, which limits ourselves to comparing the calculated band structure with experimental results. Thus, it is important to estimate the energy scale of disorder effects to clarify the energy and temperature ranges where the band structure will be directly manifested in the electronic properties. In Fig. 1, -STF2I3 exhibits nearly temperature-independent electrical behavior at 100 K, which is the behavior characteristic to a zero-gap semiconductor having Dirac cones. Below 100 K, the resistivity increases with decreasing temperature. Thus, our calculation results can be compared with the observed resistivity behavior at 100 K, and the disorder effect should overwhelm the intrinsic behavior below 100 K.
Now, we examine theoretically such an exotic band structure in -STF2I3 with inversion symmetry between A and A’, which is crucial for the existence of the Dirac point. [18] This mechanism is analyzed in terms of the parity inversion properties of energy bands at the TRIM ( with being a reciprocal lattice vector).[19]
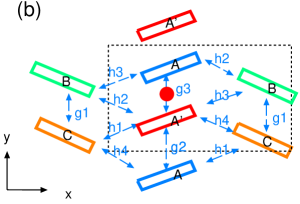
From Ref. \citena12, the transfer energies (Model A) for a tight-binding model with a square lattice are obtained as =0.0015, = 0.1420, = 0.0450, = -0.2767, = -0.2847, = 0.0092, and = 0.0057, in the unit of eV [Fig. 2(b)]. The Hamiltonian is expressed as
| (1) |
where denotes a creation operator of an electron of molecule [A(1), A’(2), B(3), and C(4)] in the unit cell at the th lattice site. The transfer energies, are given by . By using the Fourier transform , Eq. (1) is rewritten as
| (2) | |||||
where and the lattice constant is taken as unity. The matrix elements are given by , , , , , , and , , where and , and the choice of the phase is the same as that of Ref. \citena6. The eigenvalue, i.e., the energy [] is calculated by diagonalizing the 4 4 matrix Hamiltonian, where denotes an operator corresponding to .
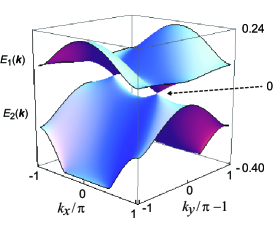
Figure 4 shows and on the plane of the 1st Brillouin zone. There are two Dirac points with , which are given by . Hereafter, we take the chemical potential (= 0.3995 eV in the original Hamiltonian) as the origin of the energy, which coincides with due to the 3/4-filled band. A pair of Dirac points are symmetric with respect to the Y point. The difference between and is smaller than those of the other TRIMs. In fact, their energies of [, ] are obtained as (0.2484, -0.4037), (0.0916, -0.2137), (0.0340, -0.0566), and (0.0663, -0.0468) for , X = , Y= , and M = , respectively. The zero-gap state is obtained because
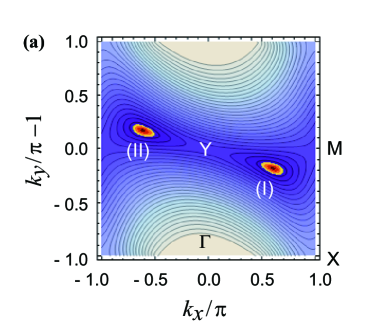
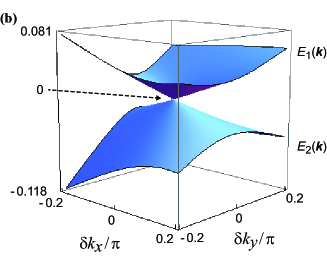
Figure 5(a) shows a contour plot of the energy difference , where the Dirac point manifests itself at the center of the orange (bright) region (). Two Dirac points shown by (I) and (II) are symmetric with respect to the Y point. The orange region is elongated toward the Y-point. The contour for the fixed (small) shows an ellipse, where the ratio of major and minor axes is about 2.4.
Figure 5(b) shows the band energy with Dirac cones around the Dirac point (I), where the linear dispersion is verified. In terms of the velocities and () corresponding to the minor and major axes of the ellipse, respectively, the band energy ( = 1,2) for the conduction and valence bands may be written as
| (3) |
where . The quantity denotes the momentum for the minor (major) axis of Fig. 5(a), where is parallel to the elongated one. The quantities and denote the velocity and momentum for the tilt of the cone, rerspectively, where the tilt occurs almost along the direction and is much smaller than that of -ET2I3. [2] From Fig. 5(a) and the contour of , ( = 1, 2), it is found that the Dirac cone with a linear dispersion may be valid for .
Now, we examine the presence of Dirac points by calculating the parity of the eigenfunction at the TRIMs as shown in Fig. 5(a). The parity is calculated using the inversion matrix, [19] which is a -rotation around the inversion center of the midpoint of A and A’ [closed circle in Fig. 2(b)]. The 4 4 inversion matrix has only the diagonal elements given by and . Using and the transformation of the base [20] [ and ], we obtain = , where denotes the parity eigenvalue, and is the eigenfunction for . This parity for -STF2I3 is summarized in Table 1, which satisfies the condition for the existence of the Dirac points, [21, 19]
| (4) |
Note that Eq. (4) becomes +1 when the insulating state is expected, i.e., the absence of Dirac points after merging by the level crossing between and .
| X | Y | M | ||
|---|---|---|---|---|
| 1 | -1 | -1 | -1 | |
| 1 | 1 | 1 | 1 | |
| -1 | -1 | -1 | -1 | |
| 1 | -1 | 1 | 1 |
We also discuss the relevance of the calculated band structure to the experiment on the conductivity of -STF2I3, which suggests the zero-gap behavior under ambient pressure. The experimental finding of the maximum conductivity in addition to the anisotropy of the cone being larger than that of -ET2I3 [22] is of interest to justify the present Dirac cone. Our calculation shows that [23], whereas the direction of the maximum conductivity is sensitive to the choice of transfer energies, and the comparison with the experiment remains as a future problem.
In addition to Eq. (1), we briefly mention the effect of the local potentials and on the B and C sites, which has been examined for -ET2I3 in Ref. \citenKondo2009_JPSJ. The present calculation for , shows that the zero-gap state exists in region (I) and and that the boundary followed by merging between the zero-gap state and the insulating state is located slightly outside of region (I), whereas the metallic region as found in Ref. \citenKondo2009_JPSJ is absent owing to the lack of overtilted Dirac cones.
In summary, we have reported on the following two subjects. (1) We have evaluated the transfer integrals of -STF2I3 for the tight-binding model based on our proposal of approximation treating the disorder at the STF sites. (2) Analyzing the model in terms of parity at the TRIMs, we found the zero-gap state with Dirac cones. Such Dirac cones obtained from (1) and (2) could be justified by the measurement of anisotropic conductivity, which belongs to the most fundamental and practical experiments.
Acknowledgements.
The authors acknowledge helpful discussion with Naoya Tajima at Toho University.References
- [1] For review: H. Seo, C. Hotta, and H. Fukuyama, Chem. Rev. 104, 5005 (2004).
- [2] K. Kajita, Y. Nishio, N. Tajima, Y. Suzumura, and A. Kobayashi, J. Phys. Soc. Jpn. 83, 072002 (2014).
- [3] S. Katayama, A. Kobayashi, and Y. Suzumura, J. Phys. Soc. Jpn. 75, 054705 (2006).
- [4] R. Kondo, S. Kagoshima, and J. Harada: Rev. Sci. Instrum. 76 (2005) 093902.
- [5] Y. Suzumura and A. Kobayashi, Crystals 2, 266 (2012).
- [6] N. Tajima, Y. Nishio, and K. Kajita, Crystals 2, 643 (2012).
- [7] N. Tajima, Crystals 8, 126 (2018).
- [8] R. Kato, H. Kobayashi, and A. Kobayashi, Synth. Met. 41–43, 2093 (1991).
- [9] T. Naito, A. Miyamoto, H. Kobayashi, R. Kato, and A. Kobayashi, Chem. Lett. 21, 119 (1992).
- [10] T. Naito, Dr. Thesis, Graduate School of Science, The University of Tokyo, Tokyo (1995). http://dl.ndl.go.jp/info:ndljp/pid/3127801.
- [11] M. Inokuchi, H. Tajima, A. Kobayashi, T. Ohta, H. Kuroda, R. Kato, T. Naito, and H. Kobayashi, Bull. Chem. Soc. Jpn. 68, 547 (1995).
- [12] T. Naito, H. Kobayashi, and A. Kobayashi, Bull. Chem. Soc. Jpn. 70, 107 (1997).
- [13] Y. Takano, K. Hiraki, Y. Takada, H. M. Yamamoto, and T. Takahashi, J. Phys. Soc. Jpn. 79, 104704 (2010).
- [14] K. Hiraki, S. Harada, K. Arai, Y. Takano, T. Takahashi, N. Tajima, R. Kato, and T. Naito, J. Phys. Soc. Jpn. 80, 014715 (2011).
- [15] K. Kondo, S. Kagoshima, N. Tajima, and R. Kato, J. Phys. Soc. Jpn. 78, 114714 (2009).
- [16] T. Morinari and Y. Suzumura, J. Phys. Soc. Jpn. 83, 094701 (2014).
- [17] Supplemental materials of the present paper. Tables of atomic coordinates, the parameters used in the calculation of transfer energies, the calculated transfer energies, and the figure of the band structures of -STF2I3 are provided online.
- [18] Y. Suzumura, J. Phys. Soc. Jpn. 85, 053708 (2016).
- [19] F. Piéchon and Y. Suzumura, J. Phys. Soc. Jpn. 82, 03703 (2013).
- [20] F. Piéchon and Y. Suzumura, J. Phys. Soc. Jpn. 82, 123703 (2013).
- [21] L. Fu and C. L. Kane, Phys. Rev. B 76, 045302 (2007).
- [22] N. Tajima, private communication.
- [23] Y. Suzumura, I. Proskurin, and M. Ogata, J. Phys. Soc. Jpn. 83, 023701 (2014).