Evidence for Infalling Gas in a Lyman- Blob
†† {affiliations} Purple Mountain Observatory & Key Laboratory for Radio Astronomy, Chinese Academy of Sciences, 8 Yuanhua Road, Nanjing 210034, China, [email protected] School of Astronomy and Space Science, University of Science and Technology of China, Hefei 230026, Anhui, China National Astronomical Observatory of Japan, 2-21-1 Osawa, Mitaka, Tokyo 181-8588, Japan Department of Physics and Astronomy, University of Utah, Salt Lake City, UT 84112, USA MPIfR, Auf dem Hügel 69, 53121 Bonn, Germany Astron. Dept., King Abdulaziz Univ., P.O. Box 80203, Jeddah 21589, Saudi Arabia Institut d’Astrophysique Spatiale, CNRS UMR 8617, Université Paris-Sud, Université Paris-Saclay 91405 Orsay, France Department of Astrophysical Sciences, Princeton University, Princeton, NJ 08544, USA Institute of Theoretical Astrophysics, University of Oslo, P.O. Box 1029 Blindern, NO-0315 Oslo, Norway Physics Education Centre and Research School of Astronomy and Astrophysics, The Australian National University, Canberra ACT 0200, Australia Centre for Astrophysics Research, School of Physics, Astronomy & Mathematics, University of Hertfordshire, Hatfield, AL10 9AB, UK Institute of Astronomy, The University of Tokyo, 2-21-1 Osawa, Mitaka, Tokyo 181-0015, Japan Sorbonne Université, CNRS, UMR 7095, Institut d’Astrophysique de Paris, 98bis bd Arago, 75014 Paris, France Shanghai Astronomical Observatory, Chinese Academy of Sciences, 80 Nandan Road, Shanghai, 200030, ChinaLyman- blobs (LABs) are spatially extended nebulae of emission in the Ly line of hydrogen, seen at high redshifts1, 2, and most commonly found in the dense environment of star-forming galaxies3, 4. The origin of Ly emission in the LABs is still unclear and under debate5. Proposed powering sources generally fall into two categories: (1) photoionization, galactic super-winds/outflows, resonant scattering of Ly photons from starbursts or active galactic nuclei (AGNs)6, 7, 8, 9, 10 and (2) cooling radiation from cold streams of gas accreting onto galaxies12. Here we analyse the gas kinematics within an LAB providing rare observational evidence for infalling gas. This is consistent with the release of gravitational accretion energy as cold streams radiate Ly photons. It also provides direct evidence for possible cold streams feeding the central galaxies. The infalling gas is not important by mass but hints at more than one mechanism to explain the origin of the extended Ly emission around young galaxies. It is also possible that the infalling gas may represent material falling back to the galaxy from where it originated, forming a galactic fountain.
A recent study shows that nearly 100% of the sky is covered by Ly emission around high redshift galaxies14, 15. Ionizing photons from young stars in star-forming (SF) galaxies and/or unobscured AGNs can ionise neutral hydrogen atoms in the circumgalactic medium and subsequent recombination leads to Ly emission13. Recent studies have revealed sources of radio or submillimeter dust emission within the LABs6, 9, 10, suggesting that these embedded sources are the main engines powering the extended Ly emission via recombination radiation13. Resonant scattering of Ly photons in the circumgalactic medium leads to spatially extended emission7, 6, 16, 17. Besides the photoionisation mechanism, there is also supporting evidence for the cold stream scenario from those LABs lacking any visible power source18, 19. This cold stream mode has been further demonstrated by recent simulations12 — if 10 per cent of the change in the gravitational binding energy of a cold flow goes into heating of the gas, the simulated cold streams become spatially extended Ly sources that are comparable to observed LABs. This model can naturally explain the spatial distribution of the LABs and the diversity of host galaxies in the LABs, as the Ly emission may be decoupled from the associated central sources. The most luminous gravitationally powered blobs would be associated with the most massive halos, which may host a variety of sources like AGNs, Lyman Break Galaxies (LBGs) and Submillimeter Galaxies (SMGs). However, both cold stream12 and SF-based models7 can reproduce the measured luminosity functions of LABs. So far, there is a lack of direct observational evidence for cold stream powered LABs. Here we present observational evidence for the association of Ly emission with gas infalling onto an LAB, suggesting cooling radiation as an alternative mechanism of Ly emission in some cases.
We used the Atacama Large Millimeter/Submillimeter Array (ALMA) to search for CO J = 76 and C I line emission as well as for associated continuum emission toward one LAB, LAB6, in the Francis cluster (J21434423)1, 9, 20. Its Ly emission is distributed over a region of 120 kpc, with a luminosity of 5.2 1043 . The field of view of ALMA at the central observed frequency of 246.6 GHz is about 24′′, or 200 kpc (physical) projected on the sky at z = 2.37. LAB6 is significantly detected in the 1.2 mm dust continuum with ALMA, as shown in Figure 1. The continuum source, LAB6.1, with a flux density of 1.570.11 mJy is located at the center of the LAB, with an apparent size of 0.820.70′′ (6.8 kpc5.8 kpc). It is marginally resolved with a deconvolved size of 0.520.46′′ (4.3 kpc3.8 kpc). To highlight the gas kinematics in the central galaxy, we show the line profiles of CO J = 76 and C I towards LAB6.1 in Figure 2. The CO J = 76 line indicates a redshift of 2.36910.0004. In Figure 1, there is another unresolved continuum source, LAB6.2, detected with a flux density of 1.600.24 mJy. It is offset by 16′′ (130 kpc) from the center, and may be located outside the LAB. Thus, LAB6.2 is unlikely to be physically associated with LAB6, which is also supported by the evidence that no CO J = 76 or C I line emission is detected from LAB6.2.
Our ALMA observations show the distribution and kinematics of gas from the central galaxy. Figure 1 shows that the Ly emission is clearly peaked around the location of the galaxy and is featured with extended morphology in the southeast. Does the central SMG power the physically extended Ly emission? To answer this question, we used X-shooter on Unit Telescope 2 of the Very Large Telescope (VLT) at the European Southern Observatory (ESO) to conduct follow-up spectroscopic observations to measure the line profile of Ly. A slit was placed along LAB6 as shown in the left panel of Figure 1 and the results are presented in the right panel of Figure 1. The Ly line emission is clearly detected around LAB6.1 with its peak approximately 150 km s-1 off the systemic velocity obtained from CO J = 76. Interestingly, different from other LABs, the profile of the observed Ly line appears to be blue-skewed.
Given the resonant nature of the scattering cross-section, high near the line center and low in the line wings, Ly photons usually escape from a static cloud with a double-peaked profile21. With outflowing (inflowing) neutral gas, the Doppler effect would lead to an enhanced red (blue) peak21, 22, 23, 24. In Figure 2, we overlay the line profile of Ly on those of CO J = 76 and C I, showing an offset of 150 km s-1. It is very rare to observe a blue-skewed Ly line profile from ionised gas in comparison with the systemic velocity of molecular or atomic gas in an LAB. Such line profiles can be well reproduced in cold stream models21, 22, 23, 24, while SF-based models with outflows driven by mechanical feedback generally give rise to characteristic red-skewed asymmetric profiles. However, SF-based models with infalling gas may also produce the observed line profile. When a contracting shell model (see details in Methods) is used to fit the observed Ly spectrum and the results are shown in Figure S5, the inferred velocity of about 34 km s-1 of the shell suggests that the infalling gas may become stalled near the galaxy. For the 1.2 mm continuum source detected by ALMA, LAB6.1, the inferred far-infrared (FIR) luminosity is (6.50.13)1012 and its corresponding SFR is approximately 1100 M⊙ yr-1. Such a high degree of SF can easily provide enough ionizing ultraviolet (UV) photons to produce extended Ly emission if they escape. Therefore, the observed Ly emission with blue-skewed line profile can correspond to that either from the cooling radiation or from a central photoionising source but scattered by the infalling gas. In both scenarios, infalling gas is needed to produce the observed line profiles presented in this paper. As a whole, our observational result represents direct kinematic evidence that gas is falling into the central region where the SMG is located, but it does not necessarily imply cooling radiation as the powering mechanism of the LAB. We note that the gas infall rate is approximately 1.7 M⊙ yr-1 (see details in Methods), which is negligible in comparison to the consumed material of approximately 1100 M⊙ yr-1 by star formation. The spatial offset (5.4 kpc) between the Ly peak and the dust continuum peak of LAB6 may be a result of anisotropic gas and dust distribution and may be orientation dependent, as seen in simulations 8.
Recently proposed SF-based models7 predict that LABs at high redshift may correspond to protoclusters containing the most massive galaxies and cluster halos in the early universe as well as ubiquitous strong infrared sources undergoing extreme starbursts. These models also predict that the Ly emission from photons that escape from a galaxy is expected to be significantly polarised. This has been confirmed for the first time for one LAB in the SSA22 field25 and the detection of polarised radiation is inconsistent with in situ production of Ly photons, suggesting that it must have been produced in the galaxies hosted within the nebula, and re-scattered by neutral hydrogen. Of course, the galaxies already formed in the LABs will likely contribute to the extended Ly emission with photoionization by young stars and/or AGNs. Stacking of faint LAEs in the SSA 22 field4 shows extended and faint Ly emission surrounding the bright sources at the center, implying possible connection of the extended Ly emission with the central powering source.
For the scenario of cold streams, the radiatively cooled gas can continuously fall onto the center of the LAB to form a new galaxy or to feed the existing central galaxy. The gas inflow rate may be high enough to feed the central starburst and significantly grow the galaxy, as shown in simulations26, 27, 28. This is in apparent contrast with our inferred low accretion rate from the contracting shell model. Note that the mophology and the three-dimensional distribution of cold streams27, 28 are far from a spherical shell structure. While the shell model result supports the cold stream scenario, details need to be scrutinized and realistic models are necessary. It is likely that the cold accretion streams are connected to large-scale filaments. Observational evidence includes the kinematics of gas distribution of cosmic web near a quasar29 and a 12 Mpc (comoving) filamentary structure traced by LABs in an overdense region30. Given such a picture, LABs could be a type of objects that host a diverse sample of galaxies, or in the extreme case are devoid of galaxies. In the latter case, LABs are part of the cosmic web in which galaxies have not yet formed or still at their early stage. Our recent deep observations10 revealed that the central heating sources are still missing among about two third of LABs in the SSA 22 field. It may be caused by the poor sensitivities of these observations or the fact that the extended Ly emission is dominated by cooling radiation in some LABs.
For the origins of the infalling gas, besides the long-sought-after cold accretion streams, it is possible that the gas was ejected earlier as part of the galactic wind from the central region and is falling back (the so-called galactic fountain). Comparing to the cold accretion streams, gas in the latter case is expected to have larger covering factor. If cold streams or infalling of recycled gas are ubiqutious, blue-skewed Ly line profiles should not be so rare. However, the gas distribution can become more complex with feedbacks from central sources and the effect on Ly emission can depend on viewing directions31, which may help explain the rarity of the blue-skewed prolies in the observed Ly spectra. To constrain the origin of the infalling gas, it would be useful to study LABs without strong feedbacks from central sources with the help of deep ALMA observations. Observations that provide constraints on the properties of the gas (e.g. metallicity and column density) and Ly radiative transfer modeling with realistic gas distribution from galaxy formation simulations can further disentangle different scenarios of its origin, improving our understanding of galaxy formation in the early Universe.
References
- 1 Francis, P. J., Woodgate, B. E., Warren, S. J., et al. A Group of Galaxies at Redshift 2.38. The Astrophysical Journal, 457, 490 (1996)
- 2 Steidel, C. C., Adelberger, K. L., Shapley, A. E., et al. LyLy Imaging of a Proto-Cluster Region at ¡z¿=3.09. The Astrophysical Journal, 532, 170 (2000)
- 3 Matsuda, Y., Yamada, T., Hayashino, T., et al. A Subaru Search for LyLy Blobs in and around the Protocluster Region At Redshift z = 3.1. The Astronomical Journal, 128, 569 (2004)
- 4 Matsuda, Y., Yamada, T., Hayashino, T., et al. Diffuse Ly haloes around Ly emitters at z=3: do dark matter distributions determine the Ly spatial extents?. Monthly Notices of the Royal Astronomical Society, 425, 878 (2012)
- 5 Yajima, H., Li, Y., & Zhu, Q. Extended Ly Emission from Interacting Galaxies at High Redshifts. The Astrophysical Journal, 773, 151 (2013)
- 6 Colbert, J. W., Teplitz, H., Francis, P., et al. Ultraviolet-bright, High-Redshift Ultraluminous Infrared Galaxies. The Astrophysical Journal, 637, L89 (2006)
- 7 Cen, R., & Zheng, Z. The Nature of Ly Blobs: Powered by Extreme Starbursts. The Astrophysical Journal, 775, 112 (2013)
- 8 Geach, J. E., Narayanan, D., Matsuda, Y., et al. ALMA Observations of Ly Blob 1: Halo Substructure Illuminated from Within. The Astrophysical Journal, 832, 37 (2016)
- 9 Ao, Y., Matsuda, Y., Beelen, A., et al. What powers Ly blobs?. Astronomy and Astrophysics, 581, A132 (2015)
- 10 Ao, Y., Matsuda, Y., Henkel, C., et al. Deep submillimeter and radio observations in the SSA22 field. I. Powering sources and Ly escape fraction of Ly blobs. ArXiv e-prints, arXiv:1704.05101 (2017)
- 11 Haiman, Z., Spaans, M., & Quataert, E. Ly Cooling Radiation from High-Redshift Halos. The Astrophysical Journal, 537, L5 (2000)
- 12 Dijkstra, M., & Loeb, A. Ly blobs as an observational signature of cold accretion streams into galaxies. Monthly Notices of the Royal Astronomical Society, 400, 1109 (2009)
- 13 Cantalupo, S. Gas Accretion and Giant Ly Nebulae. Gas Accretion onto Galaxies, 430, 195 (2017)
- 14 Wisotzki, L., Bacon, R., Brinchmann, J., et al. Nearly all the sky is covered by Lyman- emission around high-redshift galaxies. Nature, 562, 229 (2018)
- 15 Laursen, P., Sommer-Larsen, J., Milvang-Jensen, B., Fynbo, J. P. U., & Razoumov, A. O. Ly-emitting galaxies in the epoch of reionization. Astronomy and Astrophysics,627,A84 (2019)
- 16 Geach, J. E., Alexander, D. M., Lehmer, B. D., et al. The Chandra Deep Protocluster Survey: Ly Blobs are Powered by Heating, Not Cooling. The Astrophysical Journal, 700, 1 (2009)
- 17 Zheng, Z., Cen, R., Weinberg, D., Trac, H., & Miralda-Escudé, J. Extended Ly Emission around Star-forming Galaxies. The Astrophysical Journal, 739, 62 (2011)
- 18 Nilsson, K. K., Fynbo, J. P. U., Moller, P., Sommer-Larsen, J., & Ledoux, C. A Ly blob in the GOODS South field: evidence for cold accretion onto a dark matter halo. Astronomy and Astrophysics, 452, L23 (2006)
- 19 Smith, D. J. B., & Jarvis, M. J. Evidence for cold accretion onto a massive galaxy at high redshift?. Monthly Notices of the Royal Astronomical Society, 378, L49 (2007)
- 20 Palunas, P., Teplitz, H. I., Francis, P. J., Williger, G. M., & Woodgate, B. E. The Distribution of Ly-Emitting Galaxies at z=2.38. The Astrophysical Journal, 602, 545 (2004)
- 21 Zheng, Z., & Miralda-Escudé, J. Monte Carlo Simulation of Ly Scattering and Application to Damped Ly Systems. The Astrophysical Journal, 578, 33 (2002)
- 22 Dijkstra, M., Haiman, Z., & Spaans, M. LyLy Radiation from Collapsing Protogalaxies. II. Observational Evidence for Gas Infall. The Astrophysical Journal, 649, 37 (2006)
- 23 Verhamme, A., Schaerer, D., & Maselli, A. 3D Ly radiation transfer. I. Understanding Ly line profile morphologies. Astronomy and Astrophysics, 460, 397 (2006)
- 24 Faucher-Giguère, C.-A., Keres̀, D., Dijkstra, M., Hernquist, L., & Zaldarriaga, M. Ly Cooling Emission from Galaxy Formation. The Astrophysical Journal, 725, 633 (2010)
- 25 Hayes, M., Scarlata, C., & Siana, B. Central powering of the largest Ly nebula is revealed by polarized radiation. Nature, 476, 304 (2011)
- 26 Cen, R. Evolution of Cold Streams and the Emergence of the Hubble Sequence. The Astrophysical Journal, 789, L21 (2014)
- 27 Dekel, A., Birnboim, Y., Engel, G., et al. Cold streams in early massive hot haloes as the main mode of galaxy formation. Nature, 457, 451 (2009)
- 28 Agertz, O., Teyssier, R., & Moore, B. The formation of disc galaxies in a CDM universe. Monthly Notices of the Royal Astronomical Society, 410, 1391 (2011)
- 29 Martin, D. C., Matuszewski, M., Morrissey, P., et al. A giant protogalactic disk linked to the cosmic web. Nature, 524, 192 (2015)
- 30 Erb, D. K., Bogosavljević, M., & Steidel, C. C. Filamentary Large-scale Structure Traced by Six Ly Blobs at z = 2.3. The Astrophysical Journal, 740, L31 (2011)
- 31 Zheng, Z., & Wallace, J. Anisotropic Lyman-alpha Emission. The Astrophysical Journal, 794, 116 (2014)
Acknowledgements Y.A. acknowledges financial support by NSFC grant 11373007. J.E.G. is supported by a Royal Society University Research Fellowship. This paper makes use of the following ALMA data: ADS/JAO.ALMA#2015.1.00952.S. ALMA is a partnership of ESO (representing its member states), NSF (USA) and NINS (Japan), together with NRC (Canada), NSC and ASIAA (Taiwan), and KASI (Republic of Korea), in cooperation with the Republic of Chile. The Joint ALMA Observatory is operated by ESO, AUI/NRAO and NAOJ. Based on observations collected at the European Organisation for Astronomical Research in the Southern Hemisphere under ESO programme IDs 297.A-5059(A) and 082.A-0846(B). This research has made use of the SVO Filter Profile Service (http://svo2.cab.inta-csic.es/theory/fps/) supported from the Spanish MINECO through grant AyA2014-55216.
Author Contributions Y.A. is the Principal Investigator of the ALMA and VLT/X-shooter observing proposals. Y.A. reduced the data and wrote the initial manuscript. Z.Z. conducted the data analysis with the SED modeling, drafted the interpretation and discussion of the Ly emission, and polished the manuscript, and S.N. performed the Ly spectrum fitting with an infalling shell model. C.H. helped to polish the manuscript. All authors discussed and commented on the manuscript.
Competing Interests The authors declare no competing interests
Additional information
Extended
data is available in the online version of the paper.
Correspondence and requests for materials should be addressed to Y.A. ([email protected]).
Methods
ALMA observations We observed LAB6 in the protocluster J2143-44239. The observations were carried out on 2016 May 7th with 36 12 meter antennas and baselines between 16.5 and 629 m. The total on-source observing time was 25 minutes. We used the correlators in the Frequency Division Mode (FDM) at the central frequency of 238.76 GHz in the lower sideband and in the Time Division Mode (TDM) at the central frequency of 254.51 GHz in the upper sideband. The data were reduced with the Common Astronomy Software Application (CASA) package in a standard manner. Originally, Pallas was adopted for the flux calibrator. The Pallas-based flux calibration resulted in a flux density of 1.17 Jy at 253.5 GHz for the bandpass calibrator J2056-4714. This is 1.28 times the flux density based on the ALMA calibrator catalog, estimated by interpolation between data entries in band 3 (97.5 GHz) and 7 (343.5 GHz). In the ALMA calibrator catalog, there is no signature of high variability for J2056-4714 around the observing date. The flux discrepancy may be attributed to the Pallas-based flux calibration. Therefore, the flux density of the phase/gain calibrator J2139-4235 has been re-scaled using the flux of the bandpass calibrator interpolated with the measurements in the ALMA catalog. The primary beam size is about 24′′ at the central frequency of 246.6 GHz. The achieved synthesised beamsize (full-width at half maximum, FWHM) is 0.640.51′′ with a position angle of 9 degrees east of north. The continuum maps have an rms noise level of 40 Jy/beam. The flux densities of the detected sources were measured with the CASA task IMFIT.
Two lines are detected towards LAB6.1 (see Figure 2). Accounting for the known offset between the frequencies of the CO J = 76 and C I lines, one can estimate an accurate redshift of 2.37960.0004 for LAB6.1. This is within the uncertainties consistent with the redshift of the Ly emission of LAB6. Figure S1 shows a 1.2 mm continuum map, integrated intensity maps of CO J = 76 and C I as well as the velocity field traced by CO J = 76 towards LAB6.1. In Figure S1(d), the projected velocity varies by about across (). It can be a hint of rotation of the molecular gas in the central galaxy. The other possibility is gas inflow or outflow. We note that the gradient of the velocity field approximately coincides with the direction towards the diffuse Ly emission to the southeast (Fig. 1).
VLT/X-shooter observations We obtained a UV to NIR spectrum (project ID: 095.A-0764) at the Very Large Telescope (VLT) with the VLT/X-shooter instrument2 from Oct. 20 to 26, 2016. The X-shooter instrument consists of three spectroscopic arms: UVB, VIS and NIR, ranging from 293.6 nm to 2480 nm. The observations were taken with 1.6′′11′′, 1.5′′11′′, and 1.2′′11′′ slits for the three arms, respectively. The total on-source integration time is 86 minutes. The data reduction has been performed using the reflex X-shooter pipeline 2.9.13.
Note that only the UVB arm covering the Ly spectroscopic data is presented in this paper. To improve the signal to noise ratio of the spectrum, four contiguous pixels (41.6′′) were smoothed along the slit. To check the Ly line emission in the southeast part (see the left panel of Figure 1 for this extended emission), we present a typical spectrum from this region in Figure S2, where the line emission is not detected. Apparently this region is too faint for our X-shooter observations. For the spectrum at the Ly peak, the blue peak is obvious and the signal-to-noise ratios (SNRs) at 7 channels are over 4. For the red peak, there are 9 continuous channels with SNRs around 2, and the SNR will become 6 by smoothing all channels. The Ly luminosity around LAB6.1 recovered by X-shooter is 5.01042 , which is about 10% of the total luminosity in the whole LAB20. In combination with the data at other bands in the next section, the Ly escape fraction is estimated to be only 5%.
Except for the Ly emission, there is no significant intestellar absorption lines are detected among the three arms.
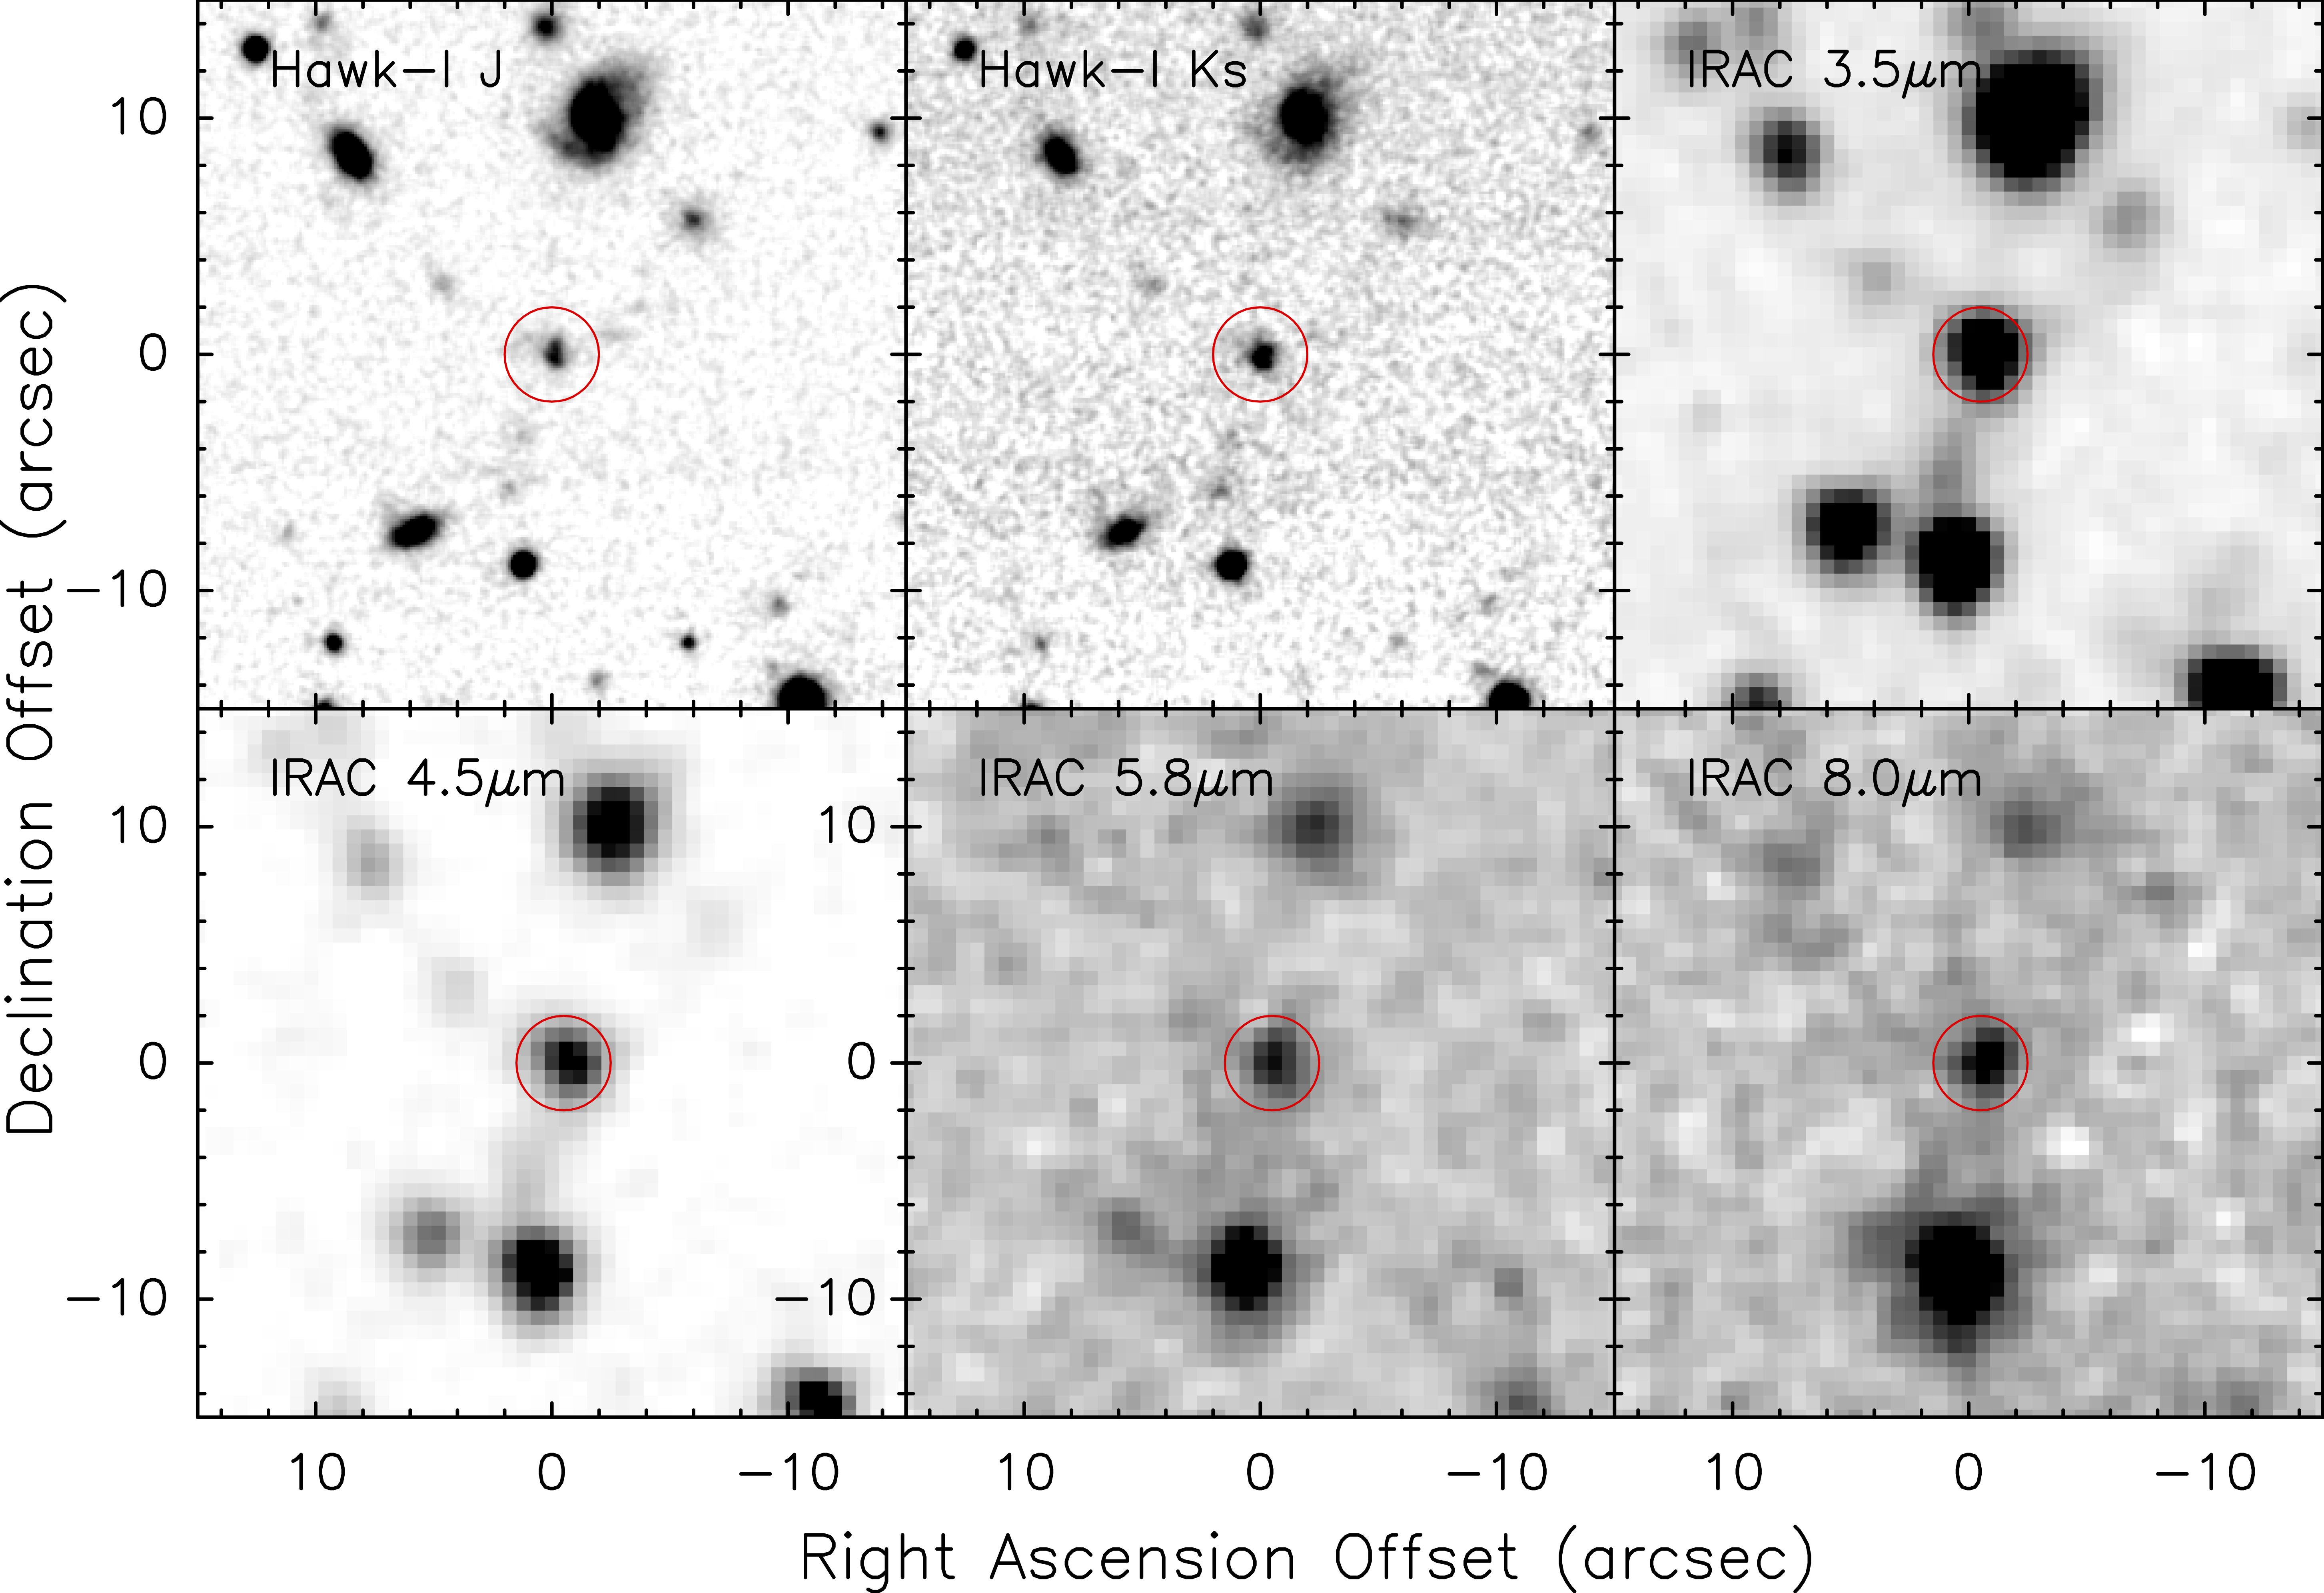
Near- to mid-infrared data and constraints on the central source To constrain the physical properties of the central galaxies in the LABs of the Francis cluster J2143-4423, Herschel PACS and SPIRE data have been used for data analysis9. However, the coarse angular resolution may induce large uncertainties as shown in Figure 1 where two sources with a separation of only 16′′ are revealed by ALMA. Higher angular resolution is therefore required to constrain the central sources.
Near-infrared data were taken with the High Acuity Wide field K-band Imager (HAWK-I) on VLT during October and November 2008. Broadband filters, J band at 1.258 m and Ks band at 2.146 m, were used for the observations. Mid-infrared data were obtained using the Spitzer Infrared Array Camera (IRAC) at 3.6, 4.5, 5.8 and 8.0 m4. The details of the data reductions can be found in the literature4. Data are listed in Table S1 and images are presented in Figure S3.
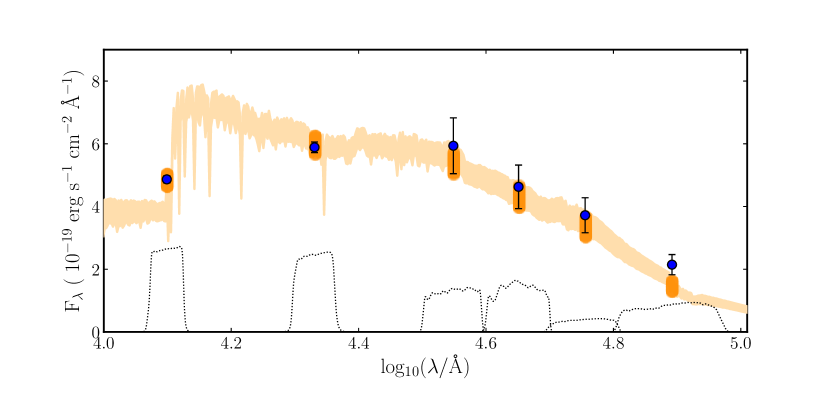
Using Bayesian Analysis of Galaxies for Physical Inference and Parameter EStimation (Bagpipes)5, 6, 7, we constrain the physical properties of the host galaxy from SED modeling with near- to mid-infrared data. If the redshift is left as a free parameter, the photometric redshift derived from Bagpipes is 2.53, consistent with that determined from the submm lines. To constrain the physical properties, we fixed the redshift to 2.3691 and found that the SED can be well described by a recent burst with an SFR of 1.18 M⊙ yr-1, a stellar age of 62 Myr and a logarithmic stellar mass log(Mstellar/M⊙) = 11.00, as shown in Figure S4.
| Bands | HAWK-I J | HAWK-I K | IRAC1 | IRAC2 | IRAC3 | IRAC4 |
|---|---|---|---|---|---|---|
| (m) | 1.258 | 2.146 | 3.6 | 4.5 | 5.8 | 8.0 |
| flux (Jy)a | 2.560.06 | 9.010.26 | 24.790.17 | 30.9530.26 | 40.290.95 | 43.531.60 |
-
a For the SED modelling, a 15% error bar is adopted for each IRAC band to account for the calibration uncertainty.
Molecular gas mass, dust mass and star formation rate Here we derive the physical properties of LAB6.1 using CO J = 76 and dust emission. For LAB6.1, the measured flux density at 1.2mm is 1.570.11 mJy, which is significantly lower than the predicted value of 2.43 mJy by the SED model of LAB69. This latter higher value may be due to the contribution from other spatial components. As shown in Figure 1, there is a continuum source located 16′′ from LAB6.1. In the Herschel SPIRE bands used for the SED model9, this source is blended with LAB6.1, which may explain the overprediction of the 1.2mm flux density from the previous SED model. Assuming that the total observed FIR luminosity9 originates from both sources and the fractional contribution from LAB6.1 follows that of the 1.2 mm continuum, we derived the FIR luminosity of LAB6.1 to be 6.50.131012 , which translates to an SFR of 960 M⊙ yr-1 based on the SFR-LFIR relation8.
With ALMA, the measured CO J = 76 integrated flux density is 1.140.12 Jy km s-1 and the corresponding line luminosity is 1.100.12108 or 6.500.71109 K km s-1 pc2. Following the SFR calibration using the CO J = 76 line luminosity9, the derived SFR is 1240 M⊙ yr-1. From the mean value of the SFRs from the above two methods, the derived SFR of LAB6.1 is approximately 1100 M⊙ yr-1, which is consistent with the value derived with the near- and mid-infrared SED fitting.
Assuming a line ratio of 0.24 for /10, 11 and the standard factor CO = 0.8 M⊙ for ultra-luminous infrared galaxies12, we find a molecular gas mass of (2.21.1)1010 M⊙. The dust mass from the SED model9 is (2.10.5)108 M⊙ after rescaling the result according to the continuum flux density measured by ALMA. This implies a gas to dust mass ratio of 10560.
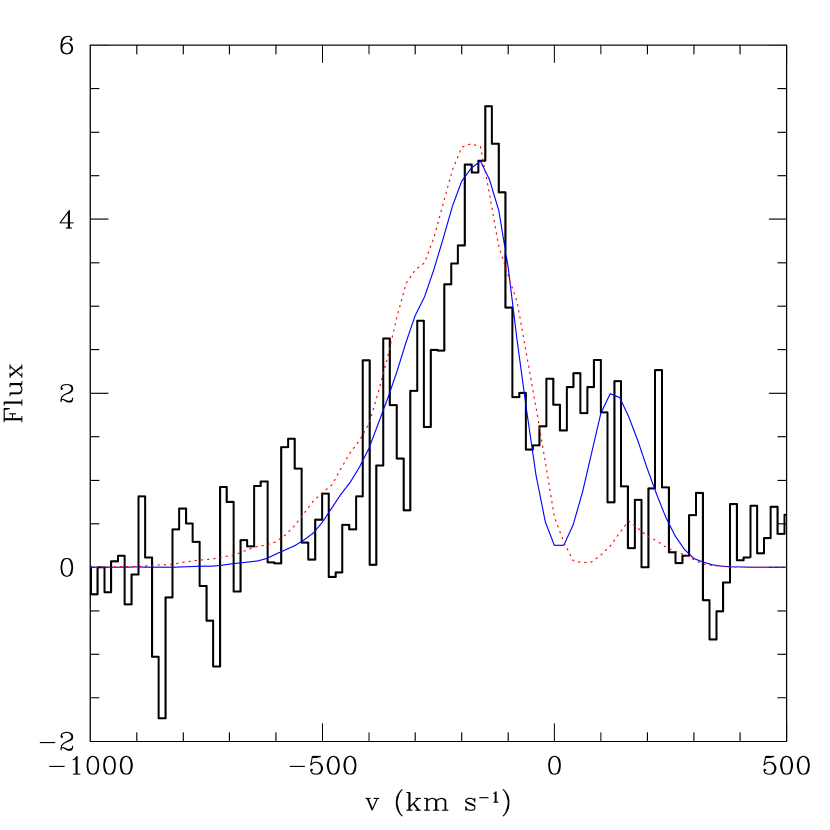
Shell model fit to the Ly spectrum The Ly line emergent from Ly emitting galaxies and LABs is usually characterised by a profile skewed toward the red side of the systemic velocity13, which can be understood as Ly emission escaping from outflowing gas after experiencing resonant scatterings off neutral hydrogen atoms. The resonant scattering cross-section is high near the line center and low at wings, and Ly emission from a static cloud (e.g. with no inflow or outflow) would have frequencies shifted away from the line center to escape, leading to a double-peaked line profile21. For an expanding cloud (with outflowing gas), the Doppler effect makes Ly photons back scattered from the far side of the cloud easier to escape from the near side. This results in a red-skewed Ly line profile21, 23, producing a Ly line with an enhanced red peak and a suppressed blue peak. However, the Ly spectrum of LAB6.1 shows a blue-skewed line profile, with an enhanced blue peak and a suppressed red peak. Such spectral features indicate gas infall.
For LAB6.1, there is a slight offset between the peak of the Ly emission and the central galaxy associated with the 1.2mm dust continuum (see Fig. 1), which is about 0.64′′ (5.4kpc). This raises the question about the nature of the gas probed by the Ly emission. If we take the velocity () near the trough between the red and blue peaks in the Ly spectrum as an indication of the bulk velocity of the gas (with respect to the continuum source), the gas can be either on the near side outflowing from the galaxy or on the far side inflowing toward the galaxy. However, the blue-skewed Ly spectrum suggests that the gas itself is collapsing. Furthermore, the Ly spectrum centered on the galaxy has a similar shape to that near the peak emission. The shape of the spectrum at the peak Ly emission and that at the position of the central galaxy provide strong support that the gas is falling into the central galaxy. The small spatial offset of the Ly emission from the galaxy may be caused by the non-uniform distribution of the gas, e.g. accretion along filaments, or by a significant absorption near the continuum source, leaving the dominant contribution to the surviving Ly emission biased toward the low-density accretion flows.
As an attempt to model the Ly spectrum, we adopt a simple model that infalling gas is uniformly located in a thin shell of neutral gas and that the Ly radiation from the central source is scattered by the hyrogen atoms in the shell. This is the reverse version of the expanding shell model23 commonly used to model the Ly spectra from star-forming galaxies. We characterise the model with three parameters, the infalling velocity of the shell and the temperature and column density of the neutral hydrogen in the shell. A Markov Chain Monte Carlo calculation is performed to constrain the parameters, based on interpolating a compilation of Ly spectra14 from the shell model. We find that the best fit (model 1) has , , and , with for 74 degrees of freedom. The value is acceptable for 74 degrees of freedom (which has 1 range of values of 7412), and it does not imply over-fitting. The other acceptable but much less favored solution (model 2) with has , , and . The two model fit spectra are shown in Figure S5. While the first model clearly works better, it misses the Ly flux near in the red peak, which implies that a uniform shell model is over-simplified. The presence of Ly flux between two peaks suggests possible contribution to the Ly emission of extended origin (i.e. cooling, photoionization, etc). The crude picture from the model is that the infalling gas (with velocity of ) has a temperature of K and neutral hydrogen column density of (in the regime of the Lyman-limit system). Given the spatial extent of the major Ly emission in the 2D spectrum, which is about 1′′ in radius (8 kpc on a physical scale) and the offset from the central galaxy ( 5.4 kpc), the gas can be regarded as part of the circumgalactic medium.
There could be two possible origins of the infalling gas. First, it may come from the long-sought-after cold streams. The infalling gas may be getting stalled near the central galaxy (hence the low velocity). The other scenario may be that the gas was ejected earlier as part of the galactic wind from the central region and is falling back (the so-called galactic fountain). If we take as the radius of the shell, the total amount of hydrogen mass is then . The dynamical time scale is for . The gas inflow rate is then about . This suggests that while the infalling gas is important in shaping the Ly emission, it is not the main component responsible for the growth of the central galaxy. The shell model is overly simplified, and the gas distribution can be more complex. For example, the inferred SFR in the power source should produce powerful outflows, which in turn alter the gas kinematics even in the CGM. The photoionisation of the CGM gas by ionising photons from the central source can also change the distribution of the neutral gas as well as produce Ly emission. The above modelling result should be taken as a rough estimate. Ly radiative transfer calculation with galaxies and gas distribution in hydrodynamic galaxy formation simulations would lead to better insights into systems like LAB6.1.
In a previous work, one LAB system, CDFS-LAB1013, was found to have a Ly component that is blueshifted (about ) with respect to a reference galaxy. However, this Ly component itself is not associated with any galaxy, and is about 2′′ (16.4 kpc) away from the reference galaxy. Compared to LAB6.1, this component in CDFS-LAB10 is much farther away from the galaxy, both in projected distance (16.4 kpc versus 5.4 kpc) and in velocity ( versus ). In addition, the Ly spectrum of the component in CDFS-LAB10 appears to be double peaked with roughly symmetric red and blue peaks, indicating that the gas itself is not contracting or expanding. This is in direct contrast to the blue-skewed Ly profile of LAB6.1. Therefore, given the large spatial and velocity separation of the Ly component in CDFS-LAB10 from the reference galaxy and the roughly symmetric double peaks, its relation to the galaxy is not clear, with infalling, outflowing, or photoionised gas at large distances all remaining as possibilities. Ly emission with prominent blue peaks is also detected in two LABs 15, and both show multiple emission components in the images. Also in both LABs, the Ly line profiles are double-peaked, more symmetric that that of LAB6.1, making it hard to establish a clear association with inflowing gas. If we extend the case to Ly emitting galaxies (rather than LABs), it is found that in a sample of 237 MUSE Ly spectra about 5% are well-fitted through a inflowing shell 16, suggesting the existence of infalling gas in a small fraction of systems.
Compared to previous detections of Ly spectra with blue peaks, the LAB6.1 case has more blue-skewed Ly line profile. It also has molecular/atomic gas and dust detections. The peculiar Ly line profile and the rich data make this object worth further investigations. For LAB6.1, the close association of the Ly emission in position with the central galaxy probed by the 1.2mm continuum (see Fig. 1) and the more extended morphology suggest that gas probed by the Ly emission surrounds the galaxy. The blue-skewed Ly line can be produced by gas infall. The reasonably good fit to the line profile with a contracting shell model lends further support to such a scenario. In summary, the Ly observation in combination with the ALMA obervation of LAB6.1 provides the first clear case of blue-skewed Ly line in an LAB system, which indicates gas infall.
References
- 1
- 2 Vernet, J., Dekker, H., D’Odorico, S., et al. X-shooter, the new wide band intermediate resolution spectrograph at the ESO Very Large Telescope. Astronomy and Astrophysics, 536, A105 (2011)
- 3 Freudling, W., Romaniello, M., Bramich, D. M., et al. Automated data reduction workflows for astronomy. The ESO Reflex environment. Astronomy and Astrophysics,559,A96 (2013)
- 4 Colbert, J. W., Scarlata, C., Teplitz, H., et al. Polycyclic Aromatic Hydrocarbon Emission within Ly Blobs. The Astrophysical Journal, 728, 59 (2011)
- 5 Carnall, A. C., McLure, R. J., Dunlop, J. S., & Davé, R. Inferring the star formation histories of massive quiescent galaxies with BAGPIPES: evidence for multiple quenching mechanisms. Monthly Notices of the Royal Astronomical Society, 480, 4379 (2018)
- 6 Rodrigo, C., Solano, E. Bayo, A., The SVO Filter Profile Service, http://ivoa.net/documents/Notes/SVOFPS/index.html
- 7 Rodrigo, C., Solano, E. The Filter Profile Service Access Protocol. http://ivoa.net/documents/Notes/SVOFPSDAL/index.html
- 8 Kennicutt, R. C., & Evans, N. J. Star Formation in the Milky Way and Nearby Galaxies. Annual Review of Astronomy and Astrophysics, 50, 531 (2012)
- 9 Lu, N., Zhao, Y., Xu, C. K., et al. Measuring Star Formation Rate and Far-infrared Color in High-redshift Galaxies Using the CO(7-6) and [N II] 205m Lines. The Astrophysical Journal, 802, L11 (2015)
- 10 Carilli, C. L., & Walter, F. Cool Gas in High-Redshift Galaxies. Annual Review of Astronomy and Astrophysics, 51, 105 (2013)
- 11 Yang, C., Omont, A., Beelen, A., et al. Molecular gas in the Herschel-selected strongly lensed submillimeter galaxies at z 2-4 as probed by multi-J CO lines. Astronomy and Astrophysics, 608, A144 (2017)
- 12 Downes, D., & Solomon, P. M. Rotating Nuclear Rings and Extreme Starbursts in Ultraluminous Galaxies. The Astrophysical Journal, 507, 615 (1998)
- 13 Yang, Y., Zabludoff, A., Jahnke, K., & Davé, R. The Properties of Ly Nebulae: Gas Kinematics from Nonresonant Lines. The Astrophysical Journal, 793, 114 (2014)
- 14 Gronke, M., Bull, P., & Dijkstra, M. A Systematic Study of Ly Transfer through Outflowing Shells: Model Parameter Estimation. The Astrophysical Journal, 812, 123 (2015)
- 15 Vanzella, E., Balestra, I., Gronke, M., et al. Illuminating gas inflows/outflows in the MUSE deepest fields: Ly nebulae around forming galaxies at z 3.3. Monthly Notices of the Royal Astronomical Society, 465, 3803 (2017)
- 16 Gronke, M. Modeling 237 Ly spectra of the MUSE-Wide survey. Astronomy and Astrophysics, 608, A139 (2017)