Evaluation Metrics for Symbolic Knowledge Extracted from Machine Learning Black Boxes: A Discussion Paper
Abstract.
As opaque decision systems are being increasingly adopted in almost any application field, issues about their lack of transparency and human readability are a concrete concern for end-users. Amongst existing proposals to associate human-interpretable knowledge with accurate predictions provided by opaque models, there are rule extraction techniques, capable of extracting symbolic knowledge out of an opaque model. However, how to assess the level of readability of the extracted knowledge quantitatively is still an open issue. Finding such a metric would be the key, for instance, to enable automatic comparison between a set of different knowledge representations, paving the way for the development of parameter autotuning algorithms for knowledge extractors. In this paper we discuss the need for such a metric as well as the criticalities of readability assessment and evaluation, taking into account the most common knowledge representations while highlighting the most puzzling issues.
1. Introduction
Artificial Intelligence (AI) for finance is a reality including, but not limited to, consumer credit, credit risk, and anti-money laundering applications (Aziz and Dowling, 2019). Usually, to obtain high predictive capabilities, machine learning techniques exploited for predictions rely on sub-symbolic techniques, that offer advantages related to performances but also come along with some drawbacks (Rocha et al., 2012). The main drawback lies in the opacity of these models, which are obscure in the decisions they make and lack human interpretability. For such a reason models of this kind are also called black boxes (BB).
When dealing with critical applications – such as the finance ones – lack of human awareness is even more unacceptable and makes BB models impracticable. Finance is a domain where trustworthiness must be ensured (Ng et al., 2015). Unique ethical, legal, and regulatory challenges arise as decisions can immediately impact people’s lives (Weiss, 2021). However, it is still unclear how to implement and test trustworthy AI systems in practice. Following the definition of the High-Level Expert Group on AI (European Commission et al., 2019), trustworthy AI should satisfy three main pillars: comply with all applicable laws and regulations (lawfulness), adhere to ethical principles and values (ethicality), and be safe, secure and reliable (robustness). However, how to translate these principles into practice is still an open question (Mittelstadt, 2019). A possible step towards trustworthy AI is to develop explainable AI (XAI), as explainability is one of the 7 more specific requirements that refine the main pillars (European Commission et al., 2019). XAI aims to create insight into how and why AI models produce predictions while maintaining high predictive performance levels.
Different strategies are present in the literature to tackle XAI via explainable models (Guidotti et al., 2018): (i) human-interpretable models, such as shallow decision trees (Rudin, 2019); or (ii) symbolic knowledge-extraction (SKE) techniques to the BB (Kenny et al., 2021). While i) is not always applicable, ii) is gaining a momentum. The amount of SKE algorithms available in the literature is constantly increasing, also thanks to the software support provided by object-oriented frameworks for machine learning as well as to the development of dedicated frameworks (e.g., PSyKE (Sabbatini et al., 2021b, 2022b, 2022a)). Amongst the application areas of SKE there are financial (Baesens et al., 2001, 2003; Steiner et al., 2006) and medical fields (Bologna and Pellegrini, 1997; Franco et al., 2007; Hayashi et al., 2000) and others (Setiono et al., 2011; Sabbatini and Grimani, 2022; Azcarraga et al., 2012; Hofmann et al., 2003). Examples of extractors generally achieving good results are Cart (Breiman et al., 1984), Trepan (Craven and Shavlik, 1996), GridEx (Sabbatini et al., 2021a) and GridREx (Sabbatini and Calegari, 2022). Of course a number of alternatives are present in the literature (Craven and Shavlik, 1994; Huysmans et al., 2006; Barakat and Diederich, 2008; Martens et al., 2007), depending on the task at hand.
A common trait of every SKE extractor is the output, which has to be some sort of human-interpretable knowledge. The knowledge usually follows a list or tree representation, where each item (leaf) of the list (tree) corresponds to a specific rule having predictive power. However, how to select the best SKE extractor for the case at hand – possibly as an automatic task – is still an open issue and the level of human readability of the extracted knowledge should be evaluated via a fair metric (Sovrano et al., 2022; De Mulder and Valcke, 2021). The level of human-readability of the extracted knowledge is bounded to the number of rules it contains and, recursively, to the readability of each rule, in turn. Indeed, rules may follow several formats with different levels of conciseness even when having the same semantics. For this reason, the quantitative assessment of knowledge readability – through an unbiased score and relative metric – is a quite challenging task. The lacking of such a metric prevents the design and implementation of procedures to automatically tune extractor parameters since an unbiased comparison of extractors’ outputs is not possible. Accordingly, in this paper we provide a detailed discussion about the readability assessment, highlighting the most challenging issues. The discussion is clustered based on the knowledge representation of the extraction algorithm.
2. Evaluating Extracted Knowledge
Following research discussions on the topic (Garcez et al., 2001; Tran and Garcez, 2013), the most common indicators to evaluate the knowledge extracted via SKE techniques are: (i) the predictive performance of the knowledge rules w.r.t. the data or the BB predictions (the latter is called fidelity); (ii) the readability level from a human perspective; and (iii) the input space coverage (completeness). Having good scores according to these 3 dimensions ensures that the extracted knowledge represents well the underlying domain, that it is interpretable for humans, and that it may be used as a surrogate model to draw predictions.
It is quite easy to evaluate the knowledge predictive performance with the same scoring function adopted to evaluate the underlying BB. Adequate scoring metrics are, for instance, the accuracy and F1 scores for classification tasks and the mean absolute/squared error and R2 score for regression tasks. This indicator is pretty relevant since it represents the best way to assess if the knowledge is suitable to draw predictions in lieu of the BB.
The input space coverage can also be measured trivially, e.g., by observing how many data set instances are covered by the extracted rules, or by performing some kind of equal-spaced or random sampling inside the input space and then checking how many data points are covered. The latter solution is more demanding for high-dimensional data sets and may have little significance in the case of sparse data sets (characterised by empty regions). This indicator is also important because extremely human readable knowledge (e.g., composed of a single, simple rule) having excellent predictive performance (e.g., 100% accuracy) is useless if it covers an infinitesimally small region of the input feature space.
Human-readability assessment and evaluation could turn out not to be so trivial. First of all, we have to distinguish between two different levels of readability, both related to the presentation of the extracted knowledge to users. On the one hand, we can consider the macrolevel of readability of the knowledge as a whole, related to the knowledge shape and dimension – e.g., if it is represented as a tree, a list, a table, etc. – and to the number of leaves, rules, rows/columns present (aka complexity). On the other hand, we can focus on the microlevel of readability, to recursively take into account the same indicators – shape and complexity – for each element in the knowledge. As an example of the microlevel we can consider for instance the kind of preconditions of each element (e.g., oblique rules, M-of-N tree nodes) and how many variables, constants, and predicates appear inside them. As can be noticed, this is far from being a trivial task, since equivalent concepts may be represented according to different notations, each one having its conciseness and expressiveness. In the following, both macrolevel and microlevel are examined in detail, showing that the most challenging issues are related to the latter.
2.1. Macrolevel: knowledge as a whole
As widely acknowledged (e.g., (Guidotti et al., 2018)), the most common knowledge representations, when such a knowledge has to be presented to human users, are decision lists (Freitas, 2014; Huysmans et al., 2011), trees (Quinlan, 1993; Breiman et al., 1984) and tables (Sethi et al., 2012). The reason behind their massive exploitation is related to their high level of understandability for humans.
2.1.1. Knowledge shapes
Decision lists
Knowledge having this shape is represented as a list of rules, where each rule has a precondition and a postcondition. Preconditions usually are conjunctions – or less frequently disjunctions – of constraints on the input variables. Postconditions, on the other hand, are the associated outputs. Thus, a rule provides output predictions for all and only those input instances satisfying the rule precondition. The complexity of the list may be easily assessed through the number of contained rules.
Lists may be exhaustive if it is always possible to draw predictions for input instances (i.e., at least one rule can be applied to each input instance), or not. This characteristic does not affect the knowledge readability, but only the input space coverage.
Furthermore, rules may overlap – if more than one rule may be applied simultaneously to a single input instance – or not—if at most one rule can be used. This feature may affect the overall readability, however, in practice, it can be neglected since knowledge extracted via SKE techniques usually relies on non-overlapping rules, or the overlapping rules have some degree of confidence thanks to which it is possible to select a single rule for each input sample.
Rule lists may be hierarchical if some rules have as a postcondition a sublist of rules. They can be trivially converted into a non-hierarchical list, so there is no need to consider this specific scenario.
Finally, rule lists may be ordered – when rule number is evaluated only if preconditions of rules are not satisfied – or unordered—if, otherwise, any rule can be chosen without taking into account the preceding in the list. Human readability is strongly impacted by the list ordering since human users must be conscious that a rule can be selected only if all the preceding have been already tested. In other words, the -th rule implicitly carries along information about the preconditions of other distinct rules, i.e., implicit information that is inherently coded within the ordering. To give an example, the fourth rule in an unordered set may be something like “output is if ”, and humans can read and apply the rule as is. We remark that and are the precondition and postcondition, respectively, associated with the -th rule of the list. The same rule in an ordered set should be considered by humans as “output is if ”, where is true if is not satisfied and the comma operator represents logical conjunction. Of course, the readability of ordered sets is hindered by this consideration, especially for a large amount of rules.
Decision trees
Knowledge adhering to this representation differs from rule lists since in this case rules are represented as complete paths from the tree root to the leaves. Each distinct path from the root to a different leaf is a rule, so the complexity of the knowledge is equal to the number of leaves (that in turn is equal to the number of rules). Decision trees are usually binary trees storing a constraint on one or more input variables in each internal node and a decision in each leaf. As a consequence, the precondition of a rule is given by the logical conjunction of the constraints corresponding to the internal nodes. Conversely, the postcondition is associated with the leaf.
Decision trees are always exhaustive by design since it is always possible to draw predictions for the given instances. The provided rules are also non-overlapping, because only one leaf may be reached when examining an input sample.
We believe that the best option to analyse decision tree human readability is to convert the tree into a (possibly ordered) rule list, and then stick to the same scoring metrics adopted for lists.
Decision tables
Knowledge following this representation is provided in tabular form. Usually, each column (or row) represents a variable and each row (or column) is associated with a rule. In the following, we associate columns with variables and rows with rules. The cell obtained by intersecting column with row represents the constraint on input variable in the -th rule. If variable is the output variable, then the cell contains the output decision of the rule. Usually, the output column is the last.
By assuming this notation, it is straightforward to obtain rules having as precondition the conjunction of all the constraints on the same row and as postcondition the contents of the last row cell. It is as well trivial to obtain the complexity of the table in terms of number of rows (equal to the rule amount).
To enable a fair comparison between decision tables and other kinds of knowledge shapes, the former may be easily converted into (generally unordered) rule lists.
2.1.2. Macrolevel observations
Section 2.1 may be summarised in a few considerations: decision lists, trees, and tables are easily comparable in terms of human readability, since even if they provide knowledge according to different formats, it is always possible to obtain an equivalent unordered list without predictive losses. The equivalent list will have different individual rules – e.g., more complex than those in the original knowledge – but the knowledge macrolevel complexity will not be affected—e.g., the rule amount has to remain the same. In this way, it is possible to perform a fair comparison amongst different knowledge shapes by only focusing on the macrolevel complexity and further considerations about the microlevel. During a macrolevel readability assessment, knowledge having smaller complexity (i.e., fewer rules) should be preferred over other solutions.
2.2. Microlevel: individual rules
When extracting knowledge, SKE techniques output rules adhering to different representations for both preconditions and postconditions. Amongst the most widespread kinds of rule preconditions we can find propositional, M-of-N (Towell and Shavlik, 1991; Murphy and Pazzani, 1991), fuzzy (Horikawa et al., 1992; Berenji, 1991) and oblique (Setiono, 2000; Setiono and Liu, 1997) literals. In any case, preconditions are expressed as a conjunction, or disjunction, of literals having one of these different formats. On the other hand, postconditions are constant values or functions of the input variables.
2.2.1. Rule preconditions
Propositional rules
The most adopted rule format is the propositional one, where literals are simple predicates expressing equalities (in positive or negative form) or inequalities between the value of an input feature and one or more constants. The basic notations for equalities and inequalities are , ; , where are input features and are constant values. Basic literals may be extended to interval and set inclusion/exclusion, to group together disjunctions or conjunctions of a set of literals.
This first step to achieve better conciseness comes along with a major readability issue. Indeed, a knowledge may contain two rules having the same output and only one precondition each, composed of a basic literal involving the same variable but compared to different constants, for instance “output is if ” and “output is if ”. Rules of this kind may be collapsed into a single rule: “output is if or ”. But this is not the only solution, since the rule “output is if ” is also equivalent.
Starting from a trivial example it is easy to notice that even one categorical feature assuming at least 2 distinct values leads to 3 different knowledge representations, all equivalent. The readability of an output knowledge should be proportional to the effort required by a human user to understand and apply its rules. In this case, the first knowledge has 2 rules, 2 variable occurrences and as many predicates and constants. The second has 1 rule and the same values for other indicators. The third knowledge has 1 rule, 1 variable occurrence, 1 predicate, and 2 constant values. Obviously, it is preferable to have 1 rule, and this is decided via macrolevel considerations. Amongst the second and third knowledge rules, there is not a substantial readability difference, since both of them imply the human user to evaluate the variable and compare it with two constant values. As a result, we obtain that a raw counting of variable occurrences, predicates, and constants is not suitable to express microlevel readability, even though they are perfect indicators for rule conciseness (in this case the fewer, the better). Furthermore, one may observe that the more a rule adopts concise literals, the more it is difficult to understand the rule and to associate a readability score to it, as shown in the following.
M-of-N rules
Literals may be expressed as groups, where the group is satisfied if at least one of the possible constraints is satisfied, as shown in the previous paragraph. This definition may be further relaxed, and a group of literals can be considered as satisfied if at least constraints are satisfied (). M-of-N rules are exactly defined in this manner. They enable a much higher degree of conciseness, however, our opinion is that human users encounter more difficulties in understanding the rule. As an example, one may think about a 4-of-9 rule.
Large values also obfuscate the real impact of individual variables on the final prediction. Furthermore, it is quite challenging mapping M-of-N rules to readability scores, since their readability decreases w.r.t. both and . For instance, 1-of-5 rules are more easily understandable than 3-of-5 or 1-of-10 rules. But analogous claims about 5-of-9 vs. 4-of-10 rules cannot be easily stated.
Fuzzy rules
If sets and intervals in preconditions are substituted with string labels and these labels correspond to the belonging to a defined set/interval within a certain confidence degree, rules are called fuzzy. For instance, “” could be equivalent to “ is ”, by assuming the variable ranging in the [0, 1] interval. The conciseness of this notation allows literals to have more flexible intervals (e.g., also [0.45, 0.65] could be considered as , with a different degree of confidence). Outputs associated with fuzzy rules also have a confidence degree, depending on the one of corresponding preconditions. As a consequence, human users reading a fuzzy rule need to (i) be aware of the underlying fuzzy labelling semantics; (ii) assign a degree of confidence to each literal in the rule precondition; (iii) read the postcondition and calculate the corresponding confidence. We believe that it would be far less readable than a direct, simple basic notation. Since it is not possible to numerically assess the introduced human-interpretability hindrance, it is also hard to assign a readability score to fuzzy rules.
Oblique rules
When dealing with numerical attributes, rule literals may be expressed as inequalities involving a linear combination of the input variables and a constant threshold. On the input feature space, these rules represent oblique hyperplanes.
Knowledge conciseness benefits from the application of oblique rules since composite features are enabled, however, in our opinion, human readability pays a high price. One may think about the description of a concrete object to be classified. Such an object may be represented through weight, volume, and position. Classification involving input features separately is easy for humans. The same is not true if human users have to consider, for instance, a linear combination of weight and position. For this reason, the same final considerations about the fuzzy rule readability hindrance also hold for oblique rules.
2.2.2. Rule postconditions
Constant values
The most simple and human-readable postcondition is represented by a constant value, suitable for both classification and regression tasks, since it may be a string label as well as a numerical value. However, constant values are not always the best solutions when dealing with regression data sets, especially if the output feature is strongly correlated to the input variables. The reason is that constant values introduce an undesired discretisation that usually leads to the creation of many rules with poor predictive performance.
Non-constant postconditions
Also for postconditions, as for preconditions, there is the possibility to choose more expressive representations, at the expense of human readability. Indeed, constant predictions can be substituted with linear combinations or other kinds of functions involving (a subset of) the input features. In this case, human readability is hindered by the length of the representation (e.g., a linear combination of 2 variables is more immediate than a combination of 5 variables) and its type (e.g., a linear combination is more comprehensible than a polynomial function). The means to associate these representations with readability scores is still an open issue.
2.2.3. Microlevel observations
While the macrolevel knowledge complexity is quite easy to be assessed, the same does not hold at the microlevel, because of the variety of adopted rule notations. Different SKE algorithms adopt different notations and each one comes with its proper conciseness and human-interpretability degree. Unfortunately, it is not possible to convert the various formats into a canonical, comparable notation and for this reason, the problem of assigning a readability score to individual rules is a major open issue in the assessment of the extracted knowledge quality.
2.3. User interaction
Since a quantitative assessment of the microlevel readability cannot be straightforwardly defined, a preliminary readability score formulation could take into account user feedback. User interactions may drive such a score according to a custom desideratum or a set of desiderata. For instance, propositional and M-of-N rules may be preferred over fuzzy and oblique rules, and at the same time propositional rules may be preferred over the M-of-N notation. This solution may be achieved by assigning an ad hoc weight to each rule category.
The user interaction is also important when balancing different indicators concurring within the same scoring metric. As an example, we can consider a scoring function for the knowledge provided by SKE techniques involving the 3 indicators described in Section 2 (predictive performance, readability, and completeness). We recall that knowledge has good quality if it has high predictive performance, high readability, and high completeness.
An effective score may be formulated by multiplying 3 distinct, numerical metrics, one per indicator. As a result, when performing a comparison, the knowledge having the highest score is the one having the best quality. However, in this scenario, it is important to correctly weight the different indicators, and in particular to refine the fidelity/readability trade-off (i.e., how to penalise fidelity losses w.r.t. readability losses) based on the task at hand and according to the user experience. This may be achieved by introducing a human parametrisation acting on the individual indicators, that will be finally merged into a single multiplicative scoring function. It is relevant noticing that the completeness is not task-dependent, since it may be represented as a percentage. Conversely, the other indicators may be subject to a large variability, depending on the task at hand.


// // //
3. The Istanbul Stock Exchange Data Set Example
| Predictor | Extractor | ||||||
| Type | MAE | R2 | Type | Parameters | Rules | MAE data (BB) | R2 data (BB) |
| LR | 0.01 | 0.47 | Cart | Max leaves = 6 | 6 | 0.01 (0.00) | 0.42 (0.78) |
| Max depth = Unbounded | |||||||
| Cart | Max leaves = 10 | 10 | 0.01 (0.00) | 0.43 (0.85) | |||
| Max depth = Unbounded | |||||||
| CReEPy | Max depth = 6 | 7 | 0.01 (0.01) | 0.10 (0.16) | |||
| Threshold = 0.001 | |||||||
| Output = constant | |||||||
| CReEPy | Max depth = 6 | 2 | 0.01 (0.00) | 0.44 (0.93) | |||
| Threshold = 0.001 | |||||||
| Output = linear combination | |||||||
| GridEx | Max depth = 2 | 7 | 0.01 (0.01) | 0.30 (0.61) | |||
| Threshold = 0.01 | |||||||
| Splits = 3 if feature importance ¿ 0.8 else 1 | |||||||
| GridREx | Max depth = 2 | 1 | 0.01 (0.00) | 0.44 (1.00) | |||
| Threshold = 0.01 | |||||||
| Splits = 2 | |||||||
| RF | 0.01 | 0.42 | Cart | Max leaves = 6 | 6 | 0.01 (0.00) | 0.38 (0.90) |
| Max depth = Unbounded | |||||||
| Cart | Max leaves = 10 | 8 | 0.01 (0.00) | 0.41 (0.90) | |||
| Max depth = Unbounded | |||||||
| CReEPy | Max depth = 6 | 7 | 0.01 (0.01) | 0.03 (0.06) | |||
| Threshold = 0.001 | |||||||
| Output = constant | |||||||
| CReEPy | Max depth = 6 | 7 | 0.01 (0.01) | 0.40 (0.90) | |||
| Threshold = 0.001 | |||||||
| Output = linear combination | |||||||
| GridEx | Max depth = 2 | 10 | 0.01 (0.01) | 0.28 (0.62) | |||
| Threshold = 0.01 | |||||||
| Splits = 3 if feature importance ¿ 0.8 else 1 | |||||||
| GridREx | Max depth = 2 | 1 | 0.01 (0.00) | 0.41 (0.95) | |||
| Threshold = 0.1 | |||||||
| Splits = 2 | |||||||
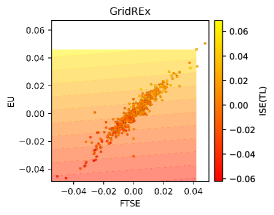
To show in practice the differences amongst the output of different knowledge extractors, we applied the Cart, CReEPy, GridEx and GridREx extractors to the Istanbul Stock Exchange data set111https://archive.ics.uci.edu/ml/datasets/ISTANBUL+STOCK+EXCHANGE [Online; last accessed August 24, 2022], reported in Figure 1a. The data set is composed of 8 continuous features (7 as input + 1 as output). We considered all of them during the training phase of black boxes and extractors, however, for the sake of readability, we reported in Figures 1 and 2 only the most relevant two—i.e., the MSCI European index (EU) and the stock market return index of UK (FTSE).
The selected extractors have been applied to a linear regressor (LR) and a random forest (RF) BB. Mean absolute error (MAE) and R2 score of the BB predictions are reported in Table 1. Corresponding decision boundaries are visually represented in Figures 1b and 1c. Predictions obtained through the extracted knowledge have been evaluated with the same scores adopted for the underlying BB outputs and are also reported in Table 1. The corresponding decision boundaries are shown in Figures 2a to 2l.
Considerations about the macrolevel knowledge readability can be drawn by analysing the plots in Figure 2. First of all, it is noticeable that Cart, GridEx and CReEPy with constant outputs introduce an undesired discretisation in the output predictions, thus implying a worsening in the overall predictive performance. Conversely, GridREx and CReEPy with linear outputs can provide linear combinations of the input variables as output predictions, resulting in knowledge having fewer rules with smaller predictive errors.
Observing the same plots it is noticeable that CReEPy outputs a hierarchical knowledge, thus mappable in an ordered list of rules. The same holds for Cart’s knowledge – if simplified – since it is based on a decision tree. Differently, GridEx and GridREx provide rules associated with hypercubic and non-overlapping regions, so they are not ordered and each one contains the same amount of variable occurrences, predicates (i.e., interval inclusion), and constant values (i.e., 2 per variable).
Macrolevel readability comparisons can be easily performed by observing the ‘Rules’ column in Table 1. GridREx is the best choice since it outputs a single rule, followed by the CReEPy. Their superiority is confirmed also from the predictive performance standpoint, since they have the highest R2 score. GridREx doesn’t meet the completeness requirement, i.e., results are non-exhaustive in the input space coverage since a portion is considered negligible due to the absence of training instances (so there are test instances that cannot be predicted). This should penalise the final metric score.
To perform microlevel comparisons it is necessary to observe the output knowledge rules provided by the various extractors. We exemplify the difference between constant and linear outputs by considering the knowledge extracted via Cart and CReEPy from the linear regressor. Cart trained with a maximum of 6 leaves provides the following rules:
Cart rules may be simplified in the following without modifying their semantics:
Rules extracted with CReEPy (linear output) for the Istanbul Stock Exchange data set are the following:
On one hand, the two versions of the Cart’s knowledge are equivalent in terms of predictive accuracy and input space coverage, i.e., they provide the same predictions.
However, the first has redundant literals, whereas the second has implicit constraints.
This means that, when measuring the knowledge microlevel readability, the first should be penalised for the presence of literals in single clauses that are trivially true.
For instance, the conjunction EU > -0.00, EU > 0.01, EM =< 0.01 hinders readability if compared to the equivalent EU > 0.01, EM =< 0.01.
Vice versa, the simplified version of the same rule represented as EM =< 0.01 implies implicitly acknowledging as false the constraint EU =< 0.01, requiring humans to check all the previous rules.
An ideal microlevel readability metric should be able to assign a good score to EU > 0.01, EM =< 0.01 as well as penalise the redundant and implicit alternatives.
On the other hand, by comparing Cart’s and CReEPy’s extracted knowledge it is clear that they exhibit (i) exactly the same input space coverage; (ii) similar predictive performance (CReEPy is slightly better in the fidelity w.r.t. the BB predictions); (iii) different macrolevel readability, since CReEPy extracts only 2 rules instead of 6, as Cart; (iv) different microlevel readability, since CReEPy’s predictions may be constants as well as linear combinations of up to 7 variables. An ideal microlevel readability metric should be able to assign a score taking into account these differences. The lack of a quantitative metric to evaluate the microlevel readability – and thus the overall knowledge readability and, in turn, quality – makes it impracticable to automatically decide whether longer rule lists with simple outputs are preferable or not over shorter lists with more complex outputs.
4. Conclusions & discussion
In this paper we discuss the major issues in defining possible metrics to evaluate in a quantitative way the quality of the symbolic knowledge extracted via SKE techniques out of a BB model as well as the need to define such metrics. We show that quality evaluation should consider different indicators, namely: i) predictive performance, ii) input space coverage and iii) knowledge readability. While for the first two the definition of a metric and the comparison of a score is quite trivial, this does not happen for the last one. As for the latter, readability can be observed at a macrolevel – as the shape and complexity of the knowledge as a whole – and at a microlevel—as shape and complexity of each knowledge rule. We showed that at a macrolevel the knowledge may be easily compared since it is quite easy to convert one format into another. Conversely, we pointed out the most tricky characteristics of microlevel considerations, to favour further studies and discussion on the topic.
Future works will be devoted to the definition of such a suitable metric to assess the quality of knowledge extracted via SKE in a fair, quantitative, and measurable way. In particular, we plan to formulate a sound scoring function for microlevel comparisons and to study how the user interaction may help the customisation and integration of the 3 aforementioned indicators in a unique and effective metric assessing the knowledge quality.
Moreover, adherence to the trustworthy AI requirements should be enlarged to evaluate also other requirements and, in particular, our findings might be subject to change due to the institutional debate about the AI Act Proposal. Further research is needed to consolidate the interpretation of the Act in light of its future changes and to define metrics that can be used in the course of the standardisation process while being respectful of the AI Act and its Annexes.
Another open question left to further research is to take into account that the definition of explainability metrics may lead to consider concurring features that are compliant with the legislative goals of the AI Act and, eventually, the thresholds that meet the Act’s requirements and expectations. Each feature needs to be balanced via parameters that can be set taking into consideration both the scenario at hand and its regulation. This is the first step for converging to trustworthy automated machine learning techniques that we believe to be promising in the near future.
Acknowledgements.
This work has been partially supported by the EU ICT-48 2020 project TAILOR (No. 952215) and by the European Union’s Horizon 2020 research and innovation programme under G.A. no. 101017142 (StairwAI project).References
- (1)
- Azcarraga et al. (2012) Arnulfo Azcarraga, Michael David Liu, and Rudy Setiono. 2012. Keyword extraction using backpropagation neural networks and rule extraction. In The 2012 International Joint Conference on Neural Networks (IJCNN 2012). IEEE, Brisbane, Australia, 1–7. https://doi.org/10.1109/IJCNN.2012.6252618
- Aziz and Dowling (2019) Saqib Aziz and Michael Dowling. 2019. Machine learning and AI for risk management. Palgrave Pivot, Cham, FinTech and Strategy in the 21st Century, 33–50.
- Baesens et al. (2001) Bart Baesens, Rudy Setiono, V. De Lille, Stijn Viaene, and Jan Vanthienen. 2001. Building Credit-Risk Evaluation Expert Systems Using Neural Network Rule Extraction and Decision Tables. In ICIS 2001 Proceedings, Veda C. Storey, Sumit Sarkar, and Janice I. DeGross (Eds.). Association for Information Systems, New Orleans, Louisiana, USA, 159–168. http://aisel.aisnet.org/icis2001/20
- Baesens et al. (2003) Bart Baesens, Rudy Setiono, Christophe Mues, and Jan Vanthienen. 2003. Using Neural Network Rule Extraction and Decision Tables for Credit-Risk Evaluation. Management Science 49, 3 (2003), 312–329. https://doi.org/10.1287/mnsc.49.3.312.12739
- Barakat and Diederich (2008) Nahla Barakat and Joachim Diederich. 2008. Eclectic Rule-Extraction from Support Vector Machines. International Journal of Computer and Information Engineering 2, 5 (2008), 1672–1675. https://doi.org/10.5281/zenodo.1055511
- Berenji (1991) Hamid R. Berenji. 1991. Refinement of Approximate Reasoning-based Controllers by Reinforcement Learning. In Proceedings of the Eighth International Workshop (ML91), Northwestern University, Evanston, Illinois, USA, Lawrence Birnbaum and Gregg Collins (Eds.). Morgan Kaufmann, 475–479. https://doi.org/10.1016/b978-1-55860-200-7.50097-0
- Bologna and Pellegrini (1997) Guido Bologna and Christian Pellegrini. 1997. Three medical examples in neural network rule extraction. Physica Medica 13 (1997), 183–187. https://archive-ouverte.unige.ch/unige:121360
- Breiman et al. (1984) Leo Breiman, Jerome Friedman, Charles J. Stone, and Richard A. Olshen. 1984. Classification and Regression Trees. CRC Press.
- Craven and Shavlik (1994) Mark W. Craven and Jude W. Shavlik. 1994. Using Sampling and Queries to Extract Rules from Trained Neural Networks. In Machine Learning Proceedings 1994. Elsevier, 37–45. https://doi.org/10.1016/B978-1-55860-335-6.50013-1
- Craven and Shavlik (1996) Mark W. Craven and Jude W. Shavlik. 1996. Extracting Tree-Structured Representations of Trained Networks. In Advances in Neural Information Processing Systems 8. Proceedings of the 1995 Conference, David S. Touretzky, Michael C. Mozer, and Michael E. Hasselmo (Eds.). The MIT Press, 24–30. http://papers.nips.cc/paper/1152-extracting-tree-structured-representations-of-trained-networks.pdf
- De Mulder and Valcke (2021) Wim De Mulder and Peggy Valcke. 2021. The need for a numeric measure of explainability. In 2021 IEEE International Conference on Big Data (Big Data). 2712–2720. https://doi.org/10.1109/BigData52589.2021.9671745
- European Commission et al. (2019) European Commission, Content Directorate-General for Communications Networks, and Technology. 2019. Ethics guidelines for trustworthy AI. Publications Office. https://doi.org/10.2759/346720
- Franco et al. (2007) Leonardo Franco, José Luis Subirats, Ignacio Molina, Emilio Alba, and José M. Jerez. 2007. Early Breast Cancer Prognosis Prediction and Rule Extraction Using a New Constructive Neural Network Algorithm. In Computational and Ambient Intelligence (IWANN 2007) (LNCS, Vol. 4507). Springer, 1004–1011. https://doi.org/10.1007/978-3-540-73007-1_121
- Freitas (2014) Alex A. Freitas. 2014. Comprehensible classification models: a position paper. ACM SIGKDD Explorations Newsletter 15, 1 (June 2014), 1–10. https://doi.org/10.1145/2594473.2594475
- Garcez et al. (2001) AS d’Avila Garcez, Krysia Broda, and Dov M Gabbay. 2001. Symbolic knowledge extraction from trained neural networks: A sound approach. Artificial Intelligence 125, 1-2 (2001), 155–207.
- Guidotti et al. (2018) Riccardo Guidotti, Anna Monreale, Salvatore Ruggieri, Franco Turini, Fosca Giannotti, and Dino Pedreschi. 2018. A Survey of Methods for Explaining Black Box Models. Comput. Surveys 51, 5 (2018), 1–42. https://doi.org/10.1145/3236009
- Hayashi et al. (2000) Yoichi Hayashi, Rudy Setiono, and Katsumi Yoshida. 2000. A comparison between two neural network rule extraction techniques for the diagnosis of hepatobiliary disorders. Artificial intelligence in Medicine 20, 3 (2000), 205–216. https://doi.org/10.1016/s0933-3657(00)00064-6
- Hofmann et al. (2003) Alexander Hofmann, Carsten Schmitz, and Bernhard Sick. 2003. Rule extraction from neural networks for intrusion detection in computer networks. In 2003 IEEE International Conference on Systems, Man and Cybernetics, Vol. 2. IEEE, 1259–1265. https://doi.org/10.1109/ICSMC.2003.1244584
- Horikawa et al. (1992) Shin-ichi Horikawa, Takeshi Furuhashi, and Yoshiki Uchikawa. 1992. On fuzzy modeling using fuzzy neural networks with the back-propagation algorithm. IEEE Trans. Neural Networks 3, 5 (1992), 801–806. https://doi.org/10.1109/72.159069
- Huysmans et al. (2006) Johan Huysmans, Bart Baesens, and Jan Vanthienen. 2006. ITER: An Algorithm for Predictive Regression Rule Extraction. In Data Warehousing and Knowledge Discovery (DaWaK 2006). Springer, 270–279. https://doi.org/10.1007/11823728_26
- Huysmans et al. (2011) Johan Huysmans, Karel Dejaeger, Christophe Mues, Jan Vanthienen, and Bart Baesens. 2011. An empirical evaluation of the comprehensibility of decision table, tree and rule based predictive models. Decision Support Systems 51, 1 (2011), 141–154. https://doi.org/10.1016/j.dss.2010.12.003
- Kenny et al. (2021) Eoin M. Kenny, Courtney Ford, Molly Quinn, and Mark T. Keane. 2021. Explaining black-box classifiers using post-hoc explanations-by-example: The effect of explanations and error-rates in XAI user studies. Artificial Intelligence 294 (2021), 103459. https://doi.org/10.1016/j.artint.2021.103459
- Martens et al. (2007) David Martens, Bart Baesens, Tony Van Gestel, and Jan Vanthienen. 2007. Comprehensible credit scoring models using rule extraction from support vector machines. European Journal of Operational Research 183, 3 (2007), 1466–1476. https://doi.org/10.1016/j.ejor.2006.04.051
- Mittelstadt (2019) Brent Mittelstadt. 2019. Principles alone cannot guarantee ethical AI. Nature Machine Intelligence 1, 11 (2019), 501–507.
- Murphy and Pazzani (1991) Patrick M. Murphy and Michael J. Pazzani. 1991. ID2-of-3: Constructive induction of M-of-N concepts for discriminators in decision trees. In Machine Learning Proceedings 1991. Elsevier, 183–187.
- Ng et al. (2015) Adam Ng, Mansor H Ibrahim, and Abbas Mirakhor. 2015. Ethical behavior and trustworthiness in the stock market-growth nexus. Research in International Business and Finance 33 (2015), 44–58.
- Quinlan (1993) J. Ross Quinlan. 1993. C4.5: Programming for machine learning. Morgan Kauffmann (1993). https://dl.acm.org/doi/10.5555/152181
- Rocha et al. (2012) Anderson Rocha, Joao Paulo Papa, and Luis A. A. Meira. 2012. How far do we get using machine learning black-boxes? International Journal of Pattern Recognition and Artificial Intelligence 26, 02 (2012), 1261001–(1–23). https://doi.org/10.1142/S0218001412610010
- Rudin (2019) Cynthia Rudin. 2019. Stop explaining black box machine learning models for high stakes decisions and use interpretable models instead. Nature Machine Intelligence 1, 5 (2019), 206–215. https://doi.org/10.1038/s42256-019-0048-x
- Sabbatini and Calegari (2022) Federico Sabbatini and Roberta Calegari. 2022. Symbolic Knowledge Extraction from Opaque Machine Learning Predictors: GridREx & PEDRO. In Proceedings of the 19th International Conference on Principles of Knowledge Representation and Reasoning, KR 2022, Haifa, Israel. July 31 - August 5, 2022, Gabriele Kern-Isberner, Gerhard Lakemeyer, and Thomas Meyer (Eds.). IJCAI Organization, Haifa, Israel, 554–563. https://proceedings.kr.org/2022/57/
- Sabbatini et al. (2021b) Federico Sabbatini, Giovanni Ciatto, Roberta Calegari, and Andrea Omicini. 2021b. On the Design of PSyKE: A Platform for Symbolic Knowledge Extraction. In WOA 2021 – 22nd Workshop “From Objects to Agents” (Bologna, Italy) (CEUR Workshop Proceedings, Vol. 2963), Roberta Calegari, Giovanni Ciatto, Enrico Denti, Andrea Omicini, and Giovanni Sartor (Eds.). Sun SITE Central Europe, RWTH Aachen University, Article 3, 20 pages. 22nd Workshop “From Objects to Agents” (WOA 2021), Bologna, Italy, 1–3 Sept. 2021. Proceedings.
- Sabbatini et al. (2022b) Federico Sabbatini, Giovanni Ciatto, Roberta Calegari, and Andrea Omicini. 2022b. Symbolic Knowledge Extraction from Opaque ML Predictors in PSyKE: Platform Design & Experiments. Intelligenza Artificiale 16, 1 (2022), 27–48. https://doi.org/10.3233/IA-210120
- Sabbatini et al. (2021a) Federico Sabbatini, Giovanni Ciatto, and Andrea Omicini. 2021a. GridEx: An Algorithm for Knowledge Extraction from Black-Box Regressors. In Explainable and Transparent AI and Multi-Agent Systems. Third International Workshop, EXTRAAMAS 2021, Virtual Event, May 3–7, 2021, Revised Selected Papers, Davide Calvaresi, Amro Najjar, Michael Winikoff, and Kary Främling (Eds.). LNCS, Vol. 12688. Springer Nature, Basel, Switzerland, 18–38. https://doi.org/10.1007/978-3-030-82017-6_2
- Sabbatini et al. (2022a) Federico Sabbatini, Giovanni Ciatto, and Andrea Omicini. 2022a. Semantic Web-Based Interoperability for Intelligent Agents with PSyKE. In Proceedings of the 4th International Workshop on EXplainable and TRAnsparent AI and Multi-Agent Systems, Davide Calvaresi, Amro Najjar, Michael Winikoff, and Kary Främling (Eds.). Lecture Notes in Computer Science, Vol. 13283. Springer, Chapter 8, 124–142. https://doi.org/10.1007/978-3-031-15565-9_8
- Sabbatini and Grimani (2022) Federico Sabbatini and Catia Grimani. 2022. Symbolic knowledge extraction from opaque predictors applied to cosmic-ray data gathered with LISA Pathfinder. Aeronautics and Aerospace Open Access Journal 6, 3 (2022), 90–95. https://doi.org/10.15406/aaoaj.2022.06.00145
- Sethi et al. (2012) Kamal Kumar Sethi, Durgesh Kumar Mishra, and Bharat Mishra. 2012. KDRuleEx: A Novel Approach for Enhancing User Comprehensibility Using Rule Extraction. In 2012 Third International Conference on Intelligent Systems Modelling and Simulation. 55–60. https://doi.org/10.1109/ISMS.2012.116
- Setiono (2000) Rudy Setiono. 2000. Extracting M-of-N rules from trained neural networks. IEEE Trans. Neural Networks Learn. Syst. 11, 2 (2000), 512–519. https://doi.org/10.1109/72.839020
- Setiono et al. (2011) Rudy Setiono, Bart Baesens, and Christophe Mues. 2011. Rule extraction from minimal neural networks for credit card screening. International Journal of Neural Systems 21, 04 (2011), 265–276. https://doi.org/10.1142/S0129065711002821
- Setiono and Liu (1997) Rudy Setiono and Huan Liu. 1997. NeuroLinear: From neural networks to oblique decision rules. Neurocomputing 17, 1 (1997), 1–24. https://doi.org/10.1016/S0925-2312(97)00038-6
- Sovrano et al. (2022) Francesco Sovrano, Salvatore Sapienza, Monica Palmirani, and Fabio Vitali. 2022. Metrics, Explainability and the European AI Act Proposal. J 5, 1 (2022), 126–138. https://doi.org/10.3390/j5010010
- Steiner et al. (2006) Maria Teresinha Arns Steiner, Pedro José Steiner Neto, Nei Yoshihiro Soma, Tamio Shimizu, and Júlio Cesar Nievola. 2006. Using neural network rule extraction for credit-risk evaluation. International Journal of Computer Science and Network Security 6, 5A (2006), 6–16. http://paper.ijcsns.org/07_book/200605/200605A02.pdf
- Towell and Shavlik (1991) Geoffrey G. Towell and Jude W. Shavlik. 1991. Interpretation of Artificial Neural Networks: Mapping Knowledge-Based Neural Networks into Rules. In Advances in Neural Information Processing Systems 4, [NIPS Conference, Denver, Colorado, USA, December 2-5, 1991], John E. Moody, Stephen Jose Hanson, and Richard Lippmann (Eds.). Morgan Kaufmann, 977–984. http://papers.nips.cc/paper/546-interpretation-of-artificial-neural-networks-mapping-knowledge-based-neural-networks-into-rules
- Tran and Garcez (2013) Son N Tran and Artur d’Avila Garcez. 2013. Knowledge extraction from deep belief networks for images. In IJCAI-2013 workshop on neural-symbolic learning and reasoning.
- Weiss (2021) Joseph W Weiss. 2021. Business ethics: A stakeholder and issues management approach. Berrett-Koehler Publishers.