Estimation of Scalar Field Distribution in the Fourier Domain
Abstract
In this paper we consider the problem of estimation of scalar field distribution (e.g. pollutant, moisture, temperature) from noisy measurements collected by unmanned autonomous vehicles such as UAVs. The field is modelled as a sum of Fourier components/modes, where the number of modes retained and estimated determines in a natural way the approximation quality. An algorithm for estimating the modes using an online optimization approach is presented, under the assumption that the noisy measurements are quantized. The algorithm can also estimate time-varying fields through the introduction of a forgetting factor. Simulation studies demonstrate the effectiveness of the proposed approach.
I Introduction
Estimation of scalar field distribution from a set of point measurements is an important problem often emerging in domains such as atmospheric monitoring, risk assessment, and hazard mitigation. Examples include concentration of pollutant, carbon dioxide emission, methane sources, radiation, temperature in urban areas, and many others, see [1, 2, 3, 4, 5, 6, 7, 8, 9, 10, 11, 12, 13, 14, 15, 16, 17, 18, 19, 20, 21, 22, 23] and the references therein. This approach is often used for indirect inference of scalar fields (pollutant concentration, pressure, temperature, radiation) in inaccessible locations where the direct measurements are prohibited due to some geometrical or physical constraints (blocking obstacles, high temperature, or exposure to hazards). The methods of source localisation [1, 2, 3, 4, 5, 6, 7, 8, 9, 10, 11, 12, 13, 14] and mapping [15, 16, 17, 18, 19, 20, 21, 22, 23] employing remote (and noisy) measurements have attracted increasing attention in recent years due to tremendous progress in instrumentation for aerial and remote sensing using unmanned autonomous vehicles such as UAVs. This technological advancement necessitates the development and evaluation of some statistical methods and algorithms that can be applied for the timely estimation of the structure (map) of the scalar field in the environment from an ever-increasing set of noisy measurements acquired in a sequential or concurrent manner (e.g., sensing signals from unmanned vehicles operating over the hazardous area, trigger signals from meteorological stations, the intermittent concentration of methane emissions in the atmosphere or ocean floor, oil surface concentration due to androgenic spill, etc). These algorithms may become critical for backtracking and characterization of the main sources of the scalar field in the environment which is important for the remediation effectiveness and retrospective forensic analysis. This was the main motivation for the present study.
In work on estimation of scalar fields, the field is often modelled as a sum of radial basis functions (RBFs) or Gaussian mixture models, see, e.g., [17, 18, 19, 20, 21, 22, 23]. Field estimation then reduces to a problem of estimating the parameters of these models. By contrast, for the current work, we assume the field to be an arbitrary 2D function which can be viewed in the Fourier domain using, e.g., the discrete Fourier transform (DFT) or the discrete cosine transform (DCT) [24]. For some intuition behind this approach, suppose we regard the plot of the field as an image. From image processing, it is well-known that the most important parts of an image are concentrated in the lowest (spatial) frequency components/modes. Our approach to field estimation is then to estimate the low frequency Fourier components.111We will use the terms Fourier component and DCT component interchangeably in this paper. One of the advantages for using this Fourier component approach compared to the RBF approach is that it offers a perhaps more natural way to control the accuracy of the approximation, e.g., by controlling the number of Fourier modes used/retained. Furthermore, if one wants to refine the field estimate by estimating more modes, existing estimates of the lower order modes can be reused.
The main contributions of this paper are:
-
•
Rather than the use of radial basis function field models, we model the 2D scalar field in the Fourier domain as a sum of Fourier components.
-
•
A numerical comparison of the approximation capabilities of the Fourier components and RBF field models is carried out.
-
•
For the quantized measurements model, we present in detail how Fourier component estimation can be carried out using an online optimization approach similar to [22]. We further extend the approach of [22] from binary measurements to multi-level quantized measurements, and from static to time-varying fields.
The organization of the paper is as follows: Section II gives preliminaries on the DCT and motivation for its use in field modelling. Section III presents the system model. Section IV compares our Fourier component field model with the RBF field model in terms of approximation performance. Section V considers in detail the estimation of Fourier components using quantized measurements. Numerical studies are presented in Section VI.
II Preliminaries
Consider a region of interest . Discretize into points and into points as
where
Our aim is the estimation of 2D distribution of a scalar field , , which is assumed either static or slowly varying. We define
as the field value at the discretized position , where can be regarded as a position index. Recall the (Type-II) discrete cosine transform (DCT), see, e.g., [24, 25]:
where
The most important information about the field distribution is concentrated in the low order modes, i.e. the components corresponding to with and small, while higher order modes define the fine structure of the field distribution. See Figs. 1 and 3 for examples of how retaining different numbers of modes affects the quality of the approximation to the true field.
III System Model
III-A Field Model
Motivated by the above discussion, we propose to approximate (2) by
| (3) |
where is the subset of low order modes that we wish to retain.222In general, we could in (3) use coefficients which are not necessarily equal to . One reason for taking the coefficients to be equal to is given in Lemma 1.
For example, we could retain the first modes, with , so that
| (4) |
The total number of modes retained is thus equal to .
Another possibility is the following:
| (5) |
which tries to retain the “largest” (in magnitude) modes.333This is of course an approximation, as exactly determining the largest modes depends on and requires knowledge of the very field that we are trying to estimate. The motivation for (5) comes from a result that the DCT coefficients decay as for [26]. Thus the larger components will usually have smaller values of , leading to the choice (5). In numerical simulations, we have found (5) to give better approximations than (4) (for the same number of retained modes ) in many, though not all, cases.
III-B Measurement Model
In this paper we consider the following noisy quantized measurement model for a vehicle at position index :
| (6) |
where is random noise and is a quantizer of levels, say . The quantizer can be expressed in the form
| (7) |
where the quantizer thresholds satisfy . The use of a quantized measurement model is motivated by the fact that many chemical sensors can only provide output from a small number of discrete bars [27, 28].
Remark 1.
The special case of (6) corresponding to a 2-level quantizer, or binary measurements, is considered in [21, 22, 23]. It can be expressed as
| (8) |
where is the quantizer threshold, and is the indicator function that returns 1 if its argument is true and 0 otherwise. Other measurement models which have been considered in the literature include additive noise models [18, 19] and Poisson measurement models [17].
III-C Problem Statement
The problem we wish to consider in this paper is to estimate the coefficients444When we refer to estimation of components/modes in this paper, we specifically mean estimation of the coefficients .
of the field , from quantized measurements collected by an unmanned autonomous vehicle under the measurement model (6). The estimation should be done in an online manner such that the estimates are continually updated as new measurements are collected.
IV Comparison with RBF Field Model
Before we consider the problem of estimating the coefficients (which will be studied in Section V), we will in this section compare the use of our Fourier component model (3) with the radial basis function model considered in [20, 21, 22, 23] (see also [18, 19, 17] for similar models), in terms of how well they can approximate a field for a given number of modes (for the Fourier component model) or basis functions (for the RBF model).
IV-A Fourier Component Field Model
Define the mean squared error (MSE):
| (9) |
where is the (discretized) true field given by (2) and
is the approximation of the true field using a subset of modes and coefficients . The expression for is the same as (3) except that the coefficients may be different from . However, it turns out that setting to be equal to will minimize the MSE.
Lemma 1.
Given a subset of modes , the optimal values of that minimize (9) satisfy
| (10) |
Proof.
See the Appendix. ∎
IV-B RBF Field Model
The following RBF field model is used in [20, 21, 22, 23]:
| (11) |
where and are radial basis functions. In particular, we consider the choice
| (12) |
which results in a Gaussian mixture model [17]. For a given number of basis functions , we assume that the ’s and ’s are chosen,555The case where the ’s and ’s are also estimated has been considered, but was found to suffer from identifiability issues and sometimes give very unreliable results [21]. while the ’s are free parameters. Algorithms for estimating the ’s are studied in, e.g., [20, 21, 22, 23]. Here we consider instead the problem of finding the optimal ’s in order to minimize the mean squared error, to see how good the RBF model can be when approximating a field for a given set of basis functions. Define
| (13) |
where is the true field value at position , is a discretized set of points in the search region , and is the cardinality of .
Lemma 2.
Given a set of radial basis functions and an ordering of the elements in , the optimal values of that minimize (13) satisfy
where , , and
IV-C Numerical Experiments

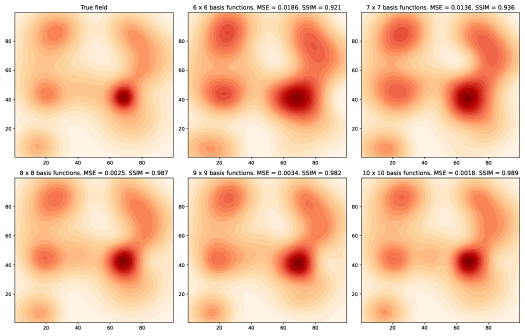


In Figs.1-4 we show two example fields, and the field approximations that are obtained when various different numbers of modes (for Fourier component model) or radial basis functions (for RBF model) are used. The discretization in the true fields is set as (so that there are modes in total). For the RBF model we set , so that the discretized set of points are the same in the MSE calculations. For the Fourier component model, we use the optimal choice of given in Lemma 1 (which corresponds to the model (3)), and we choose as in (5) to retain the “largest” modes. For the RBF model, we use radial basis functions with ’s in (12) placed uniformly on a grid at locations , where
and
The ’s in (12) are chosen to be equal to . The ’s used in (11) are the optimal values computed according to Lemma 2.
In the figures we show two performance measures, 1) the MSE, and 2) the structural similarity (SSIM) index, which originated in [31] and has been widely adopted in the image processing community. The structural similarity index is a measure of the similarity between two images. In our case, we can regard and as the image representations of the true and approximated fields respectively, and compute the SSIM between these two images. The SSIM gives a scalar value between 0 and 1, with if the two images to be compared are identical. We refer to [31, 32] for the specific equations used to compute the SSIM.
We see from Figs.1-4 that as more modes (for Fourier component model) or basis functions (for RBF model) are used, the approximations to the true field improves. When using a smaller number of modes / basis functions the RBF model seems to give better approximations than the Fourier component model, while for larger numbers of modes / basis functions the two approaches perform similarly. We also observe that for these two examples, using a relatively small number of modes (when compared to the total number of modes of 10000) or basis functions will still result in a qualitatively reasonable approximation to the true field.
While the Fourier component model does not seem to offer a significant advantage in terms of approximation quality, there are other reasons where one may consider its use. One advantage of the Fourier model is that it provides a natural way to control the number of model parameters (the coefficients ) that need to be estimated, in that we simply choose however many modes we wish to retain, whereas with the RBF model one would need to also choose the locations to place the basis functions and what the values of should be. Additionally, if we want to refine our field model with finer structure by including more model parameters, in the Fourier component model we can reuse any previous estimates (and further improve them) of the lower order modes (see Section V-C), since these remain the same in a model with more modes, whereas in the RBF model one would likely need to recalculate the estimates of all the parameter values when more basis functions are utilized.
V Estimation of Fourier Components
We now return to the problem of estimating the coefficients stated in Section III-C. Given a set of modes to be retained , of cardinality , define an ordering on indexed by . For instance, the elements of could be sorted in lexicographic order. Denote the -th element under this ordering by , and define
Then we can express
in the alternative form
| (14) |
which is a linear function of .
Remark 3.
The DCT coefficients which we are trying to estimate can be of substantially different orders of magnitude, with the higher order components being much smaller in magnitude than the “DC” component corresponding to , due to the result that the DCT coefficients decay as [26]. In order to estimate parameters with such large differences in magnitude, it is desirable to appropriately scale the parameters that are to be estimated, see (15) below.
Remark 4.
Comparing (14) with the RBF field model (11), we see that they are both linear functions of the parameters that are to be estimated. Thus the algorithms developed in e.g. [18, 19, 20, 21, 22, 23, 17] for estimating fields can in principle also be adapted to work for the field model (14), under their various assumed measurement models.
V-A Estimation of Fourier Components Using Quantized Measurements
In this subsection we describe an approach to estimating the parameters , which assumes the quantized measurement model (6)-(7), with the parameters estimated recursively. The algorithm uses an online optimization approach similar to [22], however in this paper we will generalize [22] from binary measurements to multi-level quantized measurements, and also extend the approach to handle time-varying fields.
For the measurement model (6)-(7), is taken as zero mean noise (not necessarily Gaussian). Recalling the observation in Remark 3, we consider the following scaling of the DCT coefficients:
| (15) |
and define
as the vector of parameters that are to be estimated.
We first introduce some notation. Let denote the measurement, and the position index, at time/iteration . For notational compactness we also denote
| (16) |
and
| (17) |
where
| (18) |
Denote
| (19) |
as the set of measurements collected up to time , with corresponding position indices
| (20) |
The idea is to recursively estimate by trying to minimize a cost function
| (21) |
using online optimization techniques [33]. For binary measurements (8), the following per stage cost function from [22] can be used:
| (22) |
where is a parameter in the logistic function , where larger values of will more closely approximate the function . The cost function (22) is similar to cost functions used in binary logistic regression problems [29, p.516]. In the current work, we wish to define a cost suitable for multi-level quantized measurements. Note that there are cost functions used in multinomial logistic regression problems [30], however they are unsuitable for our problem as they usually involve multiple sets of parameters for each possible output , whereas here we just have a single set of parameters .
To motivate our cost function, let us look more closely at the binary measurements cost function (22). In the case where the measurement at time and position index is equal to 0, the cost will be small if is less than the quantizer threshold , and large otherwise. Similarly, when , will be small if is greater than , and large otherwise. For the case of multi-level quantized measurements with levels given by (7), we would like to have a cost function such that 1) when , is small for , and large otherwise, 2) when , is small for , and large otherwise, and 3) when , is small for , and large otherwise. In this paper we will choose the following per stage cost function, which can be easily checked to satisfy these three requirements:
| (23) |
We remark that (23) reduces to (22) when the measurements are binary.
Now that the per stage cost (23) has been defined, we will present the online estimation algorithm. First, the gradient of can be derived as
| (24) |
while the Hessian of can be derived as
| (29) | |||
| (34) |
An approximate online Newton method [22] for estimating the parameters is now given by:
| (35) |
where
| (36) |
The terms and represent approximate gradients and Hessians respectively for the cost function (21). The initialization is a Levenberg-Marquardt type modification [34] to ensure that the matrices are always non-singular.666In [22] this is equivalently expressed as a full rank initialization on .
In the case where the field (and hence the parameters is time-varying, the algorithm (35)-(36) may not be able to respond quickly to changes in , due to all past Hessians (including Hessians from old fields) being used in the computation of in (36). To overcome this problem, we will introduce a forgetting factor [35] into the algorithm, where the forgetting factor satisfies , and typically chosen to be close to one. The final estimation procedure is summarized as Algorithm 1. Compared to (36), we note that the Levenberg-Marquardt modification in Algorithm 1 is done at every time step by adding to , as we found that only doing it once at the beginning can lead to algorithm instability due to exponential decay of initial conditions when using a forgetting factor. We also remark that Algorithm 1 reduces to (35)-(36) when the forgetting factor .
V-B Measurement Location Selection Using Active Sensing
For choosing the positions in which the unmanned vehicle should take measurements from, an “active sensing” approach [36, 19, 37] can be used, which aims to cleverly choose the next position given information collected so far, in order to more quickly obtain a good estimate of the field.
In the case of binary measurements, a method for choosing the next measurement location is proposed in [22], that tries to maximize the minimum eigenvalue of an “expected Hessian” term over candidate future position indices . Formally, the problem is:
where is the minimum eigenvalue of , is the set of possible future position indices777The set may, e.g., capture the set of reachable positions from the current state of the mobile sensor platform. and
| (37) |
The last line of (37) holds since , irrespective of the distribution of the noise .
If we attempt to generalize (37) to multi-level measurements, we find that there will be terms which cannot all be cancelled, and we will need to specify a noise distribution in order to compute these terms. Since exact knowledge of the noise distribution is usually unavailable in practice, we will instead consider a slightly different objective to optimize, namely a “predicted Hessian”
| (38) |
where is the predicted future measurement, with the quantizer given by (7). Note that (38) reduces to (37) in the case of binary measurements. We then maximize the minimum eigenvalue of the predicted Hessian to determine the next measurement location target:
| (39) |
For the set of candidate future position indices , one possible choice could be positions distributed uniformly on a grid within the search region . Once a new location target has been determined, the vehicle heads in that direction. The vehicle will collect measurements and update along the way, where we collect a new measurement after every in distance has been travelled until is reached, at which time a new location target is determined. The procedure is summarized in Algorithm 2, where denotes the closest position index to . The condition in line 7 of Algorithm 2 means the location target has been reached, so that a new location target is determined and a location index in the direction of the new target is returned. Some random exploration is also included in the algorithm, such that the new location target is random with probability , similar to -greedy algorithms used in reinforcement learning [38]. The condition in line 10 means that the vehicle is within of the target, which will be reached at the next time step, while the condition in line 12 means the vehicle will continue heading towards the target and collect measurements along the way.
V-C Refinement of Field Model
At the end of Section IV we mentioned that we can refine our field model as we go along by including more higher order modes, while reusing previous estimates of the lower order modes. One reason for doing so could occur if we realize that the original set of modes chosen is not sufficient to provide an adequate estimate of the field, so that more modes need to be added. In this subsection we briefly describe how this refinement can be done.
Suppose that originally, modes in of cardinality are being estimated, with an ordering on indexed by . After iterations, suppose we wish to increase the set of estimated modes to the set , of cardinality , and define an ordering on indexed by .
For the indices , define a mapping
such that gives the corresponding index . Note that in general may not be surjective.
Let denote the estimate (of dimension ), and the matrix (of dimension ) used in the computation of the approximate Hessians, for this new set of modes. Then we can re-initialize the estimates by setting
which copies the estimates of the existing components (of dimension ) across, with the other (new) components to be initialized appropriately. The term should also have components corresponding to the existing set of modes copied across, by setting
with other components of set to zero. After this re-initialization, Algorithm 1 then proceeds as before.
Remark 5.
Instead of adding more modes, the case where we refine the field model by deleting some modes can also be handled in a similar manner.
VI Numerical Studies
For performance evaluation of the field estimation algorithms, we will consider two performance measures, the mean squared error (MSE) and structural similarity index (SSIM). These are defined similar to Section IV, except that we replace the approximated field with the estimated field
VI-A Static Fields
We consider estimation of the (true) field shown in Fig. 5, with search region . The field is discretized using and . We use (5) to select the largest modes that we wish to retain and estimate.

We use Algorithm 1 with and . As the field is assumed static, the forgetting factor is set to . The initial position index is set to , close to the center of the search region . A four level quantizer is used with quantizer thresholds . The measurement noise is i.i.d. Gaussian with zero mean and variance equal to 0.1. For choosing the measurement locations, we use Algorithm 2 with . The candidate position indices are chosen to correspond to 36 points placed uniformly on a grid within the search region . The exploration probability is chosen as .


Fig. 6 shows the MSE vs. (corresponding to the number of measurements collected), when various numbers of modes are estimated. Fig. 7 shows the SSIM vs. . Each point in Figs. 6 and 7 is obtained by averaging over 10 runs. We see from the figures that there is a trade-off between the estimation quality, number of modes/parameters that need to be estimated, and number of measurements collected. If a lot of measurements can be collected, then estimating more modes will allow for a better estimate of the field.888For example, if multiple vehicles can be utilized [21] or one has a sensor network, then more measurements can be collected in a limited amount of time. On the other hand, if fewer measurements are available, estimating fewer modes more accurately may give a better field estimate than estimating lots of modes inaccurately. In Fig. 8 we show a sample plot of the estimated field when 60 modes are estimated, after 2000 measurements have been collected.

VI-B Time-varying Fields
We now consider an example with time-varying fields. Suppose the true field is the same of that of Fig. 1 for the first 1000 iterations, but then switches to the true field in Fig. 3 for the next 1000 iterations. We will use Algorithms 1 and 2 with forgetting factor , with other parameters the same as in the previous example.
Figs. 9 and 10 show respectively the MSE and SSIM vs. , when the 60 largest modes are estimated. We see that after the field changes at the accuracy of the field estimate drops, but Algorithm 1 is able to recover and estimate the new field as more measurements are collected.
For comparison, the MSE and SSIM obtained using forgetting factor are also shown. In this case, as there is no forgetting of old information, the field estimates will take much longer to adjust to the new field.


VI-C Refinement of Field Model
Here we consider the use of a refined field model as in Section V-C, for estimation of the static field shown in Fig. 5. For the first 1000 iterations the 40 largest modes are estimated, while the 80 largest modes are estimated for the next 1000 iterations, with the estimates of the 40 largest modes reused as described in Section V-C. Figs. 11 and 12 show respectively the MSE and SSIM vs. . We see that just after the estimate quality using 80 modes decreases slightly, due to the new modes not being accurately estimated, but the performance quickly improves and eventually outperforms the use of 40 modes.


VII Conclusion
This paper has studied the estimation of scalar fields, where the field is viewed in the Fourier domain. An algorithm has been presented for estimating the lower order modes of the field, under the assumption of noisy quantized measurements collected from the environment. Our approach assumed an unmanned autonomous vehicle travelling around a region in order to collect these measurements. The setup can also be extended to multiple vehicles, with the vehicles sharing measurements with each other similar to [21]. Future work will consider the use of a sensor network for field estimation, with algorithms constrained by local communication and distributed computation.
Acknowledgment
The authors thank Mr. Shintaro Umeki for suggesting the use of structural similarity as a performance measure while working at Defence Science and Technology Group as a summer vacation student.
Appendix A Proof of Lemma 1
References
- [1] M. Hutchinson, H. Oh, and W.-H. Chen, “A review of source term estimation methods for atmospheric dispersion events using static or mobile sensors,” Inf. Fusion, vol. 36, pp. 130–148, 2017.
- [2] B. Ristic, M. Morelande, and A. Gunatilaka, “Information driven search for point sources of gamma radiation,” Signal Process., vol. 90, pp. 1225–1239, 2010.
- [3] T. Yardibi, J. Li, P. Stoica, M. Xue, and A. B. Baggeroer, “Source localization and sensing: A nonparametric iterative adaptive approach based on weighted least squares,” IEEE Trans. Aerosp. Electron. Syst., vol. 46, no. 1, pp. 425–443, Jan. 2010.
- [4] A. J. Annunzio, G. S. Young, and S. E. Haupt, “Utilizing state estimation to determine the source location for a contaminant,” Atmos. Environ., vol. 46, pp. 580–589, 2012.
- [5] P. P. Neumann, V. Hernandez Bennetts, A. J. Lilienthal, M. Bartholmai, and J. H. Schiller, “Gas source localization with a micro-drone using bio-inspired and particle filter-based algorithms,” Advanced Robotics, vol. 27, no. 9, pp. 725–738, 2013.
- [6] D. Wade and I. Senocak, “Stochastic reconstruction of multiple source atmospheric contaminant dispersion events,” Atmos. Environ., vol. 74, pp. 45–51, 2013.
- [7] A. A. R. Newaz, S. Jeong, H. Lee, H. Ryu, and N. Y. Chong, “UAV-based multiple source localization and contour mapping of radiation fields,” Robotics and Autonomous Systems, vol. 85, pp. 12–25, 2016.
- [8] B. Ristic, A. Gunatilaka, and R. Gailis, “Localisation of a source of hazardous substance dispersion using binary measurements,” Atmos. Environ., vol. 142, pp. 114–119, 2016.
- [9] D. D. Selvaratnam, I. Shames, D. V. Dimarogonas, J. H. Manton, and B. Ristic, “Co-operative estimation for source localisation using binary sensors,” in Proc. IEEE Conf. Decision and Control, Melbourne, Australia, Dec. 2017, pp. 1572–1577.
- [10] M. Hutchinson, C. Liu, and W.-H. Chen, “Source term estimation of a hazardous airborne release using an unmanned aerial vehicle,” J. Field Robotics, vol. 36, pp. 797–817, 2019.
- [11] P. W. Eslinger, J. M. Mendez, and B. T. Schrom, “Source term estimation in the presence of nuisance signals,” J. Environ. Radioact., vol. 203, pp. 220–225, 2019.
- [12] D. Li, F. Chen, Y. Wang, and X. Wang, “Implementation of a UAV-sensory-system-based hazard source estimation in a chemical plant cluster,” in IOP Conf. Series, 2019, p. 012043.
- [13] M. Park, S. An, J. Seo, and H. Oh, “Autonomous source search for UAVs using Gaussian mixture model-based infotaxis: Algorithm and flight experiments,” IEEE Trans. Aerosp. Electron. Syst., vol. 57, no. 6, pp. 4238–4254, Dec. 2021.
- [14] D. Weidmann, B. Hirst, M. Jones, R. Ijzermans, D. Randell, N. Macleod, A. Kannath, J. Chu, and M. Dean, “Locating and quantifying methane emissions by inverse analysis of path-integrated concentration data using a Markov-Chain Monte Carlo approach,” ACS Earth Space Chem., vol. 6, pp. 2190–2198, Jun. 2022.
- [15] P. Martin, O. Payton, J. Fardoulis, D. Richards, Y. Yamashiki, and T. Scott, “Low altitude unmanned aerial vehicle for characterising remediation effectiveness following the FDNPP accident,” J. Environ. Radioact., vol. 151, pp. 58–63, Jun. 2016.
- [16] Z. Wang, J. Yang, and J. Wu, “Level set estimation of spatial-temporally correlated random fields with active sparse sensing,” IEEE Trans. Aerosp. Electron. Syst., vol. 53, no. 2, pp. 862–876, Apr. 2017.
- [17] M. R. Morelande and A. Skvortsov, “Radiation field estimation using a Gaussian mixture,” in Proc. Intl. Conf. Inf. Fusion, Seattle, USA, Jul. 2009, pp. 2247–2254.
- [18] H. M. La and W. Sheng, “Distributed sensor fusion for scalar field mapping using mobile sensor networks,” IEEE Trans. Cybern., vol. 43, no. 2, pp. 766–778, Apr. 2013.
- [19] H. M. La, W. Sheng, and J. Chen, “Cooperative and active sensing in mobile sensor networks for scalar field mapping,” IEEE Trans. Syst., Man, Cybern., Syst., vol. 45, no. 1, pp. 1–12, Jan. 2015.
- [20] R. A. Razak, S. Sukumar, and H. Chung, “Scalar field estimation with mobile sensor networks,” Int. J. Robust Nonlinear Control, vol. 31, pp. 4287–4305, 2021.
- [21] A. S. Leong and M. Zamani, “Field estimation using binary measurements,” Signal Process., vol. 194, no. 108430, 2022.
- [22] A. S. Leong, M. Zamani, and I. Shames, “A logistic regression approach to field estimation using binary measurements,” IEEE Signal Process. Lett., vol. 29, pp. 1848–1852, 2022.
- [23] V. P. Tran, M. A. Garratt, K. Kasmarik, S. G. Anavatti, A. S. Leong, and M. Zamani, “Multi-gas source localization and mapping by flocking robots,” Inf. Fusion, vol. 91, pp. 665–680, 2023.
- [24] V. Britanik, P. Yip, and K. R. Rao, Discrete Cosine and Sine Transforms. Academic Press, 2007.
- [25] G. Strang, “The discrete cosine transform,” SIAM Review, vol. 41, no. 1, pp. 135–147, 1999.
- [26] K. Yamatani and N. Saito, “Improvement of DCT-based compression algorithms using Poisson’s equation,” IEEE Trans. Image Process., vol. 15, no. 12, pp. 3672–3689, 2006.
- [27] P. Robins, V. Rapley, and P. Thomas, “A probabilistic chemical sensor model for data fusion,” in Proc. Int. Conf. Inf. Fusion, Philadelphia, USA, Jul. 2005, pp. 1116–1122.
- [28] Y. Cheng, U. Konda, T. Singh, and P. Scott, “Bayesian estimation for CBRN sensors with non-Gaussian likelihood,” IEEE Trans. Aerosp. Electron. Syst., vol. 47, no. 1, pp. 684–701, Jan. 2011.
- [29] G. Calafiore and L. El Ghaoui, Optimization Models. Cambridge University Press, 2014.
- [30] K. P. Murphy, Probabilistic Machine Learning: An Introduction. The MIT Press, 2022.
- [31] Z. Wang, A. C. Bovik, H. R. Sheikh, and E. P. Simoncelli, “Image quality assessment: From error visibility to structural similarity,” IEEE Trans. Image Process., vol. 13, no. 4, pp. 600–612, Apr. 2004.
- [32] Z. Wang and A. C. Bovik, “Mean squared error: Love it or leave it?” IEEE Signal Process. Mag., vol. 26, no. 1, pp. 98–117, Jan. 2009.
- [33] A. Lesage-Landry, J. A. Taylor, and I. Shames, “Second-order online nonconvex optimization,” IEEE Trans. Autom. Control, vol. 66, no. 10, pp. 4866–4872, Oct. 2021.
- [34] E. K. P. Chong and S. H. Żak, An Introduction to Optimization, 4th ed. John Wiley & Sons, 2013.
- [35] D. G. Manolakis, V. K. Ingle, and S. M. Kogon, Statistical and Adaptive Signal Processing. Artech House, 2005.
- [36] C. M. Kreucher, K. D. Kastella, and A. O. Hero, “Sensor management using an active sensing approach,” Signal Process., vol. 85, pp. 607–624, 2005.
- [37] B. Ristic, A. Skvortsov, and A. Gunatilaka, “A study of cognitive strategies for an autonomous search,” Inf. Fusion, vol. 28, pp. 1–9, 2016.
- [38] R. S. Sutton and A. G. Barto, Reinforcement Learning, 2nd ed. The MIT Press, 2018.
- [39] N. Ahmed, T. Natarajan, and K. R. Rao, “Discrete cosine transform,” IEEE Trans. Comput., vol. C-23, no. 1, pp. 90–93, Jan. 1974.