Energy dependence of longitudinal flow decorrelation from STAR
Abstract
Measurements of longitudinal flow decorrelations for charged particles are presented in the pseudorapidity range using a reference detector at 2.1 5.1 in Au+Au collisions at = 27 GeV by STAR. The flow decorrelation for shows a strong centrality dependence, while a weak centrality dependence for . Results are compared with the results in Au+Au collisions at 200 GeV as a function of scaled by beam-rapidity, i.e. . No energy dependence is observed for decorrelation, but clear energy dependence for decorrelation. These results provide new insights into the longitudinal structure of the initial-state geometry in heavy-ion collisions.
keywords:
flow decorrelation, longitudinal dynamics, STAR1 Introduction
Initial-state fluctuations in the transverse plane in the heavy-ion collisions play an important role for the final-state dynamics of multiparton interactions in Quark-Gluon Plasma. Recently, it is realized that the longitudinal fluctuations are also important for the longitudinal dynamics of the medium evolution produced in heavy-ion collisions [1, 2]. The rapidity decorrelation of flow harmonics, , probes the non-boost-invariant nature of the initial-collision geometry and final-state collective dynamics [3]. In this proceeding, we present the new measurements of flow decorrelation in Au+Au at = 27 GeV with the STAR detector. Comparisons with results from top RHIC energy and the LHC energies are discussed.
2 Analysis method
The azimuthal anisotropy of the particle production in an event is described by harmonic flow vector, , where and are the magnitude and phase (event plane) of -order flow harmonics, respectively. Experimentally, is estimated from the observed per-particle flow vector, , where the sum runs over all charged particles in the phase-space sample and is the weight assigned to the particle. The deviates from due to non-flow contribution and statistical fluctuations. The non-flow contribution can be effectively suppressed by requiring a large pseudorapidity gap, and the statistical fluctuation drops after event average. The correlation between from two pseudorapidity intervals can then be estimated with the observed flow vector :
| (1) |
The flow decorrelations are quantified with the factorization ratio, , which is proposed by the CMS experiments[4]. Since , for a symmetric system, a symmetrization procedure has been applied to further cancel the possible differences between and in the tracking efficiency or detector acceptance. The observable, as shown in Eq. 2, is sensitive to the event-by-event fluctuations of the initial conditions in the longitudinal direction. If flow harmonics from two-particle correlations factorize into single-particle flow harmonics, then the value of is expected to be equal to unity. Therefore, would indicate the effects of longitudinal flow decorrelations.
| (2) |
In this analysis, the measurements are performed using charged particles with GeV/c from the Time Projection Chamber (TPC, ), and the reference flow vector is calculated from the Event Plane Detector (EPD, ) for the = 27 GeV Au+Au collisions. The systematic uncertainties sources are estimated using positive tracks, negative tracks and tight track selections.
3 Results and discussion
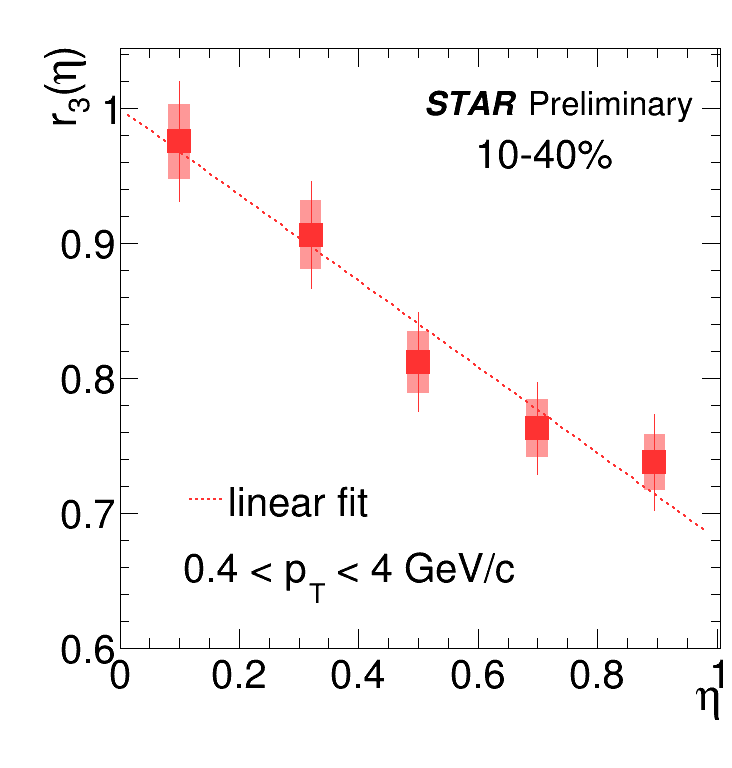
Figure 1 shows the factorization ratios and as a function of , averaged over GeV/c for 10-40% Au+Au collisions. Both and decrease linearly with increasing . The decreasing trend can be described by a linear fit. The similar behavior is also observed for other centralities.

The first measurement of longitudinal decorrelations of harmonic flow and in Au+Au collisions at = 200 GeV has been reported by STAR in Ref. [5]. A direct comparison of decorrelation results between 27 and 200 GeV can help us to better understand the energy dependence of the longitudinal dynamics. To account for the beam-rapidity dependence, a rapidity normalization procedure is applied for the comparison. Figure 2 shows as a function of normalized pseudorapidity , where = 5.36 for 200 GeV and 3.36 for 27 GeV. The factorization ratio, (top panel), is plotted in various centrality intervals. The filled squares and circles are the results for 27 and 200 GeV, respectively. The decorrelation at 27 GeV is slightly stronger in than 200GeV, but are nearly the same between the two energies for other centrality ranges. The results suggest no clear energy dependence of after beam-rapidity normalization. For the factorization ratio, (bottom panel), on the other hand, shows weak centrality dependence. The shows a clear energy dependence and a stronger decorrelation for 27 GeV.


The previous comparison between results at the top RHIC energies and at the LHC energies [4, 6] indicate stronger decorrelation effect at lower energies. To investigate the energy dependence of flow decorrleation, we further compare three other energies with the new measurements, as shows in Figure 3. For , we find neither RHIC nor LHC energies had clear energy dependence after beam-rapidity normalization. The results show the decorrelation is stronger at RHIC energies than at the LHC energy. This results is still not understood and need further studies in both experimental and theoretical studies. The high statistics Au+Au collisions at = 54.4 GeV will be used to test the energy dependence, and the future RHIC Beam Energy Scan II(BES-II) data are also crucial for this study. On the other hand, the shows clear energy depdence, lower energy has stronger decorrelation effect. The observed energy dependence of and remain to be a puzzle from current understanding, futher studies are still needed.


4 Conclusions
Measurements of longitudinal flow correlations for charged particles are presented in the pseudorapidity range using a reference detector at in Au+Au collisions at = 27 GeV with the STAR detector at RHIC. The strength of the decorrelation is nearly independent of centrality for . However, for the effect has a strong centrality dependence. The results are compared with those from LHC and top RHIC energies. After beam-rapidity normalization, the shows no clear energy dependence for both RHIC or LHC energies, while the show clear hierarchy and the decorrelation effect is stronger at lower energy.
5 Acknowledgements
This work is supported by the China Postdoctoral Science Foundation 2019M662319, NSFC grant number 11890713, PHY-1613294, PHY-1913138, and the Program of Qilu Young Scholars of Shandong University.
References
- [1] P. Bozek, W. Broniowski, J. Moreira, Phys. Rev. C 83 (2011) 034911.
- [2] J. Jia, P. Huo, Phys. Rev. C 90 (2014) 034915.
- [3] J. Jia, P. Huo, G. Ma, M. Nie, J. Phys. G 44 (2017) 075106.
- [4] V. Khachatryan, et al., Phys. Rev. C 92 (2015) 034911.
- [5] M. Nie, Nucl. Phys. A 982 (2019) 403–406.
- [6] M. Aaboud, et al., Eur. Phys. J. C 78 (2018) 142.