Electro-magnetic field fluctuation and its correlation with the participant plane in Au+Au and isobaric collisions at GeV
Abstract
Intense transient electric (E) and magnetic (B) fields are produced in the high energy heavy-ion collisions. The electromagnetic fields produced in such high-energy heavy-ion collisions are proposed to give rise to a multitude of exciting phenomenon including the Chiral Magnetic Effect. We use a Monte Carlo (MC) Glauber model to calculate the electric and magnetic fields, more specifically their scalar product , as a function of space-time on an event-by-event basis for the Au+Au collisions at GeV for different centrality classes. We also calculate the same for the isobars Ruthenium and Zirconium at GeV. In the QED sector acts as a source of Chiral Separation Effect, Chiral Magnetic Wave, etc., which are associated phenomena to the Chiral Magnetic Effect. We also study the relationships between the electromagnetic symmetry plane angle defined by () and the participant plane angle defined from the participating nucleons for the second-fifth order harmonics.
I Introduction
The initial state fluctuations in high-energy heavy-ion collisions play an essential role in understanding several bulk observables. We can attribute the two primary sources of these initial state fluctuations to the event-by-event (e-by-e) geometry fluctuations of the nucleon’s position inside the nuclei due to the nuclear wave function and the fluctuation in impact strong fluctuating transient electro-magentic (EM) fields in the overlap zone of the colliding nucleus.
The EM field generated in high-energy heavy-ion collision experiments such as Relativistic Heavy Ion Collider (RHIC)
and the Lager Hadron Collider (LHC) is known to be the strongest magnetic field in the universe (e.g., B Gauss for GeV) Ref1 ; Ref2 ; Ref3 ; Ref4 ; Ref5 ; Ref6 .
The magnetic field in heavy-ion collisions, while averaged over many events, mostly obey a linear scaling with the centre of mass energy () and the impact parameter (b) of collisions, Ref7 i.e., for where Z is the charge number of the ions, is the radius of the nucleus.
We take the y axis perpendicular to the reaction plane as per the convention, defined
by the impact parameter(chosen as the x-axis) and the beam direction(z-axis). Furthermore,
the event-averaged electric fields are also found to be of the same order of magnitude
as the magnetic fields (e.g., at the topmost RHIC energy Au+Au collisions
GeV where is the pion mass).
It has been conjectured that in addition to the standard ohmic current driven by the electric field, there might
appear other new types of current in parity (P) and charge conjugation (C) odd regions in QGP as responses to the electromagnetic fields.
One of this new type of currents is generated along the background magnetic field, a.k.a. the Chiral Magnetic Effect (CME)Ref1 ; Ref8 ; Ref9 ; Ref10 .
In other words, in high-energy heavy-ion collisions, special gluonic configurations (sphalerons and instantons) break the P and the CP in the presence of a strong magnetic field. It results in a global electric charge separation with respect to the reaction plane Ref11 ; Ref11a .
This charge separation occurs through the transition of the right-handed quarks to the left-handed quarks and vice versa depending on the sign of topological charges Ref1 . Because of their close association with axial anomaly and the topologically nontrivial vacuum structure of QCD, the CME and other associated phenomena such as chiral separation effect (CSE), the chiral electric separation effect (CESE) is known as anomalous effects Huang:2015oca .
It is known that only the lowest Landau level contributes to the CME. In the QED sector, combined electric (E) and magnetic fields (B) are responsible for the transition of chiral fermions from the left-handed chirality branch to the right-handed chirality branch at a rate Ref10 ; Huang:2015oca .
Similarly, in CSE, the axial current is known to be not conserved due to a source term proportional to . The same term also appears in the Chiral magnetic wave equation if is non-zero. In other words, pumps chirality into the system. In ref. Son:2009tf it was shown that the current conservation equation in a relativistic fluid with one conserved charge, with a anomaly, contains a source term proportional to . The scalar product of the four vectors and in the fluid rest frame is . Hence it is interesting to study for different collision geometry and its possible correlation with the symmetry (participant) plane, with respect to which we search for the CME signal. It is worthwhile to mention that although the event averaged magnetic field shows a linear behavior with collision centrality, the electric field, on the other hand, shows an opposite trend, i.e., maximum for the central collisions and gradually decreases for higher centralities. In this paper, we focus on the spatial distribution of for various centrality Au+Au, Ru+Ru, and Zr+Zr collisions at GeV to investigate their angular correlation with the geometry of the fireball. To this end, we introduce the participant plane defined with the weight of , and we show the correlation of it with the participant plane .
The rest of this paper is organized as follows: In Sec. II, we describe the detail of calculating electromagnetic fields from the Glauber model on an event-by-event basis. We also discuss their impact parameter dependence and event averaged value. In Sec. III. we discuss the main results, which consists of the impact parameter, space-time, and system size dependence of and its correlation with the participant plane. Finally, we summarise this study in Sec. IV.
II Calculation of electric and magnetic field
Customarily the electromagnetic field generated by a relativistic charged particle is calculated from the well known Liénard–Wiechert potentials, however, we will calculate it from the second-rank antisymmetric electromagnetic field tensor using the Lorentz transformation. Here is the four-potential due to an electric charge, in the following calculations we assume the charged protons inside the colliding nuclei move in a straight line trajectory and there are neglegible change in momentum after the collision. The calculation goes as follow Ref12 : first we calculate the component of electromagnetic fields and corresponding in the rest frame of the charge particle. The fields in the laboratory frame is calculated from which is obtained from through the Lorentz transformation:
| (1) |
or in matrix notation , where is the matrix representation of the Lorentz transformation and corresponds transpose of . We choose a boost along the axis. In this case it can be easily shown that the electric fields transform as
| (2) | |||||
| (3) | |||||
| (4) |
and the magnetic fields transform as,
| (5) | |||||
| (6) | |||||
| (7) |
Since the charge is at rest in the frame , furthermore, it is easy to verify . Next, we calculate at a point P at time for a charge at () at time by noting that (we assume that the origin of the lab frame and the moving frame coincide at ). The subscript corresponds to the charge. For convenience, we denote the transverse distance , the distance from the charge to is (here we have taken the center of the nucleus to be at the origin of ). Also, the positions of the charged particles in the transverse plane are assumed to be frozen due to large Lorentz . A straightforward calculation gives the following values of the electric fields in frame
| (8) | |||||
| (9) | |||||
| (10) |
and the magnetic fields are given by
| (11) | |||||
| (12) | |||||
| (13) |
The total electromagnetic field at any point is evaluated using the principle of superposition i.e., calculating fields using Eq.(8) - (13) for all the protons inside the nucleus. We use a cutoff value of = 0.3 fm while calculating the electric and magnetic field usig Eq.(8) - (13) We note that this cutoff value was chosen as an average effective distance between the quarks inside the nucleons, and it was also reported Ref6 that there is a weak dependence of the field values on in the range 0.3 to 0.6 fm. Since the colliding nucleus at GeV has Lorentz , we can safely assume the nucleus as a flat disk that has a vanishing thickness along the axis. Also, due to the time-dilation, the nucleons will appear as frozen inside the nucleus, and all nucleons effectively move along with constant i.e (0,0,). As per the convention, we take the velocity of the target nucleus as , and the velocity of the projectile nucleus is . is calculated from the ratio of the relativistic momentum and the energy of a proton
| (14) |
To obtain the nucleon positions we use the MC-Glauber model Ref13 . We also calculate the initial spatial eccetricity (, defined later) and the number of participating nucleons for a given impact parameter from the MC-Glauber model. In the MC-Glauber model, the positions of the nucleons inside the nucleus are determined by the nuclear density function measured in low-energy electron scattering experimentsRef14 . The functional form of this distribution is:
| (15) |
where corresponds to the nuclear density at the center, is the radius of the nucleus, is the skin depth (it controls how quickly the nuclear density falls off near the edge of the nucleus). The spherical harmonics and parameters and are used to measure the deformation from spherical shape. For our study, we take fm, fm, and for the nucleus. We use parameter =0.158 , =0.08, fm, fm and a = 0.46 fm for both Ru and Zr Ref14a ; Ref14b ; Ref14c . is taken 0 for both nuclei.
We sample the nucleon positions assuming that they are randomly distributed with the given distribution (integrating on and ) for Au nucleus and for Ru and Zr nuclei respectively.
The impact parameters of the collisions are randomly selected from the distribution upto a maximum
value of fm . The center of the target and projectile nuclei are shifted
to and respectively. We use the inelastic nucleon-nucleon cross section
mb for the top RHIC energy GeV for calculating the probability of an
interaction between the target and the projectile nucleonsRef15 ; Ref16 .
To show the centrality dependence, we calculate the centrality of the collisions using
and the number of binary collisions obtained from the MC Glauber model . The multiplicity for a given
and is calculated using the two component model as
| (16) |
where is the fraction of hard scattering, is the average multiplicity per unit pseudo-rapidity in pp collisions. The above two-component model of the particle production is based on the assumption that the average particles produced through the soft interactions are proportional to the , and the probability of hard interactions is proportional to . We calculate the centrality of a given collision in the following way: the number of independent particle emitting sources for a given impact parameter are . Each of these sources produces particles following a negative binomial distribution (NBD) with a mean and the width 1/k,
| (17) |
is the probability of measuring n hits per independent sources. The mean of this NBD distribution is calculated from the pseudo-rapidity density of the charged multiplicity for the non-single diffractive collisions at a given energy Ref17 :
| (18) |
where , , and . The charged particle multiplicity data for Au+Au 200 GeV collisions measured by the STAR collaboration are explained for and , and for the pseudo-rapidity range i.e Ref18 . For example, we show the charged particle multiplicity distribution for Au+Au collisions at GeV for in Fig. 1.

To calculate the centrality of collisions, we subdivide the total area in Fig. 1 into different bins with the condition that
the fractional area corresponds to a particular centrality.
For example, the bin boundaries and for the 40-50 centrality are defined in such a way
that the following relation holds:
, and .
We use three centrality bins 0-5, 40-50 and 70-80 for our calculation of the electric and magnetic field; corresponding impact parameter ranges are , , and fm, which are very similar to the values given in Ref18 .
As mentioned earlier, the topology of the electromagnetic fields in heavy-ion collisions has non-trivial dependence on the centrality (possibly also on the ). Consequently, the source () of the chiral current in the transverse plane also has a non-trivial centrality dependence. The axial current generated by the magnetic field is supposed to predominantly flow along the direction perpendicular the participant plane. Hence, we investigate here how the sources of this current is correlated to the participant plane. From the perspective of heavy-ion collisions it is customary to use the Milne co-ordinates i.e., we use the longitudinal proper time ,,, and the space-time rapidity instead of the Cartesian co-ordinate. In Fig.2 we show the distribution of for 40-50 centrality with (left plot) and (right plot). In left plot, we calculate in the forward light-cone spanned by the region for = 0.4 and . In right plot, we also calculate in the forward light-cone. But for this plot, phase space is spanned by the region for = 0.4 and . While calculating the dot product, we transform the field components from the Cartesian to the Milne coordinate by the following expression and . The components of the electric field transform similarly.

To investigate the distribution of (from now on denoted as ) to the participant plane, we introduce the symmetry plane defined as Ref19 ; Ref20
| (19) |
where and . Here corresponds to the mean position of the participating nucleons. Using these definitions and Eq.(19) we obtain as
| (20) |
Before going into the main results of this paper, let us very briefly go through the impact parameter dependence of the electric and magnetic field produced in Au+Au collisions at GeV. These results are not new and have already been reported in several works Ref6 ; Ref7 ; Huang:2015oca ; Ref20ab , but we include them for the sake of completeness.
II.1 Impact parameter dependence of the field
We calculate fields on a regular space-time grid and consider one million events while calculating event-averaged quantities. The magnitude of the electric and magnetic fields may become very large near the charges due to the obvious dependence of Coulomb law, relativistic enhancement of field, and due to the clustering of charges due to the quantum fluctuations of nuclear wavefunction Ref20a . But these fluctuations smoothes out when taking event-average of the field due to its vector nature. These fluctuations might play an essential role in CME; however, here, we show the event-averaged values of electromagnetic fields as a function of the impact parameter of the collisions. The impact parameter dependence of electric and magnetic field at the origin, i.e., (=0, =0 in our grid space) at =0 is shown in Fig.3. Because of the symmetry in the system considered here, and are zero at the origin. It is also interesting to note that (figure Fig.3). From these two figures, we also notice that the electric field decreases as the impact parameter increases while the magnetic field follows the opposite trend. Our results seems to be consistent with Ref6 ; Ref7 .


We end this section with this brief discussion; let us turn to the quantity of our interest in the next section.
III Results and discussion
III.1 impact parameter dependence of
In Fig.4, we show one dimensional histogram of distribution for and for three different centralities 0-5 (black circles), 40-50 (red triangles), and 70-80 (open blue circles) Au+Au collisions at GeV. First, we note that there is a non-monotonic dependence of on the collision centrality. For peripheral collisions maximum events have , and the distribution also becomes narrower compared to the central/mid-central collisions. This behaviour can be understood as a consequence of near vanishing electric fields at the centre of the collision zone in peripheral collisions at and at midrapidity. It is clear from top panel of Fig.4 that although the mean of (at the origin) is zero the variance is non-zero. Hence it is more relevant to study the absolute value of the event averaged . In the bottom panel of Fig.4, and in both panels of Fig.5 we show the event averaged absolute values of for fm, and =0.5 fm, , respectively. The important difference between these two results is that for the first case ( fm) electromagnetic fields from the two colliding nuclei almost equally contributed in , whereas, for the other case, the fields due to each nucleus will be significant for and is dominated by the nearest nucleus. From the bottom panel of Fig.4 we observe that for fm is almost flat up to impact parameter fm, and after that, it falls rapidly. This observed impact parameter dependence of can be attributed to the fact that the magnetic field increases with impact parameter, whereas electric fields diminish. The magnitude of (expressed in the unit of pion mass) is comparable to the corresponding magnetic fields in central collisions. It may be an over-optimistic claim at this stage; however, this large values of at mid-rapidity at the initial time possibly indicates that the CME signal may have a significant contribution from along with . To get the complete picture, we must wait for the late time behavior of discussed next. For the other case, we consider fields at later time fm, and at forward and backward regions, i.e., . The top panel of Fig.5 shows the dependence of as a function of for =0 (blue squares), (open and filled circles). It is not surprising that for this case is approximately six orders of magnitude smaller than case, this is because the electromagnetic fields decay rapidly after the collision, and in this case, only one nucleus significantly contributes to the fields.
From the top panel of Fig.5 we also observe that increases almost linearly with the impact parameter; this is almost opposite to what we observe for . The impact parameter dependence of at finite is, however, non-trivial, as can be seen from the bottom panel of Fig.5, where the same result is shown but for . Here one notices that rises almost linearly for small ( fm), but after that, it starts saturating. Since at time fm is nearer to the receding nuclei, we get a larger value of compared to =0 , and (top panel). To conclude this section, we note that at peripheral collisions, charge separation is experimentally observed to be larger than central collisions Ref21 ; Ref22 , and it might be linked to the observed dependence , along with the magnetic fields, which are also most prominent in mid-central/peripheral collisions.


III.2 correlation with participant plane
In Ref23 , the correlation of the fluctuating magnetic field with the participant plane showed that a sizable suppression of the angular correlations exists between the magnetic field and the second and fourth harmonic participant planes were found in very central and very peripheral collisions. The importance of space averaged was studied recently in Ref24 as a function of time for 200 GeV Au+Au collisions at fm and for b= 9 fm. We notice that our finding of the spatial distribution of in Au+Au collisions is similar to Ref24 . In this section, we further investigate the spatial distribution and its correlation with the participant plane by calculating the symmetry plane defined in Eq.(20). is calculated from Eq.(20) using the positions of wounded nucleons, and by setting which gives the usual definition used in literature.
Since the isobaric collisions of Ru+Ru and Zr+Zr are important for searching the CME signal, we include results for these two nuclei along with the Au+Au collisions discussed in the previous section.
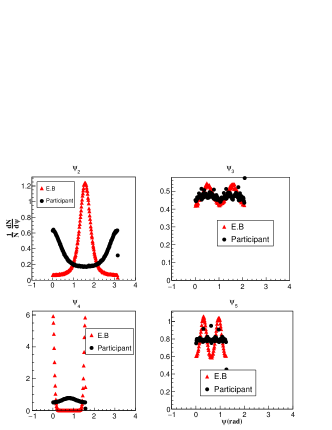
Let us first discuss the result for Au+Au collisions. We show the distribution of and at =0 for time =0 fm in Fig.6 for perfectly head on (=0 fm) Au+Au collisions at GeV. Since a head-on collision creates an almost symmetric overlap zone, the existence of a particular symmetry plane due to the participants () may be ruled out in this case. That is what we observe here from Fig.6, where black circles show ; the distribution is almost flat. The distribution of is also similar to ; the third and fifth-order symmetry plane show a similar trend. Interestingly, the rotational symmetry in head-on collisions seems to be broken for . The reason behind this behavior, however, is unclear to us. We know that the probability of occurrence of a perfectly head-on collision is approximately zero. Hence, next in Fig.7 we show results for 0-5 centrality Au+Au collisions at fm.

As expected, in contrast to the case, in Fig.7 we see that due to the overlap geometry and the fluctuating nucleon positions, the distribution of the second-order participant plane (black circles) reflects the broken rotational symmetry of the collision zone. (red triangles) due to the electromagnetic fields seems to be highly correlated with . Other higher order ’s in central collisions known to be fluctuating widely and the same is observed here as well. Notably, shows a different trend than , this is because in central collisions inside the fireball the resultant electric fields due to the target and the projectile are much smaller than the magnetic fields; the magnetic fields have a dipole nature, and the corresponding symmetry plane almost coincides with . This can be more clearly seen from Fig. 8 for 40-50 centrality collisions, where the electric fields become vanishingly small, and the magnetic fields are larger, in that case (bottom panel) becomes more oriented along (top panel). If we further increase the collision centrality and consider 70-80 collisions (see Fig. 9) we observe a noticeable change in as compared to the mid-central collisions. It is clear that the distribution of has a rotation compared to the central collisions. To better understand this rotation of symmetry plane for peripheral collisions we we show the contours of in the transverse plane for the 40-50 (top panel), and 70-80 (bottom panel) centralities at and fm in Fig.10. We can see that a quadrupole like structure appears for 70-80 collisions. From the above discussion, we can conclude that distribution in the transverse plane for Au+Au collisions at 200 GeV per nucleon is highly correlated with the geometry of the fireball.


Ruthenium and Zirconium nuclei carry the same number of nucleons (96), but Ru has 44 protons, and Zr has 40 protons. In other words, they have similar shapes and sizes but different electrical charges, which implies different electromagnetic fields generated in Ru+Ru and Zr+Zr collisions. This feature makes them interesting systems for detecting CME by eliminating possible backgrounds. For the following results we use a fixed impact parameter collisions to keep things simple.
We checked that for Ru+Ru, and Zr+Zr collisions (not shown here), results are very similar to what was observed for Au+Au collisions. In the top panel of Fig.11, we show and ( ) distribution for Ru+Ru collisions at GeV for =5 fm. The bottom panel of the same figure corresponds to results for =10 fm collisions. A similar result was obtained (not shown here) for the Zr+Zr collisions. It is interesting to note that ’s and ’s in these small collision systems show a similar correlation as was observed for the Au+Au collisions. Like peripheral Au+Au collisions, we also observe the rotation of by for the peripheral Ru+Ru and Zr+Zr collisions. Because the electromagnetic field produced in Ru+Ru and Zr+Zr collisions differs, we compared distribution for fm. This fact is shown in Fig.12, the field is higher for Zr+Zr compared to Ru+Ru; possibly as a consequence, we observe a slightly narrow peak for the Zr+Zr (black dots).


IV Conclusion and summary
In summary, we have studied the event-by-event fluctuations of the electric and the magnetic fields and their possible correlation with the geometry of the high-energy heavy-ion collisions. More particularly we studied the distribution of () in the transverse plane for Au+Au, Ru+Ru, and Zr+Zr collisions at GeV. Further, we show the and dependence of in Au+Au at 200 GeV per nucleon collisions. As expected, is found to be symmetric in (around ), and quickly decays as a function of at a given . Because may contribute to CME as a source of the anomalous current, we investigate the centrality (impact parameter) dependence of the symmetry plane angle and its possible correlation with the participant plane. We show that is strongly correlated with for second-fifth order harmonics for Au+Au, Ru+Ru, and Zr+Zr collisions. The second-order planes and are not only correlated but also mostly coincides with each other except for the peripheral collisions, where a rotation by is observed for irrespective of the collision system size. This phenomenon seems to be happening due to the almost cancellation of electric fields and dominating magnetic field pointing perpendicular to the participant plane in peripheral collisions. To conclude, in this exploratory study, we show that, like the magnetic fields, is also correlated to the geometry of the collision even when we consider e-by-e fluctuation of nucleon positions.
Acknowledgements
We are thankful to the grid computing facility at Variable Energy Cyclotron Centre, Kolkata, for providing us CPU time. VR acknowledges financial support from the DST Inspire faculty research grant (IFA-16-PH-167), India.
References
- (1) D.E. Kharzeev, L.D. McLerran, H.J. Warringa, Nucl. Phys. A 803 (2008) 227.
- (2) V. Skokov, A.Y. Illarionov, V. Toneev, Int. J. Mod. Phys. A 24 (2009) 5925.
- (3) M. Asakawa, A. Majumder, B. Muller, Phys. Rev. C 81 (2010) 064912.
- (4) V. Voronyuk, V.D. Toneev, W. Cassing, E.L. Bratkovskaya, V.P. Konchakovski, S.A.Voloshin, Phys. Rev. C 83 (2011) 054911.
- (5) L. Ou, B.A. Li, Phys. Rev. C 84 (2011) 064605.
- (6) A. Bzdak, V. Skokov, Phys. Lett. B 710 (2012) 171.
- (7) W.T. Deng, X.G. Huang, Phys. Rev. C 85 (2012) 044907
- (8) A. A. Belavin, et al., Phys. Lett. 59B, 85 (1975).
- (9) G.Hooft, Phys. Rev. Lett. 37 (1976) 8; Phys. Rev. D 14 (1976)3432.
- (10) Kenji Fukushima,Dmitri E. Kharzeev,and Harmen J. Warringa, Phys. Rev D 78 (2008) 074033.
- (11) D. T. Son and P. Surowka, Phys. Rev. Lett. 103, 191601 (2009) doi:10.1103/PhysRevLett.103.191601 [arXiv:0906.5044 [hep-th]].
- (12) D. Kharzeev, Phys. Lett. B 633 (2006) 260.
- (13) Sk Noor Alam, Subhasis Chattopadhyay, Nuclear Physics A 977 (2018) 208-216
- (14) J.D Jackson Classical Electrodynamics (3rd Edition)
- (15) Miller ML, Reygers K, Sanders SJ, Steinberg P. 2007. arXiv:nucl- ex/0701025.
- (16) H. De Vries, C. W. De Jager, and C. De Vries. At Data Nucl Data Tables 36 (1987) 495
- (17) S. Raman, C. W. G. Nestor, Jr and P. Tikkanen, Atom. Data Nucl. Data Tabl. 78 (2001) 1.
- (18) B. Pritychenko, M. Birch, B. Singh and M. Horoi, Atom. Data Nucl. Data Tabl. 107 (2016) 1.
- (19) P. Moller, J. R. Nix, W. D. Myers and W. J. Swiatecki, Atom. Data Nucl. Data Tabl. 59 (1995) 185.
- (20) see https://twiki.cern.ch/twiki/bin/view/Main/LHCGlauberBaseline
- (21) Yao YM, et al. J. Phys. G 33 (2006) 1.
- (22) F. Abeet al.(CDF Collaboration),Phys. Rev. D41 (1990) 2330.
- (23) B. I. Abelev et al. (STAR Collaboration),Phy. Rev. C79 (2009) 034909
- (24) B. Alver and G. Roland, Phy. Rev. C81 (2010) 054905
- (25) B.H. Alver, C.Gombeaud, M.Luzum, and J.Y. Ollitrault,Phys. Rev. C82 (2010) 034913
- (26) X. G. Huang, Rept. Prog. Phys. 79, no.7, 076302 (2016) doi:10.1088/0034-4885/79/7/076302 [arXiv:1509.04073 [nucl-th]].
- (27) Xin-Li Zhao,Guo-Liang Ma and Yu-Gang Ma, Phys. Rev. C99 (2019) 034903
- (28) V.Roy and S.Pu Phys. ReV. C92 (2015) 064902
- (29) B. I. Abelev et al. (STAR Collaboration), Phys. Rev. Lett.103 (2009) 251601
- (30) B. Abelev et al. (ALICE Collaboration),Phys. Rev. Lett. 110(2013) 012301
- (31) John Bloczynskia, Xu-Guang Huanga, Xilin Zhanga and Jinfeng Liaoa, Physics Letters B 718 (2013) 1529
- (32) Irfan Siddique, Xin-Li Sheng and Qun Wang, https://arxiv.org/abs/2106.00478