Elastic Tactile Simulation Towards Tactile-Visual Perception
Abstract.
Tactile sensing plays an important role in robotic perception and manipulation tasks. To overcome the real-world limitations of data collection, simulating tactile response in a virtual environment comes as a desirable direction of robotic research. In this paper, we propose Elastic Interaction of Particles (EIP) for tactile simulation, which is capable of reflecting the elastic property of the tactile sensor as well as characterizing the fine-grained physical interaction during contact. Specifically, EIP models the tactile sensor as a group of coordinated particles, and the elastic property is applied to regulate the deformation of particles during contact. With the tactile simulation by EIP, we further propose a tactile-visual perception network that enables information fusion between tactile data and visual images. The perception network is based on a global-to-local fusion mechanism where multi-scale tactile features are aggregated to the corresponding local region of the visual modality with the guidance of tactile positions and directions. The fusion method exhibits superiority regarding the 3D geometric reconstruction task. Our code for EIP is available at https://github.com/yikaiw/EIP.
1. Introduction
Tactile sensing is one of the most compelling perception pathways for nowadays robotic manipulation, as it is able to capture the physical patterns including shape, texture, and physical dynamics that are not easy to perceive via other modalities, e.g. vision. In recent years, data-driven machine learning approaches have exploited tactile data and exhibited success in a variety of robotic tasks, such as object recognition (liu2017recent, ; huang2016sparse, ), grasp stability detection (kwiatkowski2017grasp, ; zapata2019tactile, ), and manipulation (fang2018dual, ; tian2019manipulation, ) to name some. That being said, the learning-based methods—particularly those involving deep learning—are usually data-hungry and require large datasets for training. Collecting a large real tactile dataset is not easy, since it demands continuous robot control which is time-consuming or even risky considering the hardware wear and tear. Another concern with the real tactile collection is that the data acquired by the sensors of different shapes/materials or under different control policies could be heterogeneously distributed, posing a challenge to fairly assess the effectiveness of different learning methods trained on different tactile datasets.
The simulation of tactile sensing can potentially help overcome these real-world limitations. Yet, establishing a promising tactile simulator is challenging since the tactile sensor needs to be geometrically and physically modeled. In addition, we should be capable of characterizing the physical interaction during the contact process between the sensor and the object which makes simulating tactile data more difficult than other modalities to some extent, such as vision that is solely geometrically aware.
Existing trails that consider simulating tactile interactions with manipulated objects (moisio2013model, ; kappassov2020simulation, ; sferrazza2020learning, ; ding2020sim, ) usually model the tactile sensor as a combination of rigid bodies, and the collision between two objects is described by rigid multi-body kinematics provided by certain off-the-shelf physical engines (such as ODE in (kappassov2020simulation, )). Despite its validity in some cases, considering the tactile sensor as a rigid multi-body will overlook the fact that common tactile sensors are usually elastic but not rigid. For example, the sensors invented by (yuan2017gelsight, ) leverages elastic materials to record the deformation to output tactile sensing. Moreover, in current methods, the segmentation of tactile sensor into rigid bodies is usually coarse and the interaction between rigid bodies is unable to capture the high-resolution sensor-object contact.
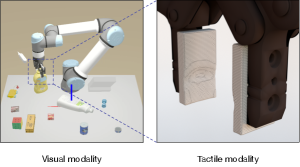
In this paper, we propose a novel methodology for tactile simulation, dubbed as Elastic Interaction of Particles (EIP). EIP first models the tactile sensor as a group of coordinated particles of certain mass and size. By assuming the sensor to be made of elastic materials, the elastic property is applied to constraint the movement of particles (stomakhin2012energetically, ). During the interaction between the sensor and the object, the deformation of particles is recorded as tactile data. An example of the simulated tactile perception is illustrated in Figure 1.
With fine-grained tactile patterns available, in this paper, we further propose a tactile-visual perception method that densely fuses features of both modalities, which exhibits great advantages on the 3D geometric reconstruction task. Multimodal learning can exhibit remarkable benefits against the unimodal paradigm if the patterns of different modalities are aligned and aggregated desirably (ramachandram2017deep, ; journals/ijcv/ValadaMB20, ; wang2020asymfusion, ). However, tactile signals and visual images are not naturally aligned, since these two modalities are collected separately in different viewpoints. The discrepancy of viewpoints leads to geometrically unaligned tactile-visual feature maps. To this end, we design a global-to-local fusion network to integrate the learned tactile features into the visual counterparts. Since our tactile simulation is able to provide the position and direction for each touch, each feature map of the tactile modality is pooled into a global embedding and is then located to a local visual region for feature aggregation. The tactile-visual fusion is conducted densely in the architecture to capture multi-scale resolutions. Finally, inspired by the scheme in Pixel2Mesh (wang2018pixel2mesh, ), the aggregated features of both modalities are further sent to a GNN-based network for vertices deformation.
To sum up, our contributions are two-fold:
-
•
We propose EIP, a novel tactile simulating framework that is capable of modeling the elastic property of the tactile sensor and the fine-grained physical interaction between the sensor and the object. In contrast to existing methods that usually exploit the off-the-shelf physics engine for interaction simulation, the implementation of our method is formulated from scratch, which makes our framework more self-contained and easier to be plugged into downstream robotic applications.
-
•
We propose a global-to-local fusion method to densely aggregates features of tactile and visual modalities. The designed per-pixel fusion method and the feature aggregation process alleviate the misalignment issue of tactile-visual features. Experimental results on 3D geometric reconstruction support the effectiveness of the proposed scheme. We combine EIP with a robotic grasping environment to acquire real-time tactile signals of the manipulated objects, which verifies its potential to downstream robotic tasks.
2. Related Work
Tactile simulaton. The vision-based tactile sensors have become prominent due to their superior performance on robotic perception and manipulation. Data-driven approaches to tactile sensing are commonly used to overcome the complexity of accurately modeling contact with soft materials. However, their widespread adoption is impaired by concerns about data efficiency and the capability to generalize when applied to various tasks. Hence simulation approaches of vision-based tactile sensing are developed recently. Regarding the exploration of tactile simulation, early work (journals/trob/ZhangC00, ) that directly adopts the elastic theory for the mesh interaction resorts to high computation costs. (moisio2013model, ) represents the tactile sensor as a rigid body and calculates the interaction force on each triangle mesh. (habib2014skinsim, ) models the tactile sensor as rigid elements and simulates their displacement by adding a virtual spring, with help of the commonly used Gazebo simulator. Modeling the tactile sensor as one or a combination of independent rigid bodies makes these methods difficult to obtain high-resolution tactile patterns, and these methods also overlook the fact that tactile sensors are mostly elastic materials. (ding2020sim, ) implements the soft body simulation based on the Unity physics engine and trains a neural network to predict the contact information including positions and angles. (gomes2019gelsight, ) introduces an approach for simulating a GelSight tactile sensor in the Gazebo simulator by directly modeling the contact surface, which yet neglects the elastic material of the tactile sensor. Based on the finite-element analysis, (sferrazza2020learning, ) provides a simulation strategy to generate an entire supervised learning dataset for a vision-based tactile sensor, intending to estimate the full contact force distribution from real-world tactile images.
Tactile-visual perception. This paper mainly discusses the application of tactile-visual perception for the 3D reconstruction task. Several previous works combine vision and touch for shape reconstruction which rely on the given point cloud and depth data (DBLP:conf/iros/BjorkmanBHK13, ; DBLP:conf/icra/Watkins-VallsVA19, ; DBLP:journals/ijrr/IlonenBK14, ; DBLP:journals/ras/GandlerEBSB20, ). Under such circumstances, shape reconstruction is less challenging since the real depth data or sparse point cloud at hand directly provides the global 3D information. When global depth is not available, (DBLP:journals/corr/abs-1808-03247, ) proposes to first estimate the depth and normal direction based on the vision and then predicts 3D structure with shape priors. Real-world tactile signals subsequently refine the predicted structure. Instead of predicting the global depth from the visual perception, (DBLP:conf/nips/SmithCRGMMD20, ) focuses on generating the local depth and point cloud from tactile signals, which provides local guidance for the chart deformation when a mass of tactile signals are obtained. (sundaram2019learning, ; edmonds2019tale, ) discuss the tactile-visual perception based on real robotic hands from both functional and mechanistic perspectives. Different from existing methods, our tactile-visual perception framework is self-contained and end-to-end trainable without leveraging the global/local depth or point cloud information. We focus on how to combine geometrically unaligned feature maps for improving fusion performance.
3. Physically Tactile Simulation
In this section, we first introduce how to simulate the physical interaction between the tactile sensor and the targeted object. We then evaluate the effectiveness of our simulated tactile sensor by 3D geometric reconstruction with tactile-visual fusion.
3.1. Overall Framework
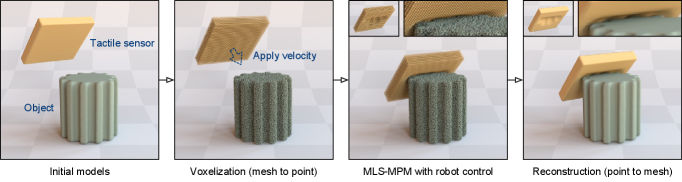
The basic idea of our method is to assume both the tactile sensor and the manipulated object to be solid and model them in the form of particles. Differently, the sensor and the object are considered elastic and rigid respectively. In general, the tactile simulation process depicted in Figure 2 consists of 3 steps: voxelization from meshes to particles, interaction simulation, and reconstruction from particles to meshes. We detail each step below.
Voxelization
We first obtain the triangle meshes from the simulation environment that describe the geometric model of the object/sensor. The inside of each model is filled with dense voxel grids by voxel carving. Briefly, we first calculate the depth maps and then employ these depth maps to carve a dense voxel grid. We refer readers to (Zhou2018, ) for more details. The center of each voxel grid is denoted as a particle, which is the fundamental unit for the following physical interaction simulation.
Interaction Simulation
After voxelization, we apply a certain velocity to the tactile sensor until it touches the object to a certain extent. The interaction process can be represented by the deformation of particles in the tactile sensor. Thus we simulate the deformation process based on Material-Point-Method (MPM) (stomakhin2013material, ) and its modification MLS-MPM (hu2018moving, ) considering both efficacy and efficiency, where we simultaneously apply the specific movement of the tactile sensor under robot control. Details of this step are provided in § 3.2.
Reconstruction
The final step is to reconstruct the meshes based on the positions of particles, which can be accomplished by using the method proposed by (kazhdan2013screened, ). Note that this step is not necessary unless we want to render the interaction at each time step.
3.2. Interaction Simulation
This subsection presents details of how we simulate the interaction process. In practice, the tactile sensor is basically made of elastic materials, and our main focus is on the change of its shape, or called deformation. We apply the elastic theory to constrain the deformation of the particles in the tactile sensor during its interaction with the manipulated object, and the deformation at each time step will be recorded as the tactile sensing data.
Suppose that the sensor is composed of particles. The coordinate of the -th particle is represented by , where throughout our paper. We define the deformation map as . The Jacobian of with respect to the -th particle, denoted as (a.k.a deformation gradient), is calculated by
| (1) |
When the particle deforms, its volume may also change. The volume ratio by the deformation, denoted as , is the determinant of , i.e.,
| (2) |
To describe the stress-strain relationship for elastic materials, we adopt a strain energy density function , a kind of potential function that constrains the deformation . We follow a widely used method called Fixed Corotated (stomakhin2012energetically, ), which computes by
| (3) |
where and are Lamé’s 1st and 2nd parameters, respectively; and are Young’s modulus and Poisson ratio of the elastic material, respectively; is the -th singular value of . The derivative of (a.k.a the first Piola-Kirchhoff stress) will be utilized to adjust the deformation process, derived by
| (4) |
where is obtained via the polar decomposition (higham1986computing, ): .
In the following context, we will characterize how each particle deforms, that is, how its position changes during the interaction phase. For better readability, we distinguish the position and the quantities in Eq. (1-4) at each different time step by adding a temporal superscript, e.g. denoting the velocity at time step as . We leverage MLS-MPM (hu2018moving, ) to update , which divides the whole space into grids of a certain size. For each particle, its velocity is updated as the accumulated velocity of all particles within the same grid, which to some extent can emulate the physical interaction between particles. Specifically, we iterate the following steps for the update of . The flowchart is sketched in Algorithm 1.
Momentum Scattering
For each grid, we collect the mass and the momentum from the particles inside and those within its neighbors. The mass of the -th grid is collected by
| (5) |
where denotes the neighbor grids surrounding grid ; here, only considering the effects of particles in and omitting other distant particles are due to the computational efficiency; collects the indices of the particles located in grid ; denotes the mass of the -th particle; computes the B-Spline kernel negatively related to the distance between the -th grid and the -th particle.
The momentum of the -th grid is derived as
| (6) |
where denotes the position of grid ; is the velocity of particle ; , adopted as an approximated parameter in (hu2018moving, ), is associated to the particle whose update will be specified later; is a fixed coefficient where is the time interval; is the spatial interval between grids; is the initial particle volume.
Velocity Alignment
The velocity on the -th grid can be obtained given the grid momentum and the grid mass by normalization, i.e.,
| (7) |
Note that the grid velocity is only for later parameter updates, and the position of the grid will not change in the simulation.
Robot Hand Movement
Apart from the displacement caused by physical interaction, the sensor will also change its position due to the movement by the robot hand where the sensor is equipped. This additional velocity is a local parameter depending on the position of a particle, and we use a weight to reflect it during the scattering process while keeping its sufficient physical interaction at the contact side. The velocity is thus updated as
| (8) |
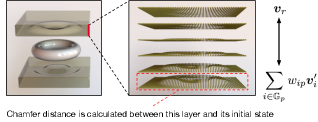
where is the set of grids that the particle adheres to; is the velocity of the robot hand; is proportional to the distance between the particle and the robot hand as illustrated in Figure 3, and the deformation process is provided in Figure 4.
Parameters Gathering
With the updated velocity, we renew the values of the velocity gradient, position vector, and deformation gradient by
| (9) | ||||
| (10) | ||||
| (11) |
Terminal Checking
For safety and keeping consistent with the practical usage, we will terminate the robot hand movement once the deformation of the sensor is out of a certain scope. For this purpose, we use the chamfer distance to measure the distance between the deformed state and the original state of the particles in the contact surface, also illustrated in Figure 3. In form, we compute
| (12) |
where denotes the contact surface between the sensor and the object; for removing the effect of translation brought by , and denotes the center point of .
3.3. Tactile-Visual Multimodal Fusion
CNN-based architectures have shown the superiority in homogeneous multimodal fusion, e.g., RGB-depth fusion (wang2020cen, ), where feature maps of different modalities are naturally aligned. But here, the feature maps of vision and touch are unaligned due to the discrepancy of viewpoint and tactile direction. Existing methods mostly leverage estimated global or local depth for multi-modal alignment. In this section, we propose an end-to-end tactile-visual perceptual framework that directly combines multi-modal features without explicitly predicting depth or sparse point cloud.
Specifically, we focus on the 3D geometric reconstruction of the manipulated objects, where we utilize the simulated tactile signals as complementary information to single-view visual images. During the prediction process, the network input is composed of an image and a set of tactile data obtained from different grasps based on different directions.
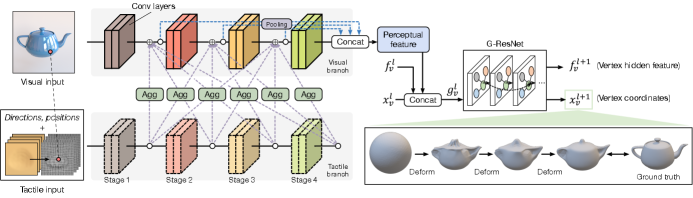
The structure of our tactile-visual perception framework is illustrated in Figure 5. We adopt a visual branch and a tactile branch to process visual and tactile inputs, respectively. We choose ResNet (he2016deep, ) as the backbone network for both branches, and thus there are four stages depicted. Multi-scale tactile features are extracted and densely connected to each network stage in the visual branch for multimodal feature fusion. We then concatenate multi-stage feature maps as a perceptual feature, which is finally sent to a Graph Neural Network (GNN) to predict the vertices deformation of the 3D mesh following the scheme in Pixel2Mesh (wang2018pixel2mesh, ).
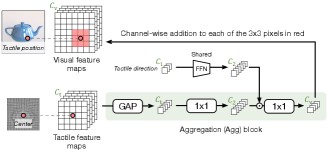
The main contributions of our method include a designed Aggregation (Agg) block and the global-to-local feature fusion method to alleviate the misalignment issue. As illustrated in Figure 6, Agg transforms tactile features before integrating them into the visual branch. The transformation consists of a Global Average Pooling (GAP), which results in a global embedding, and two Conv layers for feature extraction. Given that the touch direction plays an important role in tactile representation, we additionally involve the direction information into our tactile processing, by using a Feed-Forward Network (FFN) (that is shared in different Agg blocks) to produce the direction embedding which is integrated with the tactile global embedding via dot product. Note that in Agg, each Conv layer is followed by a ReLU activation and a batch normalization layer. As described in Sec. 1, the tactile-visual feature maps are not naturally aligned due to the discrepancy of viewpoint and tactile direction. In our tactile generation, we are able to record the position (i.e. the coordinate center of tactile pixels). With the help of the tactile position, we then locate the corresponding local region (the region colored in red in Figure 6) in each visual feature map and then perform addition between the global tactile embedding by Agg and every pixel within the local visual region. It is known that the different-stage layer in neural networks characterizes different-scale patterns. Hence, we conduct the above tactile-visual Agg between every two stages across the tactile and visual branches, to enable multi-scale and delicate fusion.
Inspired by (wang2018pixel2mesh, ), the perceptual feature is sent to a GNN to guide the deformation process of GNN vertices, which are also the vertices of the 3D geometric model to be reconstructed. The geometric model is initialized to an ellipsoid mesh and the deformation is realized by updating 3-dimensional vertices embeddings (coordinates) of GNN. Each vertex on the mesh would be projected to the closest visual feature (wang2018pixel2mesh, ). The deformation update process is illustrated in the right part of Figure 5, and can be formulated as below,
| (13) | ||||
| (14) | ||||
| (15) |
where denotes the perceptual feature learned by tactile-visual fusion, which has been introduced above (annotated in a blue box in Figure 5); denotes the index of the vertex on the mesh; denotes the neighbors of , which is available as the mesh is initially a sphere; are the feature representation and the learned coordinate of vertex for the -th GNN layer, respectively; is the hidden feature given by the concatenation of and a multimodal feature projection on , denoted as ; are learnable weights.
4. Experiment
We implement Algorithm 1 based on Taichi (hu2019taichi, ), and adopt Mitsuba (nimier2019mitsuba, ) for rendering 3D models, e.g. in Figure 2 and Figure 7.
4.1. Effects of Coefficient Settings in EIP
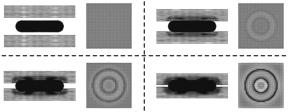
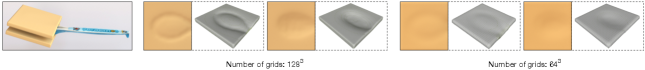
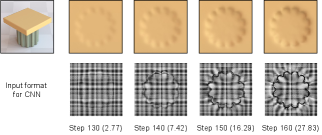
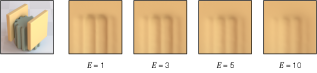
In Figure 7, we provide the tactile patterns when pressing a spoon, and compare the patterns under different grid numbers (described in § 3.2). We observe that the larger the number of grids is the more fine-grained simulation we will attain. We set the grid number as considering the trade-off between efficacy and efficiency. To illustrate how the deformation behaves during the contact, in Figure 8, we keep pressing the tactile sensor on a gear object and record results at different time steps. For each time step, we also provide its corresponding format for CNN input, and the Chamfer distance as described in § 3.2; The deformation becomes more remarkable as the contact proceeds. Figure 9 contrasts the influence by Young’s modulus under the same press displacement. It is shown that the tactile range gets smaller with the increase of Young’s modulus, which is consistent with the conclusion in elastic theory. In our simulation, we choose and in Eq. 3 by default.
4.2. Tactile Dataset
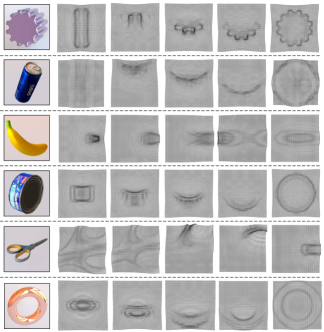
We build a tactile dataset containing 7,000 tactile images of 35 different object classes. These tactile images are collected through different contact policies including press directions and forces. The dataset summary and train/test splits are provided in Table 1. Figure 10 illustrates an example subgroup of the tactile dataset.
Once we obtain the tactile data (namely, the deformation of particles of the sensor), we can apply these data for object recognition which partially evaluates the quality of the tactile data. We suppose the tactile deformation of the contact surface as , where and denote the height and the width of the sensor, respectively, and denotes the final time step. Then, we train a neural network to predict the object label. In practice, we prefer to try several attempts of the touch for more accurate recognition. All the deformation outcomes of different touching, denoted as will be concatenated along the channel direction, leading to , as input of the network .
To predict the object category given tactile patterns, we train a ResNet-18 (he2016deep, ) with ImageNet pretraining. We also conduct prediction experiments with more than one input tactile image. Specifically, during each training iteration, we randomly choose tactile images which are yielded by different press directions to the same object. As introduced in § 3.3, we treat the number of images as the number of the input channel. Table 2 summarizes the accuracies of the tactile perception with the number of input images (touches) from 1 to 10. It reads that increasing the number of touches consistently improves the classification accuracy, and when the number is equal to 10, the accuracy becomes close to , which implies the potential usage of our tactile simulation for real robotic perception.
| Task | Resolution | Training data | Testing data | ||||
| Class | Tacile | Visual | Class | Tacile | Visual | ||
| Classification | 35 | 5,500 | 0 | 35 | 1,500 | 0 | |
| 3D reconstruction | 35 | 6,500 | 650 | 10 | 500 | 50 | |
| 1-touch | 2-touch | 4-touch | 6-touch | 8-touch | 10-touch |
| 36.72.3 | 47.41.6 | 59.71.1 | 81.50.7 | 90.20.6 | 92.90.3 |
| Model | Visual | Tactile | Tactile & Visual | ||||
| 2-touch | 5-touch | 10-touch | 2-touch | 5-touch | 10-touch | ||
| Chart-based (DBLP:conf/nips/SmithCRGMMD20, ) | 13.65 | - | 25.06 | 17.44 | - | 8.10 | 5.83 |
| Ours | 14.07 | 28.70 | 21.91 | 15.65 | 10.27 | 7.22 | 5.32 |
| Model | Bottle | Bowl | Can | Conditioner | Cube | Fork | Gear | Pepsi | Spoon | Scissors | Average |
| Chart-based (DBLP:conf/nips/SmithCRGMMD20, ) | 7.02 | 6.50 | 5.27 | 4.31 | 5.65 | 4.79 | 7.45 | 5.77 | 4.95 | 6.62 | 5.83 |
| Ours | 6.23 | 7.41 | 4.62 | 3.57 | 4.71 | 5.04 | 7.13 | 4.79 | 3.86 | 5.82 | 5.32 |
| W/o GAP | 8.75 | 11.24 | 8.08 | 6.30 | 6.29 | 6.75 | 10.74 | 6.16 | 9.95 | 6.47 | 8.07 |
| W/o tactile direction | 8.12 | 9.54 | 6.79 | 5.01 | 6.04 | 6.10 | 8.61 | 6.22 | 4.90 | 6.30 | 6.76 |
| per-pixel fusion | 7.55 | 8.18 | 6.34 | 4.97 | 6.18 | 4.92 | 7.51 | 5.77 | 3.67 | 5.53 | 6.06 |
| per-pixel fusion | 6.80 | 7.10 | 5.66 | 5.73 | 5.36 | 5.17 | 8.73 | 4.65 | 5.36 | 6.69 | 6.13 |
| Single-stage fusion | 6.75 | 8.06 | 5.38 | 4.20 | 5.29 | 4.91 | 8.10 | 5.75 | 4.74 | 6.20 | 5.94 |
4.3. Tactile-Visual Mesh Reconstruction
In this part, we assess the performance of 3D mesh prediction given a single-view image and a certain number of simulated tactile data by our method. The evaluation is accomplished on 3D mesh models of 10 classes. We collect visual images under random view and tactile data from different press directions. Per each training iteration, we randomly sample 1 visual image and 110 tactile images as the network input. We perform random deformation on meshes so that there are no intersections of 3D meshes for training and testing.
We adopt ResNet-18 as our tactile-visual perception backbone and resize both visual and tactile images to the resolution . In addition, we adopt the cosine learning rate scheduler with an initial learning rate , and we train 50 epochs in total.
The quantitative comparison is provided in Table 3, where we calculate the average Chamfer distance as the evaluation metric by sampling both 1,000 points from the predicted and target meshes. We vary the input number of tactile images from 2 to 10 in analogy to the perception task before. Even surprisingly, our method with only 2 touches is sufficient to gain a smaller reconstruction error than Pixel2Mesh (the Visual column in the table), and the error will become much smaller if we increase the number to 10. Table 3 also provides comparison results with a current SOTA the Chart-based method (DBLP:conf/nips/SmithCRGMMD20, ) which adopts estimated local depth and point cloud for tactile-visual fusion. We use the public codes by the authors and share their default setting of generating 5 touches at each time. Thus, the tactile input by (DBLP:conf/nips/SmithCRGMMD20, ) could only be the multiplier of 5 (5, 10, etc). According to the results in Table 3, our method surpasses the current the Chart-based method with a large margin, probably thanks to the more elaborate multimodal fusion in our method.
Table 4 provides detailed evaluation results for each of the 10 classes. We also perform ablation studies to verify the effectiveness of each component that we propose. The ablation variants include:
-
•
W/o GAP: the global average pooling is removed from our model and the feature maps of tactile and visual modalities are fused pixel-by-pixel. This ablation study is to justify the validity of our global-to-local fusion by GAP on alleviating multimodal feature misalignment.
-
•
W/o tactile direction: the learned embedding of tactile direction (as illustrated in Figure 6) is no longer integrated with the Agg embedding.
-
•
per-pixel fusion: as illustrated in Figure 6, each aggregated tactile embedding is added to the visual pixels. We change to 1 single visual pixel to observe if attending the local region is necessary.
-
•
per-pixel fusion: conversely, we change to to see whether the performance is benefited from a larger visual receptive field.
-
•
Single-stage fusion: we remove the dense multi-scale connections between the tactile and visual branches and only allow one connection between each corresponding stage.
Observed from Table 4, we have the following findings:
-
•
GAP plays an essential role in our tactile-visual perception method, as removing GAP leads to noticeable performance drops regarding all objects especially for those elaborate ones (e.g. spoon). This is possibly because adopting GAP helps alleviate the misalignment issue of multimodal features as mentioned in § 3.3.
-
•
The tactile direction is also crucial in replenishing the information in tactile embeddings, since the generation of tactile data depends on what touch direction we apply.
-
•
For some elaborate objects, e.g. spoon and scissors, adopting per-pixel fusion can achieve promising or even better performance than the default setting; similarly, yields the superiority accuracy regarding some uniform objects. Overall, the setting comes as the best choice for general classes of the evaluated objects.
-
•
Performing single-stage fusion still produces desired results, but it is inferior to the multi-scale version.
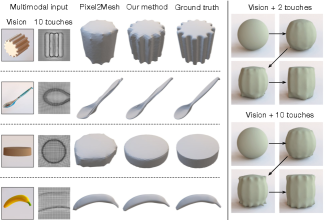
Figure 11 displays the generation process of the 3D mesh models. We compare our method with Pixel2Mesh (wang2018pixel2mesh, ) that only adopts the visual input. Qualitatively, by adding the tactile input, our approach obtains better predictions than Pixel2Mesh in Figure 11. The experimental results here well verify the power of our tactile simulation in capturing the fine-grained patterns of the touched object.
4.4. Robot Environment Integration
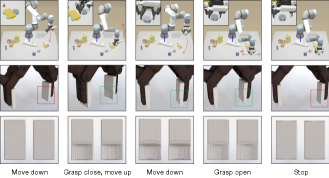
We integrate our tactile simulation with the robot environment, to perform the pick-and-place task for several different objects. We first fuse RGB and depth information to get the corresponding semantic segmentation based on the multimodal fusion method in (wang2020cen, ). With the segmentation at hand, we detect the 3D position of the can and then pick it up and finally put it down at a different place. The whole process is depicted in Figure 12, below which we plot the corresponding tactile simulation for each phase. We observe that our tactile simulation does encode the cylinder shape of the can. Besides, the last column shows that the simulated tactile sensor can return to its original state after the grasping process.
5. Conclusion
In this work, we propose Elastic Interaction of Particles (EIP), a new method to simulate interactions between the tactile sensor and the object during robot manipulation. Different from existing tactile simulation methods, our design is based on the elastic interaction of particles, which allows much more accurate simulation with high resolution. Based on our tactile simulation, we further propose a global-to-local tactile-vision perception method for 3D geometric mesh reconstruction. Detailed experimental results verify the effectiveness of our tactile simulation and the proposed tactile-visual perception scheme.
Acknowledgement
This research is jointly funded by Major Project of the New Generation of Artificial Intelligence, China (No. 2018AAA0102900), the Sino-German Collaborative Research Project Crossmodal Learning (NSFC 62061136001/DFG TRR169), and sponsored by CAAI-Huawei MindSpore Open Fund.
References
- (1) Björkman, M., Bekiroglu, Y., Hogman, V., Kragic, D.: Enhancing visual perception of shape through tactile glances. In: IROS (2013)
- (2) Ding, Z., Lepora, N.F., Johns, E.: Sim-to-real transfer for optical tactile sensing. In: ICRA (2020)
- (3) Edmonds, M., Gao, F., Liu, H., Xie, X., Qi, S., Rothrock, B., Zhu, Y., Wu, Y.N., Lu, H., Zhu, S.C.: A tale of two explanations: Enhancing human trust by explaining robot behavior. In: Science Robotics (2019)
- (4) Fang, B., Sun, F., Yang, C., Xue, H., Chen, W., Zhang, C., Guo, D., Liu, H.: A dual-modal vision-based tactile sensor for robotic hand grasping. In: ICRA (2018)
- (5) Gandler, G.Z., Ek, C.H., Björkman, M., Stolkin, R., Bekiroglu, Y.: Object shape estimation and modeling, based on sparse gaussian process implicit surfaces, combining visual data and tactile exploration. Robotics Auton. Syst. (2020)
- (6) Gomes, D.F., Wilson, A., Luo, S.: Gelsight simulation for sim2real learning. In: ICRA ViTac Workshop (2019)
- (7) Habib, A., Ranatunga, I., Shook, K., Popa, D.O.: Skinsim: A simulation environment for multimodal robot skin. In: CASE (2014)
- (8) He, K., Zhang, X., Ren, S., Sun, J.: Deep residual learning for image recognition. In: CVPR (2016)
- (9) Higham, N.J.: Computing the polar decomposition—with applications. In: SIAM Journal on Scientific and Statistical Computing (1986)
- (10) Hu, Y., Fang, Y., Ge, Z., Qu, Z., Zhu, Y., Pradhana, A., Jiang, C.: A moving least squares material point method with displacement discontinuity and two-way rigid body coupling (2018)
- (11) Hu, Y., Li, T.M., Anderson, L., Ragan-Kelley, J., Durand, F.: Taichi: a language for high-performance computation on spatially sparse data structures. In: TOG (2019)
- (12) Huang, W., Sun, F., Cao, L., Zhao, D., Liu, H., Harandi, M.: Sparse coding and dictionary learning with linear dynamical systems. In: CVPR (2016)
- (13) Ilonen, J., Bohg, J., Kyrki, V.: Three-dimensional object reconstruction of symmetric objects by fusing visual and tactile sensing. Int. J. Robotics Res. (2014)
- (14) Kappassov, Z., Corrales-Ramon, J.A., Perdereau, V.: Simulation of tactile sensing arrays for physical interaction tasks. In: AIM (2020)
- (15) Kazhdan, M., Hoppe, H.: Screened poisson surface reconstruction. In: TOG (2013)
- (16) Kwiatkowski, J., Cockburn, D., Duchaine, V.: Grasp stability assessment through the fusion of proprioception and tactile signals using convolutional neural networks. In: IROS (2017)
- (17) Liu, H., Wu, Y., Sun, F., Guo, D.: Recent progress on tactile object recognition. In: International Journal of Advanced Robotic Systems (2017)
- (18) Moisio, S., León, B., Korkealaakso, P., Morales, A.: Model of tactile sensors using soft contacts and its application in robot grasping simulation. In: Robotics and Autonomous Systems (2013)
- (19) Nimier-David, M., Vicini, D., Zeltner, T., Jakob, W.: Mitsuba 2: A retargetable forward and inverse renderer. In: TOG (2019)
- (20) Ramachandram, D., Taylor, G.W.: Deep multimodal learning: A survey on recent advances and trends. In: IEEE Signal Processing Magazine (2017)
- (21) Sferrazza, C., Bi, T., D’Andrea, R.: Learning the sense of touch in simulation: a sim-to-real strategy for vision-based tactile sensing. In: arXiv preprint arXiv:2003.02640 (2020)
- (22) Smith, E.J., Calandra, R., Romero, A., Gkioxari, G., Meger, D., Malik, J., Drozdzal, M.: 3d shape reconstruction from vision and touch. In: NeurIPS (2020)
- (23) Stomakhin, A., Howes, R., Schroeder, C., Teran, J.M.: Energetically consistent invertible elasticity. In: ACM SIGGRAPH/Eurographics (2012)
- (24) Stomakhin, A., Schroeder, C., Chai, L., Teran, J., Selle, A.: A material point method for snow simulation. In: TOG (2013)
- (25) Sundaram, S., Kellnhofer, P., Li, Y., Zhu, J.Y., Torralba, A., Matusik, W.: Learning the signatures of the human grasp using a scalable tactile glove. In: Nature (2019)
- (26) Tian, S., Ebert, F., Jayaraman, D., Mudigonda, M., Finn, C., Calandra, R., Levine, S.: Manipulation by feel: Touch-based control with deep predictive models. In: ICRA (2019)
- (27) Valada, A., Mohan, R., Burgard, W.: Self-supervised model adaptation for multimodal semantic segmentation. In: IJCV (2020)
- (28) Wang, N., Zhang, Y., Li, Z., Fu, Y., Liu, W., Jiang, Y.G.: Pixel2mesh: Generating 3d mesh models from single rgb images. In: ECCV (2018)
- (29) Wang, S., Wu, J., Sun, X., Yuan, W., Freeman, W.T., Tenenbaum, J.B., Adelson, E.H.: 3d shape perception from monocular vision, touch, and shape priors (2018)
- (30) Wang, Y., Huang, W., Sun, F., Xu, T., Rong, Y., Huang, J.: Deep multimodal fusion by channel exchanging. In: NeurIPS (2020)
- (31) Wang, Y., Sun, F., Lu, M., Yao, A.: Learning deep multimodal feature representation with asymmetric multi-layer fusion. In: ACM MM (2020)
- (32) Watkins-Valls, D., Varley, J., Allen, P.K.: Multi-modal geometric learning for grasping and manipulation. In: ICRA. pp. 7339–7345 (2019)
- (33) Yuan, W., Dong, S., Adelson, E.H.: Gelsight: High-resolution robot tactile sensors for estimating geometry and force. In: Sensors (2017)
- (34) Zapata-Impata, B.S., Gil, P., Torres, F.: Tactile-driven grasp stability and slip prediction. In: Robotics (2019)
- (35) Zhang, H., Chen, N.N.: Control of contact via tactile sensing. In: IEEE Trans. Robotics Autom. (2000)
- (36) Zhou, Q.Y., Park, J., Koltun, V.: Open3D: A modern library for 3D data processing. In: arXiv:1801.09847 (2018)