Effects of Floquet Engineering on the Coherent Exciton Dynamics in Monolayer WS2
Abstract
Coherent optical manipulation of electronic bandstructures via Floquet Engineering is a promising means to control quantum systems on an ultrafast timescale. However, the ultrafast switching on/off of the driving field comes with questions regarding the limits of validity of the Floquet formalism, which is defined for an infinite periodic drive, and to what extent the transient changes can be driven adibatically. Experimentally addressing these questions has been difficult, in large part due to the absence of an established technique to measure coherent dynamics through the duration of the pulse. Here, using multidimensional coherent spectroscopy we explicitly excite, control, and probe a coherent superposition of excitons in the and valleys in monolayer WS2. With a circularly polarized, red-detuned, pump pulse, the degeneracy of the and excitons can be lifted and the phase of the coherence rotated. We demonstrate phase rotations during the 100 fs driving pulse that exceed , and show that this can be described by a combination of the AC-Stark shift of excitons in one valley and Bloch-Siegert shift of excitons in the opposite valley. Despite showing a smooth evolution of the phase that directly follows the intensity envelope of the pump pulse, the process is not perfectly adiabatic. By measuring the magnitude of the macroscopic coherence as it evolves before, during, and after the pump pulse we show that there is additional decoherence caused by power broadening in the presence of the pump. This non-adiabaticity may be a problem for many applications, such as manipulating q-bits in quantum information processing, however these measurements also suggest ways such effects can be minimised or eliminated.
I Introduction
Using light to manipulate the properties of condensed matter can enable ultrafast control of charge carrier densities [1], spin [2, 3] and pseudospin [4] of quasiparticles, band structures [5] or quantum [6, 7, 8] and topological [9] phase transitions. These transient changes can be used for ultrafast switching in classical information processing, implemented in parallel and with spatial control of the light to enable neuromorphic computing [10], or to enable future quantum technologies. The extent to which this ultrafast control can proceed adiabatically will determine the feasibility of realizing quantum technologies driven by ultrafast laser pulses. In many cases, however, experimentally determining the adiabaticity of these ultrafast processes is difficult, with no established method to measure the coherent electron dynamics through the pulse duration [11, 12].
Semiconducting monolayer transition metal dichalcogenides (TMDCs) offer unique opportunities for control [11, 13, 14, 15, 16, 4, 17, 18, 19, 20, 21, 22, 23]. In these materials, the degenerate, direct band gaps at the and points in momentum space couple selectively to left- and right-circularly polarized light, respectively [24, 25]. This facilitates valley selective control of the bands, as has been demonstrated through the valley selective AC-Stark effect [13, 14], and Bloch-Siegert effect [16]. These effects can be viewed as specific cases of Floquet engineering, where the periodic electric field of the light dresses the equilibrium bandstructure. Control of bandstructures via Floquet engineering is attracting significant interest due to the potential to realise ultrafast transitions between different quantum and topological phases [26, 27]. For example, the opposite Berry curvature at each valley in monolayer TMDCs has subsequently led to proposals to realise a Floquet topological insulator phase [14, 28], similar to what has been achieved in graphene [9]. The utility of such phase transitions is dependent on the process proceeding adiabatically, which in part requires that the switching on of the Floquet driving does not introduce any non-adiabatic dynamics.
The valley selective AC-Stark effect has also been used to manipulate the phase of an inter-valley coherence in WSe2 [4]. That is, a coherent superposition of degenerate and excitons () was generated [29, 30] and its phase rotated by the valley selective AC-Stark effect lifting the degeneracy for the duration of the driving pulse. Coherent optical manipulation such as this has potential for quantum information processing, but also provides a means to determine whether the turning on/off of the Floquet drive and shifting of the bands is adiabatic. Signatures that it is would include a smooth (and reversible) evolution of the phase and no additional decoherence.
Here we utilise multidimensional coherent spectroscopy (MDCS) [31, 32, 33, 34, 35] to create an inter-valley coherence in monolayer WS2 and measure the pump induced changes to the amplitude and phase. While previous measurements of the phase rotation of the inter-valley coherence relied on measuring the polarization of the emitted photoluminescence and suffered from temporal and spatial averaging effects, our approach directly measures the phase and amplitude of the coherence within the fs window of the final MDCS pulse. We demonstrate a phase shift of the inter-valley coherence that arises primarily from the AC-Stark shift in one valley, but is offset by the Bloch-Siegert shift in the opposing valley. With 10 fs time resolution, these measurements show that the phase evolves smoothly and that the shift of the bands closely follows the instantaneous intensity of the pump pulse. However, by monitoring the amplitude of the third order signal before, during, and after the pump pulse we reveal that the total macroscopic coherence is reduced irreversibly as a result of power broadening of the exciton states, thereby indicating that this band structure control is not purely adiabatic.
II Experimental methods
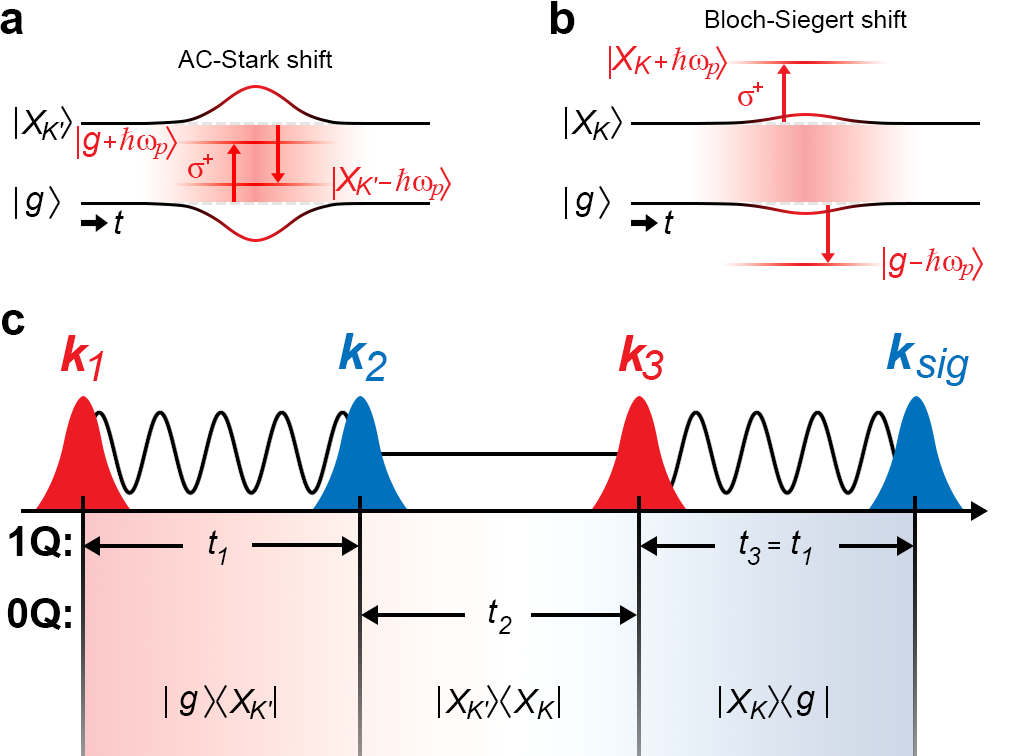
In these MDCS measurements the first two optical excitation pulses (with wavevector and and opposite circular polarization) resonantly excite the inter-valley exciton coherence , as shown schematically in Fig. 1(c). This zero-quantum (0Q) coherence (so-called because the energy separation of the states in superposition is small relative to the laser photon energy) evolves during the time delay until the third pulse (with wavevector ) converts the 0Q-coherence into a third-order polarization (), which radiates as the four-wave mixing signal [35, 36]. Using heterodyne detection, we measure both the amplitude and phase of this signal as a function of emission energy () and inter-pulse delays [35], as described in Appendix B. In these ensemble measurements, the signal amplitude reflects the degree of coherence and its evolution is used to reveal and quantify decoherence. The signal phase is determined by the phase of each excitation pulse and the phase evolution of coherences during the inter-pulse delays: . Here, is equal to the energy separation of states in superposition during the inter-pulse delay. To study the dynamics of the inter-valley exciton coherence, we scan . Under equilibrium conditions, the degeneracy of the and excitons means there is no evolution of the phase of the inter-valley coherence (and hence no evolution in the phase of the signal) as a function of . Consistent with previous measurements [30, 32, 34, 37], we show that this inter-valley coherence has a decoherence time of fs.
The introduction of the red-detuned polarized pump pulse 150 fs after and lifts the degeneracy of the and excitons, as depicted in Fig. 1(a) and (b). As a result, the phase of the inter-valley coherence evolves while the pump is present, which is reflected in a phase rotation of the measured signal.
With a polarized pump pulse, the AC-Stark effect and Bloch-Siegert effect cause a blue-shift of the and exciton state energies, respectively [16], as depicted in Fig. 1(a) and (b). While the shift in both valleys is in the same direction the magnitudes of the shift are different, which breaks the K-K’ degeneracy, albeit with a reduced energy difference relative to an isolated AC-Stark shift. To isolate the effects of the AC-Stark and Bloch-Siegert effects, we measure the signal evolution as a function of without any optical pump and with a circularly polarized pump arriving 230 fs before . In this case, the polarized pulse generates a coherence between the ground state, , and the valley exciton state: , which evolves over with a frequency given by the A-exciton energy in monolayer WS2 of 2.07 eV. With the () polarized pump arriving 230 fs before , the AC-Stark effect (Bloch-Siegert effect) will shift the valley exciton and perturb the evolution of the coherence.
III Results and discussion
III.1 Manipulation of coherence phase
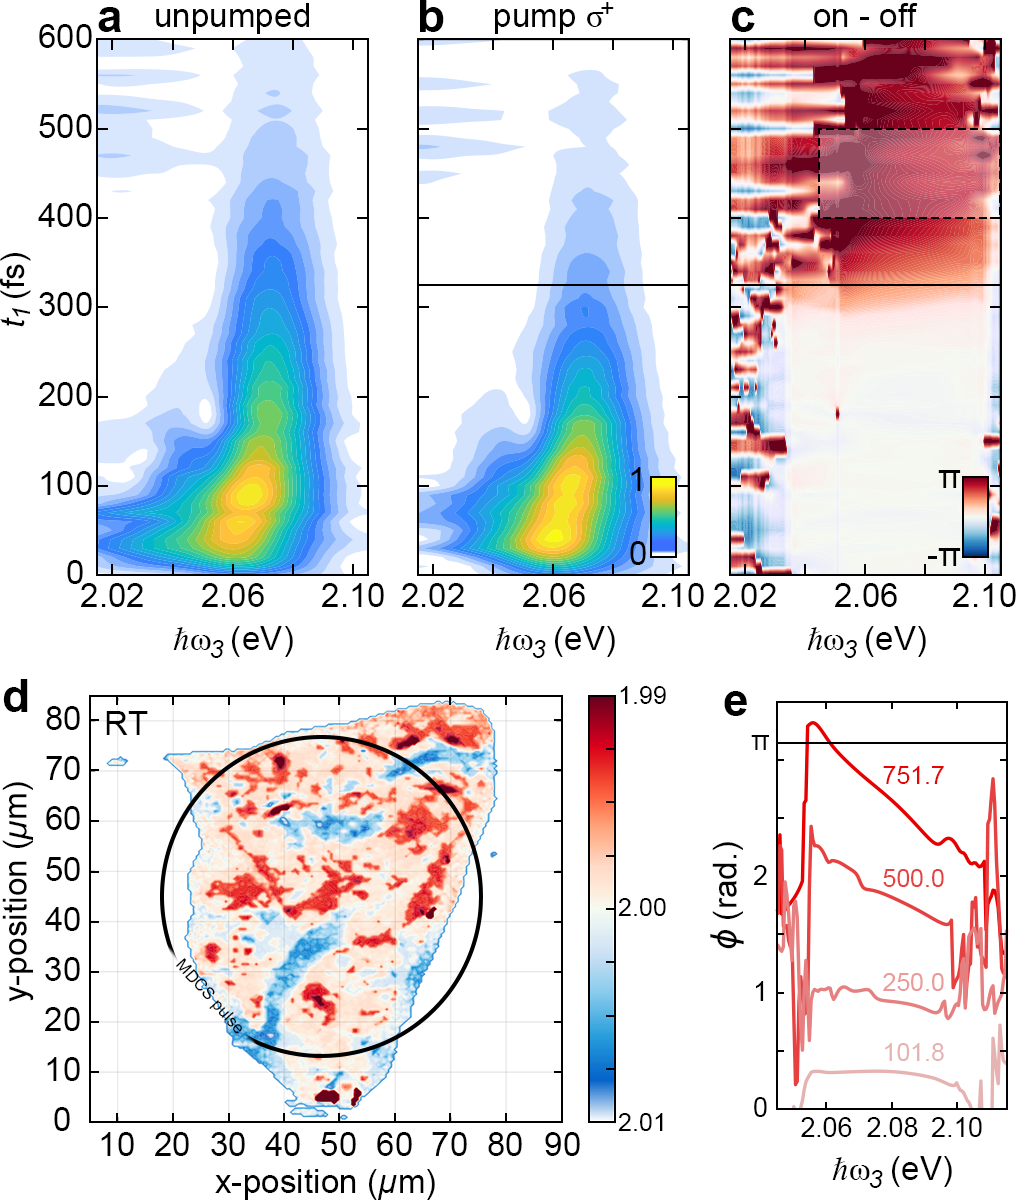
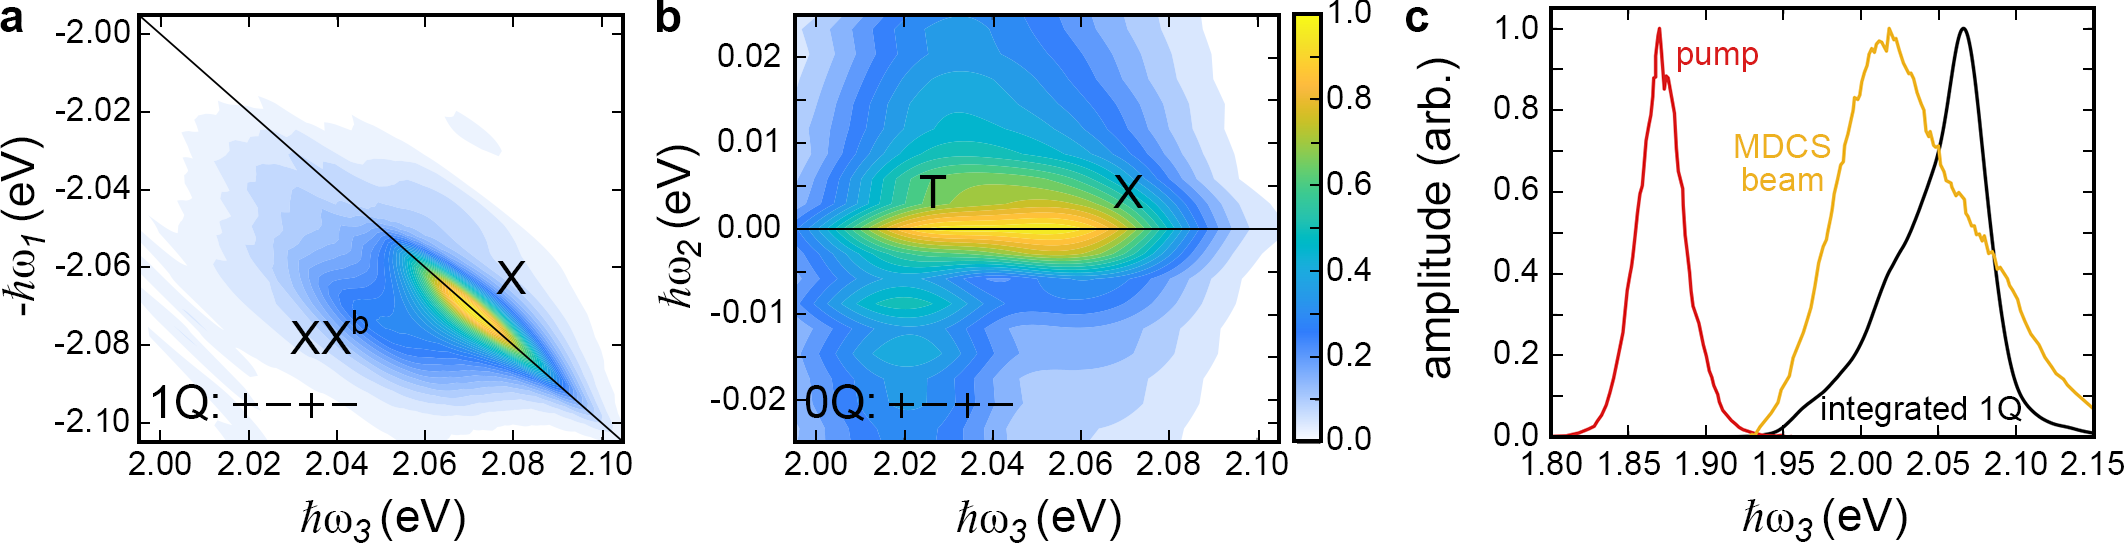
Figure 2(a) shows the signal amplitude as a function of and (the energy of the emitted photons), in the absence of any pump pulse, with the sample temperature at 4 K. Two peaks at eV and eV are evident and attributed to the A-exciton and trion, respectively [38, 39, 40, 34]. The exciton peak decays as a function of due to decoherence of the coherence, with the decoherence time, , determined to be fs. The 2D spectrum, obtained by Fourier transforming with respect to , is shown in Appendix B and is similar to previously reported 2D spectra [31, 30, 32, 33, 34, 41, 37, 42].
The changes to the amplitude and phase of the signal induced by a polarized pump pulse, with fluence of 751.7 µJ/cm2 and detuned by 200 meV, can be seen in Fig. 2(b) and (c), respectively. For delays 250 fs, the pump arrives before and has no influence on the signal amplitude or phase. For delays 400 fs, the pump arrives after , and before and , such that the system is in a coherence when the pump arrives (Fig. 1(c)). The pump induces both a drop in signal amplitude (evident for fs) and a phase shift that increase from 0 to between fs and fs.
It is evident in Fig. 2(c) that the phase shift arising from the AC-Stark shift varies as a function of . Figure 2(e) plots the average phase shift between 400 and 500 fs for several pump fluences and clearly shows the significant decrease in phase shift as increases. The distribution of values comes from the inhomogeneous broadening of the exciton energy across the sample, as shown in Fig. 2(d), and leads to an increase in the magnitude of the pump detuning as increases. The dependence of the phase shift is thus consistent with the expectation that the magnitude of the AC-Stark shift scales inversely with pump detuning [13, 14].
III.2 Phase dynamics and total phase shift
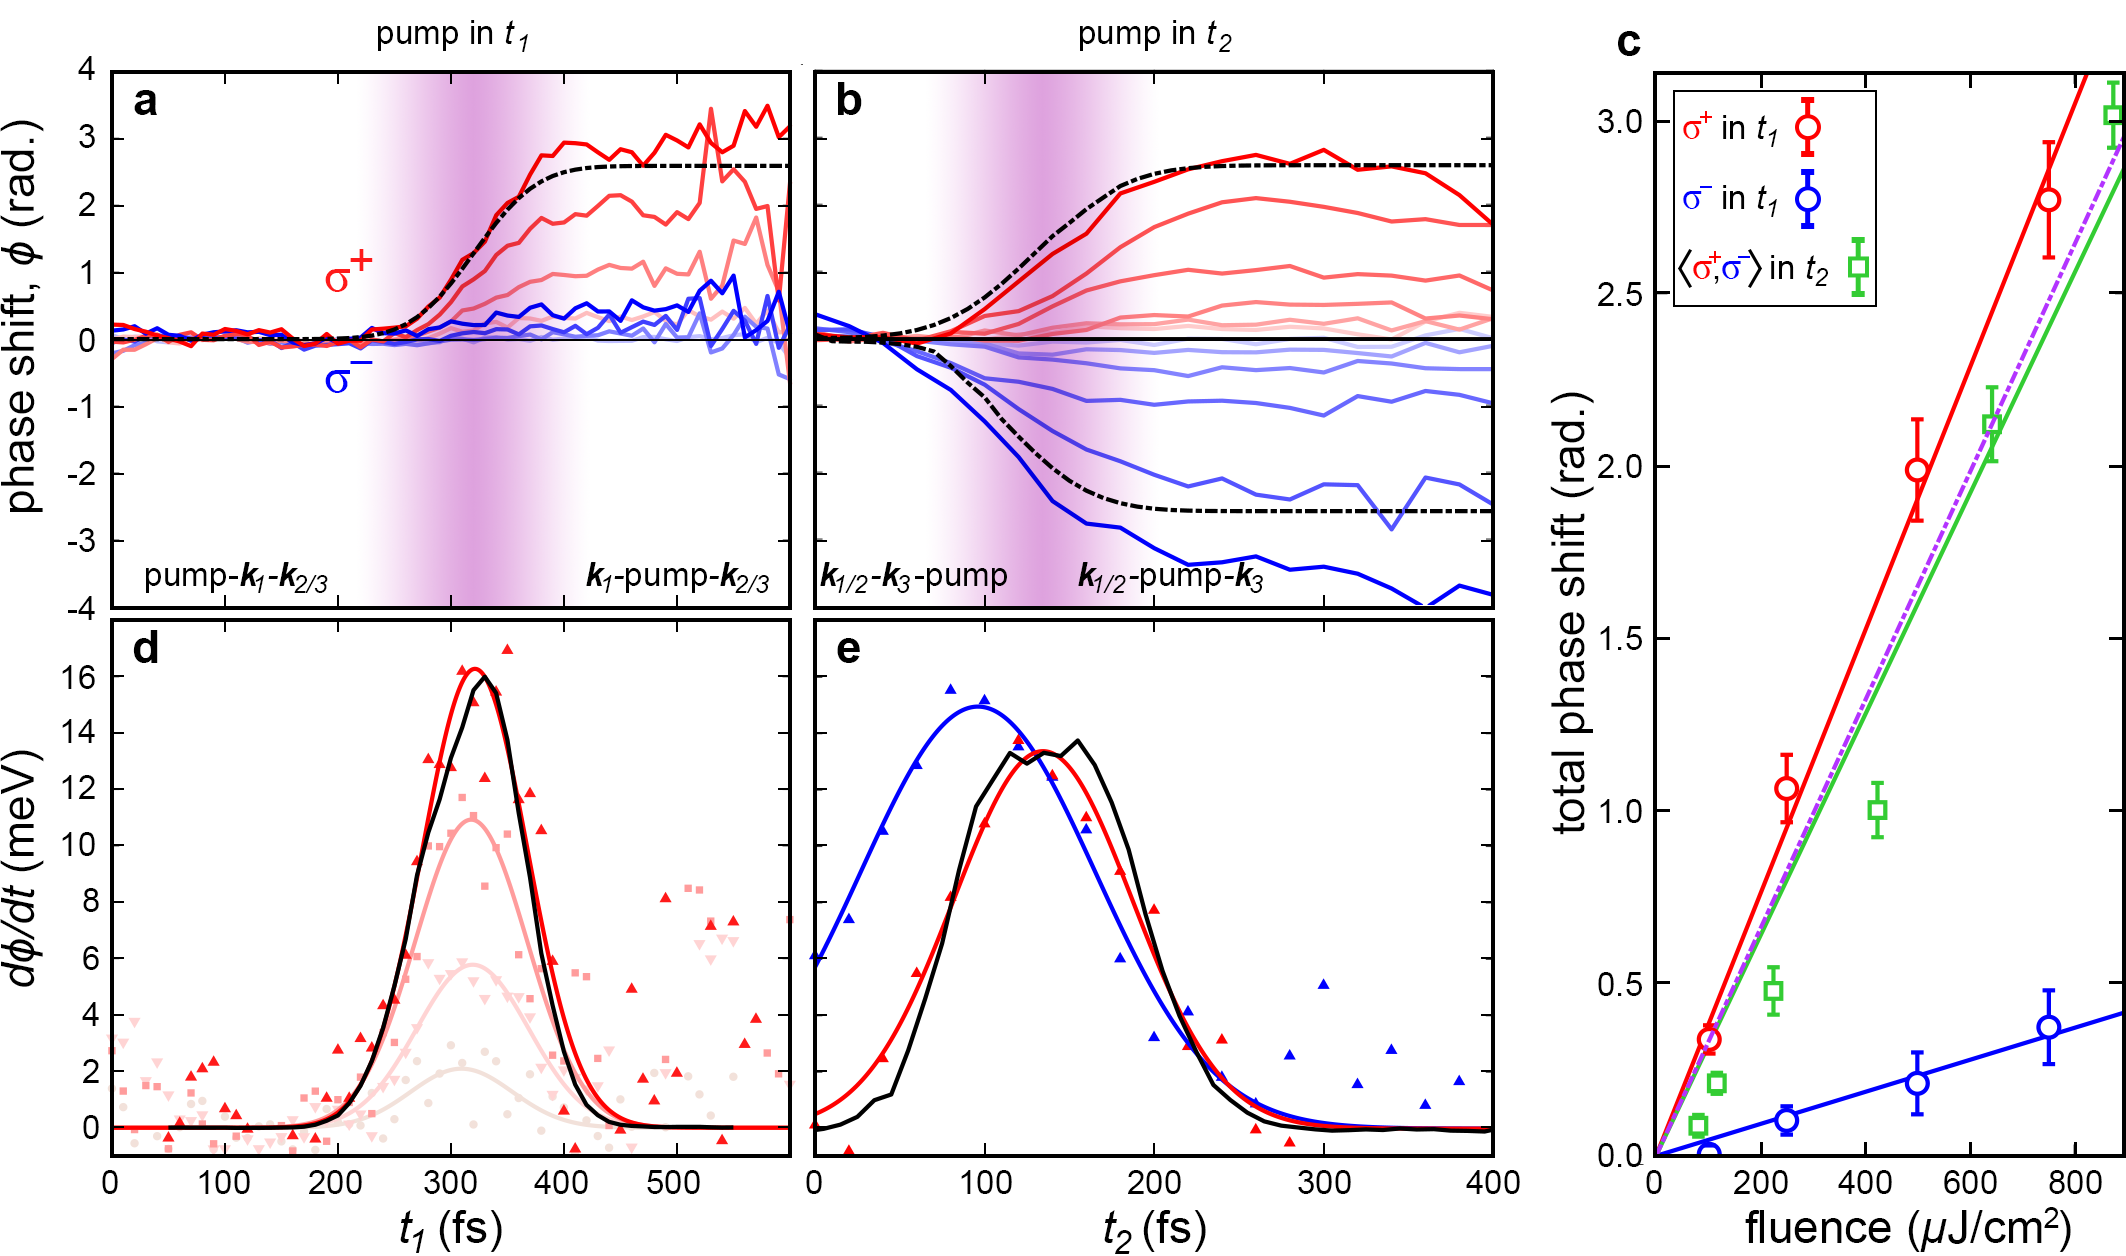
The evolution of the measured phase difference as a function of , obtained by taking a slice at the exciton energy ( eV), is shown in Fig. 3(a) for different pump fluences and polarizations (see Supplementary Material available at **** for the spectrally-resolved data). The induced phase shift increases as the pulse is scanned through the pump pulse, up to a total accumulated phase shift of for the highest fluence. The magnitude of this phase shift varies linearly with intensity, as expected for the AC-Stark shift and shown in Fig. 3(c). With the polarized pump the AC-Stark shift occurs on the state, which should not affect the measured signal because the system is in a coherence when the pump arrives and is thus insensitive to instantaneous changes in the other valley. The Bloch-Siegert effect will, however, cause a blue-shift of the state [16, 21, 22], and is the source of the phase shift observed in this case. This phase shift is much smaller than in the case of the polarized pump, but still linear with fluence, as shown in Fig. 3(c).
The magnitude of the AC-Stark shift () and Bloch-Siegert shift () are given by
| (1) |
| (2) |
where µ is the dipole matrix element for the and excitons and is the electric field amplitude [16]. With a red-detuned pump energy of 1.87 eV and exciton energy 2.07 eV, the expected ratio between the AC-Stark shift and Bloch-Siegert shift is 19.7. The measured ratio of slopes in Fig. 3(c) is . This suggest the measured Bloch-Siegert shift is approximately a factor of two larger than would be expected based on the measured AC-Stark shift. This discrepancy cannot be explained by the polarization purity of the pump or MDCS pulses (as discussed in detail in the Supplementary Material), but may arise from Coulomb interactions and the presence of higher energy bands in WS2, which are excluded from the two-level framework used to derive Eq. 1 and 2, and are expected to affect the AC-Stark and Bloch-Siegert shifts differently [21, 22, 23].
To observe the effect of the pump on the inter-valley coherence, the pump was shifted to arrive 150 fs after and , which arrived simultaneously. The phase of the signal at the exciton energy is plotted in Fig. 3(b) as a function of . Here, for fs the pump arrives after and actually acts on the coherence. For fs the pump is acting on the inter-valley coherence. Figure 3(b) shows that phase shifts with approximately equal magnitude, but opposite sign, were observed for the two pump polarizations. The evolution of the inter-valley coherence is given by and shifts to either the or energy will lead to a phase shift. With the highest pump fluence of 875 µJ/cm2 a phase shift of the inter-valley exciton coherence was realized.
The total phase shift, obtained by averaging the phase shift between fs and fs, is plotted as a function of pump fluence in Fig. 3(c) (green line). A linear trend is again observed, however, the slope is slightly smaller than for the case of the AC-Stark shift on the coherence. In fact, the slope of the total phase shift when the pump is in and acting on the coherence is equivalent to the difference between the isolated slopes of the AC-Stark effect and Bloch-Siegert effects (dashed line in Fig. 3(c)), acquired when the pump was in . This arises because , and are both blue-shifted (by the AC-Stark shift and Bloch-Siegert shift, respectivley), and thus the energy difference between them (and hence accumulated phase shift) is given by the difference between the two effects. That is, the two effects act to counter one another when rotating the phase of the coherence.
The shaded regions in Fig. 3(a) and (b) indicate the delay range where the pump overlaps with the pulse being scanned ( and respectively). In these regions the dynamics of the phase accumulation can be observed. The rate of change of the phase is determined by the induced energy shifts, i.e. the coherence evolves as . The time dependent energy shift can thus be determined by differentiating the measured phase shift: . This is shown in Fig. 3(d) for a polarized pump in . A Gaussian fit to the instantaneous AC-Stark shift (red lines) closely resembles the temporal profile of the measured cross-correlation between the pump and the MDCS excitation beams (black line). This indicates that within the temporal resolution afforded by the 31 fs pulse, the AC-Stark shift follows the intensity of the pump pulse envelope. The peak AC-Stark shift measured is 16 meV for the highest pump fluence of 751.7 µJ/cm2 111The measured evolution of the Stark shift arises from a convolution of the pulse and the pump-induced shift, hence the actual peak shift will be slightly higher than the one obtained directly from the measurement. Similarly, with the polarized pump in the measured time dependent AC-Stark shift follows the cross-correlation between the pump and the MDCS beam (Fig. 3(e)). With the polarized pump, the peak is broader and shifted to shorter times because in this case, for fs, the system is in a coherence when the pump arrives, and is affected by the AC-Stark shift.
The dynamics of the AC-Stark and Bloch-Siegert shifts are modelled by incorporating these shifts as phenomenological perturbations to the state energies in simulations of the MDCS experiments (see Appendix D for details). There were no free parameters in the model (all were determined directly from experiment) and it was assumed that the AC-Stark and Bloch-Siegert shifts followed exactly the instantaneous intensity of the 100 fs pump pulse. The results are shown as dashed lines in Fig. 3(a) and (b). The close agreement between experiment and simulation further suggests that all details of the shifts are captured in the model and that the phase evolves smoothly as the energy shifts follow the instantaneous intensity of the pump pulse.
III.3 Power broadening and loss of macroscopic coherence
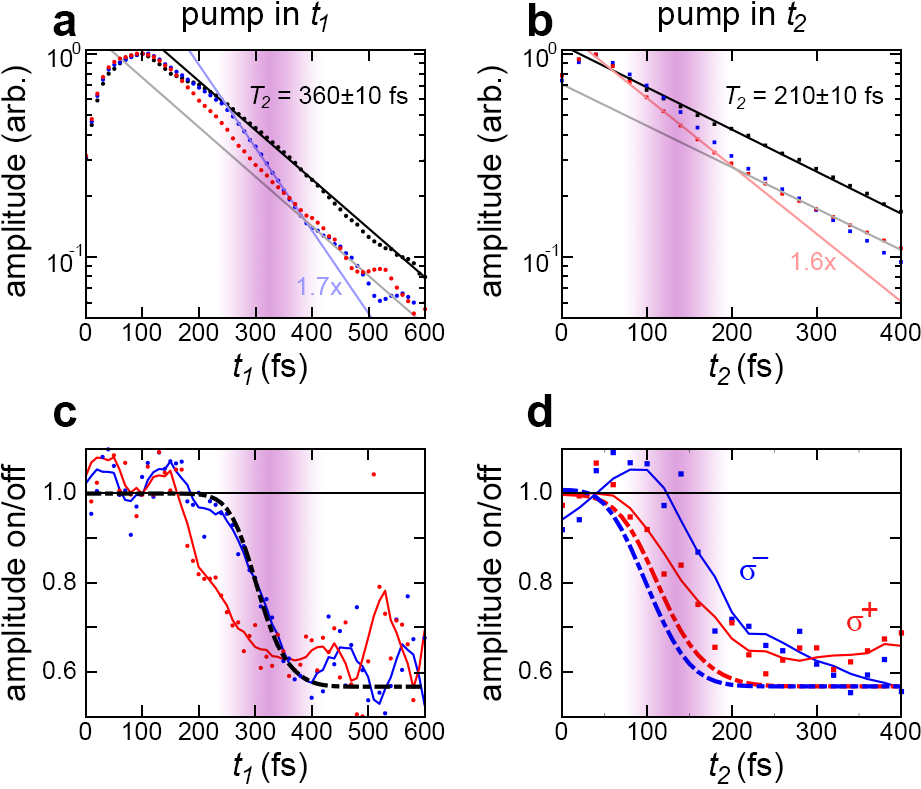
Despite the smooth evolution of the phase, the decrease in the signal amplitude seen in Fig. 2(b) suggests the pump causes a partial loss of coherence, and thus that the interaction of the red-detuned pump is not entirely adiabatic. Figure 4(a) and (b) show the normalised signal amplitude, integrated around the exciton energy, as a function of and , respectively. In both cases, a decrease in the signal amplitude, is evident upon arrival of the pump pulse, which indicates additional decoherence of the and coherences, regardless of the pump polarization. After the pump pulse, the decay rate once again matches the unpumped data, as indicated by the slope of the data and fits in Fig. 4(a) and (b). The return of the decay rate after the pump pulse is even more clearly demonstrated in Fig. 4(c) and (d), which show the ratio of the pumped and unpumped amplitudes. It is clear that for fs, the curves are flat, indicating that the decay rates with and without the pump are the same 222For the pump in , the curve for fs is flat for the simple reason that coherence time before the pump is increasing. This rules out the possibility that two-photon absorption of the pump-pulse is creating additional carriers that scatter and cause additional decoherence, as they would persist and affect the decoherence time well beyond the pulse overlap range. Thus, we conclude that the enhanced decoherence rate is consistent with a field driven effect persisting only over the finite pump duration. In the measurements of Ye et al. [4] they observe a decrease of the degree of linear polarization, which could reflect a loss of coherence. However, in that case they attribute those losses to the fact that the response is integrated in time, and includes emission before, during, and after the phase is rotated by the pump. They also have some contribution from the Gaussian distribution of pump intensity, which will cause different phase shifts. In our measurements, both of these effects are eliminated: the measured signal is proportional only to the coherence at the time the 30 fs pulse interacts with the sample, hence there is minimal temporal averaging. The spatial averaging over a distribution of pump intensities was minimised by ensuring that the pump spot size was larger than the MDCS spots and because the MDCS signal scales with the product of the electric field of each pulse, the effective area for the signal generation has a diameter a factor of smaller than the individual beams. It is therefore clear that in our measurements there is some additional non-trivial decoherence when the pump pulse is present.
The magnitude of the extra coherence loss is linearly proportional to the pump fluence (see Supplementary Material) and is quantitatively consistent with power broadening. For the case of a constant wave or very long pump pulse, the power broadened linewidth is given by [45]:
| (3) |
where is the resonant Rabi splitting [46] 333as opposed to the generalized Rabi splitting, which takes into account the detuning, and is the equilibrium homogeneous linewidth. The ratio indicates that power broadening is effectively dependent on the number of Rabi oscillations that occur within the decoherence time. In the case of short pulses, where the pulse duration is less than the decoherence time, quantifying the power broadening can be more challenging [48]. The amount of broadening is still expected to depend on the Rabi frequency, and hence vary with the intensity across the pulse envelope [48]. However, the decoherence time is no longer the shortest relevant timescale. To place an upper limit on the peak power broadening, we calculated the Rabi frequency from Eq. 1, using the peak AC-Stark shift measured (16 meV), and in place of we use the inverse of the pump pulse duration: meV. This gives a value of 6.9 meV for the power broadened linewidth, compared to the equilibrium value of 1.8 meV.
An experimental estimate of the average power broadening throughout the pump pulse is obtained from the data in Fig. 4(a) and (b). A linear fit to the data (on the semi-log axes) over the duration of the pulse yields an average decay rate that is 1.6-1.7 times faster than the unpumped decay. This suggests an average power broadened linewidth of 3 meV.
The power broadening was added to the simulations as a phenomenological contribution to the homogeneous linewidth, which follows the time dependent intensity of the pump pulse. This is an oversimplification, as the process for power broadening is not expected to be instantaneous. Nonetheless, using a peak broadening of 3.5 meV (i.e. at the peak of the pump pulse the power broadened linewidth is 5.3 eV) the simulated signal amplitude matches the dynamics of the measured amplitude for the case exceptionally well, as shown in Fig. 4(c). This value for the peak broadening is consistent with the upper limit calculated above and the average linewidth determined by fitting a single decay to the data in the pump overlap region. For the other measurements, the dynamics and/or magnitude of the decrease in amplitude differs somewhat from the simulations using the same parameters. These differences highlight the fact that the dynamics of power broadening for short pulses, and with the valley selectivity of monolayer TMDCs, are more complicated than the simple picture considered. However, with our phenomenological model, and quantitative comparisons, we have demonstrated that power broadening is present and the associated loss of coherence presents a limitation when using the AC-Stark and Bloch-Siegert effects to control bandstructures and the phase of quantum coherences.
IV Conclusions
By directly creating and measuring the phase of inter-valley coherences using MDCS, we have demonstrated the ability to measure the coherent dynamics while a red-detuned pump pulse drives Floquet-Bloch states. With a fluence of 875.0 µJ/cm2 a phase-shift occurred over the 100 fs pump pulse duration. The dominant cause of the phase shift was the valley selective AC-Stark shift, which lifts the degeneracy of the and excitons. However, the energy difference between excitons in the and valleys induced by the AC-Stark effect is reduced by the Bloch-Siegert effect, which blue-shifts the exciton in the other valley. These two effects were isolated by measuring the coherence between ground and single exciton states in the presence of the pump.
The smooth evolution of the phase suggests the process is adiabatic, but in these ensemble measurements the amplitude of the macroscopic coherence provides a better measure. Additional, irreversible, decoherence due to power broadening in the presence of the pump field was revealed, and imposes limitations on applications requiring adiabatic band control. The extent of the decoherence scales linearly with the pulse fluence, but so too do many of the effects targeted for control. Nonetheless, with this understanding of the role of power broadening, and depending on the application, it may be possible to minimise these effects. For example, to reduce power broadening and still achieve a phase shift of the inter-valley coherence, the pump laser detuning could be reduced (while still ensuring no spectral overlap between laser and exciton spectra), which will increase the AC-Stark shift and decrease the Bloch-Siegert shift for a given pulse fluence.
To reduce power broadening more generally, it will be necessary to understand and quantify the effect for short pulses and build models beyond the simplicity of a two-level system. Further potential lies in the idea that such pulses can be shaped to induce spectral narrowing [49], which may open new options for control. The experiments described here, and their ability to measure the amplitude and phase of coherences, provide an ideal means to explore and test these possibilities.
Acknowledgements.
This work was funded by the Australian Research Council Centre of Excellence in Future Low-Energy Electronics Technologies (CE170100039). T.H.Y.V., M.S.F., and M.T.E. acknowledge funding support from DP200101345. K.W. and T.T. acknowledge support from JSPS KAKENHI (Grant Numbers 19H05790, 20H00354 and 21H05233). We thank Jared Cole for fruitful discussions.Appendix A Sample preparation
Hexagonal boron nitride (hBN) crystals were mechanically exfoliated onto a 285 nm silicon dioxide substrate. The monolayer WS2 (HQ Graphene) was prepared on a polydimethylsiloxane (PDMS) substrate using the same method. Next, the monolayer WS2 was transferred onto the hBN using a dry transfer method. For encapsulation, a thin hBN flake (10 nm) was picked up by poly carbonate (PC) film. The hBN thin flake and the film were then dropped down to cover the WS2 monolayer. Finally, the sample was cleaned in chloroform for 5 minutes to dissolve the polymer and annealed in ultra-high vacuum for 8 hours at 200 degrees Celsius.
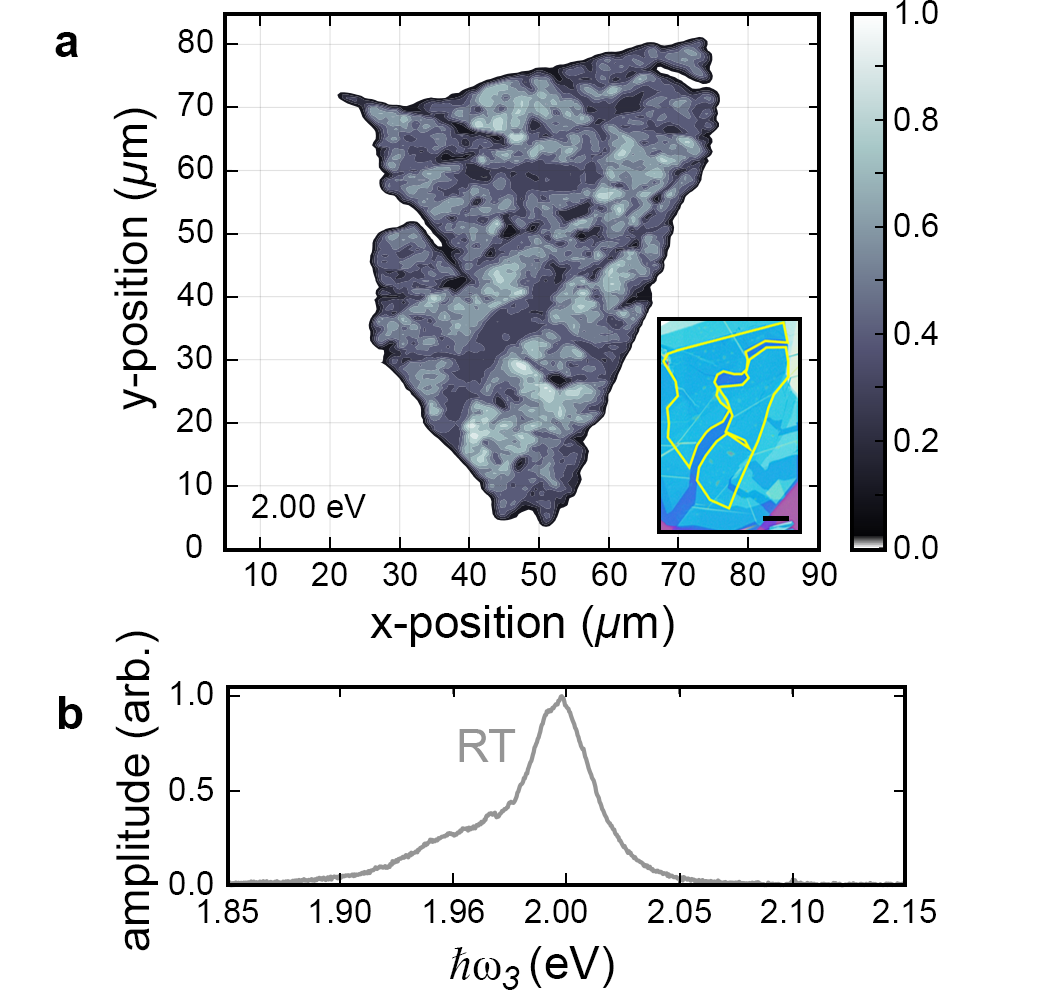
Room temperature spatially resolved photoluminescence (PL) was used for initial characterization of the hBN encapsulated monolayer WS2 flake used throughout this work, shown in Fig. 5(a). In our setup, a cw laser diode (Thorlabs, L405P20) tuned to 410 nm is coupled to a single-mode fiber (Thorlabs, P1-460B-FC-1), the output of which is reflected by a dichroic mirror (Edmund Optics, longpass 492 nm) into a 60 objective lens (Olympus, NA=0.8), and focused onto the sample. PL emission is collected by the same objective lens, transmitted through the dichroic, and sent into a free-space fiber coupler (Thorlabs, F810SMA-635) which couples the light into a miltimode fiber (Avantes, 200 µm core diameter). The fiber is connected directly to a spectrometer (Avantes, Avaspec-2048). Combined with an X-Y motorised translation stage (Applied Scientific Instrumentation, MS-2000), we raster across the sample taking spectra at each point. The resultant room temperature PL map is shown in Fig. 5(a) (and main text Fig. 2(d)), where we have mapped the normalized PL intensity at 2.00 eV. Inhomogeneity in the sample is evident, and can be due to defects, cracking, and bubbling from the hBN encapsulation. The room temperature (RT) sample averaged PL spectrum is shown in Fig. 5(b).
Appendix B Multidimensional coherent spectroscopy
Our MDCS pulses were generated by a Yb:KGW laser amplifier (Light Conversion Pharos), which pumps a non-colinear optical parametric amplifier (Light Conversion Orpheus-N-3H) tuned to output pulses with a spectrum centred near 2.00 eV (Fig. 6(c)). These pulses from the NOPA were incident onto a 2D grating and the four first-order diffracted beams selected as our three MDCS excitation pulses and local oscillator (LO). Independent spectral amplitude and phase control of each beam was enabled by a pulse shaper based on a spatial light modulator (Santec LCOS-SLM-100) [35, 50]. The pulse shaper also facilitates correction of temporal chirp introduced by the optics and beam propagation to the sample, by using the multi-photon intra-pulse interference phase scan technique [51]. This ultimately led to pulses 30fs in duration. A high degree of phase stability was passively maintained by ensuring the four beams (or pairs of beams) were incident on common optics [35].
All beams were focused through a 75 mm plano-convex lens onto the sample, which was in a cryostat (Montana Instruments—Cryostation) at 4 K and low pressure. The four beams were spatially overlapped with a spot size of µm FWHM. Beam fluences at the sample position were kept below 2 µJ/cm2 per pulse to ensure the contributions of signals beyond the regime were insignificant. At the sample surface, three light-matter interactions occur from excitation pulses with wavevectors , , and to produce a four-wave mixing (FWM) signal emitted in the background free direction given by conservation of momentum. We measure the signal emitted in the direction , which is spatially overlapped with the LO, on the fourth corner of the box, for heterodyne detection. The signal and LO were subsequently sent into a spectrometer with a CCD detector to obtain a spectral interferogram, enabling the spectrally-resolved signal amplitude and phase to be determined.
For the 1Q rephasing measurements discussed in the main text, the signal was measured as a function of by scanning the arrival time of , with . For the 0Q measurements, was scanned by delaying , with . is the Fourier transform of , and is measured directly by the spectrometer. The polarization of the pulses was set using half-wave plates in each beam to rotate the linear polarization of each pulse independently. A quarter-wave plate common to all beams was used to convert the orthogonal linear polarizations to be circularly polarized, either or . For the measurements described here, the and pulses were set to be , while and pulses were set to be polarized.
An additional advantage of measuring both the amplitude and phase of the signal as a function of the delays is that there is a unique solution to the Fourier transform with respect to these delays. This enables the generation of multi-dimensional spectra, as shown in Fig. 6(a) and (b) for the unpumped 1Q and 0Q rephasing data, respectively. The 1Q rephasing 2D spectrum features a diagonal peak (for which ), corresponding to excitation and emission at the exciton energy (X), and a cross peak red-shifted from the exciton emission energy, which we attribute to the neutral biexciton (XXb) [33]. In our MDCS measurements, the µm spot size of the excitation pulses averages over the sample inhomogeneity, resulting in broadening along the main diagonal (black line in Fig. 6(a)). Despite this, the width of the 2D peak across the diagonal is much narrower and represents the homogeneous linewidth. In the unpumped 0Q 2D spectrum the peaks sit along the horizontal line at =0 meaning the coherence produced between inter-valley excitons are from energetically degenerate states. We also observe an inter-valley trion coherence, labelled T. These 2D spectra are consistent with previous MDCS measurements on monolayer TMDCs [33, 31, 32, 34].
Appendix C Pump characteristics
Pulses were generated by the same Yb:KGW laser amplifier as above, which also pumps a second NOPA (Light Conversion Orpheus-N-2H) tuned to output pulses with a spectrum centred 200 meV below the exciton transition at 1.87 eV (Fig. 6(c)), and 100 fs in duration. These pulses travel down a computer controlled motorized delay stage with a retroreflector at its end to control the pump timing. The pump then passes through a mechanical shutter, and finally a liquid crystal retarder (Thorlabs LCC1111-D) and controller (Thorlabs LCC25). The axis of the liquid crystal retarder was set to be 45 to the pump beam polarization, and the voltage set such that there phase shift of zero (polarization unchanged) or , in which case it acts as a half-wave plate and rotates the polarization 90. The pump was then directed via a pick-off mirror to be parallel to, but slightly offset from the MDCS beams, so that it passes through the same quarter-wave plate and focusing lens onto the sample, and overlaps with the MDCS beams. The spot size of the pump was µm. An optical isolator was constructed at the sample position to set the voltage of the liquid crystal retarder such that two polarization states of the pump could be defined; co- and cross-polarized to . For each delay position of the 1Q and 0Q scans, data was acquired for both pump polarizations, and without the pump (i.e. with the shutter closed) to optimise the ability to identify changes to the signal resulting from the and polarized pump.
Appendix D Simulation details
To simulate the MDCS experiments we used an approach based on perturbatively solving the Liouville formulation of the Schrodinger equation () for a three-level“V-type” system, similar to that used in Ref. [52, 53]. The Hamiltonian is given by:
where is the energy of state n. For the case of monolayer WS2, state 1 is the ground state, and state 2 and 3 are the degenerate exciton states, with energy set to be 2.06 eV. is the transition dipole moment for the transition between state i and j, and describes the electric field of the three laser laser pulses:
where represents the peak amplitude of each pulse, is the arrival time of pulse n, is the centre laser frequency (2.06 eV), and c is the standard deviation of the Gaussian pulse envelope (12.7 fs, corresponding to FWHM = 30 fs). To account for the selection rules each pulse is multiplied by a vector or for a or polarized pulse, respectively. The transition dipole moment for state 2 and 3, corresponding to and excitons are multiplied by or respectively. This ensures that a () polarized pulse can only drive a transition in the () valley.
Relaxation is introduced phenomenologically such that
where is the decoherence rate of the coherent superposition, (set to be fs for all coherences to match the experimental data), and is the population relaxation rate for state , which was set to be fs, but for these simulations, which do not measure any population dynamics, this value is unimportant.
Treating the electric field as a perturbation and expanding the equations perturbatively leads to a set of interdependent differential equations. By separating these in terms of the wavevector component, and keeping just the contributions that will lead to a third order polarization with wavevector , this reduces to 16 equations [53]. These equations were solved numerically to give the signal electric field as a function of for a given set of pulse delays. The data was Fourier transformed with respect to to give the axis. To obtain the 1Q and 0Q 2D datasets, the arrival time of pulse 1 and pulse 3 were varied, respectively.
D.1 Incorporating the spectral shift and power broadening
The effects of the pump pulse were introduced phenomenologically, based on the assumption that the magnitude of the shift and broadening scale directly with the instantaneous intensity of the pump laser pulse. The time dependent energy shift was calculated as
| (4) |
while the time dependent broadening was given by
| (5) |
where is the arrival time of the pump, is the standard deviation of the Gaussian pump pulse envelope (42.3 fs, corresponding to FWHM = 100 fs), is the peak energy shift for a given fluence, and is the peak increase in the broadening.
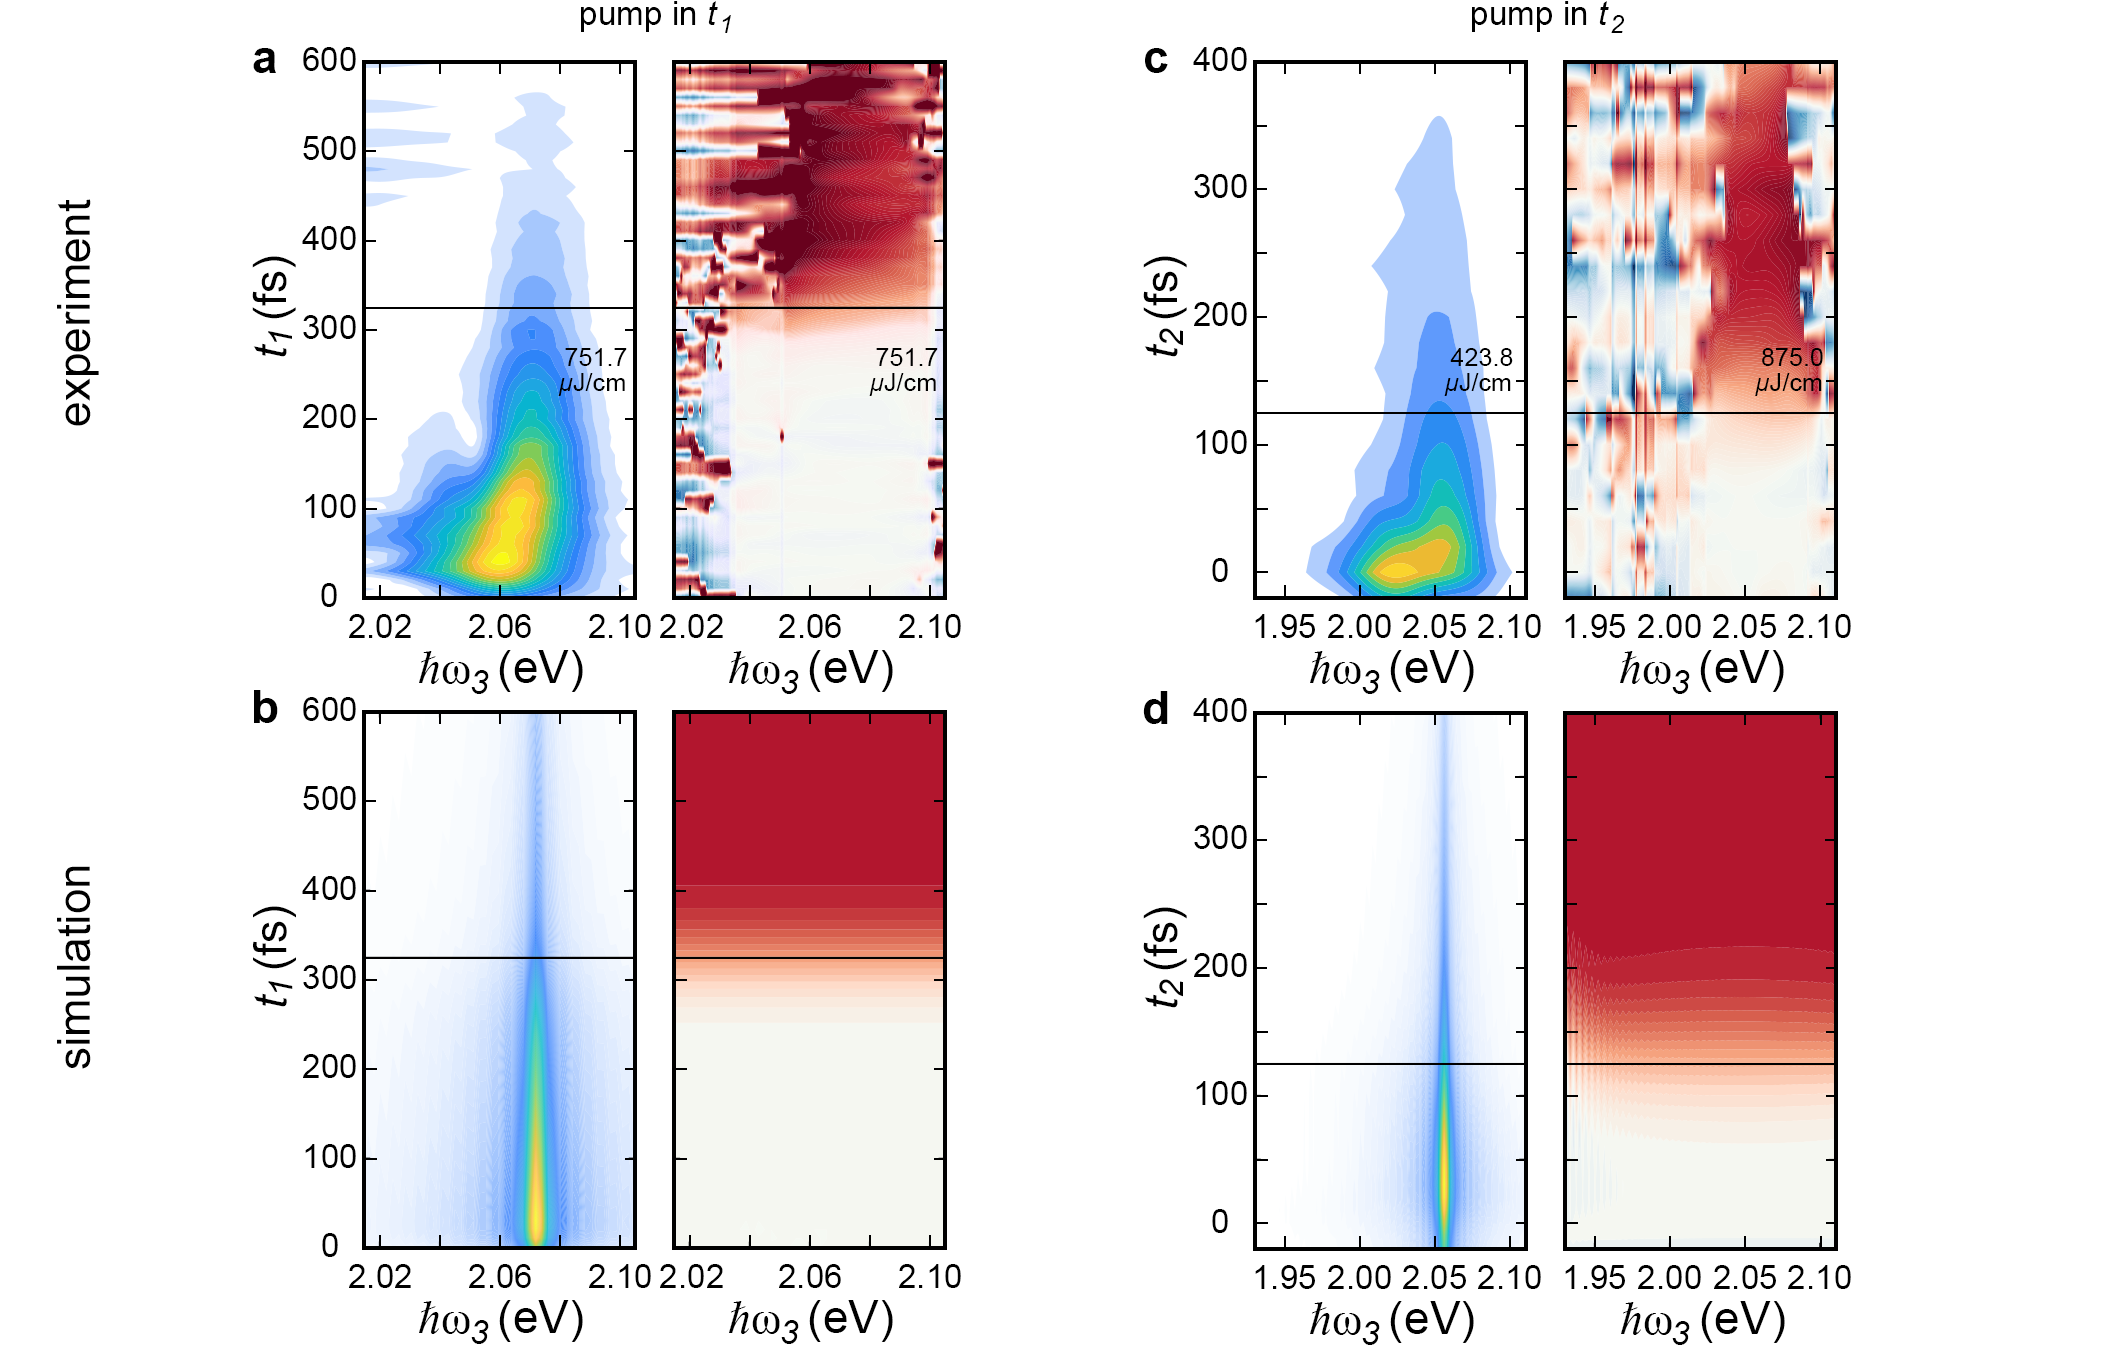
The was added to the energy of state 2 or state 3, depending on the polarization of the pump. While the was added to the decoherence rates, . The results of the simulations are shown in Fig. 7(b) and (d) and compared to the highest fluence experimental data ((a) and (c)) for the 1Q and 0Q scans with the pump in and , respectively. was set to 16 meV to match the value determined from the experiments. The value of was 3.5meV, which was optimised to give a drop in the simulated signal amplitude that matched the experimental drop observed for the case of the pump in .
A key difference between the simulations and the experimental data is that inhomogeneous broadening was not included in the simulations, which means the spectrum is narrower than the experiments where there is significant inhomogeneous broadening and also the presence of a trion. This also means that the phase shift seen in the simulations does not vary as a function of , but is instead uniform. The absence of noise also means the phase shift is seen even on the wings of the peak where the amplitude is low. The spectrally integrated phase and amplitude are plotted as a function of delay in Fig. 3 and Fig. 4, respectively, and show good agreement between simulations and experiments.
References
- Matsubara et al. [2015] M. Matsubara, A. Schroer, A. Schmehl, A. Melville, C. Becher, M. Trujillo-Martinez, D. G. Schlom, J. Mannhart, J. Kroha, and M. Fiebig, Ultrafast optical tuning of ferromagnetism via the carrier density, Nat. Commun. 6, 1 (2015).
- Bassett et al. [2014] L. C. Bassett, F. J. Heremans, D. J. Christle, C. G. Yale, G. Burkard, B. B. Buckley, and D. D. Awschalom, Ultrafast optical control of orbital and spin dynamics in a solid-state defect, Science 345, 1333 (2014).
- Kampfrath et al. [2011] T. Kampfrath, A. Sell, G. Klatt, A. Pashkin, S. Mährlein, T. Dekorsy, M. Wolf, M. Fiebig, A. Leitenstorfer, and R. Huber, Coherent terahertz control of antiferromagnetic spin waves, Nat. Photon. 5, 31 (2011).
- Ye et al. [2017] Z. Ye, D. Sun, and T. F. Heinz, Optical manipulation of valley pseudospin, Nat. Phys. 13, 26 (2017).
- Wang et al. [2013] Y. H. Wang, H. Steinberg, P. Jarillo-Herrero, and N. Gedik, Observation of Floquet-Bloch states on the surface of a topological insulator, Science 342, 453 (2013).
- Hellmann et al. [2010] S. Hellmann, M. Beye, C. Sohrt, T. Rohwer, F. Sorgenfrei, H. Redlin, M. Kalläne, M. Marczynski-Bühlow, F. Hennies, M. Bauer, A. Föhlisch, L. Kipp, W. Wurth, and K. Rossnagel, Ultrafast melting of a charge-density wave in the Mott insulator , Phys. Rev. Lett. 105, 187401 (2010).
- Iwai et al. [2003] S. Iwai, M. Ono, A. Maeda, H. Matsuzaki, H. Kishida, H. Okamoto, and Y. Tokura, Ultrafast optical switching to a metallic state by photoinduced Mott transition in a halogen-bridged Nickel-chain compound, Phys. Rev. Lett. 91, 057401 (2003).
- Fausti et al. [2011] D. Fausti, R. I. Tobey, N. Dean, S. Kaiser, A. Dienst, M. C. Hoffmann, S. Pyon, T. Takayama, H. Takagi, and A. Cavalleri, Light-induced superconductivity in a stripe-ordered cuprate, Science 331, 189 (2011).
- McIver et al. [2020] J. W. McIver, B. Schulte, F.-U. Stein, T. Matsuyama, G. Jotzu, G. Meier, and A. Cavalleri, Light-induced anomalous Hall effect in graphene, Nat. Phys. 16, 38 (2020).
- Ballarini et al. [2020] D. Ballarini, A. Gianfrate, R. Panico, A. Opala, S. Ghosh, L. Dominici, V. Ardizzone, M. De Giorgi, G. Lerario, G. Gigli, et al., Polaritonic neuromorphic computing outperforms linear classifiers, Nano Lett. 20, 3506 (2020).
- Earl et al. [2021] S. K. Earl, M. A. Conway, J. B. Muir, M. Wurdack, E. A. Ostrovskaya, J. O. Tollerud, and J. A. Davis, Coherent dynamics of Floquet-Bloch states in monolayer WS2 reveals fast adiabatic switching, Phys. Rev. B 104, L060303 (2021).
- Uchida et al. [2022] K. Uchida, S. Kusaba, K. Nagai, T. N. Ikeda, and K. Tanaka, Diabatic and adiabatic transitions between Floquet states imprinted in coherent exciton emission in monolayer WSe2, Sci. Adv. 8, eabq7281 (2022).
- Kim et al. [2014] J. Kim, X. Hong, C. Jin, S.-F. Shi, C.-Y. S. Chang, M.-H. Chiu, L.-J. Li, and F. Wang, Ultrafast generation of pseudo-magnetic field for valley excitons in WSe2 monolayers, Science 346, 1205 (2014).
- Sie et al. [2015] E. J. Sie, J. W. McIver, Y.-H. Lee, L. Fu, J. Kong, and N. Gedik, Valley-selective optical Stark effect in monolayer WS2, Nat. Mater. 14, 290 (2015).
- Sie et al. [2016] E. J. Sie, C. H. Lui, Y.-H. Lee, J. Kong, and N. Gedik, Observation of intervalley biexcitonic optical Stark effect in monolayer WS2, Nano Lett. 16, 7421 (2016).
- Sie et al. [2017] E. J. Sie, C. H. Lui, Y.-H. Lee, L. Fu, J. Kong, and N. Gedik, Large, valley-exclusive Bloch-Siegert shift in monolayer WS2, Science 355, 1066 (2017).
- LaMountain et al. [2018] T. LaMountain, H. Bergeron, I. Balla, T. K. Stanev, M. C. Hersam, and N. P. Stern, Valley-selective optical Stark effect probed by Kerr rotation, Phys. Rev. B 97, 045307 (2018).
- Yong et al. [2018] C.-K. Yong, J. Horng, Y. Shen, H. Cai, A. Wang, C.-S. Yang, C.-K. Lin, S. Zhao, K. Watanabe, T. Taniguchi, et al., Biexcitonic optical Stark effects in monolayer molybdenum diselenide, Nat. Phys. 14, 1092 (2018).
- Cunningham et al. [2019] P. D. Cunningham, A. T. Hanbicki, T. L. Reinecke, K. M. McCreary, and B. T. Jonker, Resonant optical Stark effect in monolayer WS2, Nat. Commun. 10, 1 (2019).
- Morrow et al. [2020] D. J. Morrow, D. D. Kohler, Y. Zhao, J. M. Scheeler, S. Jin, and J. C. Wright, Quantum interference between the optical Stark effect and resonant harmonic generation in WS2, Phys. Rev. B 102, 161401 (2020).
- Slobodeniuk et al. [2022a] A. Slobodeniuk, P. Koutenskỳ, M. Bartoš, F. Trojánek, P. Malỳ, T. Novotnỳ, and M. Kozák, Semiconductor bloch equation analysis of optical Stark and Bloch-Siegert shifts in monolayer WSe2 and MoS2, Phys. Rev. B 106, 235304 (2022a).
- Slobodeniuk et al. [2022b] A. Slobodeniuk, P. Koutenský, M. Bartoš, F. Trojánek, P. Malý, T. Novotný, and M. Kozák, Giant valley-selective Stark and Bloch-Siegert shifts of exciton resonances in WSe2 and MoS2 monolayers, arXiv preprint arXiv:2204.00842 (2022b).
- Kobayashi et al. [2023] Y. Kobayashi, C. Heide, A. C. Johnson, V. Tiwari, F. Liu, D. A. Reis, T. F. Heinz, and S. Ghimire, Floquet engineering of strongly driven excitons in monolayer tungsten disulfide, Nat. Phys. , 1 (2023).
- Xiao et al. [2012] D. Xiao, G.-B. Liu, W. Feng, X. Xu, and W. Yao, Coupled spin and valley physics in monolayers of MoS2 and other group-VI dichalcogenides, Phys. Rev. Lett. 108, 196802 (2012).
- Mak et al. [2014] K. F. Mak, K. L. McGill, J. Park, and P. L. McEuen, The valley Hall effect in MoS2 transistors, Science 344, 1489 (2014).
- Oka and Kitamura [2019] T. Oka and S. Kitamura, Floquet engineering of quantum materials, Annu. Rev. Condens. Matter Phys. 10, 387 (2019).
- Schüler and Beaulieu [2022] M. Schüler and S. Beaulieu, Probing topological Floquet states in WSe2 using circular dichroism in time- and angle-resolved photoemission spectroscopy, Commun. Phys. 5, 10.1038/s42005-022-00944-w (2022).
- Claassen et al. [2016] M. Claassen, C. Jia, B. Moritz, and T. P. Devereaux, All-optical materials design of chiral edge modes in transition-metal dichalcogenides, Nat. Commun. 7, 1 (2016).
- Jones et al. [2013] A. M. Jones, H. Yu, N. J. Ghimire, S. Wu, G. Aivazian, J. S. Ross, B. Zhao, J. Yan, D. G. Mandrus, D. Xiao, et al., Optical generation of excitonic valley coherence in monolayer WSe2, Nat. Nanotechnol 8, 634 (2013).
- Hao et al. [2016a] K. Hao, G. Moody, F. Wu, C. K. Dass, L. Xu, C.-H. Chen, L. Sun, M.-Y. Li, L.-J. Li, A. H. MacDonald, et al., Direct measurement of exciton valley coherence in monolayer WSe2, Nat. Phys. 12, 677 (2016a).
- Moody et al. [2015] G. Moody, C. Kavir Dass, K. Hao, C.-H. Chen, L.-J. Li, A. Singh, K. Tran, G. Clark, X. Xu, G. Berghäuser, et al., Intrinsic homogeneous linewidth and broadening mechanisms of excitons in monolayer transition metal dichalcogenides, Nat. Commun. 6, 1 (2015).
- Hao et al. [2016b] K. Hao, L. Xu, P. Nagler, A. Singh, K. Tran, C. K. Dass, C. Schuller, T. Korn, X. Li, and G. Moody, Coherent and incoherent coupling dynamics between neutral and charged excitons in monolayer MoSe2, Nano Lett. 16, 5109 (2016b).
- Conway et al. [2022] M. A. Conway, J. B. Muir, S. K. Earl, M. Wurdack, R. Mishra, J. O. Tollerud, and J. Davis, Direct measurement of biexcitons in monolayer WS2, 2D Mater. 9, 021001 (2022).
- Muir et al. [2022] J. B. Muir, J. Levinsen, S. K. Earl, M. A. Conway, J. H. Cole, M. Wurdack, R. Mishra, J. David, E. Estrecho, Y. Lu, et al., Interactions between Fermi polarons in monolayer WS2, Nat. Commun. 13, 1 (2022).
- Tollerud and Davis [2017] J. O. Tollerud and J. A. Davis, Coherent multi-dimensional spectroscopy: Experimental considerations, direct comparisons and new capabilities, Prog. Quantum. Electron. 55, 1 (2017).
- Moody and Cundiff [2017] G. Moody and S. T. Cundiff, Advances in multi-dimensional coherent spectroscopy of semiconductor nanostructures, Adv. Phys. X 2, 641 (2017).
- Jakubczyk et al. [2016] T. Jakubczyk, V. Delmonte, M. Koperski, K. Nogajewski, C. Faugeras, W. Langbein, M. Potemski, and J. Kasprzak, Radiatively limited dephasing and exciton dynamics in MoSe2 monolayers revealed with four-wave mixing microscopy, Nano Lett. 16, 5333 (2016).
- Paur et al. [2019] M. Paur, A. J. Molina-Mendoza, R. Bratschitsch, K. Watanabe, T. Taniguchi, and T. Mueller, Electroluminescence from multi-particle exciton complexes in transition metal dichalcogenide semiconductors, Nat. Commun. 10, 1709 (2019).
- Plechinger et al. [2016] G. Plechinger, P. Nagler, A. Arora, R. Schmidt, A. Chernikov, A. G. del Águila, P. C. Christianen, R. Bratschitsch, C. Schüller, and T. Korn, Trion fine structure and coupled spin-valley dynamics in monolayer tungsten disulfide, Nat. Commun. 7, 12715 (2016).
- Kolesnichenko et al. [2020] P. V. Kolesnichenko, Q. Zhang, T. Yun, C. Zheng, M. S. Fuhrer, and J. A. Davis, Disentangling the effects of doping, strain and disorder in monolayer WS2 by optical spectroscopy, 2D Mater. 7, 025008 (2020).
- Hao et al. [2017] K. Hao, J. F. Specht, P. Nagler, L. Xu, K. Tran, A. Singh, C. K. Dass, C. Schüller, T. Korn, M. Richter, et al., Neutral and charged inter-valley biexcitons in monolayer MoSe2, Nat. Commun. 8, 1 (2017).
- Guo et al. [2020] L. Guo, C.-A. Chen, Z. Zhang, D. M. Monahan, Y.-H. Lee, and G. R. Fleming, Lineshape characterization of excitons in monolayer WS2 by two-dimensional electronic spectroscopy, Nanoscale Adv. 2, 2333 (2020).
- Note [1] The measured evolution of the Stark shift arises from a convolution of the pulse and the pump-induced shift, hence the actual peak shift will be slightly higher than the one obtained directly from the measurement.
- Note [2] For the pump in , the curve for fs is flat for the simple reason that coherence time before the pump is increasing.
- Foot [2004] C. J. Foot, Atomic physics, Vol. 7 (OUP Oxford, 2004).
- Xu et al. [2008] X. Xu, B. Sun, E. D. Kim, K. Smirl, P. Berman, D. Steel, A. Bracker, D. Gammon, and L. Sham, Single charged quantum dot in a strong optical field: absorption, gain, and the AC-Stark effect, Phys. Rev. Lett. 101, 227401 (2008).
- Note [3] As opposed to the generalized Rabi splitting, which takes into account the detuning.
- Vitanov et al. [2001] N. Vitanov, B. Shore, L. Yatsenko, K. Böhmer, T. Halfmann, T. Rickes, and K. Bergmann, Power broadening revisited: theory and experiment, Opt. Commun. 199, 117 (2001).
- Boradjiev and Vitanov [2013] I. I. Boradjiev and N. V. Vitanov, Power narrowing in coherent atomic excitation by smoothly shaped pulsed fields, Opt. Commun. 288, 91 (2013).
- Turner et al. [2011] D. B. Turner, K. W. Stone, K. Gundogdu, and K. A. Nelson, Invited Article: The coherent optical laser beam recombination technique (COLBERT) spectrometer: Coherent multidimensional spectroscopy made easier, Rev. Sci. Instrum. 82, 081301 (2011).
- Xu et al. [2006] B. Xu, J. M. Gunn, J. M. D. Cruz, V. V. Lozovoy, and M. Dantus, Quantitative investigation of the multiphoton intrapulse interference phase scan method for simultaneous phase measurement and compensation of femtosecond laser pulses, J. Opt. Soc. Am. B 23, 750 (2006).
- Davis et al. [2011] J. A. Davis, C. R. Hall, L. V. Dao, K. A. Nugent, H. M. Quiney, H. H. Tan, and C. Jagadish, Three-dimensional electronic spectroscopy of excitons in asymmetric double quantum wells, J. Chem. Phys. 135, 044510 (2011).
- Davis et al. [2007] J. A. Davis, J. J. Wathen, V. Blanchet, and R. T. Phillips, Time-resolved four-wave-mixing spectroscopy of excitons in a single quantum well, Phys. Rev. B 75, 035317 (2007).