Early-time millimeter observations of the nearby Type II SN 2024ggi
Abstract
The short-lived ionized emission lines in early spectroscopy of the nearby type II supernova SN 2024ggi signify the presence of dense circumstellar matter (CSM) close to its progenitor star. We proposed the Atacama Large Millimeter/submillimeter Array (ALMA) observations by its Director’s Discretionary Time program to catch the potential synchrotron radiation associated with the ejectaCSM interaction. Multi-epoch observations were conducted using ALMA band 6 at +8, +13, and +17 days after the discovery. The data show non-detections at the position of SN 2024ggi with a upper limit of less than 0.15 mJy, corresponding to a luminosity of approximately . In this paper, we leverage the non-detections to place constraints on the properties of CSM surrounding SN 2024ggi. We investigate both the Wind and Eruptive models for the radial distribution of CSM, assuming a constant mass-loss rate in the Wind model and a distance-variant mass-loss rate in the Eruptive model. The derived CSM distribution for the Wind model does not align with the early-time spectral features, while the ALMA observations suggest a mass-loss rate of for the Eruptive model. Conducting multi-epoch millimeter/submillimeter observations shortly after the explosion, with a cadence of a few days, could offer a promising opportunity to capture the observable signature of the Eruptive model.
1 Introduction
Core-collapse supernovae (SNe) result from the explosive demise of massive stars at the end of their nuclear burning, and these explosive events carry out critical information about progenitor stars (e.g., Langer 2012). An evident product of the pre-explosion evolution is the circumstellar matter (CSM), generated from the mass-loss process of progenitors like the stellar wind, the accretion process, or the eruptive outburst (e.g., Cheng et al. 2024; Matsuoka & Sawada 2024). The interaction between the SN ejecta and pre-existing CSM leads to various observable phenomena from X-ray (thermal bremsstrahlung emission, Chevalier & Irwin 2012; Svirski et al. 2012; Margalit et al. 2022) and optical (thermal black-body emission, Chevalier & Fransson 1994; Wood-Vasey et al. 2004; Moriya et al. 2013) to radio (synchrotron radiation, Chevalier 1982, 1998; Yurk et al. 2022) bands. Therefore, the multi-band signals relating to the existence of CSM can trace the mass-loss history of massive stars before their death.

In particular, radio emission plays an essential role as an indicator of the CSM interaction. Type IIn SNe, characterized by narrow emission lines in their spectra, have been pursued for decades by radio facilities. These objects tend to fade slowly due to the enduring interaction with extended CSM and hence show signals in radio radiation for years since the discovery (e.g., van Dyk et al. 1996; Chandra et al. 2009, 2012, 2015; Bietenholz et al. 2021; DeMarchi et al. 2022; Sfaradi et al. 2024). In contrast, the dense CSM close to the progenitor star will be rapidly swept up by the SN ejecta and then transit into collisionless shock. This dynamic process could introduce fast-evolving optical signatures (e.g., Gal-Yam et al. 2014; Khazov et al. 2016; Yaron et al. 2017; Zhang et al. 2020; Lin et al. 2021; Andrews et al. 2024; Li et al. 2024). Meanwhile, the SN explosion surrounded by confined CSM may also produce fast-evolving radiation in radio bands, especially in millimeter bands, as the synchrotron self-absorption and free-free absorption are severe in low frequencies.
SN 2023ixf, which exploded in the nearby galaxy M101, is a type II SN with short-lived ionized emission lines, indicating the existence of confined dense CSM (Bostroem et al., 2023; Hiramatsu et al., 2023; Jacobson-Galán et al., 2023; Smith et al., 2023; Zhang et al., 2023). The corresponding mass-loss rate of the CSM surrounding SN 2023ixf is about , inferred from fitting the optical light curve or the emission line (Li et al., 2024; Zimmerman et al., 2024). The millimeter-band observation of SN 2023ixf with the Submillimeter Array has yielded a consistent result, placing constraints on the mass-loss rate either larger than or less than (Berger et al., 2023).
SN 2024ggi, another nearby type II SN with early-time ionized emission lines, exploded one year later, providing a rare opportunity to catch its millimeter signals relating to the CSM interaction. This paper presents the millimeter-band observation of SN 2024ggi with the Atacama Large Millimeter/Submillimeter Array (ALMA) through a Director’s Discretionary Time program (PI: M. Hu). Section 2 provides details of the observation and data. The adopted CSM model is described in Section 3, and Section 4 outlines the result. Section 5 shows the discussion and conclusion.
2 Observations and Data

SN 2024ggi was discovered by the Asteroid Terrestrial-impact Last Alert System on 2024 April 11.14 UT in the nearby galaxy UGC200 ( 7.0 Mpc) and then classified as type II SN with early-time ionized emission lines (Chen et al., 2024; Tonry et al., 2024; Zhai et al., 2024). The progenitor star is possibly a red supergiant from the pre-explosion archival images (Srivastav et al., 2024; Xiang et al., 2024). The follow-up observations show strong evidence of fast-evolving ionized emission lines and rapid brightening, indicating the interaction between SN ejecta and confined dense CSM (Pessi et al., 2024; Shrestha et al., 2024; Zhang et al., 2024). Both photometric and spectroscopic observations suggest the discovery date is close to the explosion of SN 2024ggi. We adopted the explosion time from Pessi et al. (2024) when we model the millimeter-band data of SN 2024ggi in the subsequent section.
| Observation date | 2024-04-19 | 2024-04-24 | 2024-04-28 |
|---|---|---|---|
| Phase | 8.4 days | 13.3 days | 17.2 days |
| Antennas number | 46 | 44 | 43 |
| Integration time | 300 s | 300 s | 300 s |
| Major axis | 1.5′′ | 1.2′′ | 0.91′′ |
| Minor axis | 0.8′′ | 0.7′′ | 0.72′′ |
| Position angle | -82∘ | -88∘ | 81∘ |
| Image RMS | 0.045 mJy | 0.041 mJy | 0.047 mJy |
| upper limits | 0.136 mJy | 0.124 mJy | 0.141 mJy |
SN 2024ggi was observed using ALMA, centered at the coordinate RA/DEC = 11:18:22.087, -32:50:15.27, over three epochs. The observations were conducted in continuum mode with a total bandwidth of 7.5 GHz in band 6, centered at a frequency of 223 GHz. J1126-3828 was used as the phase/gain calibrator for all three epochs, while J1427-4206, J1107-4449, and J1037-2934 served as flux calibrators, each on a different epoch. Data was processed using the Common Astronomy Software Application (CASA) pipeline, version 2023.1.0.124. The primary beam size at the central frequency of 223 GHz is approximately 26 arcsec. The full-width at half-maximum of the achieved synthesized beam size ranges from 0.8 to 1.1 arcsec. The continuum maps have a root-mean-square (RMS) noise level of around 0.041-0.047 mJy/beam. Detailed information about the observations is provided in Table 1. Figure 1 displays the continuum maps towards the target, showing no detected emission from SN 2024ggi across the three epochs in the millimeter band. Unfortunately, bad weather conditions prevented us from conducting submillimeter-band observations.
In this paper, we present the early-time observations by ALMA spanning about +8 – +17 days after the discovery. The three ALMA observations were conducted at Band 6 to cover the frequency of 223 GHz, corresponding to the 230 GHz at the rest frame. Figure 2 compares the 3 RMS sensitivity of SN 2024ggi and the millimeter-band observation of other core-collapse SNe. Thanks to ALMA’s high sensitivity and high spatial resolution, the obtained image sensitivity and the corresponding luminosity of SN 2024ggi is about one magnitude deeper than that of SN 2023ixf. This improvement allows us to impose strict constraints on the circumstellar environment surrounding SN 2024ggi.
3 Methods
3.1 Radial distribution of CSM
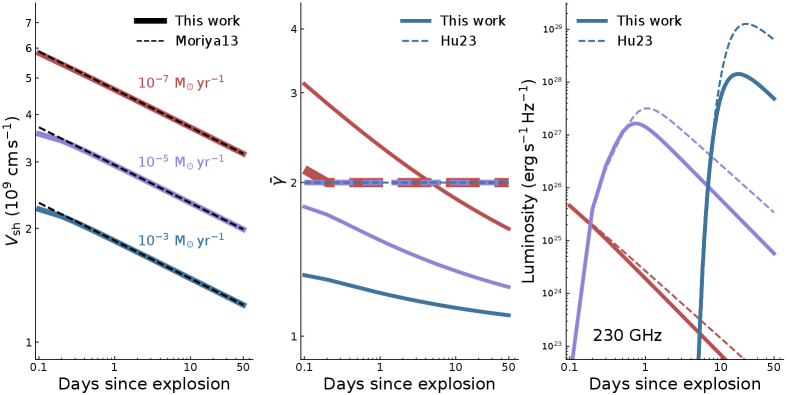
We adopted the code developed by Hu et al. (2023) to calculate the dynamical process when the ejecta crashes into CSM and predict the associated synchrotron radiation. A typical scenario of the radial distribution of CSM is the Wind model with CSM density () as , where is the wind velocity, is the distance to SN, and is the mass-loss rate of CSM. In the Wind model, is assumed to be constant, and the shock velocity () can be explicitly expressed as the function of the ejecta energy (), the ejecta mass (), , and the time since the explosion () (e.g., Moriya et al. 2013). As shown in the left panel of Figure 3, calculated from our numerical code is consistent with the formula from Moriya et al. (2013), suggesting the validity of our numerical code.
On the other hand, the progenitor star may experience an eruptive mass-loss process before the SN explosion. Hu et al. (2024) employed a piece-wise function to describe the radial distribution of relating to an Eruptive model as below,
| (1) |
where is a characteristic value of mass-loss rate associated with the eruptive process, and represents the stellar wind before the eruption. The parameters , , , and describe the distance-variant mass-loss rate of the pre-existing CSM, that increases to within the distance of and decreases to from to .
The Eruptive model described by the above piece-wise function mainly includes two CSM regions, that are the inner one with high mass-loss rate of and the outer one with low mass-loss rate of . This feature of our Eruptive model is consistent with other studies (e.g., Piro et al. 2021; Zimmerman et al. 2024; Chugai 2024), although some differences exist. This simplified Eruptive model is also consistent with the hydrodynamic simulation (Cheng et al., 2024). For the Eruptive model, the dynamical process of the ejectaCSM interaction can be numerically resolved using the code developed in Hu et al. (2023). Note that neither the Wind model nor the Eruptive model in our study considers the binary system scenario, so the geometric distribution of pre-existing CSM is spherical.
3.2 Synchrotron radiation
The theory and the technical method of synchrotron radiation generated from the ejectaCSM interaction has been well established (Chevalier, 1982, 1998; Björnsson & Lundqvist, 2014; Pérez-Torres et al., 2014; Lundqvist et al., 2020). In this paper, we will update the synchrotron radiation model constructed in Hu et al. (2023).
The ejecta-CSM interaction could generate the relativistic electrons. The frequency spectrum of the relativistic electrons is complicated and can far exceed the gyration frequency. Following the scenario of gamma-ray bursts, the electron energy () satisfies a power-law distribution with the index of as , where and are the number density of the electrons and a scaling parameter, respectively. The synchrotron radiation from relativistic electrons with a power-law distribution also has a power-law spectrum as the emission coefficient () satisfies , where the parameter . We adopt and in this study, consistent with the previous studies.
With the evolution of in Section 3.1 and the assumption that a fraction of the shocked energy, , goes into the electron energy, the parameter is expressed as , where is the minimum of the electron energy. With the identified electron energy distribution, the corresponding radio luminosity containing the synchrotron self-absorption effect is expressed as Equation 4 in Hu et al. (2023).

3.3 Model updates
Two effects are not involved in the model of Hu et al. (2023): the free-free absorption of the unshocked CSM and the fraction of nonrelativistic electrons. In the picture of Hu et al. (2023), the hypothesized CSM surrounding thermonuclear SNe is thin with the mass-loss rate of about , leading to negligible free-free opacity. Besides, a typical shock velocity in Hu et al. (2023) is about , indicating the deviation from Equation 18 in Chevalier & Fransson (2006) is small, and then the nonrelativistic electron component is negligible. In our study, the mass-loss rate is at the level of about and the shock velocity is about , resulting in significant free-free optical depth and a large fraction of nonrelativistic electrons.
3.3.1 Electron energy
With the assumption that the electron energy goes into a power-law distribution, the average electron energy () is expressed as . On the other hand, the equation below links the shock energy and ,
| (2) |
where and are the number density of ion and electron, respectively. is the proton mass and is the mean molecular weight. (= 4) is a shock compression factor. After proper arrangement, is expressed as below,
| (3) |
In the previous studies, like the model of Hu et al. (2023), the author adopts the Lorentz factor () to represent the electron energy as , where is the electron mass and is the light speed. Therefore, the value of is calculated by
| (4) |
The caveat is that Equation 4 might over-estimate the electron energy and then over-estimate the parameter , resulting in over-estimating the final radio luminosity. As a comparison, we adopt the expression to link the Lorentz factor and electron energy . Hence, the actual value of is calculated in this paper as below,
| (5) |
Equation 5 gives a more reasonable calculation of , , and . As shown in Figure 3, in the case of low mass-loss rate (e.g., ), the corresponding shock velocity is above within about 50 days after the explosion. This relatively high shock velocity ensures the similar value of calculated either from the Equation 4 (adopted in Hu et al. (2023)) or from the Equation 5 (adopted in this work). For the cases of higher mass-loss rate (e.g., ), Equation 4 significantly over-estimates the value of and then generates more luminous radiation as shown in the middle and right panels of Figure 3.


3.3.2 Free-free absorption
The free-free absorption effect is non-negligible in this study due to the relatively high CSM density. The free-free absorption is the function of the number density of ions and electrons, frequency, and the electron temperature () (Panagia & Felli, 1975; Yurk et al., 2022). The free-free optical depth and opacity are derived as
| (6) |
| (7) |
where adopted in our study. For simplicity, we use to represent the optical depth of the free-free absorption at 230 GHz in this paper. As shown in Figure 4, of the Eruptive model rapidly decreases to be negligible within the distance of ( cm in Figure 4), indicating that the generated millimeter-band radiation will escape outside the unshocked CSM when the shock propagates near the position of .

4 Results
Our ALMA observations obtain high sensitivity and give a deep upper limit as RMS 0.15 mJy. The corresponding luminosity is about . Such a lower luminosity limit strictly constrains the model. However, we do not apply the ejectaCSM interaction to fit the early-time X-ray and optical light curves. Therefore, it is hard to constrain each parameter, like the ejecta energy and ejecta mass. For simplicity and being consistent with previous studies, we assume that and . Besides, we consider two situations with (, ) and (, ) to represent the relatively high magnetic energy and low magnetic energy, respectively. is the ratio of the magnetic energy density and the thermal energy density. This low magnetic energy is also discussed in Chevalier et al. (2006).
For the Wind model, the only free parameter is the mass-loss rate. As shown in Figure 5 and the left panels of Figure 6, we ruled out the range for and for , respectively. The possible low value of is in contrast with the previous studies of SN 2024ggi, that the mass-loss rate is at the level of about revealed from the early-time spectroscopic features. On the other hand, the possible high value of indicates the radial distribution of CSM could extend to a few cm (as shown in the upper panel of Figure 7), in contrast with the disappearance of the narrow H emission line within a few days since the discovery. Therefore, the Wind model may not be the possible radial distribution of CSM surrounding SN 2024ggi.
For the Eruptive model, there are a few parameters to describe the distance-variant distribution of the mass-loss rate (, , , , , and ), and it hardly to constrain these parameters with the radio data only. We adopted the same piece-wise function as Equation 1 to match the early-time light curve of SN 2024ggi in an upcoming work (Yan, in prep.), and we roughly identify that cm, cm, cm, cm, and . Hence, the only free parameter for the Eruptive model in this paper is the . Our results indicate that is at the level of about for both and , or less than for and less than for as shown in the right panels of Figure 6. From the perspective of the early-time optical light curve and ionized emission lines, the CSM surrounding SN 2024ggi should be dense and close to the progenitor star. Therefore, we prefer that for the Eruptive model.
The mass-loss rate for the Eruptive model from our ALMA data aligns with the results from spectral model comparisons by Zhang et al. (2024), in which the early-time spectra of SN 2024ggi are consistent with the modeled spectra from Dessart et al. (2017). The model adopted by Zhang et al. (2024), which involves a mass-loss rate of and an outer radius of the dense CSM of , is similar to our results of and . This consistency suggests that the Eruptive model might be the possible distribution of CSM surrounding SN 2024ggi, a potential that should be explored further. Unfortunately, the gap in the ALMA observation between +8 and +13 days after the discovery missed the opportunity to capture the millimeter-band signal relating to the ejecta-CSM interaction in the scenario of the Eruptive model. Therefore, the necessity of multi-epoch ALMA observation with the interval of a few days for the type II SNe with the early-time ionized emission lines is underscored.
5 Discussions and Conclusions
This paper presented the early-time millimeter-band observation of SN 2024ggi by ALMA with three epochs of 8, 13, and 17 days after the discovery. The image sensitivity is less than 0.15 mJy, and the corresponding luminosity is about . The null detection with this deep sensitivity may indicate a large amount of shocked nonrelativistic electrons or significant free-free absorption. Therefore, we updated the radio-band radiation model shown in Hu et al. (2023) by considering the fraction of nonrelativistic electrons and the free-free absorption opacity relating to the unshocked CSM along the line of sight. These two factors significantly decrease the radio luminosity in the case of SN 2024ggi due to dense CSM.
SN 2024ggi, like SN 2023ixf and other Type II SNe with short-lived high-ionized emission lines, is surrounded by a dense CSM close to the progenitor star. As a result, we firmly favor the Eruptive model over the Wind model in describing the radial distribution of CSM surrounding SN 2024ggi.
In the context of an Eruptive model, the radial distribution of CSM could roughly be divided into two regions: the inner high-density region and the outer low-density region. When a shock emerges from the envelope of the progenitor star, the high-energy photons ionize the circumstellar gas close to the SN, resulting in the fast-evolving emission lines. The subsequent interaction of the ejecta and the inner high-density CSM may influence the early-time light curve. When the shock propagates within the inner high-density CSM, the generated millimeter-band radiation cannot escape the unshocked CSM due to the significant free-free absorption. As the shock reaches the region close to the low-density CSM, the millimeter-band optical depth of the free-free absorption drops below about 10, allowing us to potentially detect the associated signal (as shown in the lower panel of Figure 7).
Given the significant free-free absorption effect, the radio radiation is unable to escape from the unshocked CSM, even for the millimeter band. Therefore, sub-millimeter observations are crucial to capture the synchrotron radiation. To further refine our understanding of the distribution of mass-loss rate, we anticipate the need for multi-epoch observations at both millimeter and sub-millimeter bands of this type of target with intervals of a few days soon after the putative explosion date. This is a promising avenue for future research, as the radio signal rapidly decreases and becomes undetectable in the scenario of the Eruptive model.
6 Acknowledgments
This paper makes use of the following ALMA data: ADS/JAO.ALMA2023.A.00026.T. ALMA is a partnership of ESO (representing its member states), NSF (USA) and NINS (Japan), together with NRC (Canada), NSTC and ASIAA (Taiwan), and KASI (Republic of Korea), in cooperation with the Republic of Chile. The Joint ALMA Observatory is operated by ESO, AUI/NRAO and NAOJ. We would like to thank Ji Yang and Chentao Yang for the helpful discussions on the ALMA data. This work is supported by the National Natural Science Foundation of China (NSFC grants 12288102, 12403049, and 12033003) and the China Manned Spaced Project (CMS-CSST-2021-A12). Maokai Hu acknowledges the support from the Postdoctoral Fellowship Program of CPSF under Grant Number GZB20240376, and the Shuimu Tsinghua Scholar Program 2024SM118. Y.A. acknowledges the support from the National Natural Science Foundation of China (NSFC grants 12173089), the Natural Science Foundation of Jiangsu Province (BK20211401), and the “Light of West China” Program (No. xbzg-zdsys-202212). X. Wang acknowledges the support from the Tencent Xplorer Prize.
References
- Andrews et al. (2024) Andrews, J. E., Pearson, J., Hosseinzadeh, G., et al. 2024, ApJ, 965, 85, doi: 10.3847/1538-4357/ad2a49
- Berger et al. (2023) Berger, E., Keating, G. K., Margutti, R., et al. 2023, ApJ, 951, L31, doi: 10.3847/2041-8213/ace0c4
- Bietenholz et al. (2021) Bietenholz, M. F., Bartel, N., Argo, M., et al. 2021, ApJ, 908, 75, doi: 10.3847/1538-4357/abccd9
- Björnsson & Lundqvist (2014) Björnsson, C. I., & Lundqvist, P. 2014, ApJ, 787, 143, doi: 10.1088/0004-637X/787/2/143
- Bostroem et al. (2023) Bostroem, K. A., Pearson, J., Shrestha, M., et al. 2023, ApJ, 956, L5, doi: 10.3847/2041-8213/acf9a4
- Cao et al. (2013) Cao, Y., Kasliwal, M. M., Arcavi, I., et al. 2013, ApJ, 775, L7, doi: 10.1088/2041-8205/775/1/L7
- Chandra et al. (2012) Chandra, P., Chevalier, R. A., Chugai, N., et al. 2012, ApJ, 755, 110, doi: 10.1088/0004-637X/755/2/110
- Chandra et al. (2015) Chandra, P., Chevalier, R. A., Chugai, N., Fransson, C., & Soderberg, A. M. 2015, ApJ, 810, 32, doi: 10.1088/0004-637X/810/1/32
- Chandra et al. (2009) Chandra, P., Stockdale, C. J., Chevalier, R. A., et al. 2009, ApJ, 690, 1839, doi: 10.1088/0004-637X/690/2/1839
- Chen et al. (2024) Chen, T.-W., Yang, S., Srivastav, S., et al. 2024, arXiv e-prints, arXiv:2406.09270, doi: 10.48550/arXiv.2406.09270
- Cheng et al. (2024) Cheng, S. J., Goldberg, J. A., Cantiello, M., et al. 2024, ApJ, 974, 270, doi: 10.3847/1538-4357/ad701e
- Chevalier (1982) Chevalier, R. A. 1982, ApJ, 259, 302, doi: 10.1086/160167
- Chevalier (1998) —. 1998, ApJ, 499, 810, doi: 10.1086/305676
- Chevalier & Fransson (1994) Chevalier, R. A., & Fransson, C. 1994, ApJ, 420, 268, doi: 10.1086/173557
- Chevalier & Fransson (2006) —. 2006, ApJ, 651, 381, doi: 10.1086/507606
- Chevalier et al. (2006) Chevalier, R. A., Fransson, C., & Nymark, T. K. 2006, ApJ, 641, 1029, doi: 10.1086/500528
- Chevalier & Irwin (2012) Chevalier, R. A., & Irwin, C. M. 2012, ApJ, 747, L17, doi: 10.1088/2041-8205/747/1/L17
- Chugai (2024) Chugai, N. N. 2024, arXiv e-prints, arXiv:2410.17580, doi: 10.48550/arXiv.2410.17580
- DeMarchi et al. (2022) DeMarchi, L., Margutti, R., Dittman, J., et al. 2022, ApJ, 938, 84, doi: 10.3847/1538-4357/ac8c26
- Dessart et al. (2017) Dessart, L., Hillier, D. J., Yoon, S.-C., Waldman, R., & Livne, E. 2017, A&A, 603, A51, doi: 10.1051/0004-6361/201730873
- Gal-Yam et al. (2014) Gal-Yam, A., Arcavi, I., Ofek, E. O., et al. 2014, Nature, 509, 471, doi: 10.1038/nature13304
- Gorosabel et al. (2010) Gorosabel, J., de Ugarte Postigo, A., Castro-Tirado, A. J., et al. 2010, A&A, 522, A14, doi: 10.1051/0004-6361/200913263
- Hiramatsu et al. (2023) Hiramatsu, D., Tsuna, D., Berger, E., et al. 2023, ApJ, 955, L8, doi: 10.3847/2041-8213/acf299
- Horesh et al. (2013) Horesh, A., Stockdale, C., Fox, D. B., et al. 2013, MNRAS, 436, 1258, doi: 10.1093/mnras/stt1645
- Hu et al. (2024) Hu, M., Wang, L., & Wang, X. 2024, arXiv e-prints, arXiv:2411.06351. https://arxiv.org/abs/2411.06351
- Hu et al. (2023) Hu, M., Wang, L., Wang, X., & Wang, L. 2023, MNRAS, 525, 246, doi: 10.1093/mnras/stad2340
- Jacobson-Galán et al. (2023) Jacobson-Galán, W. V., Dessart, L., Margutti, R., et al. 2023, ApJ, 954, L42, doi: 10.3847/2041-8213/acf2ec
- Khazov et al. (2016) Khazov, D., Yaron, O., Gal-Yam, A., et al. 2016, ApJ, 818, 3, doi: 10.3847/0004-637X/818/1/3
- Langer (2012) Langer, N. 2012, ARA&A, 50, 107, doi: 10.1146/annurev-astro-081811-125534
- Li et al. (2024) Li, G., Hu, M., Li, W., et al. 2024, Nature, 627, 754, doi: 10.1038/s41586-023-06843-6
- Lin et al. (2021) Lin, H., Wang, X., Zhang, J., et al. 2021, MNRAS, 505, 4890, doi: 10.1093/mnras/stab1550
- Lundqvist et al. (2020) Lundqvist, P., Kundu, E., Pérez-Torres, M. A., et al. 2020, ApJ, 890, 159, doi: 10.3847/1538-4357/ab6dc6
- Maeda et al. (2021) Maeda, K., Chandra, P., Matsuoka, T., et al. 2021, ApJ, 918, 34, doi: 10.3847/1538-4357/ac0dbc
- Maeda et al. (2023) Maeda, K., Chandra, P., Moriya, T. J., et al. 2023, ApJ, 942, 17, doi: 10.3847/1538-4357/aca1b7
- Margalit et al. (2022) Margalit, B., Quataert, E., & Ho, A. Y. Q. 2022, ApJ, 928, 122, doi: 10.3847/1538-4357/ac53b0
- Matsuoka & Sawada (2024) Matsuoka, T., & Sawada, R. 2024, ApJ, 963, 105, doi: 10.3847/1538-4357/ad1829
- Moriya et al. (2013) Moriya, T. J., Maeda, K., Taddia, F., et al. 2013, MNRAS, 435, 1520, doi: 10.1093/mnras/stt1392
- Panagia & Felli (1975) Panagia, N., & Felli, M. 1975, A&A, 39, 1
- Pérez-Torres et al. (2014) Pérez-Torres, M. A., Lundqvist, P., Beswick, R. J., et al. 2014, ApJ, 792, 38, doi: 10.1088/0004-637X/792/1/38
- Pessi et al. (2024) Pessi, T., Cartier, R., Hueichapan, E., et al. 2024, A&A, 688, L28, doi: 10.1051/0004-6361/202450608
- Phillips et al. (1993) Phillips, J. A., Kulkarni, S. R., Skiff, B., et al. 1993, IAU Circ., 5775, 1
- Piro et al. (2021) Piro, A. L., Haynie, A., & Yao, Y. 2021, ApJ, 909, 209, doi: 10.3847/1538-4357/abe2b1
- Sfaradi et al. (2024) Sfaradi, I., Horesh, A., Sollerman, J., et al. 2024, A&A, 686, A129, doi: 10.1051/0004-6361/202348761
- Shrestha et al. (2024) Shrestha, M., Bostroem, K. A., Sand, D. J., et al. 2024, ApJ, 972, L15, doi: 10.3847/2041-8213/ad6907
- Smith et al. (2023) Smith, N., Pearson, J., Sand, D. J., et al. 2023, ApJ, 956, 46, doi: 10.3847/1538-4357/acf366
- Soderberg et al. (2008) Soderberg, A. M., Berger, E., Page, K. L., et al. 2008, Nature, 453, 469, doi: 10.1038/nature06997
- Srivastav et al. (2024) Srivastav, S., Chen, T. W., Smartt, S. J., et al. 2024, Transient Name Server AstroNote, 100, 1
- Svirski et al. (2012) Svirski, G., Nakar, E., & Sari, R. 2012, ApJ, 759, 108, doi: 10.1088/0004-637X/759/2/108
- Tonry et al. (2024) Tonry, J., Denneau, L., Weiland, H., et al. 2024, Transient Name Server Discovery Report, 2024-1020, 1
- van Dyk et al. (1996) van Dyk, S. D., Weiler, K. W., Sramek, R. A., et al. 1996, AJ, 111, 1271, doi: 10.1086/117872
- Weiler et al. (2007) Weiler, K. W., Williams, C. L., Panagia, N., et al. 2007, ApJ, 671, 1959, doi: 10.1086/523258
- Wood-Vasey et al. (2004) Wood-Vasey, W. M., Wang, L., & Aldering, G. 2004, ApJ, 616, 339, doi: 10.1086/424826
- Xiang et al. (2024) Xiang, D., Mo, J., Wang, X., et al. 2024, ApJ, 969, L15, doi: 10.3847/2041-8213/ad54b3
- Yan (in prep.) Yan, S. in prep.
- Yaron et al. (2017) Yaron, O., Perley, D. A., Gal-Yam, A., et al. 2017, Nature Physics, 13, 510, doi: 10.1038/nphys4025
- Yurk et al. (2022) Yurk, N. Y., Ravi, V., & Ho, A. Y. Q. 2022, ApJ, 934, 5, doi: 10.3847/1538-4357/ac771f
- Zhai et al. (2024) Zhai, Q., Li, L., Wang, Z., Zhang, J., & Wang, X. 2024, Transient Name Server AstroNote, 104, 1
- Zhang et al. (2020) Zhang, J., Wang, X., József, V., et al. 2020, MNRAS, 498, 84, doi: 10.1093/mnras/staa2273
- Zhang et al. (2023) Zhang, J., Lin, H., Wang, X., et al. 2023, Science Bulletin, 68, 2548, doi: 10.1016/j.scib.2023.09.015
- Zhang et al. (2024) Zhang, J., Dessart, L., Wang, X., et al. 2024, ApJ, 970, L18, doi: 10.3847/2041-8213/ad5da4
- Zimmerman et al. (2024) Zimmerman, E. A., Irani, I., Chen, P., et al. 2024, Nature, 627, 759, doi: 10.1038/s41586-024-07116-6