Dynamic Response of Wigner Crystals
Abstract
The Wigner crystal, an ordered array of electrons, is one of the very first proposed many-body phases stabilized by the electron-electron interaction. This electron solid phase has been reported in ultra-clean two-dimensional electron systems at extremely low temperatures, where the Coulomb interaction dominants over the kinetic energy, disorder potential and thermal fluctuation. We closely examine this quantum phase with capacitance measurements where the device length-scale is comparable with the crystal’s correlation length. The extraordinarily high performance of our technique makes it possible to quantitatively study the dynamic response of the Wigner crystal within the single crystal regime. Our result will greatly boost the study of this inscrutable electron solid.
Interacting two-dimensional electron system (2DES) subjected to high perpendicular magnetic fields () and cooled to low temperatures exhibits a plethora of exotic states Jain (2007). The Wigner crystal (WC) Wigner (1934) terminates the sequence of fractional quantum Hall states at very small landau level filling factor Jiang et al. (1990); Goldman et al. (1990); Li et al. (1991); Santos et al. (1992); Sajoto et al. (1993); Pan et al. (2002); Maryenko et al. (2018); Hossain et al. (2020); Chung et al. (2022); Lozovik and Yudson (1975); Lam and Girvin (1984); Levesque et al. (1984); Andrei et al. (1988); Williams et al. (1991); Li et al. (1997); Ye et al. (2002); Chen et al. (2004); Li et al. (1995); Deng et al. (2019); Chen et al. (2006); Drichko et al. (2016); Tiemann et al. (2014). This electron solid is pinned by the ubiquitous residual disorder, manifests as an insulating phase in DC transport Jiang et al. (1990); Goldman et al. (1990); Li et al. (1991); Santos et al. (1992); Sajoto et al. (1993); Pan et al. (2002); Maryenko et al. (2018); Hossain et al. (2020); Chung et al. (2022), and the electrons’ collective motion is evidenced by a resonance in AC transport Lozovik and Yudson (1975); Lam and Girvin (1984); Levesque et al. (1984); Andrei et al. (1988); Williams et al. (1991); Li et al. (1997); Ye et al. (2002); Chen et al. (2004). A series of experiments have been applied to investigate this correlated solid, such as the nonlinear response Goldman et al. (1990); Williams et al. (1991), the noise spectrum Li et al. (1991), the huge dielectric constant Li et al. (1995), the weak screening efficiency Deng et al. (2019), the melting process Chen et al. (2006); Drichko et al. (2016); Deng et al. (2019), the nuclear magnetic resonance Tiemann et al. (2014) and the optics Zhou et al. (2021); Smoleński et al. (2021).
Capacitance measurements have revealed a series of quantum phenomena Mosser et al. (1986); Ashoori et al. (1992); Smith et al. (1986); Yang et al. (1997); Eisenstein et al. (1994); Zibrov et al. (2017); Irie et al. (2019); Eisenstein et al. (1992); Jo et al. (1993); Li et al. (2011); Zibrov et al. (2018); Tomarken et al. (2019); Deng et al. (2019). In this work, we examine the WC formed in an ultra-high mobility 2DES at 1/5 using high-precision capacitance measurement Zhao et al. (2022a, b). We find an exceedingly large capacitance at low measurement frequency while the conductance is almost zero. This phenomenon is inconsistent with transporting electrons, but rather an evidence that the synchronous vibration of electrons induces a polarization current. When we increase , our high-precision measurement captures the fine structure of the resonance response with a puzzling ”half-dome” structure. Our systematic, quantitative results provide an in-depth insight of this murky quantum phase.
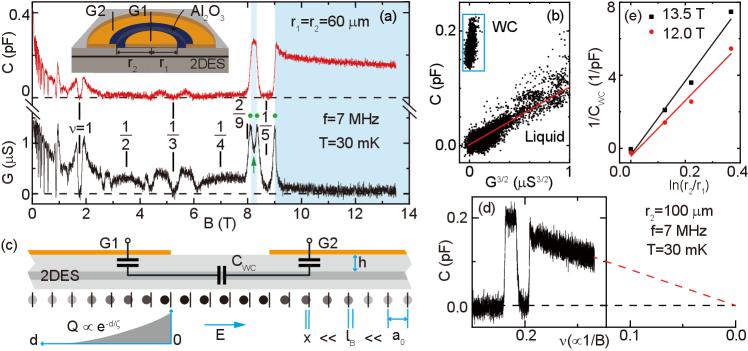
Our sample consists an ultra-clean low-density 2DES confined in a 70-nm-wide GaAs quantum well with electron density cm-2 and mobility 17 cm2/(Vs). Each device has a pair of front concentric gates G1 and G2, whose outer and inner radius are and , respectively; see the inset of Fig. 1(a) 111See Supplemental Material for detailed description of our sample information and measurement techniques.. We study four devices with 60 m and 60, 80, 100 and 140 m, respectively. We measure the capacitance and conductance between the two gates using a cryogenic bridge and analyze its output with a custom-made radio-frequency lock-in amplifier Zhao et al. (2022a, b); Note (1).
Fig. 1(a) shows the and measured from the 60 m sample. Both and decrease as we increase the magnetic field , owing to the magnetic localization where the 2DES conductance , , and are the effective mass, cyclotron frequency and transport scattering time of the electrons, respectively Zhao et al. (2022b). The and are finite at and 1/4 where the 2DES forms compressible composite Fermion Fermi sea. When is an integer or a certain fraction such as 1/3 and 1/5, the 2DES forms incompressible quantum Hall liquids so that both and vanish 222The zero of and can be defined either by extrapolating their field dependence to , or by their values at strong quantum hall states such as . These two approaches are consistent with each other and the dash lines in Fig. 1(a) represent the deduced zero..
In all the above cases, the current is carried by transporting electrons, so that has a positive dependence on , i.e. , as shown in Fig. 1(b) Zhao et al. (2022b). Such a correlation discontinues when the WC forms at very low filling factors , see the blue shaded regions of Fig. 1(a). The vanishing conductance suggests that the electrons are immovable, however, the surprisingly large capacitance evidences that the WC hosts a current even surpassing the conducting Fermi sea at and 1/4 at much lower magnetic field! The phase transition between the WC and the liquid states are clearly evidenced by spikes in (marked by solid circles in Fig. 1(a)) and sharp raises in . A developing minimum is seen in at (marked by the up-arrow) when has a peak. This minimum develops towards zero and the peak saturates when the solid phase is stronger (see black traces in Fig. 3(a)). This is consistent with the reentrant insulating phase Jiang et al. (1990); Goldman et al. (1990); Williams et al. (1991); Li et al. (1991); Chen et al. (2004); Shayegan (2006, 1998).
It is important to mention that the 2DES in our devices is effectively “isolated” and we are merely transferring charges between different regions within one quantum phase. Similar to the dielectric materials which also have no transporting electrons, the collective motion of all electrons, i.e. the phonon mode of WC, can generate polarization charges and corresponding polarization current in response to the in-plane component of applied electric field. An infinitesimally small but ubiquitous disorder pins the WC so that electrons can only be driven out of their equilibrium lattice site by a small displacement , as shown in Fig. 1(c). During the experiments, we use excitation 0.1 mV and the measured WC capacitance is 0.15 pF at 13.5 T. The polarization charge accumulated under the inner gate is 100 . The corresponding electron displacement at the boundary of the inner gate, nm, is much smaller than the magnetic length nm, substantiating our assumption that the electrons vibrate diminutively around their equilibrium lattice sites.
An ideal, disorder-free WC is effectively a perfect dielectric with infinite permittivity, so that the device capacitance should be close to its zero-field value 1 pF when 2DES is an excellent conductor. We note that is consistent with the device geometry, 1.3 pF, where is the relative dielectric constant of GaAs and 960 nm is the depth of 2DES. However, the measured pF in the WC regime is much smaller than . This discrepancy is likely caused by the friction-like disorder which poses a pinning force on the electrons. When the crystal’s inversion symmetry is broken, i.e. is non-uniform and is finite, the electron-electron interaction generates a restoring force , where , and are the elastic tensor, WC lattice constant and the Jacobi matrix of , respectively. At the low frequency limit, the WC is always at equilibrium and all forces are balanced, , is the total parallel electric field on the WC.
is approximately zero under the metal gates, since the gate-to-2DES distance is small. Therefore, decreases exponentially when the distance from the gate boundary increases, , where is the decay length. Deeply inside the gates, electrons feel neither parallel electric field nor net pressure from nearby electrons, so that their displacement remains approximately zero. This region does not contribute to the capacitive response, and the effective gate area reduces to about and at the inner and outer gate, respectively. Because 60 m in Fig. 1(a), the experimentally measured 0.15 pF at 13.5 T corresponds to a decay length 6.7 m. Interestingly, our result shows a linear dependence in Fig. 1(d), suggesting that if we assume is independent on . Especially, the pinning becomes infinitely strong, i.e. , at the extreme quantum limit .
The permittivity of a disorder-pinned WC is no longer infinitely large, since a non-zero electric field is necessary to sustain a finite . If we assume is a constant in the ring area between the two gates, so that . The residual can be modeled as a serial capacitance in our device. We then measure different devices with = 60 m and , 80, 100 and 140 m, and calculate the corresponding through , see Fig. 1(e). By fitting the linear dependence , we estimate the pinning strength to be about 1.3 and 1.1 N/m at and 12 T, respectively 333Alternatively, can be modeled as a cylinder capacitor whose height equals the effective thickness of the 2DES, nm. The WC dielectric constant is at 13.5 T, consistent with previous reported value in ref. Li et al. (1995).. Finally, assuming , we can estimate the WC elastic modulus . For example, is about N/m at 13.5 T.
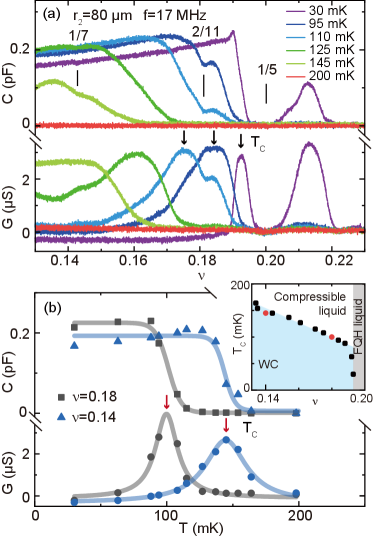
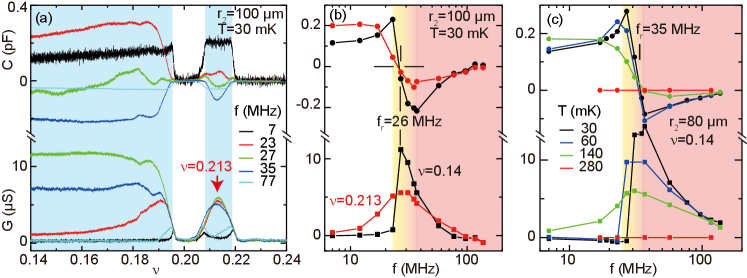
Fig. 2 reveals an intriguing temperature-induced solid-liquid phase transition when the WC melts. Fig. 2(a) shows and taken from the m sample at various temperatures. At a certain temperature, e.g. at mK, pF when the 2DES forms WC at and vanishes when it is a liquid phase at . has a peak at when vs. has the maximal negative slope, and it is small when the 2DES is either a WC at or a liquid at 444We observe developing minimum at during the solid-liquid phase transition, signaling that the fractional quantum Hall state emerges Pan et al. (2002); Chung et al. (2022).. At very high temperature 200 mK, both and are close to zero. In Fig. 2(b), we summarized and as a function of at two different filling factors to better illustrate this solid-liquid transition. At , for example, is large and is small at mK when the WC is stable 555 vs. has a slightly positive slope in the WC region, possibly due to the softening of disorder pinning., while both of them become small at mK when the 2DES is a liquid. The has a peak at a critical temperature , marked by the red arrows, around which the precipitous decrease of happens. Alternatively, at a certain filling factor can be defined as the temperature when the has a peak (black arrow in Fig. 2(a)) at . We summarize obtained using these two equivalent procedures in the Fig. 2(b) inset with corresponding red and black symbols. has a linear dependence on whose two intercepts are mK at the extreme quantum limit , and 1/4 at mK.
The Fig. 2(b) evolution can be qualitatively understood by the coexistence of transport and polarization currents at the solid-liquid transition. The large reduces to almost zero when the transport current dominates over the polarization current. is a measure of the 2DES’s capacity to absorb and dissipate power. It is negligible if either of these two currents dominates, since the polarization current is dissipation-less and the dissipating transport current is difficult to excite. becomes large when these two currents coexist nip and tuck at intermediate when the excited polarization charge can be just dissipated by the transport current.
The WC exhibits a resonance when we increase the excitation frequency. In Fig. 3(a), the and measured from the m sample using different excitation frequencies change enormously when the WC presents (blue shaded region). is almost zero and is large at MHz, and becomes finite and becomes even larger at MHz. At slightly higher frequency 27 MHz, reaches its maximum and drops to about zero. Further increasing , gradually declines while first becomes negative at 35 MHz and then gradually approaches zero. The summarized and vs. at two certain fillings in Fig. 3(b), resembles qualitatively a resonant behavior with resonance frequency MHz (when ). Fig. 3(c) studies this resonance at different temperatures. The data is taken from the 80 m sample whose resonance frequency is about 35 MHz 666 has no obvious dependence with sample geometry, which is about 35, 35, 26 and 29 MHz for samples with = 60, 80, 100, 140 m, respectively.. The abrupt change of near becomes gradual and the peak flattens at higher temperatures. Both and become flat zero at mK. It is noteworthy that, as long as a resonance is seen, is nearly independent on the filling factor (Fig. 3(b)) and temperatures (Fig. 3(c)). This is consistent with another experimental study using surface acoustic wave Drichko et al. (2016).
The resonance of WC is usually explained by the pinning mode Fogler and Huse (2000); Ye et al. (2002). The resonance frequency is related to the mean free path of the transverse phonon through , where is the classical shear modulus of WC. MHz corresponds to 3.2 m, very similar to m in our Fig. 1(c) discussion. This is justifiable because both and describe the length-scale within which the collective motion of WC is damped/scattered by the random pinning potential.
Before ending the discussion, we would like to highlight the puzzling ”half-dome” structure of the resonance. has a regular-shaped resonance peak, i.e. decreases gradually on both sides of , when either the WC is weak ( in Fig. 3(b)) or the temperature is high ( mK in Fig. 3(c)). Surprisingly, the resonance peak becomes quite peculiar when the WC is strong at and mK. gradually decreases from its peak at on the high frequency side , while it vanishes instantly when the frequency is lower than , resulting in a ”half-dome” vs. trace. Meanwhile, the increases by times and then abruptly changes to negative at . This anomalous ”half-dome” feature is seen in all of our devices as long as the WC is strong and temperature is sufficiently low, suggesting a threshold frequency for the power dissipation.
In conclusion, using the extraordinarily high-precision capacitance measurement technique, we investigate the dynamic response of WC systematically. From the quantitative results and using a simple model, we can study several physical properties of the WC such as elastic modulus, dielectric constant, pinning strength, etc., and discover a puzzling ”half-dome” feature in the resonance peak. Our results certainly shine light on the study of WC and provides new insight on its dynamics.
Acknowledgements.
We acknowledge support by the National Nature Science Foundation of China (Grant No. 92065104 and 12074010) and the National Basic Research Program of China (Grant No. 2019YFA0308403) for sample fabrication and measurement. This research is funded in part by the Gordon and Betty Moore Foundation’s EPiQS Initiative, Grant GBMF9615 to L. N. Pfeiffer, and by the National Science Foundation MRSEC grant DMR 2011750 to Princeton University. We thank L. W. Engel, Bo Yang and Xin Lin for valuable discussion.References
- Jain (2007) J. K. Jain, Composite Fermions (Cambridge University Press, Cambridge, UK, 2007).
- Wigner (1934) E. Wigner, Phys. Rev. 46, 1002 (1934).
- Jiang et al. (1990) H. W. Jiang, R. L. Willett, H. L. Stormer, D. C. Tsui, L. N. Pfeiffer, and K. W. West, Phys. Rev. Lett. 65, 633 (1990).
- Goldman et al. (1990) V. J. Goldman, M. Santos, M. Shayegan, and J. E. Cunningham, Phys. Rev. Lett. 65, 2189 (1990).
- Li et al. (1991) Y. P. Li, T. Sajoto, L. W. Engel, D. C. Tsui, and M. Shayegan, Phys. Rev. Lett. 67, 1630 (1991).
- Santos et al. (1992) M. B. Santos, Y. W. Suen, M. Shayegan, Y. P. Li, L. W. Engel, and D. C. Tsui, Phys. Rev. Lett. 68, 1188 (1992).
- Sajoto et al. (1993) T. Sajoto, Y. P. Li, L. W. Engel, D. C. Tsui, and M. Shayegan, Phys. Rev. Lett. 70, 2321 (1993).
- Pan et al. (2002) W. Pan, H. L. Stormer, D. C. Tsui, L. N. Pfeiffer, K. W. Baldwin, and K. W. West, Phys. Rev. Lett. 88, 176802 (2002).
- Maryenko et al. (2018) D. Maryenko, A. McCollam, J. Falson, Y. Kozuka, J. Bruin, U. Zeitler, and M. Kawasaki, Nature Communications 9, 4356 (2018).
- Hossain et al. (2020) M. S. Hossain, M. K. Ma, K. A. V. Rosales, Y. J. Chung, L. N. Pfeiffer, K. W. West, K. W. Baldwin, and M. Shayegan, Proceedings of the National Academy of Sciences 117, 32244 (2020).
- Chung et al. (2022) Y. J. Chung, D. Graf, L. W. Engel, K. A. V. Rosales, P. T. Madathil, K. W. Baldwin, K. W. West, L. N. Pfeiffer, and M. Shayegan, Phys. Rev. Lett. 128, 026802 (2022).
- Lozovik and Yudson (1975) Y. Lozovik and V. Yudson, JETP Lett. 22, 11 (1975).
- Lam and Girvin (1984) P. K. Lam and S. M. Girvin, Phys. Rev. B 30, 473 (1984).
- Levesque et al. (1984) D. Levesque, J. J. Weis, and A. H. MacDonald, Phys. Rev. B 30, 1056 (1984).
- Andrei et al. (1988) E. Y. Andrei, G. Deville, D. C. Glattli, F. I. B. Williams, E. Paris, and B. Etienne, Phys. Rev. Lett. 60, 2765 (1988).
- Williams et al. (1991) F. I. B. Williams, P. A. Wright, R. G. Clark, E. Y. Andrei, G. Deville, D. C. Glattli, O. Probst, B. Etienne, C. Dorin, C. T. Foxon, and J. J. Harris, Phys. Rev. Lett. 66, 3285 (1991).
- Li et al. (1997) C.-C. Li, L. W. Engel, D. Shahar, D. C. Tsui, and M. Shayegan, Phys. Rev. Lett. 79, 1353 (1997).
- Ye et al. (2002) P. D. Ye, L. W. Engel, D. C. Tsui, R. M. Lewis, L. N. Pfeiffer, and K. West, Phys. Rev. Lett. 89, 176802 (2002).
- Chen et al. (2004) Y. P. Chen, R. M. Lewis, L. W. Engel, D. C. Tsui, P. D. Ye, Z. H. Wang, L. N. Pfeiffer, and K. W. West, Phys. Rev. Lett. 93, 206805 (2004).
- Li et al. (1995) Y. Li, D. Tsui, T. Sajoto, L. Engel, M. Santos, and M. Shayegan, Solid State Communications 95, 619 (1995).
- Deng et al. (2019) H. Deng, L. N. Pfeiffer, K. W. West, K. W. Baldwin, L. W. Engel, and M. Shayegan, Phys. Rev. Lett. 122, 116601 (2019).
- Chen et al. (2006) Y. P. Chen, G. Sambandamurthy, Z. H. Wang, R. M. Lewis, L. W. Engel, D. C. Tsui, P. D. Ye, L. N. Pfeiffer, and K. W. West, Nature Physics 2, 452 (2006).
- Drichko et al. (2016) I. L. Drichko, I. Y. Smirnov, A. V. Suslov, Y. M. Galperin, L. N. Pfeiffer, and K. W. West, Phys. Rev. B 94, 075420 (2016).
- Tiemann et al. (2014) L. Tiemann, T. D. Rhone, N. Shibata, and K. Muraki, Nature Physics 10, 648 (2014).
- Zhou et al. (2021) Y. Zhou, J. Sung, E. Brutschea, I. Esterlis, Y. Wang, G. Scuri, R. J. Gelly, H. Heo, T. Taniguchi, K. Watanabe, G. Zaránd, M. D. Lukin, P. Kim, E. Demler, and H. Park, Nature 595, 48 (2021).
- Smoleński et al. (2021) T. Smoleński, P. E. Dolgirev, C. Kuhlenkamp, A. Popert, Y. Shimazaki, P. Back, X. Lu, M. Kroner, K. Watanabe, T. Taniguchi, I. Esterlis, E. Demler, and A. Imamoğlu, Nature 595, 53 (2021).
- Mosser et al. (1986) V. Mosser, D. Weiss, K. Klitzing, K. Ploog, and G. Weimann, Solid State Communications 58, 5 (1986).
- Ashoori et al. (1992) R. C. Ashoori, H. L. Stormer, J. S. Weiner, L. N. Pfeiffer, S. J. Pearton, K. W. Baldwin, and K. W. West, Phys. Rev. Lett. 68, 3088 (1992).
- Smith et al. (1986) T. P. Smith, W. I. Wang, and P. J. Stiles, Phys. Rev. B 34, 2995 (1986).
- Yang et al. (1997) M. J. Yang, C. H. Yang, B. R. Bennett, and B. V. Shanabrook, Phys. Rev. Lett. 78, 4613 (1997).
- Eisenstein et al. (1994) J. P. Eisenstein, L. N. Pfeiffer, and K. W. West, Phys. Rev. B 50, 1760 (1994).
- Zibrov et al. (2017) A. A. Zibrov, C. Kometter, H. Zhou, E. M. Spanton, T. Taniguchi, K. Watanabe, M. P. Zaletel, and A. F. Young, Nature 549, 360 (2017).
- Irie et al. (2019) H. Irie, T. Akiho, and K. Muraki, Applied Physics Express 12, 063004 (2019).
- Eisenstein et al. (1992) J. P. Eisenstein, L. N. Pfeiffer, and K. W. West, Phys. Rev. Lett. 68, 674 (1992).
- Jo et al. (1993) J. Jo, E. A. Garcia, K. M. Abkemeier, M. B. Santos, and M. Shayegan, Phys. Rev. B 47, 4056 (1993).
- Li et al. (2011) L. Li, C. Richter, S. Paetel, T. Kopp, J. Mannhart, and R. C. Ashoori, Science 332, 825 (2011).
- Zibrov et al. (2018) A. A. Zibrov, P. Rao, C. Kometter, E. M. Spanton, J. I. A. Li, C. R. Dean, T. Taniguchi, K. Watanabe, M. Serbyn, and A. F. Young, Phys. Rev. Lett. 121, 167601 (2018).
- Tomarken et al. (2019) S. L. Tomarken, Y. Cao, A. Demir, K. Watanabe, T. Taniguchi, P. Jarillo-Herrero, and R. C. Ashoori, Phys. Rev. Lett. 123, 046601 (2019).
- Zhao et al. (2022a) L. Zhao, W. Lin, X. Fan, Y. Song, H. Lu, and Y. Liu, Review of Scientific Instruments 93, 053910 (2022a).
- Zhao et al. (2022b) L. Zhao, W. Lin, Y. J. Chung, K. W. Baldwin, L. N. Pfeiffer, and Y. Liu, Chinese Physics Letters 39, 097301 (2022b).
- Note (1) See Supplemental Material for detailed description of our sample information and measurement techniques.
- Note (2) The zero of and can be defined either by extrapolating their field dependence to , or by their values at strong quantum hall states such as . These two approaches are consistent with each other and the dash lines in Fig. 1(a) represent the deduced zero.
- Shayegan (2006) M. Shayegan, in High Magnetic Fields: Science and Technology, Vol. 3, edited by F. Herlach and N. Miura (World Scientific, Singapore, 2006) pp. 31–60.
- Shayegan (1998) M. Shayegan, in Perspectives in Quantum Hall Effects, edited by S. D. Sarma and A. Pinczuk (Wiley, New York, 1998) pp. 343–383.
- Note (3) Alternatively, can be modeled as a cylinder capacitor whose height equals the effective thickness of the 2DES, nm. The WC dielectric constant is at 13.5 T, consistent with previous reported value in ref. Li et al. (1995).
- Note (4) We observe developing minimum at during the solid-liquid phase transition, signaling that the fractional quantum Hall state emerges Pan et al. (2002); Chung et al. (2022).
- Note (5) vs. has a slightly positive slope in the WC region, possibly due to the softening of disorder pinning.
- Note (6) has no obvious dependence with sample geometry, which is about 35, 35, 26 and 29 MHz for samples with = 60, 80, 100, 140 m, respectively.
- Fogler and Huse (2000) M. M. Fogler and D. A. Huse, Phys. Rev. B 62, 7553 (2000).
I Supplementary Materials
I.1 Samples
The sample we studied is made from a GaAs/AlGaAs heterostructure wafer grown by molecular beam epitaxy. A 70 nm-wide GaAs quantum well is bound by AlGaAs spacer-layers and -doped layers on each side, and locates 960 nm below the sample surface. The as-grown density of the 2DES is cm-2, and its mobility at 300 mK is 17 cm2/(Vs). Our sample is a 2 mm 2 mm square piece with four In/Sn contacts at each corner. The contacts are grounded through a resistor to avoid signal leaking. We evaporate concentric, Au/Ti front gate pair G1 and G2 using standard lift-off process, whose outer and inner radius is and , respectively. We deposit a 20 nm thick Al2O3 layer between the two gates to prevent them from shorting with each other. The four outer-gates are merged into one piece so that the area of the outer gate G2 is much larger than the inner gate G1.
I.2 Capacitance Measurement Setup
The capacitance and conductance response is measured with a cryogenic bridge similar to refs. Zhao et al. (2022a, b).
The kernel of the bridge consists four devices, , , and , as shown in Fig. S1(a). is the capacitance of sample. We change the value of to reach the balance condition
| (1) |
The bridge output is minimum at the balance condition, from which we calculate the . This is the so-call “V-curve” procedure, see refs. Zhao et al. (2022a, b) for more information.
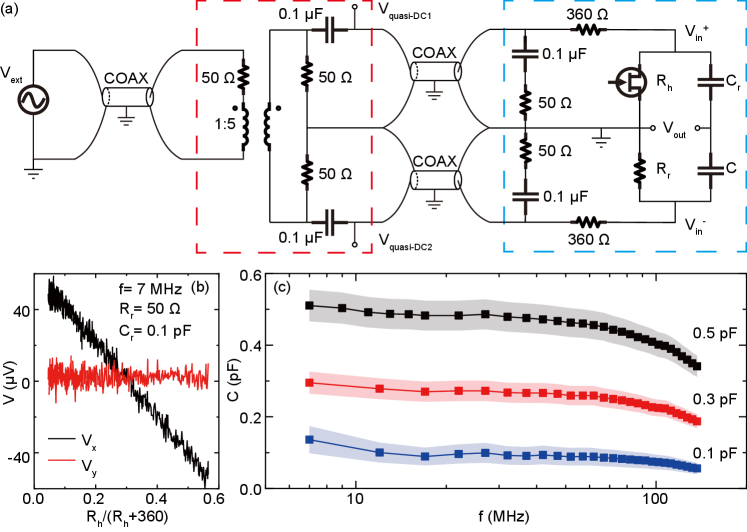
In order to expand the allowed bandwidth of the excitation frequency, we add an impedance match network to the input of the bridge, shown as the Fig. S1(a). is the signal source with 50 output impedance. drives a signal splitter box (the red dashed box) located at the top of the dilution refrigerator through a 2 m-long semi-rigid coaxial cable. The box input is a 1:5 transformer in series with a 50 resistor. The transformer output drives two serial connected 50 resistors differentially. The differential signals are transmitted to the cryogenic sample holder (the blue dotted box) by two rigid coaxial cables of 2 m length. Another pair of impedance matching 50 resistors are added at the input of the cryogenic bridge, and the 360 resistors are chosen by balancing the competition between the performance and heating. The characteristic impedance of all coaxial cables in the work is 50 .
The low-frequency signals and used to measure the value of and , respectively. The 0.1 F capacitors are used to separate the high-frequency excitation signals and the quasi-DC signal.
The output is approximately
| (2) |
can be obtain from the “V-curve” procedure by linear fitting the vs. , as shown in Fig. S1(b). and are the orthogonal component of ,
| (3) | |||||
| (4) |
where is the phase of . We can derive the value of using Eq. (2) and (3). The new balance condition of the revised bridge is
| (5) |
where the .
Note that the capacitance and the conductance of sample lead to the orthogonal component and , respectively. Therefore, the can be obtained from Eq. (2) and (4) by replacing with , where is the excitation frequency.
Fig. S1(c) shows our calibration measurement using different excitation frequencies. The data is almost flat from 7 to 100 MHz. The measured capacitance begins to decline slowly above 100 MHz, possibly due to the parasitic inductance of bonding wires.