Distributionally Robust Batch Contextual Bandits
Abstract
Policy learning using historical observational data is an important problem that has found widespread applications. Examples include selecting offers, prices, advertisements to send to customers, as well as selecting which medication to prescribe to a patient. However, existing literature rests on the crucial assumption that the future environment where the learned policy will be deployed is the same as the past environment that has generated the data – an assumption that is often false or too coarse an approximation. In this paper, we lift this assumption and aim to learn a distributionally robust policy with incomplete observational data. We first present a policy evaluation procedure that allows us to assess how well the policy does under worst-case environment shift. We then establish a central limit theorem type guarantee for this proposed policy evaluation scheme. Leveraging this evaluation scheme, we further propose a novel learning algorithm that is able to learn a policy that is robust to adversarial perturbations and unknown covariate shifts with a performance guarantee based on the theory of uniform convergence. Finally, we empirically test the effectiveness of our proposed algorithm in synthetic datasets and demonstrate that it provides the robustness that is missing using standard policy learning algorithms. We conclude the paper by providing a comprehensive application of our methods in the context of a real-world voting dataset.
1 Introduction
As a result of the digitization of our economy, user-specific data has exploded across a variety of application domains: electronic medical data in health care, marketing data in product recommendation, and customer purchase/selection data in digital advertising ([10, 53, 15, 6, 68]). Such growing availability of user-specific data has ushered in an exciting era of personalized decision making, one that allows the decision maker(s) to personalize the service decisions based on each individual’s distinct features. As such, heterogeneity across individuals (i.e. best recommendation decisions vary across individuals) can be intelligently exploited to achieve better outcomes.
When abundant historical data are available, effective personalization can be achieved by learning a policy offline (i.e. from the collected data) that prescribes the right treatment/selection/recommendation based on individual characteristics. Such an approach has been fruitfully explored (see Section 1.3) and has witnessed tremendous success. However, this success is predicated on (and hence restricted to) the setting where the learned policy is deployed in the same environment from which past data has been collected. This restriction limits the applicability of the learned policy, because one would often want to deploy this learned policy in a new environment where the population characteristics are not entirely the same as before, even though the underlying personalization task is still the same. Such settings occur frequently in managerial contexts, such as when a firm wishes to enter a new market for the same business, hence facing a new, shifted environment that is similar yet different. We highlight several examples below:
Product Recommendation in a New Market. In product recommendation, different products and/or promotion offers are directed to different customers based on their covariates (e.g. age, gender, education background, income level, marital status) in order to maximize sales. Suppose the firm has enjoyed great success in the US market by deploying an effective personalized product recommendation scheme that is learned from its US operations data111Such data include a database of transactions, each of which records the consumer’s individual characteristics, the recommended item, and the purchase outcome., and is now looking to enter a new market in Europe. What policy should the firm use initially, given that little transaction data in the new market is available? The firm could simply reuse the same recommendation policy that is currently deployed for the US market. However, this policy could potentially be ineffective because the population in the new market often has idiosyncratic features that are somewhat distinct from the previous market. For instance, the market demographics will be different; further, even two individuals with the same observable covariates in different markets could potentially have different preferences as a result of the cultural, political, and environmental divergences. Consequently, such an environment-level “shift” renders the previously learned policy fragile. Note that in such applications, taking the standard online learning approach – by gradually learning to recommend in the new market as more data in that market becomes available – is both wasteful and risky. It is wasteful because it entirely ignores the US market data even though presumably the two markets still share similarities and useful knowledge/insights can be transferred. It is also risky because a “cold start” policy may be poor enough to cause the loss of customers in an initial phase, in which case little further data can be gathered. Moreover, there may be significant reputation costs associated with the choice of a poor cold start. Finally, many personalized content recommendation platforms – such as news recommendation or video recommendation – also face these problems when initiating a presence in a new market.
Feature-Based Pricing in a New Market. In feature-based pricing, a platform sells a product with features on day to a customer, and prices it at , which corresponds to the action (assumed to take discrete values). The reward is the revenue collected from the customer, which is if the customer decides to purchase the product and otherwise. The (generally-unknown-to-the-platform) probability of the customer purchasing this product depends on both the price and the product itself. If the platform now wishes to enter a new market to sell its products, it will need to learn a distributionally robust feature-based pricing policy (which maps to ) that takes into account possible distributional shifts which arise in the new market.
Loan Interest Rate Provisioning in a New Market In loan interest rate provisioning, the loan provider (typically a bank) would gather individual information (such as personal credit history, outstanding loans, current assets and liabilities etc) from a potential borrower , and based on that information, provision an interest rate , which corresponds to our action here. In general, the interest rate will be higher for borrowers who have a larger default probability, and lower for borrowers who have little or no chance to default. Of course, the default probability is not observed, and depends on both the borrower’s financial situation and potentially on , which determines how much payment to make in each installment. For the latter, note that a higher interest rate would translate into a larger installment payment, which may deplete the borrower’s cash flow and hence make default more likely. What is often observed is the sequence of installment payments for many borrowers under a given environment over a certain horizon (say 30 years for a home loan). If the borrower defaults at any point, then all subsequent payments are zero. With such information, the reward for the bank corresponding to an individual borrower is the present value of the stream of payments made by discounting the cash flows back to the time when the loan was made (using the appropriate market discount rate). A policy here would be one that selects the best interest rate to produce the largest expected present value of future installment payment streams. When opening up a new branch in a different area (i.e. environment), the bank may want to learn a distributionally robust interest rate provisioning policy so as to take into account the environment shift. A notable feature of home loans is that they often span a long period of time. As such, even in the same market, the bank may wish to have some built-in robustness level in case there are shifts over time.
1.1 Main Challenges
The aforementioned applications 222Other applications include deploying a personalized education curriculum and/or digital tutoring plan based on students’ characteristics in a different school/district than from where the data was collected. highlight the need to learn a personalization policy that is robust to unknown shifts in another environmentt, an environment of which the decision maker has little knowledge or data. Broadly speaking, there can be two sources of such shifts:
-
1.
Covariate shift: The population composition – and hence the marginal distribution of the covariates – can change. For instance, in the product recommendation example, demographics in different markets will be different (e.g. markets in developed countries will have more people that are educated than those in developing countries), and certain segments of the population that are a majority in the old market might be a minority in the new market.
-
2.
Concept drift: How the outcomes depend on the covariates and prescription can also change, thereby resulting in different conditional distributions of the outcomes given the two. For instance, in product recommendation, large market segments in the US (e.g. a young population with high education level) choose to use cloud services to store personal data. In contrast, the same market segment in some emerging markets (where data privacy may be regulated differently) may prefer to buy flash drives to store at least some of the personal data.
These two shifts, often unavoidable and unknown, bring forth significant challenges in provisioning a suitable policy in the new environment, at least during the initial deployment phase. For instance, a certain subgroup (e.g. educated females in their 50s or older that live in rural areas) may be under-represented in the old environment’s population. In this case, the existing product recommendation data are insufficient to identify the optimal recommendation for this subgroup. This insufficiency is not a problem in the old environment, because the sub-optimal prescription for this subgroup will not significantly affect the overall performance of the policy given that the subgroup occurrence is not sufficiently frequent. However, with the new population, this subgroup may have a larger presence, in which case the incorrect prescription will be amplified and could translate into poor performance. In such cases, the old policy’s performance will be particularly sensitive to the marginal distribution of the subgroup in the new environment, highlighting the danger of directly deploying the same policy that worked well before.
Even if all subgroups are well-represented, the covariate shift will cause a problem if the decision maker is constrained to select a policy in a certain policy class such as trees or linear policy class, due to, for instance, interpretability and/or fairness considerations. In such cases, since one can only hope to learn the best policy in the policy class (rather than the absolute best policy), the optimal in-class policy will change when the underlying covariate marginal distribution shifts in the new environment, rendering the old policy potentially ineffective. Note that this could be the case even if the covariate marginal distribution is the only thing that changes.
Additionally, even more challenging is the existence of concept drift. Fundamentally, this type of shifts occurs because there are hidden characteristics at a population level (cultural, political, environmental factors or other factors that are beyond the decision maker’s knowledge) that also influence the outcome, but are unknown, unobservable. and different across the environments. As such, the decision maker faces a challenging hurdle: because these population-level factors that may influence the outcome are unknown and unobservable, making it is infeasible to explicitly model them in the first place, let alone deciding what policy to deploy as a result of them. therefore, the decision maker faces an “unknown unknown” dilemma when choosing the right policy for the new environment.
Situated in this challenging landscape, one naturally wonders if there is any hope to rigorously address the problem of policy learning in shifted environments with a significant degree of model uncertainty. This challenge leads to the following fundamental question: Using the (contextual bandits) data collected from one environment, can we learn a robust policy that would provide reliable worst-case guarantees in the presence of both types of environment shifts? If so, how can this be done in a data-efficient way? Our goal is to answer this question in the affirmative, as we shall explain.
1.2 Our Message and Managerial Insights
To answer this question we adopt a mathematical framework which allows us to formalize and quantify environmental model shifts. First, we propose a distributionally robust formulation of policy learning in batch contextual bandits that accommodates both environment shifts. To overcome the aforementioned “unknown unknown” challenge that presents modelling difficulty, our formulation takes a general, fully non-parametric (and hence model-agnostic) approach to describe the shift at the distribution level: we allow the new environment to be an arbitrary distribution in a KL-neighborhood around the old environment’s distribution. As such, the shift is succinctly represented by a single quantity: the KL-radius . We then propose to learn a policy that has maximum value under the worst-case distribution, that is optimal for a decision maker who wishes to maximize value against an adversary who selects a worst-case distribution to minimize value. Such a distributionally robust policy – if learnable at all – would provide decision makers with the guarantee that the value of deploying this policy will never be worse – and possibly better – no matter where the new environment shifts within this KL-neighborhood.
Regarding the choice of , we provide two complementary perspectives on its selection process from a managerial viewpoint; each useful in the particular context one is concerned with. First, when data across different environments are available, one can estimate using such data. Such an approach would work well (and is convenient) if the new environment is different in similar ways in nature compared to how those other environments differ. For instance, in the voting application we consider in this paper (the August 2006 primary election in Michigan [35]), voting turnout data from different cities have been collected. As such, when deploying a new policy to encourage voters to vote in a different city, one can use the that is estimated from data across those different cities (we describe the technical procedures for such estimation in Section 6). Second, we can view as a parameter that can vary and that trades off with the optimal distributionally robust value: the larger the , the more conservative the decision maker, the smaller the optimal distributionally robust value. We can compute the optimal distributionally robust values (and the corresponding policies) – one for each – for a range of s; see Figure 1 for an illustration. Inspecting Figure 1, we see that the difference between the optimal distributionally robust value under (i.e., no distributional shifts) and the optimal distributionally robust value for a given representing the price of robustness. If the new environment had actually remained unchanged, then deploying a robust policy “eats” into the value. As such, the decision maker can think of this value reduction as a form of insurance premium budget in order to protect the downside, in case the new environment did shift in unexpected ways. Consequently, under a given premium budget (i.e. the amount of per-unit profit/sales that the decision maker is willing to forgo), a conservative choice would be for the decision maker to select the largest where the difference is within this amount ( in Figure 1), and have the maximum robustness coverage therein. Importantly, if the new environment ends up not shifting in the worst possible way or not as much, then the actual value will only be higher. In particular, if the new environment does not shift at all, then the insurance premium the decision maker ends up paying after using the distributionally robust policy (under ) is smaller than the budget, because its value under the old environment is larger than its value under the corresponding worst-case shift. Consequently, selecting this way yields the optimal worst-case policy under a given budget333Of course, if the new environment ends up shifting a larger amount than and also in the worst possible way, then the actual value could be even smaller. However, in such situations, one would be much worse off with just using the old environment’s optimal policy, which is not robust at all..

Second, we show that learning distributionally robust policies can indeed be done in a statistically efficient way. In particular, we provide an algorithmic framework that solves this problem optimally. To achieve this, we first provide a novel scheme for distributionally robust policy evaluation (Algorithm 1) that estimates the robust value of any given policy using historical data. We do so by drawing from duality theory and transforming the primal robust value estimation problem–an infinitely-dimensional problem–into a dual problem that is -dimensional and convex, hence admitting an efficiently computable solution, which we can solve using Newton’s method. We then establish, in the form of a central limit theorem, that the proposed estimator converges to the true value at an rate where is the number of data points. Building upon the estimator, we devise a distributionally robust policy learning algorithm (Algorithm 2) and establish that (Theorem 2) it achieves a finite-sample regret. Such a finite-sample regret bound informs the decision maker that in order to learn an -optimal distributionally robust policy, a dataset on the order of samples suffice with high probability. Note that this result is true for any , where the regret bound itself does not depend on . In addition, we also characterize the fundamental limit of this problem by establishing a lower bound for expected regret, thus making it clear that our policy learning algorithm is statistically optimal in the minimax sense. Taken together, these results highlight that we provide an optimal prescription framework for learning distributionally robust policies.
Third, we demonstrate the empirical efficacy and efficiency of our proposed algorithm by providing extensive experimental results in Section 5. We dedicate Section 6 to the voting problem mentioned previously using our distributionally robust policy learning framework and demonstrate its applicability on a real-world dataset. Finally, we extend our results to -divergence measures and show our framework is still applicable even beyond KL-divergence (Section 7).
1.3 Related Work
As mentioned, our work is closely related to the flourishing and rapidly developing literature on offline policy learning in contextual bandits; see, e.g, [28, 85, 89, 88, 76, 61, 45, 47, 46, 91, 43, 17]. Many valuable insights have been contributed: novel policy evaluation and policy learning algorithms have been developed; sharp minimax regret guarantees have been characterized in many different settings; and extensive and illuminating experimental results have been performed to offer practical advice for optimizing empirical performance. However, this line of work assumes the environment in which the learned policy will be deployed is the same as the the environment from which the training data is collected. In such settings, robustness is not a concern. Importantly, this line of work developed and used the family of doubly robust estimators for policy evaluation and learning [28, 91]. For clarification, we point out that this family of estimators, although related to robustness, does not address the robustness discussed in this paper (i.e. robustness to environment shifts). In particular, those estimators aim to stabilize statistical noise and deal with mis-specified models for rewards and propensity scores, where the underlying environment distribution is the same across test and training environments.
Correspondingly, there has also been an extensive literature on online contextual bandits, for example, [53, 65, 31, 62, 18, 37, 3, 4, 66, 67, 44, 54, 2, 23, 54], whose focus is to develop online adaptive algorithms that effectively balance exploration and exploitation. This online setting is not the focus of our paper. See [14, 50, 74] for a few articulate expositions. Despite this, we do point out that as alluded to before and whenever possible, online learning can complement the distributionally robust policy learned and deployed initially. We leave this investigation for future work.
Additionally, there is also rapidly growing literature in distributionally robust optimization (DRO); see, e.g, [11, 22, 40, 69, 7, 33, 57, 26, 75, 70, 49, 81, 51, 59, 83, 56, 87, 1, 86, 73, 34, 16, 36, 12, 24, 48, 27, 39]. The existing DRO literature has mostly focused on the statistical learning aspects, including supervised learning and feature selection type problems, rather than on the decision making aspects. Furthermore, much of that literature uses DRO as tool to prevent over-fitting when it comes to making predictions, rather than dealing with distributional shifts. To the best of our knowledge, we provide the first distributionally robust formulation for policy evaluation and learning under bandit feedback and shifted environments, in a general, non-parametric space.
Some of the initial results appeared in the conference version [72], which only touched a very limited aspect of the problem: policy evaluation under shifted environments. In contrast, this paper is substantially developed and fully addresses the entire policy learning problem. We summarize the main differences below:
-
1.
The conference version focused on the policy evaluation problem and only studied a non-stable version of the policy evaluation scheme, which is outperformed by the stable policy evaluation scheme analyzed here (we simply dropped the non-stable version of the policy evaluation scheme in this journal version).
-
2.
The conference version did not study the policy learning problem, which is our ultimate objective. Here, we provide a policy learning algorithm and establish the minimax optimal rate for the finite-sample regret by providing the regret upper bound as well as the matching regret lower bound.
-
3.
We demonstrate the applicability of our policy learning algorithms and provide results on a real-world voting data set, which is missing in the conference version.
-
4.
We provide practical managerial insights for the choice of the critical parameter which governs the size of distributional shifts.
-
5.
We finally extend our results to -divergence measures, a broader class of divergence measures that include KL as a special case.
2 A Distributionally Robust Formulation of Batch Contextual Bandits
2.1 Batch Contextual Bandits
Let be the set of actions: and let be the set of contexts endowed with a -algebra (typically a subset of with the Borel -algebra). Following the standard contextual bandits model, we posit the existence of a fixed underlying data-generating distribution on , where denotes the context vector, and each denotes the random reward obtained when action is selected under context .
Let be iid observed triples that comprise of the training data, where are drawn iid from the fixed underlying distribution described above, and we denote this underlying distribution by . Further, in the -th datapoint , denotes the action selected and . In other words, in the -th datapoint is the observed reward under the context and action . Note that all the other rewards (i.e. for ), even though they exist in the model (and have been drawn according to the underlying joint distribution), are not observed.
We assume the actions in the training data are selected by some fixed underlying policy that is known to the decision-maker, where gives the probability of selecting action when the context is . In other words, for each context , a random action is selected according to the distribution , after which the reward is observed. Finally, we use to denote the product distribution on space . We make the following assumptions on the data-generating process.
Assumption 1.
The joint distribution satisfies:
-
1.
Unconfoundedness: is independent with conditional on , i.e.,
-
2.
Overlap: There exists some , , .
-
3.
Bounded reward support: for .
Assumption 2 (Positive densities/probabilities).
The joint distribution satisfies one of the following assumptions below:
-
1.
In the continuous case, for any has a conditional density , which has a uniform non-zero lower bound, i.e., over the interval for any .
-
2.
In the discrete case, for any is supported on a finite set with cardinality more than 1, and satisfies almost surely for any .
The overlap assumption ensures that some minimum positive probability is guaranteed regardless of the context is. This assumption ensures sufficient exploration in collecting the training data, and indeed, many operational policies have -greedy components. Assumption 1 is standard and commonly adopted in both the estimation literature ([63, 41, 42]) and the policy learning literature ([85, 89, 47, 76, 90]). Assumption 2 is made to ensure the convergence rate.
Remark 1.
In standard contextual bandits terminology, is known as the mean reward function for action . Depending on whether one assumes a parametric form of or not, one needs to employ different statistical methodologies. In particular, when is a linear function of , this setting is known as linear contextual bandits, an important and most extensively studied subclass of contextual bandits. In this paper, we do not make any structural assumption on : we are in the non-parametric contextual bandits regime and work with general underlying data-generating distributions .
2.2 Standard Policy Learning
With the aforementioned setup, the standard goal is to learn a good policy from a fixed deterministic policy class using the training data, often known as the batch contextual bandits problem (in contrast to online contextual bandits), because all the data has already been collected before the decision maker aims to learn a policy. A policy is a function that maps a context vector to an action and the performance of is measured by the expected reward this policy generates, as characterized by the policy value function:
Definition 1.
The policy value function is defined as: , where the expectation is taken with respect to the randomness in the underlying joint distribution of .
With this definition, the optimal policy is a policy that maximizes the policy value function. The objective in the standard policy learning context is to learn a policy that has the policy value as large as possible, which is equivalent to minimizing the discrepancy between the performance of the optimal policy and the performance of the learned policy .
2.3 Distributionally Robust Policy Learning
Using the policy value function as defined in Definition 1 to measure the quality of a policy brings out an implicit assumption that the decision maker is making: the environment that generated the training data is the same as the environment where the policy will be deployed. This is manifested in that the expectation in is taken with respect to the same underlying distribution . However, the underlying data-generating distribution may be different for the training environment and the test environment. In such cases, the policy learned with the goal to maximize the value under may not work well under the new test environment.
To address this issue, we propose a distributionally robust formulation for policy learning, where we explicitly incorporate into the learning phase the consideration that the test distribution may not be the same as the training distribution . To that end, we start by introducing some terminology. First, the KL-divergence between two probability measures and , denoted by , is defined as With KL-divergence, we can define a class of neighborhood distributions around a given distribution. Specifically, the distributional uncertainty set of size is defined as , where means is absolutely continuous with respect to . When it is clear from the context what the uncertainty radius is, we sometimes drop for notational simplicity and write instead. We remark that in practice, can be selected empirically. For example, we can collect historical distributional data from different regions and compute distances between them. Then, although the distributional shift direction is unclear, a reasonable distributional shift size can be estimated. Furthermore, we can also check the sensitivity of robust policy with respect to and choose an appropriate one according to a given insurance premium budget. We detail these two approaches in Section 6.4.
Definition 2.
For a given , the distributionally robust value function is defined as: .
In other words, measures the performance of a policy by evaluating how it performs in the worst possible environment among the set of all environments that are -close to . With this definition, the optimal policy is a policy that maximizes the distributionally robust value function: . If such optimal policy does not exist, we can always construct a sequence of policies whose distributionally robust value converges to the supremum . Then, all of our results can generalize to this case. Therefore, for simplicity, we assume the optimal policy exists. To be robust to the changes between the test environment and the training environment, our goal is to learn a policy such that its distributionally robust policy value is as large as possible, or equivalently, as close to the best distributionally robust policy as possible. We formalize this notion in Definition 3.
Definition 3.
The distributionally robust regret of a policy is defined as
.
Several things to note. First, per its definition, we can rewrite regret as . Second, the underlying random policy that has generated the observational data (specifically the s) could be totally irrelevant with the policy class . Third, when a policy is learned from data and hence is a random variable, then a regret bound in such cases is customarily a high probability bound that highlights how regret scales as a function of the size of the dataset, the error probability and other important parameters of the problem, e.g. the complexity of the policy class .
Regarding some other definitions of regret, one may consider choices such as
where for a fixed distribution , one compares the learned policy with the best one that could be done under perfect knowledge of . In this definition the adversary is very strong in the sense that it knows the test domain. Therefore, a problem of this definition is that the regret does not converge to zero when goes to infinity (even for a randomized policy ). We will not discuss this notion in this paper.
3 Distributionally Robust Policy Evaluation
3.1 Algorithm
In order to learn a distributionally robust policy – one that maximizes – a key step lies in accurately estimating the given policy ’s distributionally robust value. We devote this section to tackling this problem.
Lemma 1 (Strong Duality).
For any policy , we have
| (1) | ||||
| (2) |
where denotes the indicator function.
The proof of Lemma 1 is in Appendix A.2.
Remark 2.
When , by the discussion of Case 1 after Assumption 1 in Hu and Hong [40], we define
where denotes the essential infimum. Therefore, is right continuous at zero. In fact, Lemma A12 in Appendix A.3 shows that the optimal value is not attained at if Assumption 2.1 is enforced.
The above strong duality allows us to transform the original problem of evaluating , where the (primal) variable is a infinite-dimensional distribution into a simpler problem where the (dual) variable is a positive scalar . Note that in the dual problem, the expectation is taken with respect to the same underlying distribution . This then allows us to use an easily-computable plug-in estimate of the distributionally robust policy value. To easily reference the subsequent analysis of our algorithm, we capture the important terms in the following definition.
Definition 4.
Let be a given dataset. We define
and
We also define the dual objective function and the empirical dual objective function as
and
respectively.
Then, we define the distributionally robust value estimators and the optimal dual variable using the following notations.
-
1.
The distributionally robust value estimator is defined by .
-
2.
The optimal dual variable is defined by , and the empirical dual value is denoted as .
is a realization of the random variable inside the expectation in equation (2), and we approximate by its empirical average with a normalization factor . Note that and almost surely. Therefore, the normalized is asymptotically equivalent with the unnormalized . The reason for dividing a normalization factor is that it makes our evaluation more stable; see discussions in [72] and [77]. The upper bound of proven in Lemma A11 of Appendix A.3 establishes the validity of the definitions , namely, is attainable and unique.
Remark 3.
By Hu and Hong [40, Proposition 1 and their discussion following the proposition], we provide a characterization of the worst case distribution in Proposition 1.
Proposition 1 (The Worst Case Distribution).
Suppose that Assumption 1 is imposed. For any policy , when , we define a probability measure supported on such that
where is the Radon-Nikodym derivative; when , we define
Then, we have that is the unique worst case distribution, namely
Proposition 1 shows that the worst case measure is an exponentially tilted measure with respect to the underlying measure , where puts more weights on the low end. Since can be approximated by , and is explicitly computable as we shall see in Algorithm 1, we are able to understand how the worst case measure behaves. Moreover, we show that the worst case measure maintains mutual independence when are mutually independent conditional on under in the following Corollary.
Corollary 1.
The proofs of Proposition 1 and Corollary 1 are in Appendix A.2.
To compute , one needs to solve an optimization problem to obtain the distributionally robust estimate of the policy . As the following lemma indicates, this optimization problem is easy to solve.
Lemma 2.
The empirical dual objective function is concave in and its partial derivative admits the expression
Further, if the array has at least two different non-zero entries, then is strictly-concave in .
The proof of Lemma 2 is in Appendix A.2. Since the optimization problem is maximizing a concave function, it can be computed using the Newton-Raphson method. Based on all of the discussions above, we formally give the distributionally robust policy evaluation algorithm in Algorithm 1. By Luenberger and Ye [55, Section 8.8], we have that converges to the global maximum quadratically in Algorithm 1 if the initial value of is sufficiently closed to the optimal value.
3.2 Theoretical Guarantee of Distributionally Robust Policy Evaluation
In the next theorem, we demonstrate that the approximation error for policy evaluation function is for a fixed policy .
Theorem 1.
Theorem 1 ensures that we are able to evaluate the performance of a policy in a new environment using only the training data even if the new environment is different from the training environment. The proof of Theorem 1 is in Appendix A.3.
4 Distributionally Robust Policy Learning
In this section, we study the policy learning aspect of the problem and discuss both the algorithm and its corresponding finite-sample theoretical guarantee. The aim is to find a robust policy that has reasonable performance in a new environment with unknown distributional shifts. First, with the distributionally robust policy evaluation scheme discussed in the previous section, we can in principle compute the distributionally robust optimal policy by picking a policy in the given policy class that maximizes the value of , i.e.
| (4) |
How do we compute ? In general, this problem is computationally intractable since it is highly non-convex in its optimization variables ( and jointly). However, following the standard tradition in the machine learning and optimization literature , we can employ certain approximate schemes that, although do not guarantee global convergence, are computationally efficient and practically effective (for example, greedy tree search [32, Section 9.2] for decision-tree policy classes and gradient descent [64] for linear policy classes).
A simple and quite effective scheme is alternate minimization, given in Algorithm 2, where we learn by fixing and minimizing on and then fixing and maximizing on in each iteration. Since the value of is non-decreasing along the iterations of Algorithm 2, the converged solution obtained from Algorithm 2 is a local maximum of . In practice, to accelerate the algorithm, we only iterate once for (line 8) using the Newton-Raphson step . Subsequent simulations (see next section) show that this is often sufficient.
4.1 Statistical Performance Guarantee
We now establish the finite-sample statistical performance guarantee for the distributionally robust optimal policy . Before giving the theorem, we first need to define entropy integral in the policy class, which represents the class complexity.
Definition 5.
Given the feature domain , a policy class a set of points , define:
-
1.
Hamming distance between any two policies and in
-
2.
-Hamming covering number of the set is the smallest number of policies in , such that
-
3.
-Hamming covering number of
-
4.
Entropy integral:
The defined entropy integral is the same as Definition 4 in [91], which is a variant of the classical entropy integral introduced in [29], and the Hamming distance is a well-known metric for measuring the similarity between two equal-length arrays whose elements are supported on on discrete sets [38]. We then discuss the entropy integrals for different policy classes .
Example 1 (Finite policy classes).
For a policy class containing a finite number of policies, we have where denotes the cardinality of the set .
The entropy integrals for the linear policy classes and decision-tree policy classes are discussed in Section 5.2 and Section 6.2, respectively. For the special case of binary action, we have the following bound for the entropy integral by [60] (see the discussion following Definition 4).
Lemma 3.
If , we have , where denotes the VC dimension defined in [80].
This result can be further generalized to the multi-action policy learning setting, where is greater than 2; see the proof of Theorem 2 in [60].
Lemma 4.
We have , where denotes the graph dimension (see the definition in [8]).
Graph dimension is a direct generalization of VC dimension. There are many papers that discuss the graph dimension and also a closely related concept, Natarajan dimension; see, for example, [20, 21, 60, 58].
Theorem 2 demonstrates that with high probability, the distributionally robust regret of the learned policy decays at a rate upper bounded by .
Theorem 2.
The key challenge to the proof of Theorem 2 is that is hard to quantify, since it is a non-linear functional of the probability measure . Thanksfully, Lemmas 5 and 6 allow us to transform the hardness of analysis of into the well-studied terms such as the quantile and the total variation distance.
Lemma 5.
For any probability measures supported on , we have
where denotes the -quantile of a probability measure , defined as
where is the CDF of
Lemma 6.
The detailed proof is in Appendix A.4. We see those bounds in (5) and (6) for the distributionally robust regret does not depend on the uncertainty size . Furthermore, if including the finite policy classes, linear classes, decision-tree policy classes and the case where or is finite, we have a parametric convergence rate . Further, if , we have in probability. Generally, we may expect the complexities of parametric classes are . Theorem 2 guarantees the robustness of the policy learned from the training environment given sufficient training data and low complexity of the policy class. This result means that the test environment performance is guaranteed as long as test and training environments do not differ too much. We will show this rate is optimal up to a constant in Theorem 3.
4.2 Statistical Lower Bound
In this subsection, we provide a tight lower bound of the distributionally robust batch contextual bandit problem. First we define as the collection of all joint distributions of satisfying Assumption 1. To emphasize the dependence on the underlying distribution , we rewrite . We further denote to be the distribution of the observed triples .
Theorem 3.
Let and . Then, for any policy as a function of it holds that
where denotes the -times product measure of .
The proof of Theorem 3 is in Appendix A.5. Theorem 3 shows that the dependence of the regret on the complexity ; the number of samples, ; and the bound of the reward, , is optimal up to a constant. It means that it is impossible to find a good robust policy with a small amount of training data or a relatively large policy class.
5 Simulation Studies
In this section, we provide discussions on simulation studies to justify the robustness of the proposed DRO policy in the linear policy class. Specifically, Section 5.1 discusses a notion of the Bayes DRO policy, which is viewed as a benchmark; Section 5.2 presents an approximation algorithm to efficiently learn a linear policy; Section 5.3 gives a visualization of the learned DRO policy, with a comparison to the benchmark Bayes DRO policy, and demonstrates the performance of our proposed estimator.
5.1 Bayes DRO Policy
In this section, we give a characterization of the Bayes DRO policy , which maximizes the distributionally robust value function within the class of all measurable policies, i.e.,
where denotes the class of all measurable mappings from to the action set . Despite the Bayes DRO policy is not being learnable given finitely many training samples, it could be a benchmark in a simulation study. Proposition 2 shows how to compute if we know the population distribution.
Proposition 2.
Suppose that for any and any , the mapping is measurable. Then, the Bayes DRO policy is
where is an optimizer of the following optimization problem:
| (7) |
See Appendix A.6 for the proof.
Remark 4.
only depends on the marginal distribution of and the conditional distributions of . Therefore, the conditional correlation structure of does not affect .
5.2 Linear Policy Class and Logistic Policy Approximation
In this section, we introduce the linear policy class . We consider to be a subset of , and the action set . To capture the intercept, it is convenient to include the constant variable 1 in , thus in the rest of Section 5.2, is a dimensional vector and is a subset of . Each policy is parameterized by a set of vectors , and the mapping is defined as
The optimal parameter for linear policy class is characterized by the optimal solution of
Due to the fact that , the associated sample average approximation problem for optimal parameter estimation is
However, the objective in this optimization problem is non-differentiable and non-convex, thus we approximate the indicator function using a softmax mapping by
which leads to an optimization problem with smooth objective:
We employ the gradient descent method to solve for the optimal parameter
and define the policy as our linear policy estimator. In Section 5.3, we justify the efficacy of by empirically showing is capable of discovering the (non-robust) optimal decision boundary.
As an oracle in Algorithm 2, a similar smoothing technique is adopted to solve for linear policy class . We omit the details here due to space limitations.
We will present an upper bound of the entropy integral in Lemma 7. By plugging the result of Lemma 7 into Theorem 2, one can quickly remark that the regret achieves the optimal asymptotic convergence rate given by Theorem 2.
Lemma 7.
There exists a universal constant such that
5.3 Experiment Results
In this section, we present two simple examples with an explicitly computable optimal linear DRO policy. We illustrate the behavior of distributionally robust policy learning in Section 5.3.1 and we demonstrate the effectiveness of the distributionally robust policy in Section 5.3.2.
5.3.1 A Linear Boundary Example
We consider to be a -dimensional closed unit ball, and the action set . We assume that ’s are mutually independent conditional on with conditional distribution
for vectors and . In this case, by directly computing the moment generating functions and applying Proposition 2, we have
We consider the linear policy class . Apparently, the DRO Bayes policy is in the class , thus it is also the optimal linear DRO policy, i.e., . Consequently, we can check the efficacy of the distributionally robust policy learning algorithm by comparing against .
Now we describe the parameter in the experiment. We choose and . To facilitate visualization of the decision boundary, we set all the entries of to be except for the first two dimensions. Specifically, we choose
and We define the Bayes policy as the policy that maximizes within the class of all measurable policies. Under this setting, . The feature space is partitioned into three regions based on : for , we say belongs to Region if . Given , the action is drawn according to the underlying data collection policy , which is described in Table 1.
| Region 1 | Region 2 | Region 3 | |
|---|---|---|---|
| Action 1 | 0.50 | 0.25 | 0.25 |
| Action 2 | 0.25 | 0.50 | 0.25 |
| Action 3 | 0.25 | 0.25 | 0.50 |
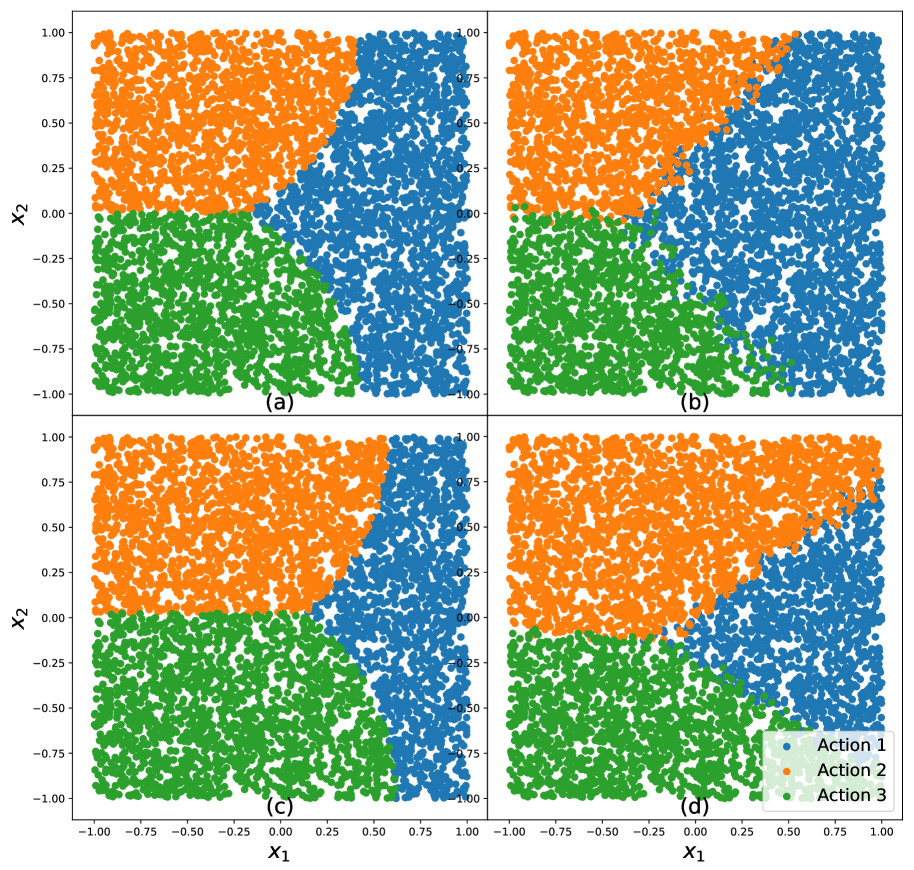
We generate according to the procedure described above as training dataset, from which we learn the non-robust linear policy and the distributionally robust linear policy . Figure 2 presents the decision boundary of four different policies: (a) ; (b) ; (c) ; (d) , where and . One can quickly remark that the decision boundary of resembles ; and the decision boundary of resembles , which demonstrates that is the (nearly) optimal non-DRO policy and is the (nearly) optimal DRO policy.
This distinction between and is also apparent in Figure 2: is less likely to choose Action 3, but more likely to choose Action 1. In other words, a distributionally robust policy prefers action with smaller variance. We remark that this finding is consistent with [25] and [26] as they find the DRO problem with KL-divergence is a good approximation to the variance-regularized quantity when .

5.3.2 A Non-linear Boundary Example
In this section, we compare the performance of different estimators in a simulation environment where the Bayes decision boundaries are nonlinear.
We consider to be a -dimensional cube, and the action set to be . We assume that ’s are mutually independent conditional on with conditional distribution
where is a measurable function and for . In this setting, we are still able to analytically compute the Bayes policy and the DRO Bayes .
In this section, the conditional mean and conditional variance are chosen as
Given , the action is drawn according to the underlying data collection policy described in Table 2.
| Region 1 | Region 2 | Region 3 | |
|---|---|---|---|
| Action 1 | 0.50 | 0.25 | 0.25 |
| Action 2 | 0.30 | 0.40 | 0.30 |
| Action 3 | 0.30 | 0.30 | 0.40 |
Now we generate the training set and learn the non-robust linear policy and distributionally robust linear policy in linear policy class , for and . Figure 3 presents the decision boundary of four different policies: (a) ; (b) ; (c) ; (d) . As and have nonlinear decision boundaries, any linear policy is incapable of accurate recovery of Bayes policy. However, we quickly notice that the boundary produced by and are reasonable linear approximation of and , respectively. Especially noteworthy is the robust policy prefers action with small variance (Action 2), which is consistent with our finding in Section 5.2.
Now we introduce two evaluation metrics in order to quantitatively characterize the adversarial performance for different policies.
- 1.
-
2.
We first generate independent test sets, where each test set consists of i.i.d. data points sampled from . We denote them by . Then, we randomly sample a new dataset around each dataset, i.e., is sampled on the KL-sphere centered at with a radius . Then, we evaluate each policy using , defined by
The results are reported in the second row in Tables 3 and 4.
We compare the robust performance of and and the POEM policy introduced in [76]. The regularization parameter of the POEM estimator is chosen from , and we find the results are insensitive to the regularization parameter. We fix the uncertainty radius used in the training procedure and size of test set . In Table 3, we let the training set size range from to , and we fix , while in Table 4, we fix the training set size to be , and we let the magnitude of “environment change” range from to . We denote to be the DRO policy with . Tables 3 and 4 report the mean and the standard error of the mean of and computed using i.i.d. experiments, where an independent training set and an independent test set are generated in each experiment. Figure 4 visualizes the relative differences between and in distributional shift environments.


We can easily observe from Table 3 that achieves the best robust performance among all three policies and the superiority is significant in the most of cases, which implies is more resilient to adversarial perturbations. We also highlight that has smaller standard deviation (standard error) in Table 3 and the superiority of is more manifest under smaller training set, indicating is a more stable estimator compared with and . In Table 4 and Figure 4, we find that significantly outperforms and for a wide range of even if the model is misspecified in the sense that , and the results of small indicate that our method may potentially alleviate overfitting. These results show that our method is insensitive to the choice of the uncertainty radius in the training procedure.
6 Real Data Experiments: Application on a Voting Dataset
In this section, we compare the empirical performance of different estimators on a voting dataset concerned with the August 2006 primary election.444Data available in https://github.com/gsbDBI/ExperimentData/tree/master/Social This dataset was originally collected by [35] to study the effect of social pressure on electoral participation rates. Later, the dataset was employed by [91] to study the empirical performance of several offline policy learning algorithms. In this section, we apply different policy learning algorithms to this dataset and illustrate some interesting findings.
6.1 Dataset Description
For completeness, we borrow the description of the dataset from [91] since we use almost the same (despite different reward) data preprocessing procedure. We only focus on aspects that are relevant to our current policy learning context.
The dataset contains data points (i.e. ), each corresponding to a single voter in a different household. The voters span the entire state of Michigan. There are ten voter characteristics in the dataset: year of birth, sex, household size, city, g2000, g2002, g2004, g2000, p2002, and p2004. The first four features are self-explanatory. The next three features are outcomes for whether a voter voted in the general elections in 2000, 2002 and 2004 respectively: was recorded if the voter did vote and was recorded if the voter did not vote. The last three features are outcomes for whether a voter voted in the primary in 2000, 2002 and 2004. As [35] pointed out, these 10 features are commonly used as covariates for predicting whether an individual voter will vote.
There are five actions in total, as listed below:
Nothing: No action is performed.
Civic: A letter with ”Do your civic duty” is mailed to the household before the primary election.
Monitored: A letter with ”You are being studied” is mailed to the household before the primary election. Voters receiving this letter are informed that whether they vote or not in this election will be observed.
Self History: A letter with the voter’s past voting records as well as the voting records of other voters who live in the same household is mailed to the household before the primary election. The letter also indicates that, once the election is over, a follow-up letter on whether the voter voted will be sent to the household.
Neighbors: A letter with the voting records of this voter, the voters living in the same household, and the voters who are neighbors of this household is mailed to the household before the primary election. The letter also indicates that all your neighbors will be able to see your past voting records and that follow-up letters will be sent so that whether this voter voted in the upcoming election will become public knowledge among the neighbors.
In collecting this dataset, these five actions are randomly chosen independent of everything else, with probabilities equal to (in the same order as listed above). The outcome is whether a voter has voted in the 2006 primary election, which is either 1 or 0. It is not hard to imagine that Neighbors is the best policy for the whole population as it adds the highest social pressure for people to vote. Therefore, instead of directly using the voting outcome as a reward, we define , the reward associated to voter , as the voting outcome minus the social cost of deploying an action to this voter, namely,
where is the vector of cost for deploying certain actions. Here, we set to be close to the empirical average of each action.
6.2 Decision Trees and Greedy Tree Search
We introduce the decision-tree policy classes. We follow the convention in [9]. A depth- tree has layers in total: branch nodes live in the first layers, while the leaf nodes live in the last layer. Each branch node is specified by the variable to be split on and the threshold . At a branch node, each component of the -dimensional feature vector can be chosen as a split variable. The set of all depth- trees is denoted by . Then, Lemma 4 in [91] shows that
In the voting dataset experiment, we concentrate on the policy class .
The algorithm for decision tree learning needs to be computationally efficient, since algorithm will be iteratively executed in Line 7 of Algorithm 2 to compute . Since finding an optimal classification tree is generally intractable, see [9], here we adopt an heuristic algorithm called greedy tree search. This procedure can be inductively defined. First, to learn a depth-2 tree, greedy tree search will brute force search all the possible spliting choices of the branch node, and all the possible actions of the leaf nodes. Suppose that the learning procedure for depth- tree has been defined. To learn a depth- tree, we first learn a depth-2 tree with the optimal branching node, which partitions all the training data into two disjointed groups associated with two leaf nodes. Then each leaf node is replaced by the depth- tree trained using the data in the associated group.
6.3 Training and Evaluation Procedure
Consider a hypothetical experiment of designing distributionally robust policy. In the experiment, suppose that the training data is collected from some cities, and our goal is to learn a robust policy to be deployed to the other cities. Dividing the training and test population based on the city voters live creates both a covariate shift and a concept drift between training set and test set. For example, considering the covariate shift first, the distribution of year of birth is generally different across different cities. As for the concept drift, it is conceivable that different groups of population may have different response to the same action, depending on some latent factors that are not reported in the dataset, such as occupation and education. The distribution of such latent factors also varies among different cities, which results in concept drift. Consequently, we use the feature city to divide the training set and the test set, in order to test policy performance under “environmental change”.
The voting data set contains 101 distinct cities. To comprehensively evaluate the out-of-sample policy performance, we adapt leave-one-out cross-validation to generate 101 pairs of the training and test set, each test set contains exactly one district city and the corresponding training set is the complement set of the test set. On each pair of the training and test set, we learn a non-robust depth- decision tree policy and distributionally robust decision tree policies in for , then on the test set the policies are evaluated using the unbiased IPW estimator
Consequently, for each policy we get of scores on different test sets.
6.4 Selection of Distributional Shift Size
The distributional shift size quantifies the level of robustness of the distributionally robust policy learning algorithm. The empirical performance of the algorithm substantially depends on the selection of . On one hand, if is too small, the robustification effect is negligible and the algorithm would learn an over-aggressive policy; on the other hand, if is overly large, the policy is over-conservative, always choosing the action subject to the smallest reward variation. We remark that the selection of is more a managerial decision rather than a scientific procedure. It depends to the decision-makers’ own risk-aversion level and their own perception of the new environments. In this section, we provide a guide to help select in this voting dataset.
A natural approach to select is to empirically estimate the size of distributional shift using the training data. From the training set, we partition the data in 20% of cities as our validation set with distribution denoted by , and we use to denote the distribution of the remaining 80% of the training set. We estimate the , which reasonably quantifies the size of distributional shift across different cities. To this end, we decompose distributional shift into two parts,
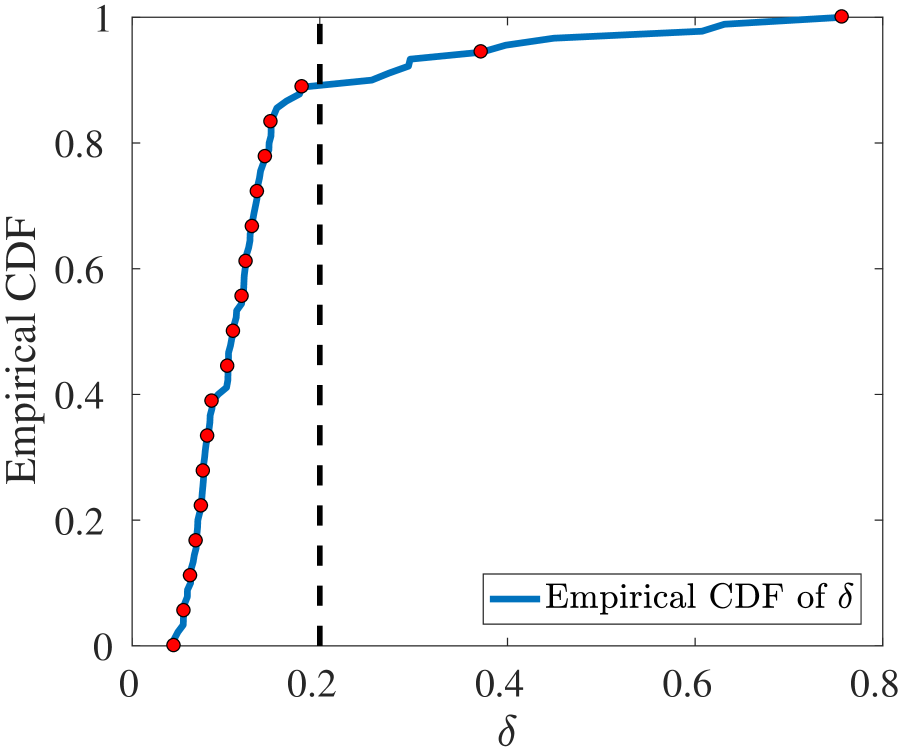
where denote the -marginal distribution of , and denote the conditional distribution of given for , for . To estimate the size of marginal distributional shift , we first apply grouping to features such as year of birth, in order to avoid of infinite KL-divergence. Next we focus on the conditional distributional shift . Noticing that the value of is binary for each , we fit two logistic regression models separately for and to estimate the conditional distribution of given . We estimate using the fitted logistic regression model, then take the expectation of over . We repeat the 80%/20% random splitting 100 times, and compute using this procedure. Additional experimental details are reported in Appendix B.2. The empirical CDF of the estimated from those experiments is reported in Figure 5(a). It is easy to see approximately 90% percent of s are less than .

Beside explicitly estimating the uncertainty size, we also check the sensitivity of our policy on . We present the reward profile for our distributionally robust policy in Figure 5(b). In the figure, we employ the x-axis to represent the used in the policy training process. The top black line is the non-robust pure value function, which appears to be almost invariant among policies with different robust level for . The blue line is the distributionally robust value function with fixed to . We remark that the non-robust policy has a deficient performance in terms of robust value function, yet the robust value function improves as the robust level of the policy is increasing and becomes non-sensitive to the delta when larger than . Finally, this red line is the distributionally robust value function with respect to the same in the training process. Thus, it is the actual training reward.
6.5 Experimental Result and Interpretation
We summarize some important statistics of scores in Table 5, including mean, standard deviation, minimal value, 5th percentile, 10th percentile, and 20th percentile. All the statistics are calculated based on the result of 101 test sets.
| mean | std | min | 5th percentile | 10th percentile | 20th percentile | ||
|---|---|---|---|---|---|---|---|
| 0.0386 | 0.0991 | -0.2844 | -0.1104 | -0.0686 | -0.0358 | ||
| 0.0458 | 0.0989 | -0.2321 | -0.1007 | -0.0489 | -0.0223 | ||
| 0.0368 | 0.0895 | -0.2314 | -0.0785 | -0.0518 | -0.0217 | ||
| 0.0397 | 0.0864 | -0.2313 | -0.0677 | -0.0407 | -0.0190 | ||
| 0.0383 | 0.0863 | -0.2312 | -0.0677 | -0.0429 | -0.0202 | ||
We remark that the mean value of is comparable to , and it is even better when an appropriate value of (such as ) is selected. One can also observe that has a smaller standard deviation and a larger minimal value when comparing to , and the difference becomes larger as increases. The comparison of 5th, 10th, and 20th percentiles also indicates that perform better than in “bad” (or “adversarial”) scenarios of environmental change, which is exactly the desired behavior of by design.
To reinforce our observation in Table 5, we visualize and compare the distribution of and in Figure 6, for (a) and (b) . We notice that the histogram of is more concentrated than the histogram of , which supports our observation that is more robust.


We present two instances of distributionally robust decision trees in Figure 7: (a) is an instance of robust tree with , and (b) is an instance of robust tree with . We remark that the decision tree in (b) deploys the action Nothing to most of the potential voters, because almost all the individuals in the dataset were born after 1917 and have a household size fewer than 6. For a large value of , the distributionally robust policy becomes almost degenerate, which only selects Nothing, the action with a minimal reward variation.


7 Extension to -divergence Uncertainty Set
In this section, we generalize the KL-divergence to -divergence. Here, we define -divergence between and as
where is a convex function satisfying and for any . Then, we define the -divergence uncertainty set as Accordingly, the distributionally robust value function is defined below.
Definition 6.
For a given , the distributionally robust value function is defined as: .
We focus on Cressie-Read family of -divergence, defined in [19]. For function is defined as
As which becomes KL-divergence. For the ease of notation, we use , , and as shorthands of , , and respectively, for We further define and Then, [24] give the following duality results.
Lemma 8.
For any Borel measure supported on the space and we have
Lemma 9.
For any probability measures supported on and , we have
Lemma 10.
The proofs of Lemma 9 and 10 and are in Appendix A.7. As an analog of Definitions 3, 4 and Equation (4), we further make the following definition.
Definition 7.
-
1.
The distributionally robust value estimator is defined by
-
2.
The distributionally robust regret of a policy is defined as
-
3.
The optimal policy which maximizes the value of is defined as
By applying Lemmas 9 and 10 and executing the same lines as the proof of Theorem 2, we have an analogous theorem below.
Theorem 4.
8 Conclusion
We have provided a distributionally robust formulation for policy evaluation and policy learning in batch contextual bandits. Our results focus on providing finite-sample learning guarantees. Especially interesting is that such learning is enabled by a dual optimization formulation.
A natural subsequent direction would be to extend the algorithm and results to the Wasserstein distance case for batch contextual bandits, which cannot be classified as a special case in our -divergence framework. We remark that the extension is non-trivial. Given a lower semicontinuous function , recall that the Wasserstein distance between two measures, and , is defined as where denotes the set of all joint distributions of the random vector with marginal distributions and , respectively. The key distinguishing feature of Wasserstein distance is that unlike -divergence, it does not restrict the perturbed distributions to have the same support as , thus including more realistic scenarios. This feature, although desirable, also makes distributionally robust policy learning more challenging. To illustrate the difficulty, we consider the separable cost function family with , where is a metric. We aim to find that maximizes . Leveraging strong duality results [12, 33, 56], we can write:
However, the difficulty now is that is not observed if . We leave this challenge for future work.
References
- Abadeh et al. [2018] Soroosh Shafieezadeh Abadeh, Viet Anh Nguyen, Daniel Kuhn, and Peyman Mohajerin Esfahani. Wasserstein distributionally robust kalman filtering. In Advances in Neural Information Processing Systems, pages 8483–8492, 2018.
- Abeille et al. [2017] Marc Abeille, Alessandro Lazaric, et al. Linear thompson sampling revisited. Electronic Journal of Statistics, 11(2):5165–5197, 2017.
- Agrawal and Goyal [2013a] Shipra Agrawal and Navin Goyal. Further optimal regret bounds for thompson sampling. In Artificial intelligence and statistics, pages 99–107, 2013a.
- Agrawal and Goyal [2013b] Shipra Agrawal and Navin Goyal. Thompson sampling for contextual bandits with linear payoffs. In International Conference on Machine Learning, pages 127–135, 2013b.
- Araujo and Giné [1980] Aloisio Araujo and Evarist Giné. The central limit theorem for real and Banach valued random variables. John Wiley & Sons, 1980.
- Bastani and Bayati [2020] Hamsa Bastani and Mohsen Bayati. Online decision making with high-dimensional covariates. Operations Research, 68(1):276–294, 2020.
- Bayraksan and Love [2015] Güzin Bayraksan and David K Love. Data-driven stochastic programming using phi-divergences. In The Operations Research Revolution, pages 1–19. Catonsville: Institute for Operations Research and the Management Sciences, 2015.
- Ben-david et al. [1995] Shai Ben-david, Nicolo Cesabianchi, David Haussler, and Philip M Long. Characterizations of learnability for classes of (0,…,n)-valued functions. Journal of Computer and System Sciences, 50(1):74–86, 1995.
- Bertsimas and Dunn [2017] Dimitris Bertsimas and Jack Dunn. Optimal classification trees. Machine Learning, 106(7):1039–1082, 2017.
- Bertsimas and Mersereau [2007] Dimitris Bertsimas and Adam J Mersereau. A learning approach for interactive marketing to a customer segment. Operations Research, 55(6):1120–1135, 2007.
- Bertsimas and Sim [2004] Dimitris Bertsimas and Melvyn Sim. The price of robustness. Operations Research, 52(1):35–53, 2004.
- Blanchet and Murthy [2019] Jose Blanchet and Karthyek Murthy. Quantifying distributional model risk via optimal transport. Mathematics of Operations Research, 44(2):565–600, 2019. doi: 10.1287/moor.2018.0936.
- Bonnans and Shapiro [2013] J Frédéric Bonnans and Alexander Shapiro. Perturbation analysis of optimization problems. Springer Science & Business Media, 2013.
- Bubeck et al. [2012] Sébastien Bubeck, Nicolo Cesa-Bianchi, et al. Regret analysis of stochastic and nonstochastic multi-armed bandit problems. Foundations and Trends® in Machine Learning, 5(1):1–122, 2012.
- Chapelle [2014] Olivier Chapelle. Modeling delayed feedback in display advertising. In Proceedings of the 20th ACM SIGKDD international conference on Knowledge discovery and data mining, pages 1097–1105. ACM, 2014.
- Chen et al. [2018] Zhi Chen, Daniel Kuhn, and Wolfram Wiesemann. Data-driven chance constrained programs over wasserstein balls. arXiv preprint arXiv:1809.00210, 2018.
- Chernozhukov et al. [2019] Victor Chernozhukov, Mert Demirer, Greg Lewis, and Vasilis Syrgkanis. Semi-parametric efficient policy learning with continuous actions. In Advances in Neural Information Processing Systems, pages 15039–15049, 2019.
- Chu et al. [2011] Wei Chu, Lihong Li, Lev Reyzin, and Robert Schapire. Contextual bandits with linear payoff functions. In Proceedings of the Fourteenth International Conference on Artificial Intelligence and Statistics, pages 208–214, 2011.
- Cressie and Read [1984] Noel Cressie and Timothy RC Read. Multinomial goodness-of-fit tests. Journal of the Royal Statistical Society: Series B (Methodological), 46(3):440–464, 1984.
- Daniely et al. [2011] Amit Daniely, Sivan Sabato, Shai Ben-David, and Shai Shalev-Shwartz. Multiclass learnability and the erm principle. In Proceedings of the 24th Annual Conference on Learning Theory, pages 207–232. JMLR Workshop and Conference Proceedings, 2011.
- Daniely et al. [2012] Amit Daniely, Sivan Sabato, and Shai S Shwartz. Multiclass learning approaches: A theoretical comparison with implications. In Advances in Neural Information Processing Systems, pages 485–493, 2012.
- Delage and Ye [2010] Erick Delage and Yinyu Ye. Distributionally robust optimization under moment uncertainty with application to data-driven problems. Operations research, 58(3):595–612, 2010.
- Dimakopoulou et al. [2017] Maria Dimakopoulou, Susan Athey, and Guido Imbens. Estimation considerations in contextual bandits. arXiv preprint arXiv:1711.07077, 2017.
- Duchi and Namkoong [2018] John Duchi and Hongseok Namkoong. Learning models with uniform performance via distributionally robust optimization. arXiv preprint arXiv:1810.08750, 2018.
- Duchi and Namkoong [2019] John Duchi and Hongseok Namkoong. Variance-based regularization with convex objectives. The Journal of Machine Learning Research, 20(1):2450–2504, 2019.
- Duchi et al. [2016] John Duchi, Peter Glynn, and Hongseok Namkoong. Statistics of robust optimization: A generalized empirical likelihood approach. arXiv preprint arXiv:1610.03425, 2016.
- Duchi et al. [2019] John Duchi, Tatsunori Hashimoto, and Hongseok Namkoong. Distributionally robust losses against mixture covariate shifts. arXiv preprint arXiv:2007.13982, 2019.
- Dudík et al. [2011] Miroslav Dudík, John Langford, and Lihong Li. Doubly robust policy evaluation and learning. In Proceedings of the 28th International Conference on Machine Learning, pages 1097–1104, 2011.
- Dudley [1967] Richard M Dudley. The sizes of compact subsets of hilbert space and continuity of gaussian processes. Journal of Functional Analysis, 1(3):290–330, 1967.
- Faury et al. [2020] Louis Faury, Ugo Tanielian, Elvis Dohmatob, Elena Smirnova, and Flavian Vasile. Distributionally robust counterfactual risk minimization. In Proceedings of the AAAI Conference on Artificial Intelligence, volume 34, pages 3850–3857, 2020.
- Filippi et al. [2010] Sarah Filippi, Olivier Cappe, Aurélien Garivier, and Csaba Szepesvári. Parametric bandits: The generalized linear case. In Advances in Neural Information Processing Systems, pages 586–594, 2010.
- Friedman et al. [2001] Jerome Friedman, Trevor Hastie, and Robert Tibshirani. The elements of statistical learning, volume 1. Springer series in statistics New York, 2001.
- Gao and Kleywegt [2016] Rui Gao and Anton J Kleywegt. Distributionally robust stochastic optimization with Wasserstein distance. arXiv preprint arXiv:1604.02199, 2016.
- Gao et al. [2018] Rui Gao, Liyan Xie, Yao Xie, and Huan Xu. Robust hypothesis testing using wasserstein uncertainty sets. In Advances in Neural Information Processing Systems, pages 7902–7912, 2018.
- Gerber et al. [2008] Alan S Gerber, Donald P Green, and Christopher W Larimer. Social pressure and voter turnout: Evidence from a large-scale field experiment. American political Science review, 102(1):33–48, 2008.
- Ghosh and Lam [2019] Soumyadip Ghosh and Henry Lam. Robust analysis in stochastic simulation: Computation and performance guarantees. Operations Research, 2019.
- Goldenshluger and Zeevi [2013] Alexander Goldenshluger and Assaf Zeevi. A linear response bandit problem. Stochastic Systems, 3(1):230–261, 2013.
- Hamming [1950] Richard W Hamming. Error detecting and error correcting codes. The Bell system technical journal, 29(2):147–160, 1950.
- Ho-Nguyen et al. [2020] Nam Ho-Nguyen, Fatma Kılınç-Karzan, Simge Küçükyavuz, and Dabeen Lee. Distributionally robust chance-constrained programs with right-hand side uncertainty under wasserstein ambiguity. arXiv preprint arXiv:2003.12685, 2020.
- Hu and Hong [2013] Zhaolin Hu and L Jeff Hong. Kullback-leibler divergence constrained distributionally robust optimization. Available at Optimization Online, 2013.
- Imbens [2004] Guido W Imbens. Nonparametric estimation of average treatment effects under exogeneity: A review. Review of Economics and statistics, 86(1):4–29, 2004.
- Imbens and Rubin [2015] G.W. Imbens and D.B. Rubin. Causal Inference in Statistics, Social, and Biomedical Sciences. Causal Inference for Statistics, Social, and Biomedical Sciences: An Introduction. Cambridge University Press, 2015. ISBN 9780521885881.
- Joachims et al. [2018] Thorsten Joachims, Adith Swaminathan, and Maarten de Rijke. Deep learning with logged bandit feedback. In International Conference on Learning Representations, May 2018.
- Jun et al. [2017] Kwang-Sung Jun, Aniruddha Bhargava, Robert Nowak, and Rebecca Willett. Scalable generalized linear bandits: Online computation and hashing. In Advances in Neural Information Processing Systems, pages 99–109, 2017.
- Kallus [2018] Nathan Kallus. Balanced policy evaluation and learning. Advances in Neural Information Processing Systems, pages 8895–8906, 2018.
- Kallus and Zhou [2018] Nathan Kallus and Angela Zhou. Confounding-robust policy improvement. arXiv preprint arXiv:1805.08593, 2018.
- Kitagawa and Tetenov [2018] Toru Kitagawa and Aleksey Tetenov. Who should be treated? empirical welfare maximization methods for treatment choice. Econometrica, 86(2):591–616, 2018.
- Lam [2019] Henry Lam. Recovering best statistical guarantees via the empirical divergence-based distributionally robust optimization. Operations Research, 67(4):1090–1105, 2019.
- Lam and Zhou [2017] Henry Lam and Enlu Zhou. The empirical likelihood approach to quantifying uncertainty in sample average approximation. Operations Research Letters, 45(4):301–307, 2017.
- Lattimore and Szepesvári [2020] Tor Lattimore and Csaba Szepesvári. Bandit algorithms. Cambridge University Press, 2020.
- Lee and Raginsky [2018] Jaeho Lee and Maxim Raginsky. Minimax statistical learning with wasserstein distances. In Proceedings of the 32nd International Conference on Neural Information Processing Systems, NIPS’18, pages 2692–2701, USA, 2018. Curran Associates Inc.
- Lehmann and Casella [2006] Erich L Lehmann and George Casella. Theory of point estimation. Springer Science & Business Media, 2006.
- Li et al. [2010] Lihong Li, Wei Chu, John Langford, and Robert E Schapire. A contextual-bandit approach to personalized news article recommendation. In Proceedings of the 19th international conference on World wide web, pages 661–670. ACM, 2010.
- Li et al. [2017] Lihong Li, Yu Lu, and Dengyong Zhou. Provably optimal algorithms for generalized linear contextual bandits. In Proceedings of the 34th International Conference on Machine Learning-Volume 70, pages 2071–2080. JMLR. org, 2017.
- Luenberger and Ye [2010] David G Luenberger and Yinyu Ye. Linear and Nonlinear Programming, volume 228. Springer, 2010.
- Mohajerin Esfahani and Kuhn [2018] Peyman Mohajerin Esfahani and Daniel Kuhn. Data-driven distributionally robust optimization using the Wasserstein metric: performance guarantees and tractable reformulations. Mathematical Programming, 171(1):115–166, Sep 2018. ISSN 1436-4646. doi: 10.1007/s10107-017-1172-1.
- Namkoong and Duchi [2016] Hongseok Namkoong and John C Duchi. Stochastic gradient methods for distributionally robust optimization with f-divergences. In Proceedings of the 30th International Conference on Neural Information Processing Systems, pages 2216–2224. Red Hook: Curran Associates Inc., 2016.
- Natarajan [1989] Balas K Natarajan. On learning sets and functions. Machine Learning, 4(1):67–97, 1989.
- Nguyen et al. [2018] Viet Anh Nguyen, Daniel Kuhn, and Peyman Mohajerin Esfahani. Distributionally robust inverse covariance estimation: The Wasserstein shrinkage estimator. arXiv preprint arXiv:1805.07194, 2018.
- Qu et al. [2021] Zhaonan Qu, Zhengyuan Zhou, Fang Cai, and Xia Li. Interpretable personalization via optimal linear decision boundaries. preprint, 2021.
- Rakhlin and Sridharan [2016] Alexander Rakhlin and Karthik Sridharan. BISTRO: An efficient relaxation-based method for contextual bandits. In Proceedings of the International Conference on Machine Learning, pages 1977–1985, 2016.
- Rigollet and Zeevi [2010] Philippe Rigollet and Assaf Zeevi. Nonparametric bandits with covariates. arXiv preprint arXiv:1003.1630, 2010.
- Rosenbaum and Rubin [1983] Paul R Rosenbaum and Donald B Rubin. The central role of the propensity score in observational studies for causal effects. Biometrika, 70(1):41–55, 1983.
- Ruder [2016] Sebastian Ruder. An overview of gradient descent optimization algorithms. arXiv preprint arXiv:1609.04747, 2016.
- Rusmevichientong and Tsitsiklis [2010] Paat Rusmevichientong and John N Tsitsiklis. Linearly parameterized bandits. Mathematics of Operations Research, 35(2):395–411, 2010.
- Russo and Van Roy [2014] Daniel Russo and Benjamin Van Roy. Learning to optimize via posterior sampling. Mathematics of Operations Research, 39(4):1221–1243, 2014.
- Russo and Van Roy [2016] Daniel Russo and Benjamin Van Roy. An information-theoretic analysis of thompson sampling. The Journal of Machine Learning Research, 17(1):2442–2471, 2016.
- Schwartz et al. [2017] Eric M Schwartz, Eric T Bradlow, and Peter S Fader. Customer acquisition via display advertising using multi-armed bandit experiments. Marketing Science, 36(4):500–522, 2017.
- Shafieezadeh-Abadeh et al. [2015] Soroosh Shafieezadeh-Abadeh, Peyman Esfahani, and Daniel Kuhn. Distributionally robust logistic regression. In Advances in Neural Information Processing Systems 28, pages 1576–1584. 2015.
- Shapiro [2017] Alexander Shapiro. Distributionally robust stochastic programming. SIAM Journal on Optimization, 27(4):2258–2275, 2017.
- Shapiro et al. [2009] Alexander Shapiro, Darinka Dentcheva, and Andrzej Ruszczyński. Lectures on stochastic programming: modeling and theory. SIAM, 2009.
- Si et al. [2020] Nian Si, Fan Zhang, Zhengyuan Zhou, and Jose Blanchet. Distributionally robust policy evaluation and learning in offline contextual bandits. In International Conference on Machine Learning, pages 8884–8894. PMLR, 2020.
- Sinha et al. [2018] Aman Sinha, Hongseok Namkoong, and John Duchi. Certifiable distributional robustness with principled adversarial training. In International Conference on Learning Representations, 2018.
- Slivkins et al. [2019] Aleksandrs Slivkins et al. Introduction to multi-armed bandits. Foundations and Trends® in Machine Learning, 12(1-2):1–286, 2019.
- Staib and Jegelka [2017] Matthew Staib and Stefanie Jegelka. Distributionally robust deep learning as a generalization of adversarial training. In NIPS workshop on Machine Learning and Computer Security, 2017.
- Swaminathan and Joachims [2015a] Adith Swaminathan and Thorsten Joachims. Batch learning from logged bandit feedback through counterfactual risk minimization. Journal of Machine Learning Research, 16:1731–1755, 2015a.
- Swaminathan and Joachims [2015b] Adith Swaminathan and Thorsten Joachims. The self-normalized estimator for counterfactual learning. In advances in neural information processing systems, pages 3231–3239. Citeseer, 2015b.
- Tsybakov [2009] Alexandre B Tsybakov. Introduction to Nonparametric Estimation. Springer, 2009.
- Van der Vaart [2000] Aad W. Van der Vaart. Asymptotic Statistics, volume 3. Cambridge University Press, 2000.
- Vapnik and Chervonenkis [1971] VN Vapnik and A Ya Chervonenkis. On the uniform convergence of relative frequencies of events to their probabilities. Theory of Probability and its Applications, 16(2):264, 1971.
- Volpi et al. [2018] Riccardo Volpi, Hongseok Namkoong, Ozan Sener, John Duchi, Vittorio Murino, and Silvio Savarese. Generalizing to unseen domains via adversarial data augmentation. arXiv preprint arXiv:1805.12018, 2018.
- Wainwright [2019] Martin J Wainwright. High-dimensional statistics: A non-asymptotic viewpoint, volume 48. Cambridge University Press, 2019.
- Yang [2018] Insoon Yang. Wasserstein distributionally robust stochastic control: A data-driven approach. arXiv preprint arXiv:1812.09808, 2018.
- Yang et al. [2021] Wenhao Yang, Liangyu Zhang, and Zhihua Zhang. Towards theoretical understandings of robust markov decision processes: Sample complexity and asymptotics. arXiv preprint arXiv:2105.03863, 2021.
- Zhang et al. [2012] Baqun Zhang, Anastasios A Tsiatis, Marie Davidian, Min Zhang, and Eric Laber. Estimating optimal treatment regimes from a classification perspective. Stat, 1(1):103–114, 2012.
- Zhao and Guan [2018] Chaoyue Zhao and Yongpei Guan. Data-driven risk-averse stochastic optimization with Wasserstein metric. Operations Research Letters, 46(2):262 – 267, 2018. ISSN 0167-6377. doi: https://doi.org/10.1016/j.orl.2018.01.011.
- Zhao and Jiang [2017] Chaoyue Zhao and Ruiwei Jiang. Distributionally robust contingency-constrained unit commitment. IEEE Transactions on Power Systems, 33(1):94–102, 2017.
- Zhao et al. [2014] Ying-Qi Zhao, Donglin Zeng, Eric B Laber, Rui Song, Ming Yuan, and Michael Rene Kosorok. Doubly robust learning for estimating individualized treatment with censored data. Biometrika, 102(1):151–168, 2014.
- Zhao et al. [2012] Yingqi Zhao, Donglin Zeng, A John Rush, and Michael R Kosorok. Estimating individualized treatment rules using outcome weighted learning. Journal of the American Statistical Association, 107(499):1106–1118, 2012.
- Zhou et al. [2017] Xin Zhou, Nicole Mayer-Hamblett, Umer Khan, and Michael R Kosorok. Residual weighted learning for estimating individualized treatment rules. Journal of the American Statistical Association, 112(517):169–187, 2017.
- Zhou et al. [2018] Zhengyuan Zhou, Susan Athey, and Stefan Wager. Offline multi-action policy learning: Generalization and optimization. arXiv preprint arXiv:1810.04778, 2018.
Appendix A Proofs of Main Results
Appendix A.1 Auxiliary Results
To prove Theorem 1 and 2, we first collect some theorems in stochastic optimization [71] and complexity theory (Wainwright [82, Section 4]).
Definition 8 (Gâteaux and Hadamard directional differentiability).
Let and be Banach spaces and be a mapping. It is said that is directionally differentiable at a considered point if the limits
exists for all
Furthermore, it is said that is Gâteaux directionally differentiable at if the directional derivative exists for all and is linear and continuous in For ease of notation, we also denote be the operator
Finally, it is said that is Hadamard directionally differentiable at if the directional derivative exists for all and
Theorem A5 (Danskin theorem, Theorem 4.13 in [13]).
Let be a nonempty compact set and be a Banach space. Suppose the mapping satisfies that and are continuous on , where is a neighborhood around Let be the inf-functional and Then, the functional is directionally differentiable at and
Theorem A6 (Delta theorem, Theorem 7.59 in [71]).
Let and be Banach spaces, equipped with their Borel -algrebras, be a sequence of random elements of , be a mapping, and be a sequence of positive numbers tending to infinity as Suppose that the space is separable, the mapping is Hadamard directionally differentiable at a point and the sequence converges in distribution to a random element of Then,
and
Proposition 3 (Proposition 7.57 in [71]).
Let and be Banach spaces, and Then the following hold: (i) If is Hadamard directionally differentiable at then the directional derivative is continuous. (ii) If is Lipschitz continuous in a neighborhood of and directionally differentiable at then is Hadamard directionally differentiable at
Definition 9 (Rademacher complexity).
Let be a family of real-valued functions Then, the Rademacher complexity of is defined as
where are i.i.d with the distribution
Theorem A7 (Theorem 4.10 in [82]).
If we have with probability at least ,
Theorem A8 (Dudley’s Theorem, (5.48) in [82]).
If we have a bound for the Rademacher complexity,
where , is -covering number of set and the metric is defined by
Appendix A.2 Proofs of Lemma 1 Corollary 1 and Lemma 2 in Section 3.1
Proof of Lemma 1.
The first equality follows from Hu and Hong [40, Theorem 1]. The second equality holds, because for any (Borel measurable) function and any policy , we have
| (A.1) |
Plugging in yields the result. ∎
Proof of Corollary 1.
Since are mutually independent conditional on , and has a density if is a continuous random variable, we can write the joint measure of as
where denotes the Lebesgue measure in if Assumption 2.1 is enforced, and denotes a uniformly distributed measure on that for if Assumption 2.2 is enforced, and denotes the measure induced by on the space . Without loss of generality, we assume . Then, For the simplicity of notation, when we write
which means
Then, by Proposition 1, we have under , have a joint measure
where
and
which completes the proof. ∎
Proof of Lemma 2.
The closed form expression of and follows from elementary algebra. By the Cauchy Schwartz’s inequality, we have
Therefore, it follows that . Note that the Cauchy Schwartz’s inequality is actually an equality if and only if
for some constant independent of . Since the above condition is violated if has at least two different non-zero values, we have in this case is strictly-concave in . ∎
Appendix A.3 Proof of the central limit theorem in Section 1
Lemma A11 (Uniform upper bound of ).
Suppose that Assumption 1.3 is imposed, we have the optimal dual solution and the empirical dual solution , where .
Proof.
First note that and
gives the upper bound
∎
Lemma A12 (Lower bound of ).
Suppose that Assumption 2.1 is imposed, we have .
Proof.
To ease the notation, we abbreviate as It is easy to check the density of has a lower bound Since is a continuous function on a compact space, we have is upper bounded. Let
First, note that We only need to show
The derivative of is given by
Since has a continuous density, we have Notice that
Therefore, we have
Finally, we arrive the desired result
which completes the proof. ∎
Lemma A13.
Proof.
After reformulation, we have
The denominator and the nominator converges as
where
By Slutsky’s theorem, the desired result follows.
∎
To ease the proofs below, we define as the weighted empirical distribution by
where denote a dirac measure.
Proof.
Lemma A15.
Proof.
Now we are ready to show the proof of Theorem 1.
Proof.
Proof of Theorem 1 We divide the proof into two parts: continuous case and discrete case.
(1) Continuous case, i.e., Assumption 2.1 is satisfied: Note that
where by Lemma A13
By Lemma A12, there exists such that . To ease the notation, we abbreviate as . Since is Lipschitz continuous over the set , we have
| (A.3) |
uniformly in Banach space of continuous functions equipped with the the sup-norm [e.g. 5, Corollary 7.17]. is a random element in .
Define the functionals
for . By the Danskin theorem [13, Theorem 4.13], is directionally differentiable at any with and
where and is the directional derivative of at in the direction of On the other hand, is Lipschitz continuous if is bounded away from zero. Notice that
| (A.4) |
Therefore, is Hadamard directionally differentiable at (see, for example, Proposition 7.57 in [71]). By the Delta theorem (Theorem 7.59 in [71]), we have
Furthermore, we know that is strictly convex w.r.t given and is strictly convex if is strictly convex. Therefore, is strictly convex for and thus
where denotes equality in distribution. By Lemma 1, we have that
and
We remain to show (, as The weak convergence (A.3) also implies the uniform convergence,
Therefore, we further have
given is bounded away from zero in (A.4). Let
Then, given the event
we have
which means by the convexity of
(2) Discrete case, i.e., Assumption 2.2 is satisfied: First, if , we have almost surely with . Therefore, in the following, we focus on the case . Without loss of generality, we assume the smallest element in the set is zero since we can always translate . Note that
for , and
Further, in the discrete case, we have
| (A.5) |
Since , the proof of continuous case shows that is strictly concave for . Then, has a unique maximizer in . The remaining proof is the same as the continuous case. ∎
Appendix A.4 Proof of the statistical performance guarantee in Section 6
Proof of Lemma 6.
For any probability measure supported on , we have
Therefore, we have
Since we can always divide the denominator and nominator of (Appendix A.4) by we can assume without loss of generality. Therefore, we have
Then, if we have
| (A.7) | |||||
Then, we turn to (A.7),
which can be bounded by
Further, we observe that
where denotes the total variation between and Therefore, we have
And it is easy to verify that
By combining all the above together, we have when
∎
We first give the proof of Lemma 5.
Proof of Lemma 5.
Notice that
where and the last equality is based on the fact that
Denote and we have
Similarly, we have
The desired result then follows.
∎
Lemma A16.
Suppose probability measures and supported on and has a positive density with a lower bound over the interval Then, we have
Proof.
For ease of notation, let and Since the distribution is right-continuous with left limits and is continuous, we have
If we have
If we construct a monotone increasing sequence with Since is continuous, we have Then, notice that
Therefore, for every , we have
The desired results then follows. ∎
Proof of Theorem 2.
Recall Then,
Note that
| (A.8) |
Therefore, we have
| (A.9) | |||||
We then divide the proof into two parts: continuous case and discrete case.
(1) Continuous case, i.e., Assumption 2.1 is satisfied: By Lemmas 5, A16 and Assumption 1, we have
| (A.11) | |||||
For (A.11), by Wainwright [82, Theorem 4.10], we have with probability
| (A.12) | |||||
where the function class is defined as
For (A.11), we have
| (A.13) |
Further, by Wainwright [82, Theorem 4.10] and the fact and , we have with probability at least
| (A.14) |
where
By combining (A.12), (A.13), and (A.14), we have with probability at least ,
Now, we turn to the Rademacher complexity of the classes and . First, for the class , notice that
Therefore, the covering number
For the class , we claim
where For ease of notation, let
Suppose is a cover for and is a cover for under the distance defined by
Then, we claim that is a -cover set for where is defined as
For we can pick such that , and Then, we have
From Lemma 19.15 and Example 19.16 in [79], we know
where is a universal constant. Finally, by Dudley’s theorem [e.g. 82, (5.48)], we have
and
where is a universal constant. Therefore, by picking we have with probability ,
| (A.15) |
(2) Discrete case, i.e., Assumption 2.2 is satisfied: By Lemmas 6 and Assumption 1, when we have
where contains all subsets of Then
| (A.17) | |||||
For (A.17), by Wainwright [82, Theorem 4.10], we have with probability
| (A.18) | |||||
where the function class is defined as
For (A.17), we have
| (A.19) |
By combining (A.18), (A.19) and (A.14), we have with probability at least ,
Now, we turn to the Rademacher complexity of the classes We claim
where denotes the cardinality of set . By similar argument with the continuous case, we have is a -cover set for where is defined as
Finally, by Dudley’s theorem [e.g. 82, (5.48)]
Therefore, by picking we have with probability ,
∎
Appendix A.5 Proof of the statistical lower bound in Section 4.2
We first define some useful notions. For Let
Let
Lemma A17.
For is differentiable and for
Proof.
Proof of Theorem 3.
Since we consider two-action scenario, we denote the actions to be and We first follow the lines in the proof in Kitagawa and Tetenov [47, Theorem 2.2]. By Lemma 3, the VC dimension of the policy class is larger or equal than . Let be points that are shattered by policy Let By definition, for each there exist a such that for We use to denote the policy restricted in Now, we consider you two distributions
for which will be determined later. Then, we construct for every The marginal distribution of in supports uniformly on with equal mass Further,
and conditional on follows the distribution of and follows the distribution of We also define
To emphasize the dependence on the underlying distrbution we rewrite Now, by Lemma 1, we have
Since for every we have we have the optimal policy for the distribution is . Further,
Then, for any for any we have
To simplify the notation, let Then, we have
We construct the distribution of
Then, becomes
By Lemma A17, if and we have
Then, by Assouad Lemma [78, Theorem 2.12 (ii)], we have
where denotes the total variation distance between two measures. By Pinsker’s inequality ([78, Lemma 2.5]), we have
For such that Let and without loss of generality, we assume Then, wave
For and we have by Tsybakov [78, Lemma 2.7]
By picking which requires , we have
Recall that . Therefore, we have
∎
Appendix A.6 Proof of the Bayes DRO policy result in Section 5.1
Appendix A.7 Proof of the extension results in Section 7
Proof of Lemma 9.
If , we have , and thus Lemma 9 recovers Lemma 5. For , notice that
where and the last equality is based on the fact that
By the triangular inequality in space, we have
∎
Proof of Lemma 10.
We begin with
| (A.21) | |||||
| (A.23) | |||||
We tackle the two cases and separately. To ease of notation, we abbreviate as .
1) Case Note that
By the -norm triangular inequality and the fact that for we have
Consider the function
Then, when we have
The same bound holds for which completes this case.
2) Case In this case, we have
We will focus on and without loss of generality, we assume
Recall that for the function the derivative is
Therefore, we have
| (A.25) | |||||
Then, when we have
| (A.26) | |||||
Furthermore, we have
| (A.27) | |||||
The last equation is due to
We further note that
| (A.28) |
and
| (A.29) | |||||
By combining bounds (A.25) - (A.29), we have
which completes the proof. ∎
Appendix B Experiments
Appendix B.1 Optimization of multi-linear policy
This section provides implementation details for how to compute where is the multilinear policy associated with parameter . Recall the definition of from definition 4 that
As we did in Section 5.2, we employ the smooth approximation of the indicator function
Now for , we the smooth weight function as
then the estimator admits the smooth approximation
In addition, we have
Therefore, we can employ gradient to descent to solve for that minimizes , which approximately minimizes as well. This is how we solve for in implementation.
Appendix B.2 Experimental details of selection in Section 6.4
In this section we will provide further details on the selection experiment.
Recall that we intend to estimate based on the data of 100 cities in the training set. To this end, we will partition the data in 20% of cities as our validation set with distribution denoted by , and we use to denote the distribution of the rest 80% of the training set. We will explain the detail of how to estimate in the rest of this section.
We first explain how to estimate the divergence between marginal distributions of , which is denoted by . A directly computation using the sampled distributions and may result in infinite value, because (1) some features such as year of birth contains outliers whose value only appears in or ; (2) is a nine-dimensional vector, which exaggerates the prior problem. In view of that the demographic features (year of birth, sex, household size) are weakly correlated with the historical voting records, we will compute the divergence on them separately. In order to avoid infinite KL-divergence, we first regroup two demographic features, Year of Birth (YoB) and Household Size (HS), according to the following rules:
After the regrouping, we define the demographic feature vector , and compute the KL-divergence . The historical voting record vector is defined as , and we compute its divergence directly. We will use the sum as approximation for the divergence between and .
Next, we will explain how to apply logistic regression to estimate . We independently fit two logistic regression of , using data corresponding to and respectively. The result of logistic regression implies a fitted conditional distribution of given , i.e., , where and are fitted parameters for the logistic regression. We denoted by as the fitted conditional distribution using the data , and as the fitted conditional distribution using the data . Since both and are Bernoulli distribution parameterized as a function of , the KL-divergence between them can also be computed in closed form as a function of . Finally, we compute the average value of the estimated KL-divergence using the distribution of .
To conclude this section, we provide the full formula used in the computation: