Discovery, Timing, and Multiwavelength Observations of the Black Widow Millisecond Pulsar PSR J15552908
Abstract
We report the discovery of PSR J15552908, a 1.79 ms radio and gamma-ray pulsar in a 5.6 hr binary system with a minimum companion mass of 0.052 . This fast and energetic ( erg s-1) millisecond pulsar was first detected as a gamma-ray point source in Fermi Large Area Telescope (LAT) sky survey observations. Guided by a steep spectrum radio point source in the Fermi error region, we performed a search at 820 MHz with the Green Bank Telescope that first discovered the pulsations. The initial radio pulse timing observations provided enough information to seed a search for gamma-ray pulsations in the LAT data, from which we derive a timing solution valid for the full Fermi mission. In addition to the radio and gamma-ray pulsation discovery and timing, we searched for X-ray pulsations using NICER but no significant pulsations were detected. We also obtained time-series -band photometry that indicates strong heating of the companion star by the pulsar wind. Material blown off the heated companion eclipses the 820 MHz radio pulse during inferior conjunction of the companion for of the orbit, which is twice the angle subtended by its Roche lobe in an edge-on system.
1 Introduction
One of the great successes of Fermi LAT mission (Atwood et al., 2009) has been the revelation that a large number of point sources in the GeV gamma-ray sky are powered by pulsars, including large populations both of energetic young pulsars and older, faster spinning millisecond pulsars. In the early days of the Fermi mission, these discoveries came via two techniques: (1) folding the observed gamma-rays at the pulse period of known radio pulsars (e.g. Abdo et al., 2009a) and (2) direct searches for periodicities in the gamma-ray photon arrival times themselves (e.g. Abdo et al., 2009b). Each of these techniques had its own biases and selection effects that left many gamma-ray pulsars undiscovered. The next highly successful technique was to use the locations of LAT gamma-ray sources that had pulsar-like characteristics (e.g. curved spectra and low variability) as targets for directed radio pulsar searches, performed by the Fermi Pulsar Search Consortium (PSC) (Ray et al., 2012). This led to a bounty of millisecond pulsar discoveries that has continued as the LAT survey observations reveal ever-more gamma-ray sources (Ransom et al., 2011; Cognard et al., 2011; Kerr et al., 2012; Ray et al., 2013; Bhattacharyya et al., 2013; Camilo et al., 2015; Cromartie et al., 2016). Most recently, a new technique was employed to reveal pulsar candidates among the LAT sources: Frail et al. (2016) and Frail et al. (2018) exploited the nearly full-sky 150 MHz TIFR GMRT Sky Survey (TGSS) radio survey performed by the Giant Metrewave Radio Telescope (GMRT) to identify steep spectrum radio point sources within the error regions of LAT sources. These candidates were quickly followed up by the PSC with deep radio searches, leading to several new millisecond pulsar (MSP) discoveries (initially reported in Frail et al. 2018) and demonstrating the power of this technique. Here we provide details on the discovery of PSR J15552908 and follow up observations that determined its orbit, discovered gamma-ray pulsations, searched for X-ray pulsations, and made initial studies of its optical companion star.
2 Image-based Candidate Selection Method
PSR J15552908 was initially identified from an image-based search for potential pulsar candidates. The method is described in more detail in Frail et al. (2018) but here we give a short summary. We searched for compact, steep spectrum radio sources within the error ellipses of unassociated Fermi sources from a preliminary version of the LAT 8-year catalog (hereafter 4FGL; Abdollahi et al., 2020). We used the GMRT 150 MHz All-Sky Radio Survey (TGSS ADR1; Intema et al., 2017) and the 1.4 GHz NRAO VLA Sky Survey (NVSS; Condon et al., 1998) to calculate initial two-point spectral indices and source angular diameters for all radio sources within Fermi unassociated sources. Outside of the NVSS survey declination limit (), but north of the declination limit of TGSS (), we used the 843 MHz Sydney University Molonglo Sky Survey (SUMSS; Bock et al., 1999) for the higher frequency of the two-point spectral index. For those rare compact, steep spectrum radio sources identified via this method, follow-up interferometric observations at arcsecond resolution were carried out in order to eliminate false positives from the sample, such as high redshift radio galaxies.
This image-based method differs from past searches of Fermi unassociated sources (e.g. Kerr et al., 2012) in that pulsar candidates are selected without regard to the properties of the Fermi source, such as its spectral shape, temporal variability, the size of the error ellipse, or its sky distribution. A single unresolved radio source was identified within the error ellipse of P86Y3595 (now known as 4FGL J1555.72908) with a spectral index 0.2 (where is given as ). The radio source position was measured to be R.A.=, decl.= (J2000) with an uncertainty of about 2″.
3 Radio Pulsation Search and Timing Observations
As part of a long term effort to discover radio pulsars associated with Fermi sources, organized by the Fermi PSC, we made targeted observations of the candidates identified in Frail et al. (2018). We observed P86Y3595 on 2017 February 1 (MJD 57785) for 30 minutes at 820 MHz with the Robert C. Byrd Green Bank Telescope (GBT). We used the GUPPI pulsar backend to record 200 MHz of bandwidth with 2048 channels at 61.44 s resolution. We performed an acceleration search of these data over a range of trial dispersion measures using PRESTO (Ransom et al., 2002) and identified a strong candidate pulsation with 1.79 ms period (559.4 Hz) at DM 75.91 pc cm-3. Following the discovery, a 5 minute GBT observation at S-band (on MJD 57806) confirmed the discovery and determined the pulse width at that frequency to be a very narrow 3%.
We also obtained a 30-minute observation on MJD 57788 using the Karl G. Jansky Very Large Array (VLA) in phased-array pulsar mode. The data were taken while the array was being reconfigured; 20 antennas were in their D-configuration positions (maximum baseline 1 km), and 7 still in A-configuration (maximum baseline 30 km). The observation was split into three 10-minute scans in order to allow for re-phasing. Interferometric phases were determined using the nearby calibrator J15542704, then individual antenna data streams were coherently summed to create a high time resolution single-pixel data stream at the previously-determined radio source position. The summed voltage data were processed in real time using dspsr (van Straten & Bailes, 2011) and recorded using 2048 0.5-MHz channels (1024 MHz total bandwidth, centered on 1500 MHz) at 32 s time resolution. It is worth noting that this VLA observation is quite broadband and exhibits profile evolution across the band. This profile evolution likely biases the measured DM from that observation.
We also detected the pulsation in a 2-minute GBT observation at 350 MHz that had been taken on MJD 56907 as part of the GBNCC survey (Stovall et al., 2014). Lastly we obtained a 5 hour GBT observation on MJD 57833 revealing an eclipse with a sharp ingress and clear pulse delays for about 10 minutes after egress. The eclipse duration is approximately 10% of the duration of the orbit, and the likely dispersive pulse delays are typical for black-widow pulsar systems. This observation was taken in coherently-dedispersed search mode, providing a calibrated flux density and high time resolution. A fault in the GUPPI backend at the time of the observation prevented us from extracting reliable polarization measurements from this observation. The eclipse and high S/N total intensity pulse profile from that observation are shown in Figure 2.
We also obtained five observations of varying duration using the 76-m Lovell telescope between 2019 November 15 and 2020 September 21. We used a backend based on ROACH FPGA boards (Bassa et al., 2016a) to record coherently de-dispersed, phase-folded data covering a bandwidth of 384 MHz in 0.25 MHz channels centred at 1534 MHz, with 256 phase bins per pulse period. To obtain approximate flux-density calibrations for these observations, we estimated the system equivalent flux density from observations of the Crab nebula on nearby epochs, adjusting for ground spillover due to the low elevation. We estimate the fractional uncertainty on this calibration to be around 20%. The pulsed flux density was then estimated from each observation by fitting the high S/N 820MHz GBT pulse profile as a template, along with an arbitrary baseline, to the flux-calibrated profiles. The average flux density over the five observations was mJy. A log of all the radio observations is presented in Table 1. The pulse profile at a range of frequencies is shown in Figure 1.
Combining these radio data, we obtained an initial orbital solution with a period of 5.60 hours and a semimajor axis of 0.151 lt-s. Because we have only a small amount of radio data, most of the system parameters are better determined by the gamma-ray timing in Section 4.2. However, the precise radio TOAs over the 5 hour observation allow us to determine some of the orbital parameters more precisely than is possible from the gamma-ray data alone. In particular, we measure an eccentricity , lt-s, and an epoch of ascending node of MJD(TDB).
| Telescope | MJD | Freq. | BW | Duration | Orbit Phase | DM | Notes | |
|---|---|---|---|---|---|---|---|---|
| (UTC) | (MHz) | (MHz) | (s) | () | (pc cm-3) | (mJy) | ||
| GBT | 56907.968322 | 350 | 100 | 120 | 0.668–0.674 | 75.916(2) | GBNCC | |
| GBT | 57785.510301 | 820 | 200 | 1800 | 0.871–0.959 | 75.9196(6) | Discovery | |
| VLA | 57788.543634 | 1500 | 1000 | 1920 | 0.862–0.975 | 75.997(4) | ||
| GBT | 57806.554895 | 2000 | 700 | 480 | 0.006–0.030 | 75.91(2) | 0.10(5) | |
| GBT | 57833.301146 | 820 | 200 | 18000 | 0.562–0.454 | 75.9212(1) | 2.5(5) | Eclipse |
| Lovell | 58802.535248 | 1534 | 384 | 1404 | 0.414–0.483 | 75.94(3) | 0.24(5) | |
| Lovell | 58803.504318 | 1534 | 384 | 525 | 0.564–0.590 | 75.95(4) | 0.27(5) | |
| Lovell | 58805.433996 | 1534 | 384 | 2397 | 0.828–0.947 | 75.93(2) | 0.16(3) | |
| Lovell | 58907.194884 | 1534 | 384 | 907 | 0.661–0.706 | 75.87(4) | 0.19(4) | |
| Lovell | 59113.624898 | 1534 | 384 | 1562 | 0.715–0.793 | 75.89(2) | 0.15(3) |


4 Gamma-ray Observations
The initial (not phase-connected) radio timing parameters provided the seed necessary to make a computationally-tractable pulsation search in the gamma-ray data, as we describe here.
4.1 Fermi-LAT Data Preparation
To search for gamma-ray pulsations from PSR J15552908, we selected Pass 8 SOURCE-class gamma-ray photons (Atwood et al., 2012) detected by the Fermi LAT between 2008 August 4 and 2018 April 19 from within a radius region of interest (RoI) around the radio position, with energies greater than MeV, and with a maximum zenith angle of .
To increase the sensitivity of the pulsation search, and avoid the need for hard cuts on photon energies and incidence angles, we weighted the contributions of each photon to the pulsation detection statistic (Kerr, 2011). The weights represent the probability of each photon having been emitted by the targeted gamma-ray source, rather than by a nearby point source, or by the diffuse Galactic or isotropic gamma-ray components. The weights were computed with gtsrcprob, using the P8R2_SOURCE_V6 instrument response functions (IRFs)111See https://fermi.gsfc.nasa.gov/ssc/data/analysis/LAT_essentials.html and a preliminary (“FL8Y”) version of the Fermi-LAT Fourth Source Catalog, and corresponding diffuse and isotropic emission templates, as the input model for the gamma-ray flux within the RoI.
4.2 Gamma-ray Pulsation Search and Detection
We performed a gamma-ray pulsation search in years of LAT data around the parameters of a preliminary timing solution that was based on radio data spanning 50 days. A search was necessary as the radio timing parameters were not measured precisely enough to safely extrapolate over multiple years of LAT data, and the pulsar’s gamma-ray photon flux is too weak to show significant pulsations over such a short time span. For several parameters (spin frequency, orbital period) the precision scales directly with the length of the data span, and at this stage the spin frequency derivative had not been measured.
Apart from the radio timing solution, the search parameter space was constrained by a Gaia sky position and the distribution of spin frequency derivatives for known MSPs. It was assumed that a Gaia source (ID 6041127310076589056) at position R.A.=, decl.= (J2000) with magnitude (EDR3; Gaia Collaboration et al. 2021), coincident with the image-based radio position (Section 2), is the pulsar’s companion star. In the search, the positional parameters were kept fixed to these values. Note that this source is too faint for Gaia to measure its proper motion or parallax. The spin frequency derivative was searched in the range , as more than of the known MSPs fall into this range (ATNF Pulsar Catalogue222http://www.atnf.csiro.au/research/pulsar/psrcat; Manchester et al., 2005, version 1.64). In the case of a non-detection this range would have been extended in steps.
The sensitive statistic (de Jager et al., 1989; Kerr, 2011) was utilized to search for gamma-ray pulsations. This statistic incoherently combines the Fourier power of the lowest harmonics. Typically most power is found in the lowest harmonics (Pletsch & Clark, 2014), so for computational efficiency we truncated the harmonic summing at as in the successful pulsation search of PSR J09520607 (Nieder et al., 2019).
An efficient and dense grid covering the parameter space is key to the detection of gamma-ray pulsations. To build such a grid we exploited the distance “metric”, which is a second-order approximation of the expected fractional loss in squared signal-to-noise ratio due to offsets in the signal parameters (Balasubramanian et al., 1996; Owen, 1996). The metric components for the binary pulsar parameters are presented in Nieder et al. (2020). Denser grids are required for higher harmonics and thus the grid is built for the highest harmonic, here .
The search space was split into smaller parts and carried out in parallel on the ATLAS computing cluster in Hannover. On one single computer the search would have taken days. Distributing the work over CPU cores the search only took minutes.
Significant gamma-ray pulsations were detected over most of the 10-year LAT data span used in this search. The resulting pulse phase showed residual time dependence, indicating time evolution of the pulsar spin-down rate. Still, the maximum statistic detected in the search was . Conservatively assuming that all trials were independent (the actual effective number of trials is smaller), the false-alarm probability is which confirms the detection of gamma-ray pulsations.
4.3 Gamma-ray Pulsation Timing
Following the detection of gamma-ray pulsations, we extended the observation span to cover the most recent Fermi-LAT data (Bruel et al., 2018), up to 2020 August 5 (12 years of data), and using the most recent P8R3_SOURCE_V3 IRFs. In the 8-yr 4FGL (and the 10-yr “4FGL-DR2” iteration, Ballet et al. 2020), the gamma-ray spectrum of 4FGL J1555.72908 is modelled with a simple power law, rather than the curved sub-exponentially-cutoff power-law spectrum typical for gamma-ray pulsars. This is because the curved spectrum did not provide a significantly better fit for the observed gamma-ray flux. This is likely due to a combination of a low overall photon flux, and high uncertainties in the low-energy flux due to the contribution from the diffuse Galactic interstellar emission. Bruel (2019) developed a method to obtain optimised photon weights by adjusting the spectral parameters to maximise the resulting weighted statistic. Adopting this technique to optimise the photon probability weights, we found a pulsar-like sub-exponentially-cutoff power-law spectrum that resulted in a much more significant pulsation detection than was obtained using the simple power-law spectral model. We therefore adopted these weights for the follow-up timing analyses presented below.
In the timing analysis the pulsar is analyzed precisely using the likelihood, , and the Bayesian Information Criterion (BIC; Schwarz, 1978). To measure the pulsar parameters , is maximized by fitting a pulse profile to a template pulse profile (see, e.g., Ray et al., 2011; Kerr et al., 2015; Clark et al., 2017) by marginalizing over the pulsar parameters and the template parameters jointly as described by Nieder et al. (2019). The likelihood tests how likely the pulse profile is described via the template versus a flat, noise distribution. The -th photon contributes according to its weight and the pulsar’s phase at emission time . The latter is computed using a phase model , the photon’s arrival time at the LAT , and the pulsar parameters . An analytic template is constructed as a sum of wrapped Gaussian peaks. For the width we used a log-uniform prior and constrained the range to allow only peaks broader than of a rotation and narrower than half a rotation. All other parameters used a uniform prior.
To account for small phase variations over the full data span, additional spin-frequency derivatives are needed. While only the first derivative was included in the search, four additional derivatives were favored by the Bayesian Information Criterion (BIC) throughout the timing analysis. Higher orders were disfavored by the BIC.
We tested for the presence of additional effects, including proper motion, and eccentricity in the binary system. These parameters were found to be consistent with zero and disfavored by the BIC. For those parameters the timing analysis sets confidence upper limits. A circular orbit is favored over an eccentric one with an upper limit on the eccentricity , which is consistent to the value found in the radio timing (; see Section 3). The timing analysis clearly favors zero total proper motion setting the upper limit to . The confidence interval on a variable orbital period is .
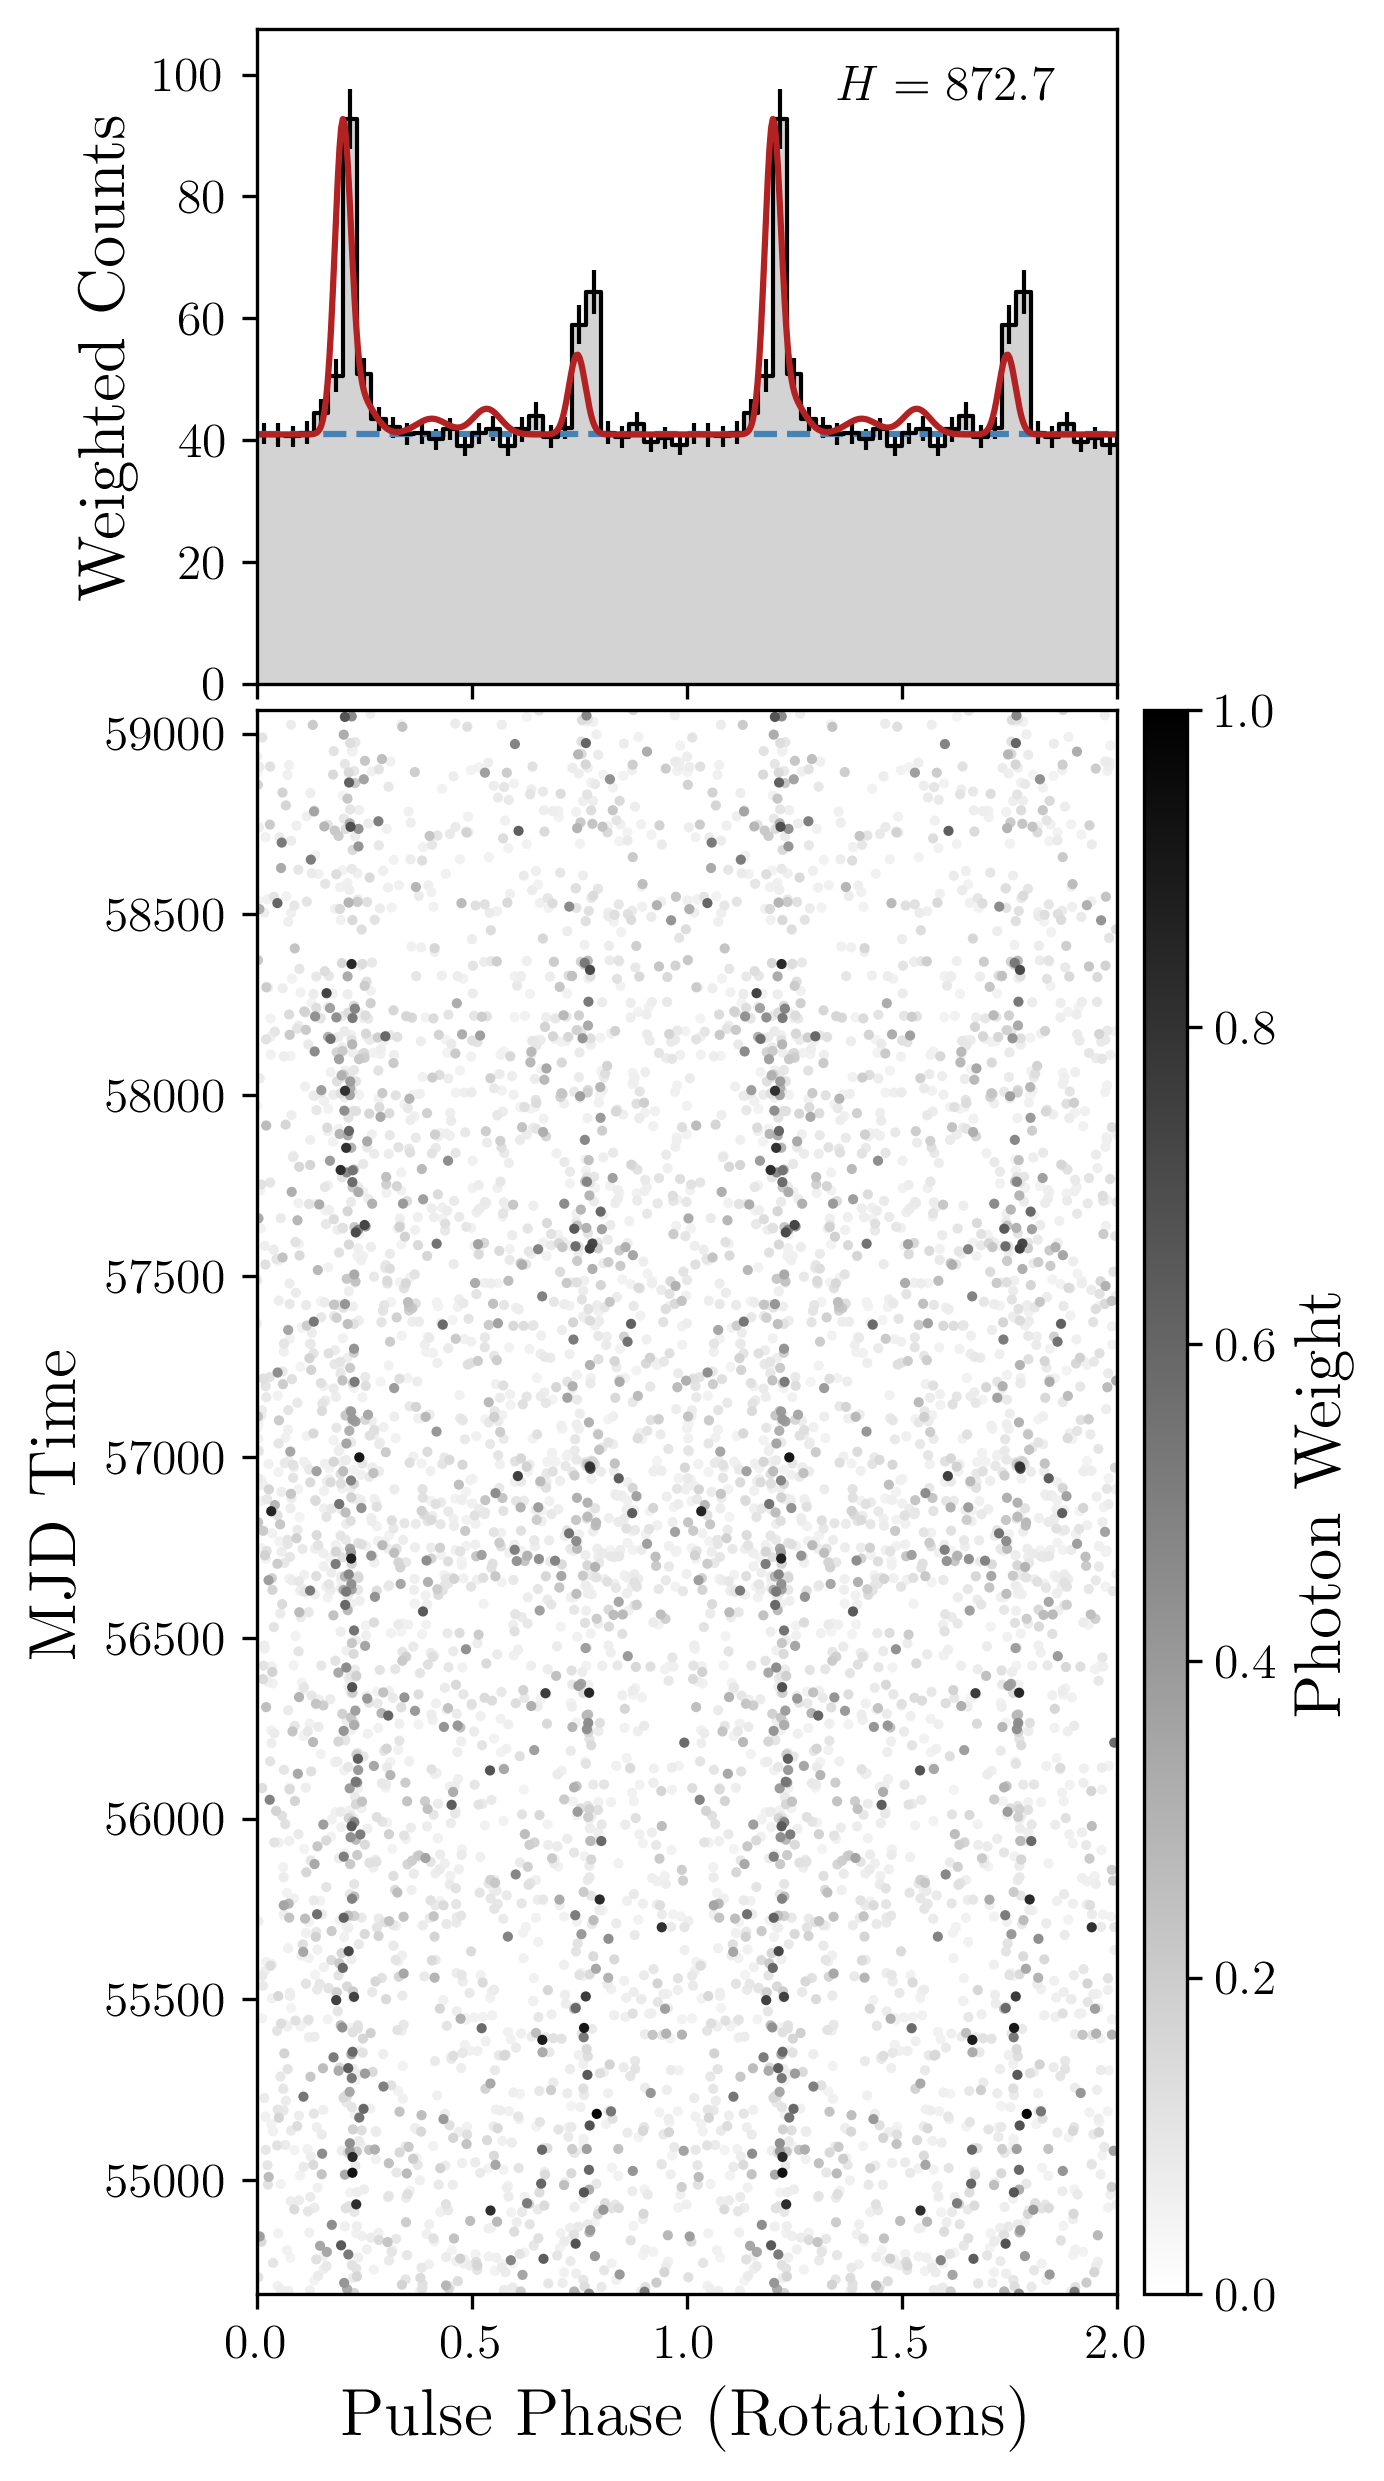
Our full timing solution for the 12-year data set is shown in Table 2 and the gamma-ray phase-time diagram, the gamma-ray pulse profile, and the superposed radio pulse profile are shown in Figure 3. For this final timing analysis, the projected semi-major axis , the epoch of ascending node , and the two Laplace-Lagrangian parameters and , where is the longitude of periastron, were kept fixed to the values from the radio timing analysis (see Section 3).
| Parameter | Value |
|---|---|
| Span of timing data (MJD) | – |
| Reference epoch (MJD) | |
| Timing Parameters | |
| R.A. (J2000.0) | |
| Decl. (J2000.0) | |
| Spin frequency, (Hz) | |
| 1st spin-frequency derivative, (Hz s-1) | |
| 2nd spin-frequency derivative, (Hz s-2) | |
| 3rd spin-frequency derivative, (Hz s-3) | |
| 4th spin-frequency derivative, (Hz s-4) | |
| 5th spin-frequency derivative, (Hz s-5) | |
| Orbital period, (day) | |
| Projected semi-major axisa, (lt-s) | |
| Epoch of ascending nodea, (MJD) | |
| 1st Laplace-Lagrangian parametera, | |
| 2nd Laplace-Lagrangian parametera, | |
| Derived Propertiesb | |
| Spin period, (ms) | |
| 1st spin-period derivative, (s s-1) | |
| Galactic longitude () | |
| Galactic latitude () | |
| Characteristic age, (Gyr) | |
| Spin-down power, (erg s-1) | |
| Surface dipole magnetic field, (G) | |
| Light-cylinder magnetic field, (G) | |
Note. — Numbers in parentheses are statistical uncertainties on the final digits. The JPL DE405 solar system ephemeris has been used and times refer to TDB (using TT = TAI s). The timing solution was obtained using the 12-yr Fermi-LAT data set described in Section 4.3
a Parameter fixed to radio timing solution, see Section 3.
b Not corrected for Shklovskii and Galactic acceleration effects due to highly uncertain distance measurement. However, the non-detection of proper motion suggests that these estimates should be accurate to a few percent.
5 NICER X-ray Pulsation Search
Although the distance inferred from the dispersion measure is large (see Section 7), PSR J15552908 is one of the 10 fastest MSPs in the Galactic field (i.e., outside of a globular cluster), and the LAT timing indicates that the spin down power is very high, at erg s-1. This makes it a good candidate to search for X-ray pulsations, as other high MSPs (e.g. B1937+21, B182124, and J0218+4232) exhibit bright non-thermal pulsations.
Motivated by this, we made a 122 ks observation of this source with the NICER X-ray telescope (NICER proposal #2527), with data accumulated from 2019 May 26 (ObsID 2527010101) through 2019 September 9 (ObsID 2527010142). Ray et al. (2019) provide a description of the NICER X-ray Timing Instrument and details of the data reduction for millisecond pulsar pulsation searches. We follow a similar procedure here, but since these data were taken with a large angle between the target and the Sun, optical loading was not a significant problem, so we did not mask any of the 52 active detectors. We analyzed our data with HEASoft version 6.27.2 (NICER tools version 2020-04-23_V007a) and updated the gain calibration to version nixtiflightpi20170601v006. Our initial data extraction included energies 0.25–10.0 keV, and made standard data cuts to exclude the SAA and ensure NICER was tracking the source and the source was above the Earth limb. We made no cuts on magnetic cutoff rigidity, or the total count rate, in our initial extraction. This initial extraction yielded 117.8 ks of good time. For each photon, we computed the pulse phase using photonphase from PINT (Luo et al., 2021) and the timing model provided in Table 2.
To exclude high background regions, instead of making an arbitrary cut on count rate, we developed a tool ni_Htest_sortgti.py that divides the data into segments of no more than 100 s (and no less than 10 s). These segments are sorted by mean count rate. Since the count rate from the pulsar is very low and presumably constant, this is equivalent to sorting by background rate. Then the -test detection statistic is evaluated cumulatively, going from the lowest background to the highest. This algorithm thus finds the optimal background rate cut that maximizes the S/N of any detected signal. The script repeats this process over a large grid of and energy cuts to search for an optimal energy band as well. For our detection statistic, we chose to use the -test (de Jager et al., 1989), which is preferred to the test for unknown pulse profiles that may be very sharp, as is seen in the non-thermal X-ray MSPs.
For PSR J15552908, this procedure did not reveal any very strong candidate pulsation. The highest -test found corresponded to a single-trial significance of 3.05 , when searching the range 0.26–2.74 keV, with the algorithm selecting the lowest background 106.7 ks out of the total. In those data, the mean count rate was 0.80 s-1. Since there were a large number of trials over the energy and background cuts, this does not represent a significant detection.
In the 0.25–2.0 keV band, the median count rate (source+background) was 0.75 s-1, with 90% of segments below 1.13 s-1. In the 2–8 keV band, the median count rate (source+background) was 0.23 s-1, with 90% of segments s-1.
6 Optical Counterpart
We performed differential time-series photometry at the position of PSR J15552908 using the 2.4-m Hiltner telescope of the MDM Observatory on 2018 June 12 and 15. A back-illuminated SITe CCD with pixels, each subtending , was exposed through an SDSS filter. Integrations of 5 minutes each were obtained for a total of 7.16 hours over the two nights. The differential photometry was calibrated using a comparison star from Pan-STARRS. A variable star with a maximum brightness of and displaying a typical heating-dominated light curve was detected at the image-based radio position (Section 2), also consistent with the Gaia counterpart position and magnitude (Section 4.2) and the gamma-ray timing position (Table 2). A finding chart is shown in Figure 4.
It was immediately apparent that the timescale and pattern of variability are consistent with orbital modulation of a low-mass companion star heated by the pulsar wind. The phased light curve using the orbital ephemeris of Table 2 is shown in Figure 5. As expected, the peak brightness occurs near phase 0.75, superior conjunction of the companion, where we are viewing the heated side of the star. The “night” side of the companion was not detected; only upper limits of were obtained at phases .


7 Discussion
The radio discovery of PSR J15552908 continues the trend of successfully finding radio pulsations from MSPs by targeting LAT sources. It also demonstrates the power of using imaging radio surveys to discover steep-spectrum point sources associated with LAT sources. These are prime pulsar candidates.
The pulsar discovery provides some constraints on the distance to the source. The dispersion measure of 75.9 pc cm-3 gives distance estimates of 2.65 kpc for the NE2001 electron density model (Cordes & Lazio, 2002) and 7.55 kpc for the YMW16 model (Yao et al., 2017). The difference of the two estimates can be traced to the properties of the thick disk component in the electron density models. The DM at high Galactic latitude is dominated by the thick disk, which in the YMW16 model has a smaller central density and a larger scale height than in the NE2001 model, and an integrated column density that is slightly more than half that of NE2001. High-latitude pulsars are thus assigned a larger DM distance in YMW16. PSR J15552908 is at Galactic coordinates , and has the largest DM of neighboring pulsars within a radius. This pushes it to a large, albeit uncertain distance in YMW16.
From our flux-calibrated observations with the Lovell telescope, we estimated an L-band pulsed flux density of mJy. Comparing this to the imaging flux density measured at 150 MHz by Frail et al. (2018) of mJy, and assuming a simple power-law spectrum , yields a two-point spectral index estimate of , confirming the steep spectrum.
PSR J15552908 is a fast and energetic pulsar, currently the 13th fastest galactic MSP in the ATNF Pulsar Catalogue. The small upper limit on the measured proper motion of 6.4 mas yr-1 sets an upper limit on the Shklovskii correction to the spindown rate of at most 3%. The larger of the two DM distance estimates gives an intrinsic spindown luminosity of erg s-1. This can be compared with the measured gamma-ray luminosity. The associated LAT source in the 4FGL DR3 catalog is 4FGL J1555.72908 with an energy flux above 100 MeV (G100) of erg cm-2 s-1. This corresponds to an efficiency of converting spindown energy into MeV gamma-rays of 1.3% for kpc and 11% for kpc. These are both plausible values for gamma-ray MSPs (see Abdo et al., 2013). Alternatively, Abdo et al. (2013) define a rough heuristic relationship erg s-1, which gives an expected gamma-ray luminosity of erg s-1. This implies a distance of 5.7 kpc, but with substantial uncertainty based on the observed scatter around that relationship.
The X-ray pulsation upper limits can be compared to the population of gamma-ray millisecond pulsars whose properties are compiled in Abdo et al. (2013). The ratio of MeV gamma-ray flux () to non-thermal X-ray flux (; unabsorbed 0.3–10 keV) ranges over at least 2 orders of magnitude, from to over several thousand. If PSR J15552908 is like the energetic MSP PSR B1937+21 (essentially the most optimistic case), which has a , then could be as high as erg s-1. Assuming cm-2 scaled from the DM per He et al. (2013) and a power-law index of 2.0, yields a NICER count rate of 0.044 s-1. The detectability of pulsations depends on the unknown pulse shape (ranging from the worst case of a pure sinusoid to a very narrow, low duty cycle pulse), but we can estimate the detection significance using the method of Buccheri et al. (1987). For this flux, we should have detected these pulsations if the source pulsed fraction was larger than 75% (for a sinusoid) or 40% (for a narrow pulse). For less favorable gamma-ray to X-ray flux ratios, e.g. with predicted count rates s-1, our observation would not have detected pulsations even with very narrow pulse shapes. Consequently, the X-ray observation is not sensitive enough to place very stringent constraints on the X-ray luminosity, but could have detected pulsations if this pulsar had an X-ray luminosity and pulse shape similar to PSR B1937+21.
In long term timing of millisecond pulsars, for example with pulsar timing arrays like NANOGrav, it is very unusual for frequency derivatives above to be significantly detected. One notable counterexample is PSR J10240719, which has a significantly detected second spin frequency derivative (Kaplan et al., 2016; Bassa et al., 2016b), ascribed to a long period orbit. A discussion of the measured timing noise and the possibility of PSR J15552908 being in a triple system with a long period outer orbit will be presented in Nieder et al. (2021, in prep.).
Another unusual trait of this MSP is the aligned radio and gamma-ray peaks, with similar morphology. These MSPs, dubbed Type A (for “aligned”) by Espinoza et al. (2013) or Class II by Johnson et al. (2014), account for only a few percent of the known gamma-ray MSPs in the Fermi Third Pulsar Catalog (3PC, in prep). This subset of MSPs are generally highly energetic, but the strongest correlation seems to be with the inferred magnetic field at the light cylinder (; Espinoza et al. 2013). In the radio band they also generally have steeper spectra and lower levels of linear polarization than the general MSP population, and several are known to emit giant pulses. PSR J15552908 follows this trend, with its high , very large , and steep (; Frail et al. 2018) radio spectral index; however, we do not see evidence for giant pulses in the long 820 MHz GBT observation. Unfortunately, an instrumental issue with the GUPPI backend prevented us from making a measurement of the linear polarization fraction. The most successful models for these pulsars invoke co-located radio and gamma-ray emission regions in the outer magnetosphere, such as altitude-limited Two Pole Caustic models (alTPC; Johnson et al. 2014).
As has been the case for many of the MSPs discovered in searches of LAT sources, this pulsar is in an interacting binary system. The orbital solution gives a minimum companion mass of , for an assumed neutron star mass of 1.4 . The very low mass companion [much lower than the white dwarf mass predicted by Tauris & Savonije (1999) of 0.17 ] and radio eclipses put it in the black widow class. As shown in Figure 6, the minimum companion mass is relatively large for MSPs in this orbital period range, which tend to have minimum companion masses of 0.02–0.03 , but the eclipse around phase 0.25 indicates that the system is nearly edge-on, so the true companion mass is close to the minimum value. The eclipse spans of the orbit, which is twice the width of the companion’s Roche lobe (see below) in an edge-on system, consistent with absorption by an evaporated wind. The measured eccentricity is very low, but in family for black widow type systems.

Our optical observations confirm that the optical source detected by Gaia is the heated companion star to PSR J15552908. The amplitude of the modulation, likely more than 4 magnitudes from maximum to the non-detection at minimum, is among the largest seen in black widow companions (e.g., Breton et al., 2013; Draghis et al., 2019), which is consistent with heating being powered by the unusually high spin-down power. With a light curve in only one filter, and incomplete detection around the orbit, it is not possible to constrain a detailed model of the system geometry and irradiation of the companion star by the pulsar wind. Instead, we make a back-of-the-envelope calculation to check whether the peak observed flux of the companion is consistent with heating supplied by the spin-down power of the pulsar, and see if this constrains the temperature of the heated side of the companion. For an assumed isotropic pulsar wind and a Roche-lobe filling companion, the maximum irradiating power can be approximated as , where is the radius of the Roche lobe of the companion, is the orbital separation, is the heating efficiency, and erg s-1 for PSR J15552908. Assuming masses of and , the ratio according to Eggleton (1983). The maximum irradiating power is then erg s-1.
In order to compare this to the observed optical flux at orbital phase 0.75, we assume an orbital inclination of , which is justified by the radio eclipses and the large amplitude of optical modulation around the orbit. We also correct the observed for , the maximum extinction along the line of sight (Schlafly & Finkbeiner, 2011). Converting magnitude to flux density using erg cm-2 s-1 Å-1 (Fukugita et al., 1995), the absorption-corrected flux density at Å is erg cm-2 s-1 Å-1. For the DM distance we assume either 2.65 kpc or 7.55 kpc according to the two models of the electron density distribution referenced above.
At kpc, we find that the temperature of the heated half of the star is required to be K in order for the star to fit within its Roche lobe. At K, the efficiency would be . For higher temperature the heated area would decrease, allowing the star to partially fill its Roche lobe, and the efficiency would increase modestly. Assuming instead that kpc, the hot side must have K to fit within the Roche-lobe, but the efficiency becomes . Any temperature above 14,000 K would require . Thus, the range of plausible models would be much more limited at the larger distance.
We have additionally obtained 12 hr of simultaneous photometric observations in the , and bands with the high-speed multi-band imager ULTRACAM on the 3.6m New Technology Telescope at ESO La Silla, as well as 0.65 orbits of optical spectroscopy, covering the optical maximum, with X-SHOOTER on ESO’s Very Large Telescope. These observations and their modelling will be presented in Kennedy et al. (2021, in prep.).
References
- Abdo et al. (2009a) Abdo, A. A., Ackermann, M., Ajello, M., et al. 2009a, Science, 325, 848, doi: 10.1126/science.1176113
- Abdo et al. (2009b) —. 2009b, Science, 325, 840, doi: 10.1126/science.1175558
- Abdo et al. (2013) Abdo, A. A., Ajello, M., Allafort, A., et al. 2013, ApJS, 208, 17, doi: 10.1088/0067-0049/208/2/17
- Abdollahi et al. (2020) Abdollahi, S., Acero, F., Ackermann, M., et al. 2020, ApJS, 247, 33, doi: 10.3847/1538-4365/ab6bcb
- Astropy Collaboration et al. (2018) Astropy Collaboration, Price-Whelan, A. M., Sipőcz, B. M., et al. 2018, AJ, 156, 123, doi: 10.3847/1538-3881/aabc4f
- Atwood et al. (2012) Atwood, W., Albert, A., Baldini, L., et al. 2012, in Proceedings of the 4th Fermi Symposium, ed. T. J. Brandt, N. Omodei, & C. Wilson-Hodge, eConf C121028, 8
- Atwood et al. (2009) Atwood, W. B., Abdo, A. A., Ackermann, M., et al. 2009, ApJ, 697, 1071, doi: 10.1088/0004-637X/697/2/1071
- Balasubramanian et al. (1996) Balasubramanian, R., Sathyaprakash, B. S., & Dhurandhar, S. V. 1996, Phys. Rev. D, 53, 3033, doi: 10.1103/PhysRevD.53.3033
- Ballet et al. (2020) Ballet, J., Burnett, T. H., Digel, S. W., & Lott, B. 2020, arXiv e-prints, arXiv:2005.11208. https://arxiv.org/abs/2005.11208
- Bassa et al. (2016a) Bassa, C. G., Janssen, G. H., Karuppusamy, R., et al. 2016a, MNRAS, 456, 2196, doi: 10.1093/mnras/stv2755
- Bassa et al. (2016b) Bassa, C. G., Janssen, G. H., Stappers, B. W., et al. 2016b, MNRAS, 460, 2207, doi: 10.1093/mnras/stw1134
- Bhattacharyya et al. (2013) Bhattacharyya, B., Roy, J., Ray, P. S., et al. 2013, ApJ, 773, L12, doi: 10.1088/2041-8205/773/1/L12
- Bock et al. (1999) Bock, D. C.-J., Large, M. I., & Sadler, E. M. 1999, AJ, 117, 1578, doi: 10.1086/300786
- Breton et al. (2013) Breton, R. P., van Kerkwijk, M. H., Roberts, M. S. E., et al. 2013, ApJ, 769, 108, doi: 10.1088/0004-637X/769/2/108
- Bruel (2019) Bruel, P. 2019, A&A, 622, A108, doi: 10.1051/0004-6361/201834555
- Bruel et al. (2018) Bruel, P., Burnett, T. H., Digel, S. W., et al. 2018, arXiv e-prints, arXiv:1810.11394. https://arxiv.org/abs/1810.11394
- Buccheri et al. (1987) Buccheri, R., Sacco, B., & Ozel, M. E. 1987, A&A, 175, 353
- Camilo et al. (2015) Camilo, F., Kerr, M., Ray, P. S., et al. 2015, ApJ, 810, 85, doi: 10.1088/0004-637X/810/2/85
- Clark et al. (2017) Clark, C. J., Wu, J., Pletsch, H. J., et al. 2017, ApJ, 834, 106, doi: 10.3847/1538-4357/834/2/106
- Cognard et al. (2011) Cognard, I., Guillemot, L., Johnson, T. J., et al. 2011, ApJ, 732, 47, doi: 10.1088/0004-637X/732/1/47
- Condon et al. (1998) Condon, J. J., Cotton, W. D., Greisen, E. W., et al. 1998, AJ, 115, 1693, doi: 10.1086/300337
- Cordes & Lazio (2002) Cordes, J. M., & Lazio, T. J. W. 2002. https://arxiv.org/abs/astro-ph/0207156
- Cromartie et al. (2016) Cromartie, H. T., Camilo, F., Kerr, M., et al. 2016, ApJ, 819, 34, doi: 10.3847/0004-637X/819/1/34
- de Jager et al. (1989) de Jager, O. C., Raubenheimer, B. C., & Swanepoel, J. W. H. 1989, A&A, 221, 180
- Draghis et al. (2019) Draghis, P., Romani, R. W., Filippenko, A. V., et al. 2019, ApJ, 883, 108, doi: 10.3847/1538-4357/ab378b
- Eggleton (1983) Eggleton, P. P. 1983, ApJ, 268, 368, doi: 10.1086/160960
- Espinoza et al. (2013) Espinoza, C. M., Guillemot, L., Çelik, Ö., et al. 2013, MNRAS, 430, 571, doi: 10.1093/mnras/sts657
- Frail et al. (2016) Frail, D. A., Mooley, K. P., Jagannathan, P., & Intema, H. T. 2016, MNRAS, 461, 1062, doi: 10.1093/mnras/stw1390
- Frail et al. (2018) Frail, D. A., Ray, P. S., Mooley, K. P., et al. 2018, MNRAS, 475, 942, doi: 10.1093/mnras/stx3281
- Fukugita et al. (1995) Fukugita, M., Shimasaku, K., & Ichikawa, T. 1995, PASP, 107, 945, doi: 10.1086/133643
- Gaia Collaboration et al. (2021) Gaia Collaboration, Brown, A. G. A., Vallenari, A., et al. 2021, A&A, 649, A1, doi: 10.1051/0004-6361/202039657
- He et al. (2013) He, C., Ng, C. Y., & Kaspi, V. M. 2013, ApJ, 768, 64, doi: 10.1088/0004-637X/768/1/64
- Intema et al. (2017) Intema, H. T., Jagannathan, P., Mooley, K. P., & Frail, D. A. 2017, A&A, 598, A78, doi: 10.1051/0004-6361/201628536
- Johnson et al. (2014) Johnson, T. J., Venter, C., Harding, A. K., et al. 2014, ApJS, 213, 6, doi: 10.1088/0067-0049/213/1/6
- Kaplan et al. (2016) Kaplan, D. L., Kupfer, T., Nice, D. J., et al. 2016, ApJ, 826, 86, doi: 10.3847/0004-637X/826/1/86
- Kerr (2011) Kerr, M. 2011, ApJ, 732, 38, doi: 10.1088/0004-637X/732/1/38
- Kerr et al. (2015) Kerr, M., Ray, P. S., Johnston, S., Shannon, R. M., & Camilo, F. 2015, ApJ, 814, 128, doi: 10.1088/0004-637X/814/2/128
- Kerr et al. (2012) Kerr, M., Camilo, F., Johnson, T. J., et al. 2012, ApJ, 748, L2, doi: 10.1088/2041-8205/748/1/L2
- Luo et al. (2021) Luo, J., Ransom, S., Demorest, P., et al. 2021, ApJ, 911, 45, doi: 10.3847/1538-4357/abe62f
- Manchester et al. (2005) Manchester, R. N., Hobbs, G. B., Teoh, A., & Hobbs, M. 2005, AJ, 129, 1993, doi: 10.1086/428488
- Nieder et al. (2020) Nieder, L., Allen, B., Clark, C. J., & Pletsch, H. J. 2020, ApJ, 901, 156, doi: 10.3847/1538-4357/abaf53
- Nieder et al. (2019) Nieder, L., Clark, C. J., Bassa, C. G., et al. 2019, ApJ, 883, 42, doi: 10.3847/1538-4357/ab357e
- Owen (1996) Owen, B. J. 1996, Phys. Rev. D, 53, 6749, doi: 10.1103/PhysRevD.53.6749
- Pletsch & Clark (2014) Pletsch, H. J., & Clark, C. J. 2014, ApJ, 795, 75, doi: 10.1088/0004-637X/795/1/75
- Ransom et al. (2002) Ransom, S. M., Eikenberry, S. S., & Middleditch, J. 2002, AJ, 124, 1788, doi: 10.1086/342285
- Ransom et al. (2011) Ransom, S. M., Ray, P. S., Camilo, F., et al. 2011, ApJ, 727, L16, doi: 10.1088/2041-8205/727/1/L16
- Ray et al. (2011) Ray, P. S., Kerr, M., Parent, D., et al. 2011, ApJS, 194, 17, doi: 10.1088/0067-0049/194/2/17
- Ray et al. (2012) Ray, P. S., Abdo, A. A., Parent, D., et al. 2012, in 2011 Fermi Symposium proceedings - eConf C110509, arXiv:1205.3089. https://arxiv.org/abs/1205.3089
- Ray et al. (2013) Ray, P. S., Ransom, S. M., Cheung, C. C., et al. 2013, ApJ, 763, L13, doi: 10.1088/2041-8205/763/1/L13
- Ray et al. (2019) Ray, P. S., Guillot, S., Ransom, S. M., et al. 2019, ApJ, 878, L22, doi: 10.3847/2041-8213/ab2539
- Schlafly & Finkbeiner (2011) Schlafly, E. F., & Finkbeiner, D. P. 2011, ApJ, 737, 103, doi: 10.1088/0004-637X/737/2/103
- Schwarz (1978) Schwarz, G. 1978, Annals of Statistics, 6, 461
- Stovall et al. (2014) Stovall, K., Lynch, R. S., Ransom, S. M., et al. 2014, ApJ, 791, 67, doi: 10.1088/0004-637X/791/1/67
- Strader et al. (2019) Strader, J., Swihart, S., Chomiuk, L., et al. 2019, ApJ, 872, 42, doi: 10.3847/1538-4357/aafbaa
- Tauris & Savonije (1999) Tauris, T. M., & Savonije, G. J. 1999, A&A, 350, 928. https://arxiv.org/abs/astro-ph/9909147
- van Straten & Bailes (2011) van Straten, W., & Bailes, M. 2011, PASA, 28, 1, doi: 10.1071/AS10021
- Yao et al. (2017) Yao, J. M., Manchester, R. N., & Wang, N. 2017, ApJ, 835, 29, doi: 10.3847/1538-4357/835/1/29