Direction Finding in Partly Calibrated Arrays Exploiting the Whole Array Aperture
Abstract
We consider the problem of direction finding using partly calibrated arrays, a distributed subarray with position errors between subarrays. The key challenge is to enhance angular resolution in the presence of position errors. To achieve this goal, existing algorithms, such as subspace separation and sparse recovery, have to rely on multiple snapshots, which increases the burden of data transmission and the processing delay. Therefore, we aim to enhance angular resolution using only a single snapshot. To this end, we exploit the orthogonality of the signals of partly calibrated arrays. Particularly, we transform the signal model into a special multiple-measurement model, show that there is approximate orthogonality between the source signals in this model, and then use blind source separation to exploit the orthogonality. Simulation and experiment results both verify that our proposed algorithm achieves high angular resolution as distributed arrays without position errors, inversely proportional to the whole array aperture.
Index Terms:
Partly calibrated array, high angular resolution, orthogonality, blind source separation.I Introduction
Direction finding using antenna arrays plays a fundamental role in various fields of signal processing such as radar, sonar, and astronomy [1]. High angular resolution is a key objective in these fields, and requires a large array aperture [2]. However, a large aperture usually means high system complexity, poor mobility, and high cost.
A promising alternative to a single large-aperture array is to partition the whole array into distributed subarrays, and fuse their measurements in a coherent way in order to achieve the same angular resolution as the whole array [3, 4, 5, 6, 7, 8]. A premise of coherently fusing the measurements from subarrays is the accurate position of each array element. Positions of array elements within a subarray are easy to obtain, however there are generally inevitable position errors between subarrays, resulting in challenges to perform coherent signal processing and achieve high angular resolution [9]. For fixed ground-based platforms, these position errors could be calibrated offline. For example, black hole imaging uses atomic clocks to precisely calibrate the position errors between subarrays, and synthesizes a large aperture close to the earth diameter [10]. In this case, the synthetic array, with both intra- and inter- subarray well calibrated, is referred to as a fully calibrated array. However, in mobile platforms such as unmanned aerial vehicles (UAV), the movement of the platform makes it hard to have accurate subarray positions in real time. Such a distributed array is often referred to as partly calibrated array [9], with the intra-subarray elements well calibrated but not the inter-subarray elements. Estimating the directions of arrival (DoA) of radiating sources with a partly calibrated array has received wide attention recently [11, 12, 13], and is the focus of this paper.
Early approaches for partly calibrated arrays first estimate the directions with each subarray separately, and then fuse the estimates to improve accuracy [14, 15, 16]. Since signals from different subarrays are not coherently processed, the angular resolution is limited to each single subarray instead of the synthesized aperture.
More advanced algorithms jointly process received signals of all the subarrays. These techniques can be divided into two categories: correlation domain and direct data domain algorithms. Correlation domain techniques first calculate the covariance matrix of the received signals, separate the signal and noise subspaces from the covariance matrix, and use the subspaces to indicate the DoAs. These subspace algorithms [17, 18, 19, 20] are shown to exploit the whole array aperture and achieve high angular resolution. However, correlation domain approaches require a large number of snapshots to accurately estimate the covariance matrix and usually assume that the radiating sources are independent, which may not be satisfied in practice. Moreover, many snapshots increase the burden of data transmission and the processing delay, which has a significant impact on system performance. Particularly in mobile and time-varying scenarios [21], the scenario changes rapidly during long-time observations, which leads to model mismatch and performance loss. Hence, it is of significance to achieve high angular resolution with fewer snapshots, even a single snapshot. However, few snapshots are not typically sufficient to estimate the covariance matrix correctly.
Direct data domain algorithms are often preferred compared to correlation domain algorithms. This is because direct data domain algorithms directly estimate the DoAs by exploiting some prior information on the sources instead of their statistical properties learned from the received signals. Among these techniques, sparse recovery approaches have attracted interest in recent years [22, 11]. These algorithms exploit the sparsity of sources and estimate DoAs by solving a block- and rank-sparse optimization problem. They have tractable complexity and are shown to be less sensitive than correlation domain techniques to few snapshots and correlated sources. However, they have poor performance in the single-snapshot case [11].
To achieve high-resolution direction finding in partly calibrated arrays with only a single snapshot, we propose to transform the signal model into a multiple-measurement model [23, 24], where each measurement corresponds to the single-snapshot data of a subarray. In this way, we encode the high-resolution capability into the phase relationship between the measurements. We then show that there is approximate orthogonality between the measurements of different sources. By exploiting the orthogonality, the phase offsets between subarrays are recovered to enhance angular resolution.
We use a blind source separation (BSS) [25] algorithm called Joint Approximate Diagonalization of Eigen-matrices (JADE) [26] to exploit the orthogonality in our scenarios. BSS is a typical tool that makes use of signal characteristics (independence) between measurements in multiple-measurement models. Based on BSS ideas, our study illustrates that the cost function of JADE can well characterize the signal characteristics (orthogonality) between the measurements of sources in partly calibrated arrays. We thus apply JADE to exploit the orthogonality, and then use the output of JADE for phase offset recovery between subarrays, which leads to direction finding with high angular resolution. Not only the simulation, but also experiment results verify that our proposed algorithm achieves high angular resolution, inversely proportional to the whole array aperture, with only a single snapshot.
The rest of this paper is organized as follows: Section II introduces the signal model of partly calibrated arrays, and shows how to transform it into a multiple-measurement model. Section III illustrates that there is approximate orthogonality between the source signals in partly calibrated arrays. The proposed direction-finding algorithm exploiting the orthogonality is detailed in Section IV. We discuss the relationship between the orthogonality and angular resolution in Section V. Numerical simulation and experimental results are presented in Section VI, followed by a conclusion in Section VII.
Notation: We use and to denote the sets of real and complex numbers, respectively. Uppercase boldface letters denote matrices (e.g. ) and lowercase boldface letters denote vectors (e.g. ). The -th element of a matrix is denoted by , and the -th column is represented by . We use to indicate the trace of a matrix and to represent a matrix with diagonal elements given by . The conjugate, transpose, and conjugate transpose operators are denoted by , respectively. The amplitude of a scalar, the norm of a vector and the Frobenius norm of a matrix are represented by , and , respectively. We use for matrix vectorization. The Hadamard product is written as , and is the definition symbol. We denote the imaginary unit for complex numbers by .
II Signal model
In this section, we first introduce the signals of the partly calibrated model in Subsection II-A. For comparison, we introduce the signals of fully calibrated arrays and discuss angular resolution in Subsection II-B. Next, we transform the single-snapshot signals of partly calibrated arrays into a multiple-measurement model in Subsection II-C. Finally, we explain the challenges and motivation of recovering directions with high angular resolution from this multiple-measurement model in Subsection II-D.
II-A Partly calibrated model
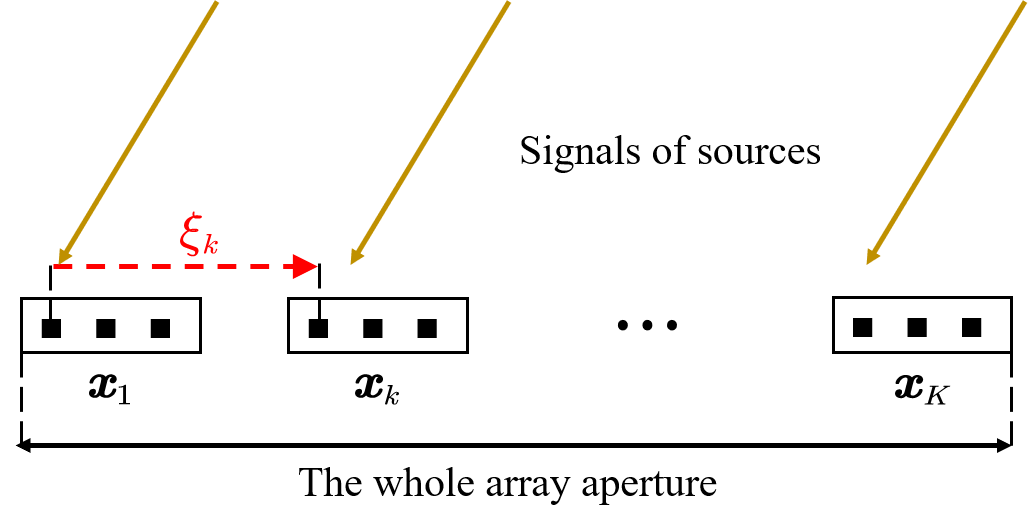
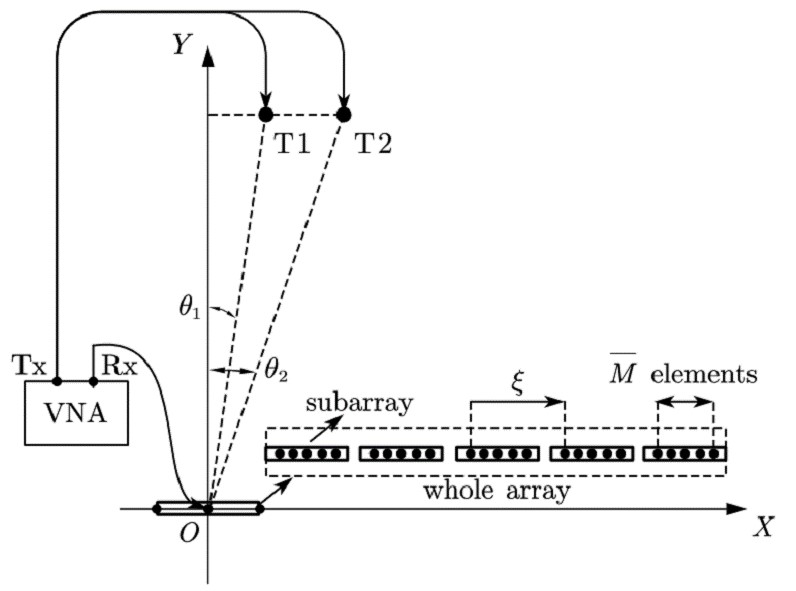
Consider isotropic linear antenna subarrays, each composed of sensors for , where . We construct a planar Cartesian coordinate system, where the array is on the x-axis. For these subarrays, the partly calibrated model assumes the precisely known intra-subarray displacement and unknown inter-subarray displacement. Particularly, denote by the unknown inter-subarray displacement of the first (reference) sensor in the -th subarray relative to the the first sensor in the 1-st subarray for , thus, . We use to represent the inter-subarray displacement vector. Denote by the known intra-subarray displacement of the -th sensor relative to the 1-st sensor in the -th subarray for , thus, . Assume that the sensors share a common sampling clock, or the clocks have been synchronized exactly. We illustrate the partly calibrated model in Fig. 1.
There are far-field [27], closely spaced emitters impinging narrow-band signals onto the whole array from different directions . Denote the direction vector by . In general cases, we assume or . The steering vector of the -th subarray corresponding to an emitter at direction is given by
| (1) |
where is an unknown phase offset between the -th and the 1-st subarray, denotes the wavelength of the transmitted signals by emitters and the vector is defined by
| (2) |
Here is a known function of in contrast to the unknown phase offset for .
In this paper, we assume that only a single snapshot is available and all the subarrays sample at the same time. Therefore, the signal received by the -th subarray is a summation of signals transmitted by the emitters, given by
| (3) |
where represents an unknown complex coefficient and represents noise for . By substituting (1) into (3), we rewrite the received signals (3) as
| (4) |
II-B Fully calibrated model
The fully calibrated arrays assume that in (4) is exactly known or well calibrated. By substituting (2) and to (4), we have
| (5) |
where for and . Denote , and . We then stack the signals in (5) together as
| (6) |
which is a typical single-snapshot signal model. In (6), and are known and the unknowns in are only . Direction finding is to estimate given , which can be achieved by existing classical algorithms such as Multiple Signal Classification (MUSIC) [28] and compressed sensing (CS) [29].
Direction finding by fully calibrated arrays can achieve high angular resolution, inversely proportional to the whole array aperture. This is because the fully calibrated model assumes completely known and the received signals are recast as (6). In this case, the subarrays can be regarded as sparsely distributed array elements in a single array with a large aperture, where the array manifold is denoted by in (6). In this single array, the positions of array elements are in the range from to , yielding the whole array aperture. Therefore, the angular resolution of (6) is inversely proportional to the whole array aperture [2].
II-C Transform into a multiple-measurement model
However, for the partly calibrated model, an accurate array manifold is not available due to the unknown , which makes it hard to synthesize the subarrays into a single large-aperture array. The unknown introduces unknown phase errors , which are related to both subarrays and sources, to the signal model. Particularly, define and for . We then rewrite (4) as
| (7) |
where denotes the unknown phase error w.r.t. . Compared with (5), the unknown in (7) makes high-resolution direction finding a challenging problem in single-snapshot cases [11]. For brevity, we denote and by and , respectively.
There is a key question in partly calibrated arrays:
Can partly calibrated subarrays achieve angular resolution comparable to that of fully calibrated subarrays?
The answer is positive. The feasibility lies in the fact that the unknown phase offsets between subarrays, , can be well recovered by self-calibration on . In this paper, we provide an algorithm to achieve high angular resolution performance. We leave the theoretical analysis for future work.
To illustrate our approach, we consider a typical case in partly calibrated arrays, where the intra-subarray displacement of each subarray is the same. In this case, we transform the partly calibrated model into a multiple-measurement model [23, 24]. Particularly, and reduce to the same values for different , and are denoted by and , respectively. We use to represent the intra-subarray displacement vector. The steering matrices become the same for all the subarrays, thus we denote for . We assume that for each subarray, , such that emitters are identifiable [30]. Under these assumptions, is a full column rank matrix. Then, the received signals (7) are reorganized as
| (8) |
where are viewed as the received signals from the -th emitter, sampled times by different subarrays. Denote , and . Then (II-C) is recast as
| (9) |
where is related to , and is related to . In (9), are known, and are unknown. In addition, is assumed to be known by existing algorithms [31, 32, 33]. The recast signal model (9) is a multiple-measurement model, where each row of represents the multiple measurements of the subarrays. Direction finding is to estimate given .
Note that in (9) is constructed by multiple measurements of subarrays instead of multiple time samples as typical multiple-measurement models, and has special signal structure. Particularly, the entries of the -th row of have the same modulus and different phase offsets . In (9), high-resolution capability of partly calibrated arrays is encoded in this special signal structure of , mainly in . The key issue of enhancing angular resolution lies in how to exactly recover by exploiting the signal structure of .
II-D Challenges and motivation
Existing algorithms encounter difficulties in achieving high angular resolution based on (9). This is because is a complex function of and exploiting the signal structure of to recover is not a trivial problem. Particularly, MUSIC algorithms [34, 28] suffer from imprecise subspace structure of signals due to the unknown . Typical sparse recovery algorithms [35] divide the parameter space of into finite grids, construct a over-complete, grid-based dictionary of , and solve a convex lasso [36] problem. However, these algorithms ignore the phase relationship between subarrays and assume to be completely unknown, which corresponds to non-coherent processing which cannot achieve high angular resolution. Therefore, we do not use gridding on (9). To enhance angular resolution, more efficient constraints on are required in the problem formulation. However, it is hard to propose a proper constraint that fully characterizes the signal structure, and the introduction of such constraints increase the difficulty of the solution.
Our goal is to find a way that both makes full use of the signal structure and is tractable to solve. As mentioned above, the key of high angular resolution lies in the exact recovery of , which are the phases of in (9). Therefore, we propose to exploit a specific characteristic of to recover first, and then find the directions based on the phase estimates. The characteristic we consider is approximate orthogonality between the source signals of partly calibrated arrays, which is detailed next.
III Approximate orthogonality between the rows of
In this section, we first analyze the statistics of the sample covariance of , , in Subsection III-A, where denotes the source signals in (9). Then, we show that there is approximate orthogonality between the rows of in partly calibrated arrays in Subsection III-B.
III-A Statistics of
First, we calculate the elements of . By substituting the definitions of , and into , the -th element of , denoted by for abbreviation, is
| (10) |
where for . The diagonal elements of are . We assume that the source intensities are all equal, , in the sequel. Under this assumption, the intensities of the off-diagonal elements rely on the inter-subarray displacements and the directions .
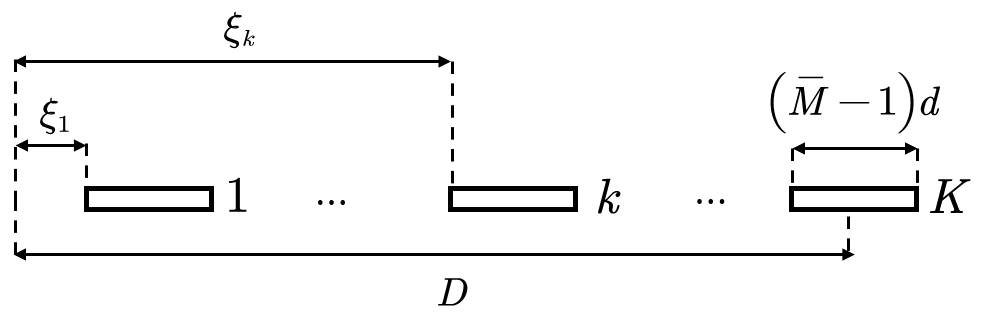
Denote the whole array aperture and the intra-subarray element spacing by and , respectively. To analyze the statistics of , we consider a common practical scenario that the subarrays are randomly, uniformly placed in , i.e., for . The corresponding geometry is shown in Fig. 2.
This typical case leads to the following proposition, a similar analysis can be found in [37].
Proposition 1.
When for , we have
| (11) |
| (12) |
where , and .
Proof.
See Appendix A. ∎
The term plays an important role in (11) and (12). We draw the curve of w.r.t. in Fig. 3, where denotes the empirical angular resolution of the whole array.
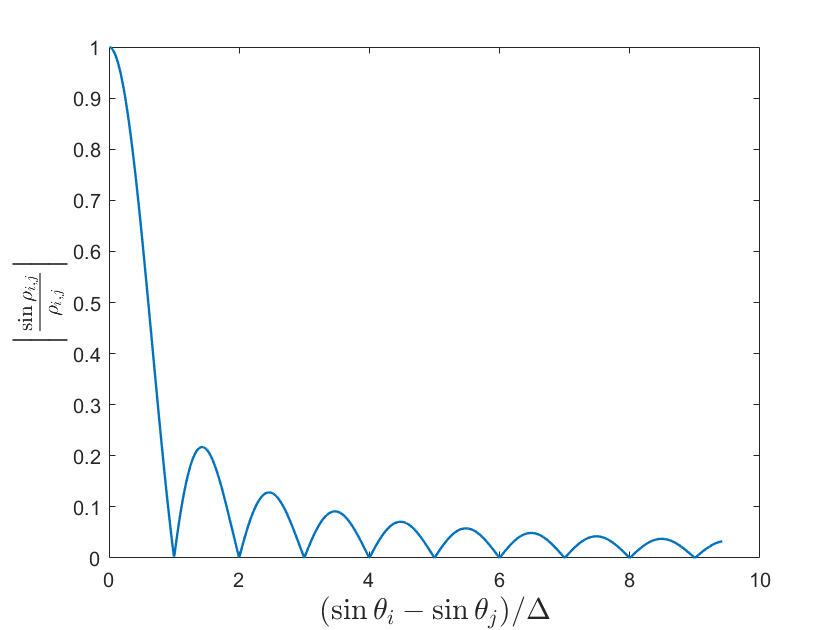
From Fig. 3, we see that the curve is composed of a main lobe and several side lobes. When the interval equals , the intensity reaches its first zero point, which is related to the angular resolution . When the interval is in the region , the distributed array cannot distinguish sources at such close interval and has large values. When the interval belongs to the region , is typically small. In this region, the zero points of occur in a period of and there are side lobes between these zero points.
III-B Approximate orthogonality in
Based on the statistics of , there is approximate orthogonality in partly calibrated arrays. Here, orthogonality is defined as the orthogonality between the rows of in (9). Particularly, we say there is orthogonality in partly calibrated arrays if the off-diagonal elements of are 0, i.e.,
| (13) |
In Proposition 1 and Fig. 3, we show that when the source separation exceeds one resolution cell, the off-diagonal elements of are small relative to the diagonal elements in a statistical sense. In other words, there is approximate orthogonality between the rows of in (9), and
| (14) |
We may also understand the orthogonality in partly calibrated arrays using the concept of coherence [38], given by
| (15) |
where . In partly calibrated arrays, the coherence corresponds to the largest modulus of the off-diagonal elements of . Orthogonality means that and approximate orthogonality means that .
In summary, when the source separation is within a resolution cell, there is no obvious orthogonality between the source signals. When the source separation exceeds a resolution cell, the modulus of the off-diagonal is small in a statistical sense, yielding approximate orthogonality. This phenomenon not only illustrates the orthogonality in partly calibrated arrays, but also builds a connection between orthogonality and angular resolution, which will be discussed in Section V.
IV Joint Approximate Diagonalization
In this section, we introduce our algorithm. First, we propose to use BSS ideas to exploit the orthogonality, and recover the phase offsets between subarrays in Subsection IV-A. Then, based on the estimated phase offsets, beamforming algorithms for direction finding are discussed in Subsection IV-B.
IV-A Phase offset recovery
In (9), when is unknown, how to exploit the orthogonality between the rows of is a challenging problem. Here, we propose a solution to this problem. Particularly, we introduce BSS techniques to the self-calibration problems in distributed arrays. To this end, we first review basic BSS ideas. Then, we show how a specific BSS algorithm exploits the orthogonality of in (9). Finally, we show how we recover the phase offsets between subarrays.
IV-A1 Review of BSS
BSS problems usually consider the following model:
| (16) |
where contains the received signals, is an unknown, full-rank measurement matrix, are the unknown original source signals, are the unknown white noises, , and denote the number of samples, measurements and sources, respectively, and . The purpose of BSS is to recover from with unknown .
In order to make the recovery of possible, BSS usually imposes assumptions on the independence between the original source signals . Under these assumptions, BSS formulates an optimization problem exploiting the independence of to find the linear ‘inverse’ matrix of in (16) as , where yields the recovery of . Note that there are unavoidable ambiguity between and in BSS problems. For example, for any nonzero diagonal matrix , we have . Therefore, without loss of generality, it is typically assumed that the source signal has unit power, , where denotes the continuous signals. More details on BSS can be found in [25].
IV-A2 How BSS exploits the orthogonality
Here we introduce a specific BSS algorithm, called JADE [26], and show how JADE exploits the orthogonality in partly calibrated arrays from its cost function. JADE assumes unknown measurement matrix in (16), which is compatible with the unknown measurement matrix in (9).
The cost function of JADE is given by [26]
| (17) |
where the high-order cumulant is denoted by
| (18) |
and corresponds to in (II-C). Based on the definition of in (III-A), we have
| (19) |
which corresponds to in (IV-A2) for .
The expression of in (17) w.r.t high-order cumulants is complex, however, it can be simplified due to the special signal structure of partly calibrated arrays. Particularly, since in (II-C) has constant modulus , and . Based on the above properties, substituting (19) to (17), we have
| (20) |
where
| (21) |
for . Note that is similar to , and the property of in Proposition 1 when can be directly extended to when .
Based on (IV-A2), we now provide an intuitive explanation to how JADE exploits the orthogonality in partly calibrated arrays. In Proposition 1 and Fig. 3, we illustrate that when the source separation exceeds one resolution cell, we have small in a statistical sense, yielding approximate orthogonality. We extend this property to and have
| (22) |
which means that smaller and yield smaller approximately. When or as assumed, implies . Therefore, when the sources are resolvable (), minimizing is likely to have an optimal result of with . This illustrates that the cost function of JADE is feasible to exploit the orthogonality in partly calibrated arrays. The optimal solution of JADE is not guaranteed to be global from (IV-A2). However, JADE is verified to achieve good performance by simulations in Section VI. This shows the potential of using BSS techniques to enhance angular resolution in partly calibrated arrays.
In most practical scenarios, the orthogonality is approximately satisfied, and the performance of JADE is affected by the level of the approximation. Intuitively speaking, higher level of orthogonality corresponds to a lower cost function of JADE, which likely yields better performance of JADE in phase recovery. This conclusion is verified by simulations in Fig. 4 and Fig. 7 in Section VI. The specific algorithm of JADE is detailed in Appendix C for reference.
IV-A3 Phase offset estimation
We showed how JADE exploits the orthogonality. Next we discuss how to use JADE for phase offset estimation.
To this end, we input the received signals of partly calibrated arrays in (9) to JADE, which outputs an estimate of , denoted by . Due to the unavoidable ambiguity in the recovery of BSS, it is assumed that the source signal has unit power in JADE. However, the estimate usually has fluctuating modulus. Therefore, we normalize and estimate the phase offsets as
| (23) |
for and . In the sequel, we denote .
IV-B Direction finding
When the phase offsets between subarrays is recovered by (23), direction finding reduces to a coherent array signal processing problem: Recover from the following signals,
| (24) |
This problem can be solved by many classical algorithms. In this subsection, we introduce two representative techniques for direction finding.
IV-B1 Matched filtering
We begin with matched filtering (MF) for direction finding. Consider the case, where (24) is simplified as
| (25) |
and the steering vector is denoted by . For (25), the MF algorithm is to find by maximizing the following cost function,
| (26) |
The MF algorithm is directly applicable to the case when . Particularly, directions are estimated as
| (27) |
for . The optimization problem (27) can be directly solved by conducting individual one-dimensional searches on the direction range .
IV-B2 Nonlinear least squares
Here, we introduce the nonlinear least squares (NLS) algorithm [39] that jointly estimates . Particularly, we consider the following NLS optimization problem w.r.t. ,
| (28) |
To solve (28), we use gradient descend algorithms and alternatively carry out the following two steps until convergence:
| (29) | ||||
| (30) |
where denotes the iteration index, denote the step size of in the -th repetition, determined via Armijo line search [40], and denotes the gradient operator w.r.t. .
We refer to the methods above as direction finding in the partly calibrated model using BSS and MF (BSS-MF) or NLS (BSS-NLS), respectively. The framework of the two algorithms are summarized in Algorithm 1 together, where they differ in step 3).
Input: The received signals , the intra-subarray displacement and the number of sources .
Output: Direction estimation for .
V Resolution and orthogonality
In this section, we discuss the angular resolution of the partly and fully calibrated arrays from the aspect of orthogonality in Section III, respectively. Since a rigorous analysis of angular resolution, such as [41], is usually complex, here we give a heuristic explanation instead and leave the theoretical analysis to future work.
Angular resolution of partly calibrated arrays. As discussed in Proposition 1, when the intervals between sources are greater than , i.e., , is small. In this case, the phase offsets can be well recovered by the algorithms exploiting orthogonality, yielding high-resolution direction finding. However, when the intervals between sources are less than , i.e., , there is no obvious orthogonality between the source signals. This suggests that the achievable angular resolution of our proposed algorithms is on the order of , inversely proportional to the whole array aperture . This will be verified by simulation results in Section VI.
Angular resolution of fully calibrated arrays. We also compare of partly calibrated arrays with the counterpart of fully calibrated arrays. Particularly, the angular correlation coefficient [42], which can be used to indicate the angular resolution, is defined as
| (31) |
where , represents or , and denotes the displacement of the -th sensor relative to the 1-st sensor in the whole array, . Similar to Proposition 1, when , is given by Proposition 2.
Proposition 2.
When for , we have
| (32) | ||||
| (33) |
where , and .
Proof.
See Appendix B. ∎
From Proposition 2, we take in (32) for example and find that it has two parts, which are derived from the intra-subarray and inter-subarray parts of the steer vector . The first part is , which is related to the subarray aperture. The second part is the same as (11) in Proposition 1. Since we assume the same intra-subarray displacements for all the subarrays, this part of can be extracted and calculated as , and the inter-subarray part is then calculated as (11).
Based on the orthogonality in Proposition 1 and Proposition 2, we heuristically see that the fully and partly calibrated arrays have the same angular resolution. Particularly, since the first zero point can be used to indicate the angular resolution as shown in Fig. 3, we compare the first zero points of (11) and (32). In (32), the first zero points of and are and , respectively. Since , we have , i.e., the first zero point of in (32) is , which is the same as in (11). This implies that the angular resolution of the partly calibrated arrays is the same as the fully calibrated arrays’. A rigorous proof of this conclusion is left to future work.
VI Experimental results
In this section, we first present two simulation results: The first verifies the ability of phase offset estimation by JADE in Subsection VI-A. The second compares the performance of our proposed algorithm with existing algorithms and the Cramr-Rao lower bound (CRB) [18] in Subsection VI-B. Then, we carry out hardware experiments to further verify the feasibility of our algorithms in Subsection VI-C.
VI-A Phase offset estimation by JADE
Here, we show the performance of phase offset estimation with JADE by comparing the true with the estimated one by JADE. This is because more accurate phase offset estimation yields better recovery of . We also verify that higher level of orthogonality likely yields better performance of JADE.
Particularly, we set , , , , , and fix . With as the variable, we first calculate of (III-A) in the equidistant and random distributed arrays. Then, we substitute the phase offset estimation as (23) by JADE to (III-A) and calculate the corresponding as . The simulation results are shown in Fig. 4.
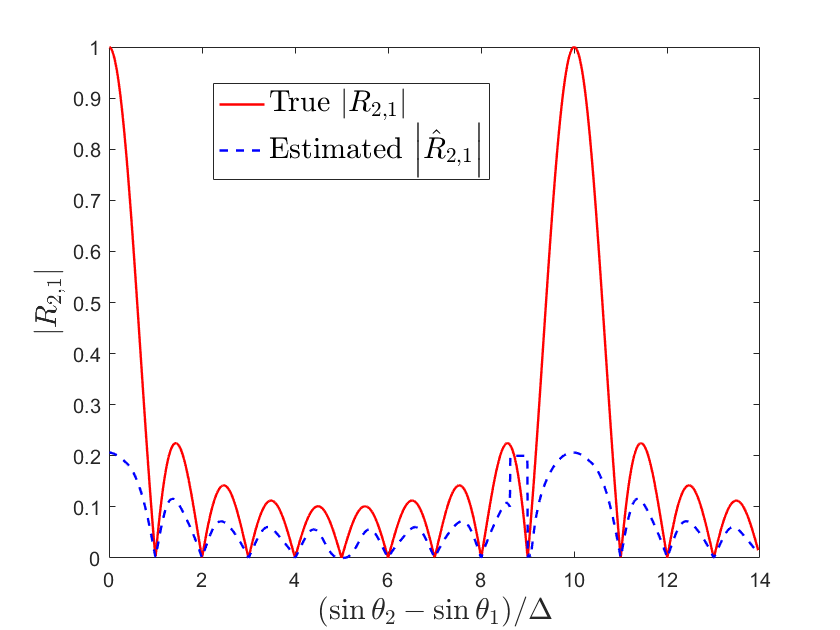
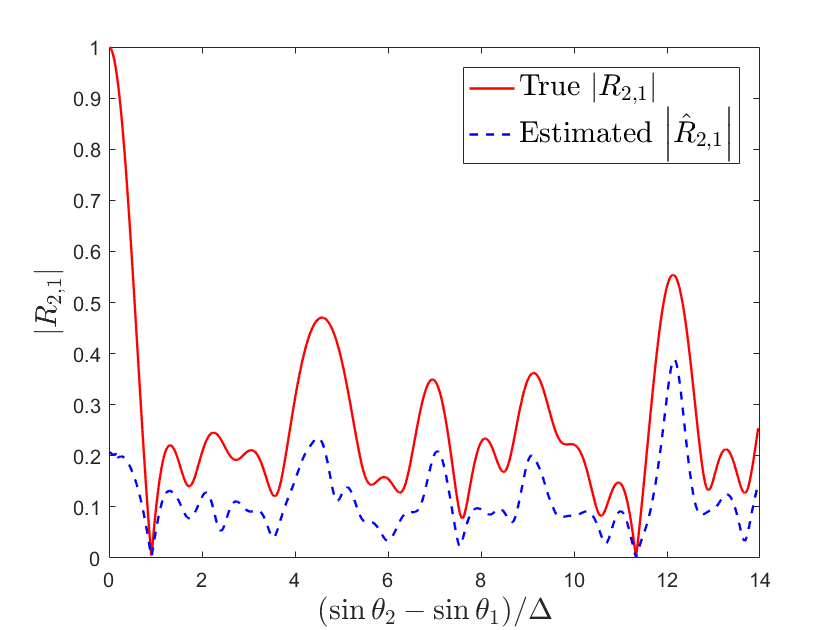
From Fig. 4, first we find that the estimation is close to the truth when is small, yielding the feasibility of phase recovery in partly calibrated arrays using JADE. Second, larger usually corresponds to a bigger gap between and and vice versus, which verifies that high level of orthogonality (smaller ) likely means better performance of JADE (smaller gap between and ). Third, in the equidistant case has apparent grating lobes at , which do not appear in the random case due to the randomness of the displacement.
VI-B Method comparison
In this subsection, we compare our proposed algorithms, BSS-MF and BSS-NLS, with the root-RARE [18], spectral-RARE [19], COBRAS [11], and group sparse [43] methods in the scenarios with only a single snapshot. We compare both the angular resolution and direction estimation accuracy of our proposed techniques with other methods and the corresponding CRBs. The simulations are carried out under various signal-to-noise rate (SNR)s and angle differences.
The CRBs for partly calibrated arrays, denoted by PC-CRB [18], is both given as the benchmarks. We use the root mean square error (RMSE) of to indicate the estimation performance of directions. We carry out Monte Carlo trials and denote the RMSE of by
| (34) |
where is the direction estimate in the -th trial and is the true value.
We consider that there are emitters in the directions of , transmitting signals with wavelength . There are uniform linear subarrays receiving the signals and each subarray has array elements. The intra-subarray and inter-subarray displacements are respectively set as for and for , where the whole array aperture is . In this case, the angular resolution of a single subarray and the whole array are and , respectively. The received signal amplitudes are set as . In the scenario, there are additive noises for , which are i.i.d. white Gaussian with mean and variance . Here SNR is defined as .
VI-B1 Performance w.r.t. SNR
Here we show the performance of algorithms w.r.t. SNR in the angular resolution and estimation accuracy. Particularly, we set and SNR dB. Since the angular resolution of the subarray and whole array are and respectively, we consider two cases that and . The former can be distinguished by the subarray, and the latter can be distinguished by the whole array, but not by the subarray.
In the group sparse algorithm, we set the grids of as for and for , such that the true values are on the grids, and hence there is no grid mismatch problem [44]. For COBRAS, we set the grids of as for and for , since more grids lead to much higher computation for existing solvers, such as cvx [45]. For example, the direction finding results of a single trial are shown in Fig. 5. Then, we change SNR and carry out trials for each SNR. The RMSEs of BSS-NLS, BSS-MF, root-RARE, spectral-RARE, COBRAS and the group sparse (GS) algorithms, as well as PC-CRB, are shown in Fig. 6 with a logarithmic coordinate.
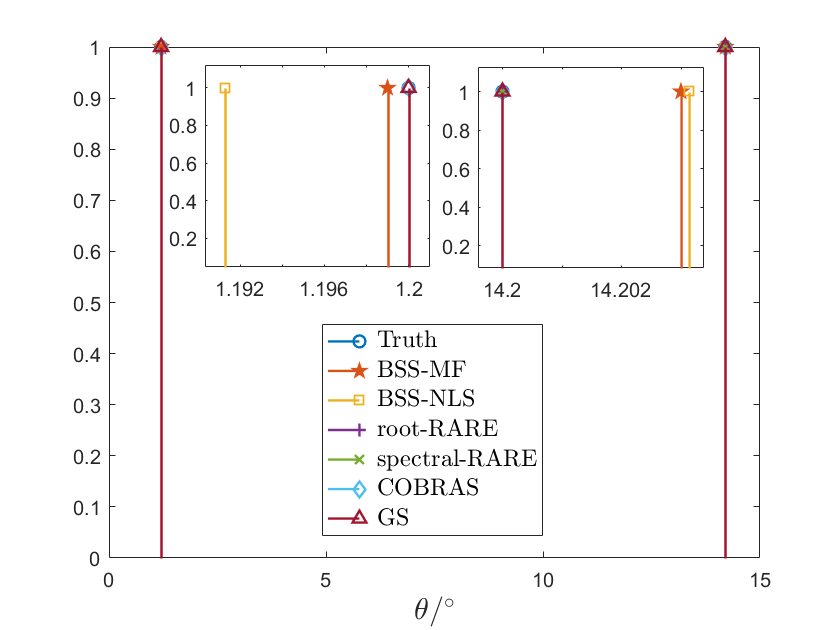
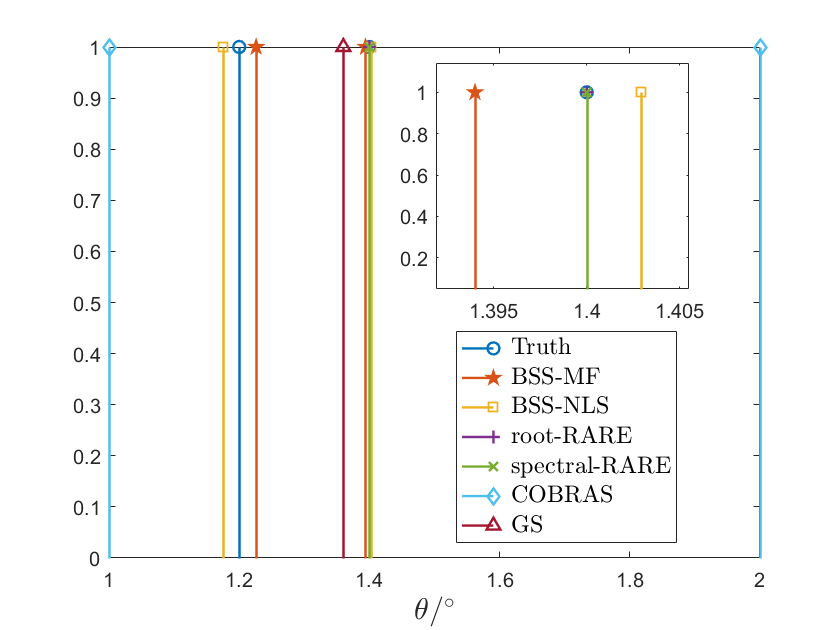
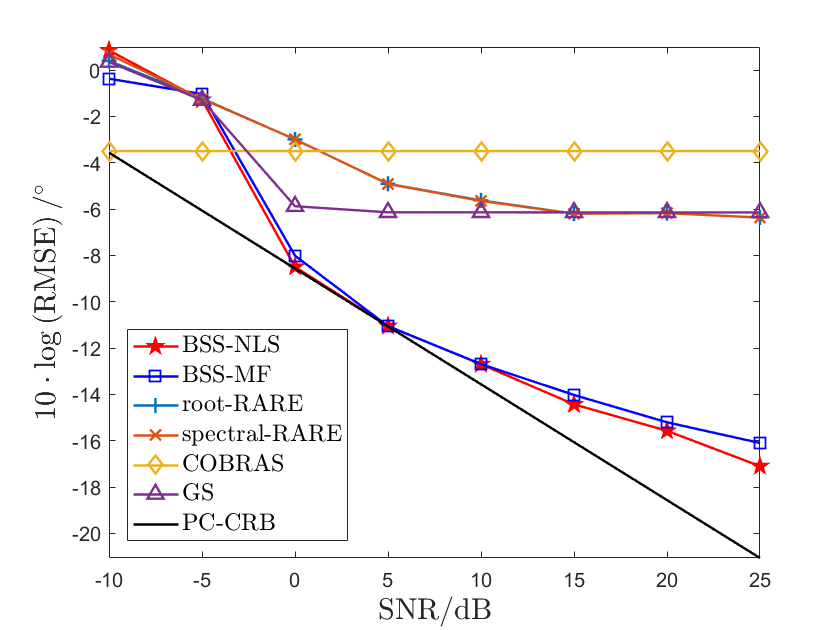
From Fig. 5, we first find that root-RARE and spectral-RARE algorithms only find the source at and fail to identify the two sources in both cases. This is because only a single snapshot is available in our scenarios, but these algorithms require enough snapshots for subspace separation. Then in Fig. 5(a), we find that the group sparse and COBRAS algorithms separate the two sources and achieve good estimation when . But they can only identify one emitter when as shown in Fig. 5(b). This indicates that these sparse recovery algorithms cannot achieve the angular resolution corresponding to the whole array aperture. However, our proposed algorithms, BSS-MF and BSS-NLS, are shown to identify the two emitters and estimate the directions accurately, which indicates the ability of exploiting the whole array aperture and achieving high angular resolution.
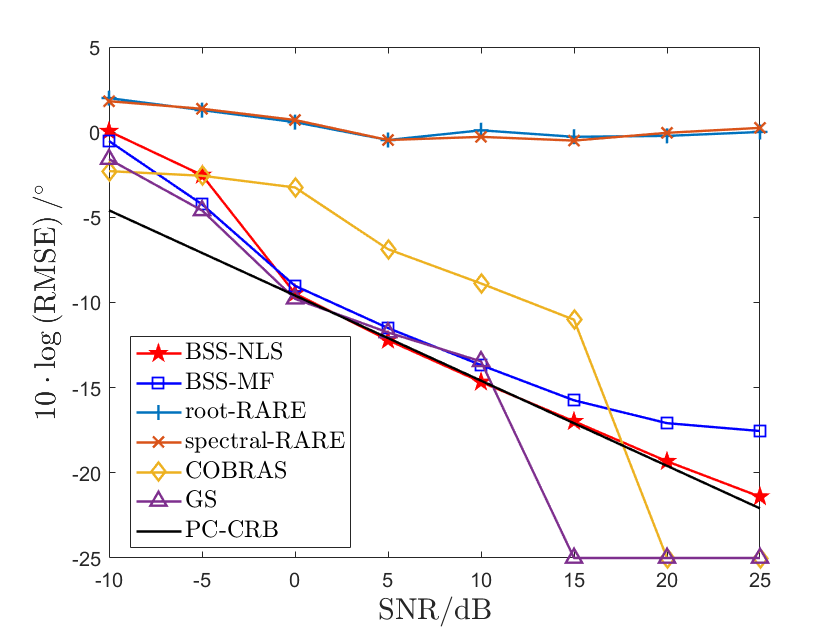
In Fig. 6, the statistical results match with the results of a single trial. The root-RARE and spectral-RARE algorithms have poor performance in both cases. The group sparse and COBRAS algorithms estimate well when . For high SNR (SNR dB) in Fig. 6(a), these sparse recovery algorithms almost exactly estimate the directions, because the true values are assumed on the grids (Due to space limit, we use -25dB to denote the completely exact estimation). But when , they fail in high SNRs. This further shows that these sparse recovery algorithms cannot exploit the whole array aperture. However, the RMSEs of our proposed algorithms are close to PC-CRB and outperform other algorithms when . This further verifies that our algorithms can achieve high angular resolution, inversely proportional to the whole array aperture.
VI-B2 Performance w.r.t. the angle difference
Here we show the performance of the algorithms w.r.t. the angle difference to have a detailed analysis on the angular resolution. Particularly, we set , SNR dB, fix , and change from to . To compare with the feature of in Fig. 4, we consider the RMSEs of algorithms w.r.t. . The simulation results are shown in Fig. 7 with a logarithmic coordinate.
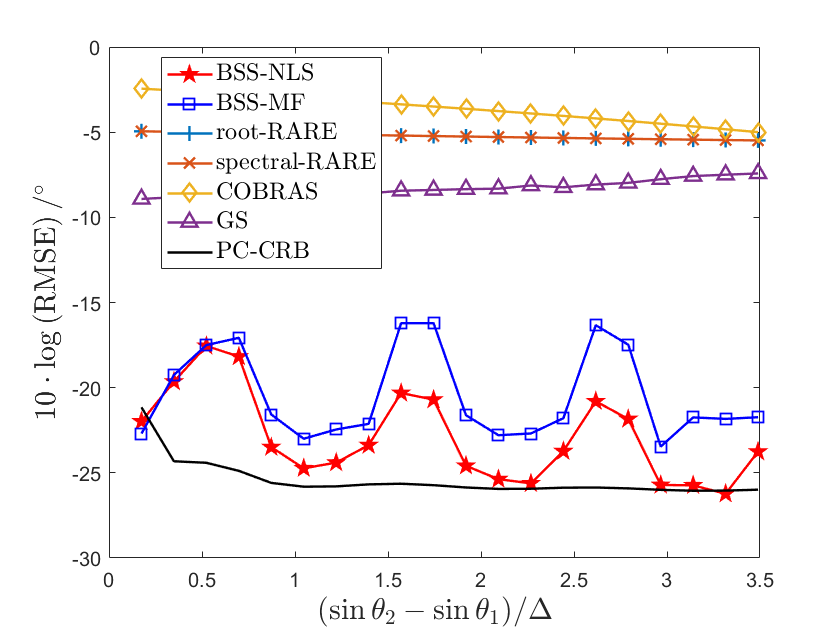
In Fig. 7, first we find that the RMSEs of our proposed algorithm are smaller than other algorithms and close to PC-CRB when is an integer, yielding better estimation accuracy. Second, it is worth noting that the RMSEs of our proposed algorithms periodically get worse w.r.t. the angle difference. We use JADE for phase offset estimation and verify that smaller likely yields better JADE performance in Subsection VI-A. The increase of the angle difference changes periodically, which affects the JADE performance in phase offset estimation, and eventually leads to periodic variations in the direction finding performance. Particularly, the curves of BSS-NLS and BSS-MF in Fig. 7 approximate to the minimums when , which is consistent with the minimums of in Fig. 4(a). These phenomena support that smaller corresponds to higher level of orthogonality, yielding better performance.
VI-C Experiment results
We consider a scenario of far-field targets impinging narrow-band signals onto the partly calibrated array. This scenario is achieved based on a vector network analyzer (VNA). Particularly, the two ports of the VNA are connected to the transmit (Tx) and receive (Rx) antennas, respectively. We view the transmit antennas as the sources. We construct the received signals of the partly calibrated array by sequentially moving the receive antenna to the position of each element and then sampling the received signals. The received signals of the two sources, T1 and T2, are sampled separately, denoted by and . We view as the received signals of the two sources. The geometry is shown in Fig. 8 and the practical scenario is shown in Fig. 9.
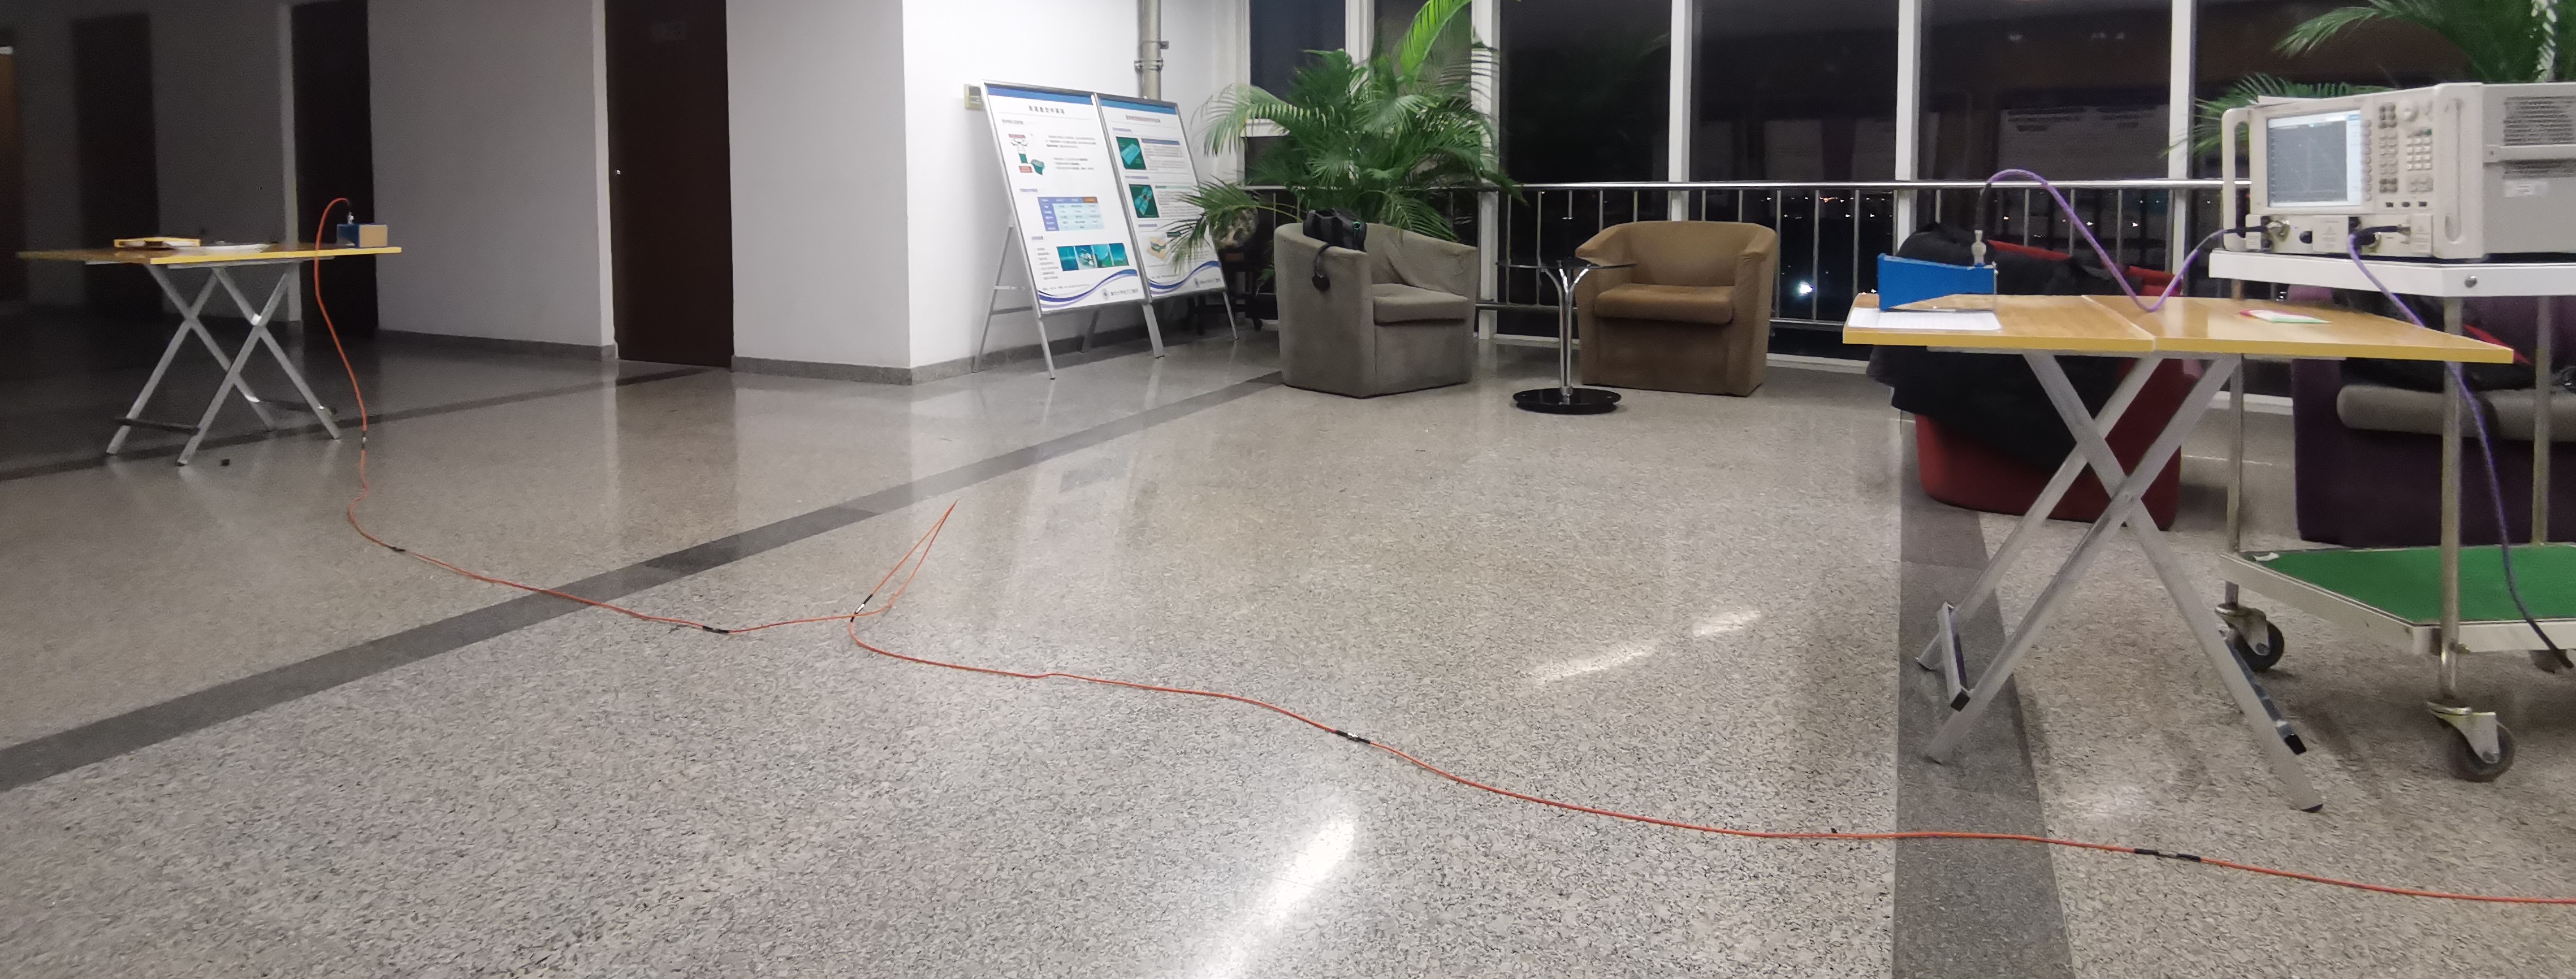
The parameter settings of this experiment are shown as follows: The frequency of the transmitted signals is GHz, and the wavelength is cm. There are uniform linear subarrays and each has array elements with cm. Particularly, we construct a planar coordinate system and the unit is centimeter (cm). The elements are located on the X axis and the coordinates are . Therefore, the angular resolution of a single subarray and the whole array are and , respectively. The positions of the sources are and . We take the array center as the reference point and the directions of the sources are . The array positions are exactly measured using a grid paper with cm interval, but the source positions are not because they are far from the receiver and measurement errors are inevitable. To obtain the true directions in practice, we use the beamforming results of and with the exact as the ground truth instead.
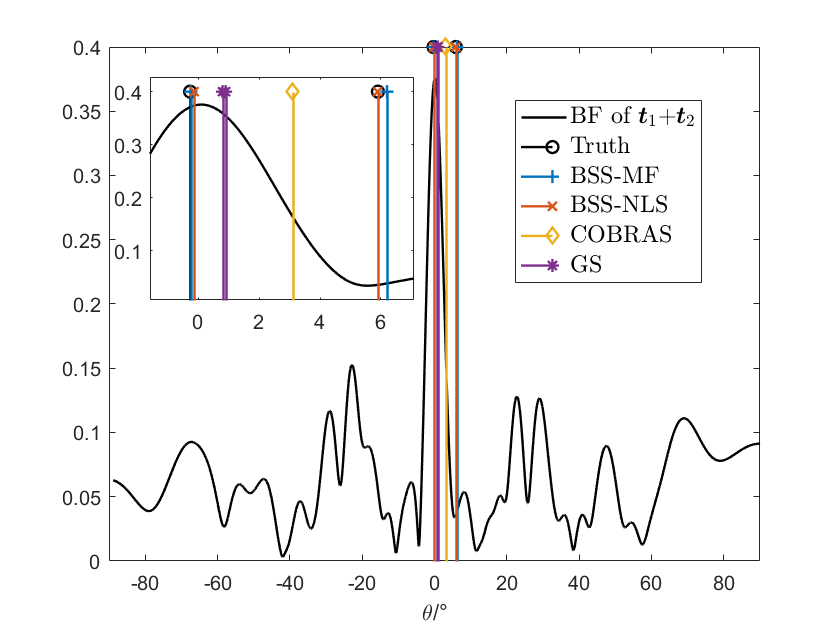
Under the above settings, we have the received signals and . Recall that the fully and partly calibrated model assume exact and biased inter-subarray displacements , respectively. The exact is set above and the biased is constructed by adding errors to the exact artificially. Particularly, we take as unit and add a Gaussian error to exact to construct biased as , . Here we set dB. Then, we calculate the beamforming results of with biased and compare it with the estimation of BSS-MF, BSS-NLS and the group sparse algorithm (We do not consider the root-RARE and spectral-RARE algorithms here since they fail in the single-snapshot cases). The comparison is shown in Fig. 10.
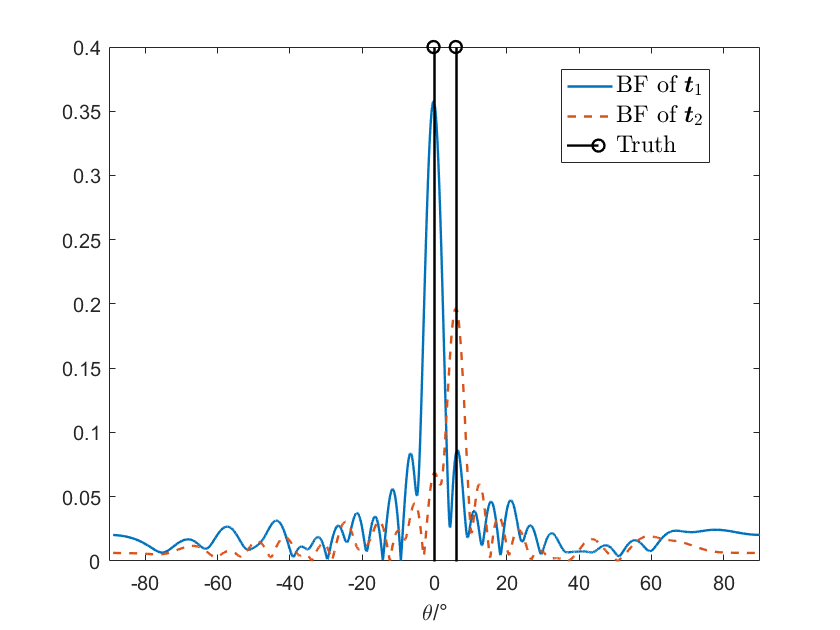
From Fig. 10(a), we find that the main lobes of both sources are clear and the side lobes are low. The peaks of the main lobes are corresponding to and , which are close to our settings. These phenomenons imply that we get high-quality real measured data.
From Fig. 10(b), when the inter-subarray displacements are erroneous, we find that the beamforming results have many high side lobes and it is hard to identify both sources. This phenomenon illustrates that the subarray position errors in the partly calibrated model have a severe effect on the direction finding performance. However, our proposed algorithms are shown to identify the two sources, with the estimates close to the truth, outperforming the group sparse and COBRAS techniques.
VII Conclusion
In this paper, we consider achieving high angular resolution using distributed arrays in the presence of array displacement errors. We propose a novel algorithm with only a single snapshot, yielding less data transmission burden and processing delay compared with existing works. This is achieved by exploiting the orthogonality between source signals, using BSS. Based on BSS ideas, we propose a direction finding algorithm, and discuss the relationship between orthogonality and angular resolution. Simulation and experiment results both verify the feasibility of our algorithms in achieving high angular resolution, inversely proportional to the whole array aperture.
Appendix A Proof of Proposition 1
Here we prove Proposition 1, i.e., calculate and when for . We denote .
Appendix B Proof of Proposition 2
Based on the definition of , we have
| (40) |
Note that is related to both the intra-subarray and inter-subarray displacement . Therefore, we can represent of the -th sensor in the -th subarray as . Then, we rewrite (40) as
| (41) |
Since is a constant, we calculate the first summation of (B) as
| (42) |
where .
Appendix C The JADE algorithm
In (16), the JADE algorithm considers recovering from with unknown . The main framework of JADE is:
-
(1)
Compute a whitening matrix based on .
-
(2)
Calculate the whitened data .
-
(3)
Find a unitary matrix , such that reaches its maximum, where is a function characterizing the level of independence.
-
(4)
Output the estimation of as .
Here we detail the specific procedures of JADE. In step (1), to calculate the whitening matrix, JADE first calculates the sample covariance matrix of , denoted by . In , the noise variance is estimated as the average of the smallest eigenvalues of , given by , where is obtained from the singular value decomposition (SVD) of , i.e., . Therefore, the white noise covariance is estimated as . Subtracting the noise covariance from implies noiseless estimation of . Then, the whitening matrix is estimated as
| (45) |
where denotes the first columns of matrix .
In step (3), JADE minimizes the following cost function characterizing independence, given by
| (46) |
where is denoted by
| (47) |
for for . In [26], the minimization of (46) w.r.t. is proven to be equivalent to a joint approximate diagonalization of some cumulant matrices and solved efficiently.
The JADE algorithm is summarized as Algorithm 2. As mentioned above, the JADE algorithm transforms the maximization of (46) to a joint approximate diagonalization of some cumulant matrices. The steps (2) and (3) in Algorithm 2 are to construct the cumulant matrices, and step (4) is the joint approximate diagonalization.
Input: The received signals and the number of sources .
Output: The waveform estimation .
Input: The matrix set and the number of sources .
| (49) |
| (50) |
| (51) |
| (52) |
| (53) |
Output: The unitary matrix .
References
- [1] H. Krim and M. Viberg, “Two decades of array signal processing research: the parametric approach,” IEEE Signal Processing Magazine, vol. 13, no. 4, pp. 67–94, 1996.
- [2] H. L. Van Trees, Optimum array processing: Part IV of detection, estimation, and modulation theory. John Wiley & Sons, 2004.
- [3] R. Heimiller, J. Belyea, and P. Tomlinson, “Distributed array radar,” IEEE Transactions on Aerospace and Electronic Systems, vol. AES-19, no. 6, pp. 831–839, 1983.
- [4] Q. H. Wang, T. Ivanov, and P. Aarabi, “Acoustic robot navigation using distributed microphone arrays,” Information Fusion, vol. 5, no. 2, pp. 131–140, 2004, robust Speech Processing. [Online]. Available: https://www.sciencedirect.com/science/article/pii/S156625350300085X
- [5] D. Jenn, Y. Loke, T. C. H. Matthew, Y. E. Choon, O. C. Siang, and Y. S. Yam, “Distributed phased arrays and wireless beamforming networks,” International Journal of Distributed Sensor Networks, vol. 5, no. 4, pp. 283–302, 2009.
- [6] A. Anton, I. Garcia-Rojo, A. Girón, E. Morales, and R. Martínez, “Analysis of a distributed array system for satellite acquisition,” IEEE Transactions on Aerospace and Electronic Systems, vol. 53, no. 3, pp. 1158–1168, 2017.
- [7] S. Sun, H. Lin, J. Ma, and X. Li, “Multi-sensor distributed fusion estimation with applications in networked systems: A review paper,” Information Fusion, vol. 38, pp. 122–134, 2017. [Online]. Available: https://www.sciencedirect.com/science/article/pii/S1566253517300362
- [8] S. Mghabghab and J. A. Nanzer, “A self-mixing receiver for wireless frequency synchronization in coherent distributed arrays,” in 2020 IEEE/MTT-S International Microwave Symposium (IMS). IEEE, 2020, pp. 1137–1140.
- [9] P. Stoica, M. Viberg, Kon Max Wong, and Qiang Wu, “Maximum-likelihood bearing estimation with partly calibrated arrays in spatially correlated noise fields,” IEEE Transactions on Signal Processing, vol. 44, no. 4, pp. 888–899, 1996.
- [10] E. H. T. Collaboration, K. Akiyama, A. Alberdi, W. Alef, K. Asada, R. AZULY et al., “First m87 event horizon telescope results. i. the shadow of the supermassive black hole,” Astrophys. J. Lett, vol. 875, no. 1, p. L1, 2019.
- [11] C. Steffens and M. Pesavento, “Block- and rank-sparse recovery for direction finding in partly calibrated arrays,” IEEE Transactions on Signal Processing, vol. 66, no. 2, pp. 384–399, 2018.
- [12] A. Adler and M. Wax, “Direct localization by partly calibrated arrays: A relaxed maximum likelihood solution,” in 2019 27th European Signal Processing Conference (EUSIPCO). IEEE, 2019, pp. 1–5.
- [13] W. Suleiman, P. Parvazi, M. Pesavento, and A. M. Zoubir, “Non-coherent direction-of-arrival estimation using partly calibrated arrays,” IEEE Transactions on Signal Processing, vol. 66, no. 21, pp. 5776–5788, 2018.
- [14] M. Wax and T. Kailath, “Decentralized processing in sensor arrays,” IEEE Transactions on Acoustics, Speech, and Signal Processing, vol. 33, no. 5, pp. 1123–1129, 1985.
- [15] P. Stoica, A. Nehorai, and T. Söderström, “Decentralized array processing using the mode algorithm,” Circuits, Systems and Signal Processing, vol. 14, no. 1, pp. 17–38, 1995.
- [16] S. Sarvotham, D. Baron, M. Wakin, M. F. Duarte, and R. G. Baraniuk, “Distributed compressed sensing of jointly sparse signals,” in Asilomar conference on signals, systems, and computers, 2005, pp. 1537–1541.
- [17] A. L. Swindlehurst, B. Ottersten, R. Roy, and T. Kailath, “Multiple invariance esprit,” IEEE Transactions on Signal Processing, vol. 40, no. 4, pp. 867–881, 1992.
- [18] M. Pesavento, A. B. Gershman, and K. M. Wong, “Direction finding in partly calibrated sensor arrays composed of multiple subarrays,” IEEE Transactions on Signal Processing, vol. 50, no. 9, pp. 2103–2115, 2002.
- [19] C. M. S. See and A. B. Gershman, “Direction-of-arrival estimation in partly calibrated subarray-based sensor arrays,” IEEE Transactions on Signal Processing, vol. 52, no. 2, pp. 329–338, 2004.
- [20] P. Parvazi, M. Pesavento, and A. B. Gershman, “Direction-of-arrival estimation and array calibration for partly-calibrated arrays,” in 2011 IEEE International Conference on Acoustics, Speech and Signal Processing (ICASSP), 2011, pp. 2552–2555.
- [21] H.-L. Ding, W.-B. Zhao, and L.-Z. Zhang, “Tracking number time-varying nonlinear targets based on squf-gmphda in radar networking,” in Intelligent Computing Theories and Application, D.-S. Huang and K.-H. Jo, Eds. Cham: Springer International Publishing, 2016, pp. 825–837.
- [22] C. Steffens, P. Parvazi, and M. Pesavento, “Direction finding and array calibration based on sparse reconstruction in partly calibrated arrays,” in 2014 IEEE 8th Sensor Array and Multichannel Signal Processing Workshop (SAM), 2014, pp. 21–24.
- [23] Y. C. Eldar and M. Mishali, “Robust recovery of signals from a structured union of subspaces,” IEEE Transactions on Information Theory, vol. 55, no. 11, pp. 5302–5316, 2009.
- [24] Y. C. Eldar, P. Kuppinger, and H. Bolcskei, “Block-sparse signals: Uncertainty relations and efficient recovery,” IEEE Transactions on Signal Processing, vol. 58, no. 6, pp. 3042–3054, 2010.
- [25] S. Choi, A. Cichocki, H.-M. Park, and S.-Y. Lee, “Blind source separation and independent component analysis: A review,” Neural Information Processing-Letters and Reviews, vol. 6, no. 1, pp. 1–57, 2005.
- [26] J.-F. Cardoso and A. Souloumiac, “Blind beamforming for non-gaussian signals,” in IEE proceedings F (radar and signal processing), vol. 140, no. 6. IET, 1993, pp. 362–370.
- [27] Y. Wang and K. C. Ho, “Unified near-field and far-field localization for aoa and hybrid aoa-tdoa positionings,” IEEE Transactions on Wireless Communications, vol. 17, no. 2, pp. 1242–1254, 2018.
- [28] W. Liao and A. Fannjiang, “Music for single-snapshot spectral estimation: Stability and super-resolution,” Applied and Computational Harmonic Analysis, vol. 40, no. 1, pp. 33–67, 2016. [Online]. Available: https://www.sciencedirect.com/science/article/pii/S1063520314001432
- [29] Y. C. Eldar and G. Kutyniok, Compressed sensing: theory and applications. Cambridge university press, 2012.
- [30] P. Stoica, P. Babu, and J. Li, “Spice: A sparse covariance-based estimation method for array processing,” IEEE Transactions on Signal Processing, vol. 59, no. 2, pp. 629–638, 2011.
- [31] H. Akaike, “A new look at the statistical model identification,” IEEE transactions on automatic control, vol. 19, no. 6, pp. 716–723, 1974.
- [32] G. Schwarz, “Estimating the dimension of a model,” The annals of statistics, pp. 461–464, 1978.
- [33] M. Wax and T. Kailath, “Detection of signals by information theoretic criteria,” IEEE Transactions on acoustics, speech, and signal processing, vol. 33, no. 2, pp. 387–392, 1985.
- [34] R. Schmidt, “Multiple emitter location and signal parameter estimation,” IEEE transactions on antennas and propagation, vol. 34, no. 3, pp. 276–280, 1986.
- [35] Y. C. Eldar, Sampling theory: Beyond bandlimited systems. Cambridge University Press, 2015.
- [36] R. Tibshirani, “Regression shrinkage and selection via the lasso,” Journal of the royal statistical society series b-methodological, vol. 58, no. 1, pp. 267–288, 1996.
- [37] M. Rossi, A. M. Haimovich, and Y. C. Eldar, “Spatial compressive sensing for mimo radar,” IEEE Transactions on Signal Processing, vol. 62, no. 2, pp. 419–430, 2014.
- [38] J. A. Tropp, “A mathematical introduction to compressive sensing [book review],” Bulletin of the American Mathematical Society, vol. 54, no. 1, pp. 151–165, 2017.
- [39] P. E. Gill and W. Murray, “Algorithms for the solution of the nonlinear least-squares problem,” SIAM Journal on Numerical Analysis, vol. 15, no. 5, pp. 977–992, 1978.
- [40] N. Boumal and P.-A. Absil, “Low-rank matrix completion via preconditioned optimization on the grassmann manifold,” Linear Algebra and its Applications, vol. 475, pp. 200–239, 2015.
- [41] S. Smith, “Statistical resolution limits and the complexified cramér-rao bound,” IEEE Transactions on Signal Processing, vol. 53, no. 5, pp. 1597–1609, 2005.
- [42] A. G. Asuero, A. Sayago, and A. Gonzalez, “The correlation coefficient: An overview,” Critical reviews in analytical chemistry, vol. 36, no. 1, pp. 41–59, 2006.
- [43] J. Huang, T. Zhang et al., “The benefit of group sparsity,” The Annals of Statistics, vol. 38, no. 4, pp. 1978–2004, 2010.
- [44] Y. Chi, L. L. Scharf, A. Pezeshki, and A. R. Calderbank, “Sensitivity to basis mismatch in compressed sensing,” IEEE Transactions on Signal Processing, vol. 59, no. 5, pp. 2182–2195, 2011.
- [45] M. Grant and S. Boyd, “Cvx: Matlab software for disciplined convex programming, version 2.1,” 2014.