Diffusion Models Through a Global Lens: Are They Culturally Inclusive?
Abstract
Text-to-image diffusion models have recently enabled the creation of visually compelling, detailed images from textual prompts. However, their ability to accurately represent various cultural nuances remains an open question. In our work, we introduce CultDiff benchmark, evaluating state-of-the-art diffusion models whether they can generate culturally specific images spanning ten countries. We show that these models often fail to generate cultural artifacts in architecture, clothing, and food, especially for underrepresented country regions, by conducting a fine-grained analysis of different similarity aspects, revealing significant disparities in cultural relevance, description fidelity, and realism compared to real-world reference images. With the collected human evaluations, we develop a neural-based image-image similarity metric, namely, CultDiff-S, to predict human judgment on real and generated images with cultural artifacts. Our work highlights the need for more inclusive generative AI systems and equitable dataset representation over a wide range of cultures.
Diffusion Models Through a Global Lens: Are They Culturally Inclusive?
Zahra Bayramli††thanks: Equal contribution Ayhan Suleymanzade11footnotemark: 1 Na Min An Huzama Ahmad Eunsu Kim Junyeong Park James Thorne††thanks: Corresponding author Alice Oh22footnotemark: 2 KAIST
1 Introduction
Text-to-image (T2I) diffusion models recently have shown a significant advance in generating high-quality images from text prompts(Saharia et al., 2022; Ramesh et al., 2022; Betker et al., 2023; Podell et al., 2023; Blattmann et al., 2023; Esser et al., 2024). Remarkable success has been demonstrated in producing realistic and detailed visual representations, ranging from generating complex scenes Liu et al. (2024b) to performing style transfer using diffusion models Wang et al. (2023); Zhang et al. (2023). While it is crucial to address the challenge of generating culture-aware imagery, current diffusion models have yet to be evaluated on their ability to create a distribution of accurate and fair representations of images Cao et al. (2024b); Liu et al. (2023).
A recent study, Basu et al. (2023) reveals that while current diffusion models can generate realistic and contextually relevant images, they frequently fail to achieve geographical inclusiveness, generating well-represented images worldwide. Furthermore, a critical gap remains in these models’ ability to produce culturally accurate representations, failing to create concepts or artifacts for particular cultures, thus, lacking in culture awareness Kannen et al. (2024). While benchmark datasets have been developed to capture cultural diversity Jha et al. (2023); Myung et al. (2024); Li et al. (2024c), to the best of our knowledge, there is limited prior work exploring the ability of diffusion models to generate culturally specific artifacts, particularly those representing underrepresented cultures Kannen et al. (2024); Nayak et al. (2024).
The primary motivation of our study is to investigate the capability of state-of-the-art diffusion models in accurately representing cultural themes for both overrepresented and underrepresented cultures. We consider culture as societal constructs tied to country boundaries and use ‘culture’ and ‘country’ interchangeably in this paper, similar to prior approaches Kannen et al. (2024); Li et al. (2024b). The overrepresented cultures defined here include countries from Western, European, Industrialized, Rich, and Democratic (WEIRD) regions Henrich et al. (2010) (e.g., United States, United Kingdom), as well as countries from Asia, based on their Asia Power Index111https://power.lowyinstitute.org (e.g., China, South Korea). In contrast, countries where the primary languages (e.g., Amharic, Azerbaijani) have limited resource availability, as defined in Joshi et al. (2020), are considered underrepresented (e.g., Ethiopia, Azerbaijan).
In this paper, we present a new benchmark dataset designed to evaluate these models’ ability to generate images that accurately reflect both high-resource and low-resource cultures222We use the terms over/underrepresented and high/low-resource interchangeably throughout the paper.. Our benchmarking dataset includes a curated collection of prompts for architectural landmarks, clothing, and food from various countries to ensure comprehensive coverage of cultural diversity. Since existing image similarity metrics (e.g., FID Heusel et al. (2017)) struggle to evaluate cultural nuances accurately, we propose a model-based metric trained and validated with human feedback and compare its correlation. Our contributions can be summarized as follows:
-
•
CultDiff benchmark dataset: We introduce a novel dataset, CultDiff, specifically designed to evaluate diffusion models on their ability to generate culturally accurate images across ten countries with varying resource levels, incorporating human evaluations.
-
•
Analysis on various culture representations of generated images: We explore how well diffusion models represent low- and high-resource cultures, providing a fine-grained analysis of different aspects of similarity (e.g., image-image, image-description).
-
•
An automatic image-image similarity evaluation metric: We present a similarity metric trained and validated with human feedback and compare its capabilities to existing similarity metrics, demonstrating its potential to better capture cultural nuances in generated images.
2 Related Works
2.1 Cultural-Aware Datasets
Beginning with the benchmark to evaluate image quality from simpler text prompts using text-to-image (T2I) diffusion models, such as HPDv2 Wu et al. (2023) using human preferences, more recently advanced efforts include creating comprehensive benchmarks such as T2I-CompBench Huang et al. (2023) and GenAI-Bench Li et al. (2024a). These prior benchmarks assess the performance of T2I models across various aspects, including realism, fidelity, and compositional text-to-image generation. Although a very recent study Jha et al. (2024) has started investigating global representation in T2I models, their emphasis has primarily been on regional social stereotypes.
On the other hand, many widely-used datasets for training T2I synthesis models, such as LAION-400M Schuhmann et al. (2021), tend to exhibit Anglo-centric and Euro-centric biases, as noted by Birhane et al. (2021). These biases skew the representation of cultures in generated images, often favoring Western perspectives. In response to this, several researchers have worked to create datasets that better represent diverse cultures. For example, the MaRVL dataset Liu et al. (2021) was specifically designed to include a broader array of languages and cultural concepts, covering regions such as Indonesia, Swahili-speaking Africa, Tamil-speaking South Asia, Turkey, and Mandarin-speaking China and addressing biases in datasets that predominantly focused on North American and Western European cultures.
In the Large Language Models (LLMs) domains, SeeGULL dataset Jha et al. (2023) broadens stereotype benchmarking to encompass global and regional diversity, and BLEnD benchmark Myung et al. (2024) evaluates the cultural knowledge of LLMs across various languages including low-resource ones. Similarly, the Dollar Street dataset Gaviria Rojas et al. (2022) sought to capture everyday life across a wide variety of socioeconomic backgrounds, presenting a more globally inclusive view. In addition, Liu et al. (2023) introduced the CCUB dataset developed to promote cultural inclusivity by collecting images and captions representing the cultural contexts of different countries. Most recently, CUBE Kannen et al. (2024) is a large-scale dataset of cultural artifacts spanning 8 countries across different geo-cultural regions for evaluating cultural diversity. Our work further contributes to dataset creation by expanding the focus to include low-resource cultures, thereby addressing gaps between overrepresented and underrepresented cultural contexts.
2.2 Diffusion Model Evaluation
Several metrics have been developed and widely used to evaluate the quality of images generated by T2I models. These include measures of realism such as the Inception Score (IS) (Salimans et al., 2016), Fréchet Inception Distance (FID) (Heusel et al., 2017), and Image Realism Score (IRS) (Chen et al., 2023). In particular, IS evaluates image quality and diversity based on classification probabilities, FID quantifies the similarity between generated and real image distributions, and IRS mainly analyzes basic image characteristics to measure the realism of the visual content. In addition, the alignment between generated images and the corresponding prompts has been evaluated using various metrics, such as CLIPScore (Hessel et al., 2021), VQA Score (Lin et al., 2025), and ImageReward (Xu et al., 2023), which incorporates human feedback to enhance T2I models further. Although Kannen et al. (2024) has explored cultural diversity in text-to-image model generations using the Vendi Score (Nguyen and Dieng, 2024), measuring cultural accuracy in generated images has not yet been successfully achieved with existing metrics. As a result, the most reliable approach remains relying on human participants, as demonstrated in several works (Kannen et al., 2024; Nayak et al., 2024). In our work, we also utilize human annotation; however, due to the time and cost associated with it, there is a pressing need for automatic evaluation. To address this, we present a metric specifically trained on a culture-aware dataset to observe its potential for aligning with human preferences.
3 CultDiff Benchmark
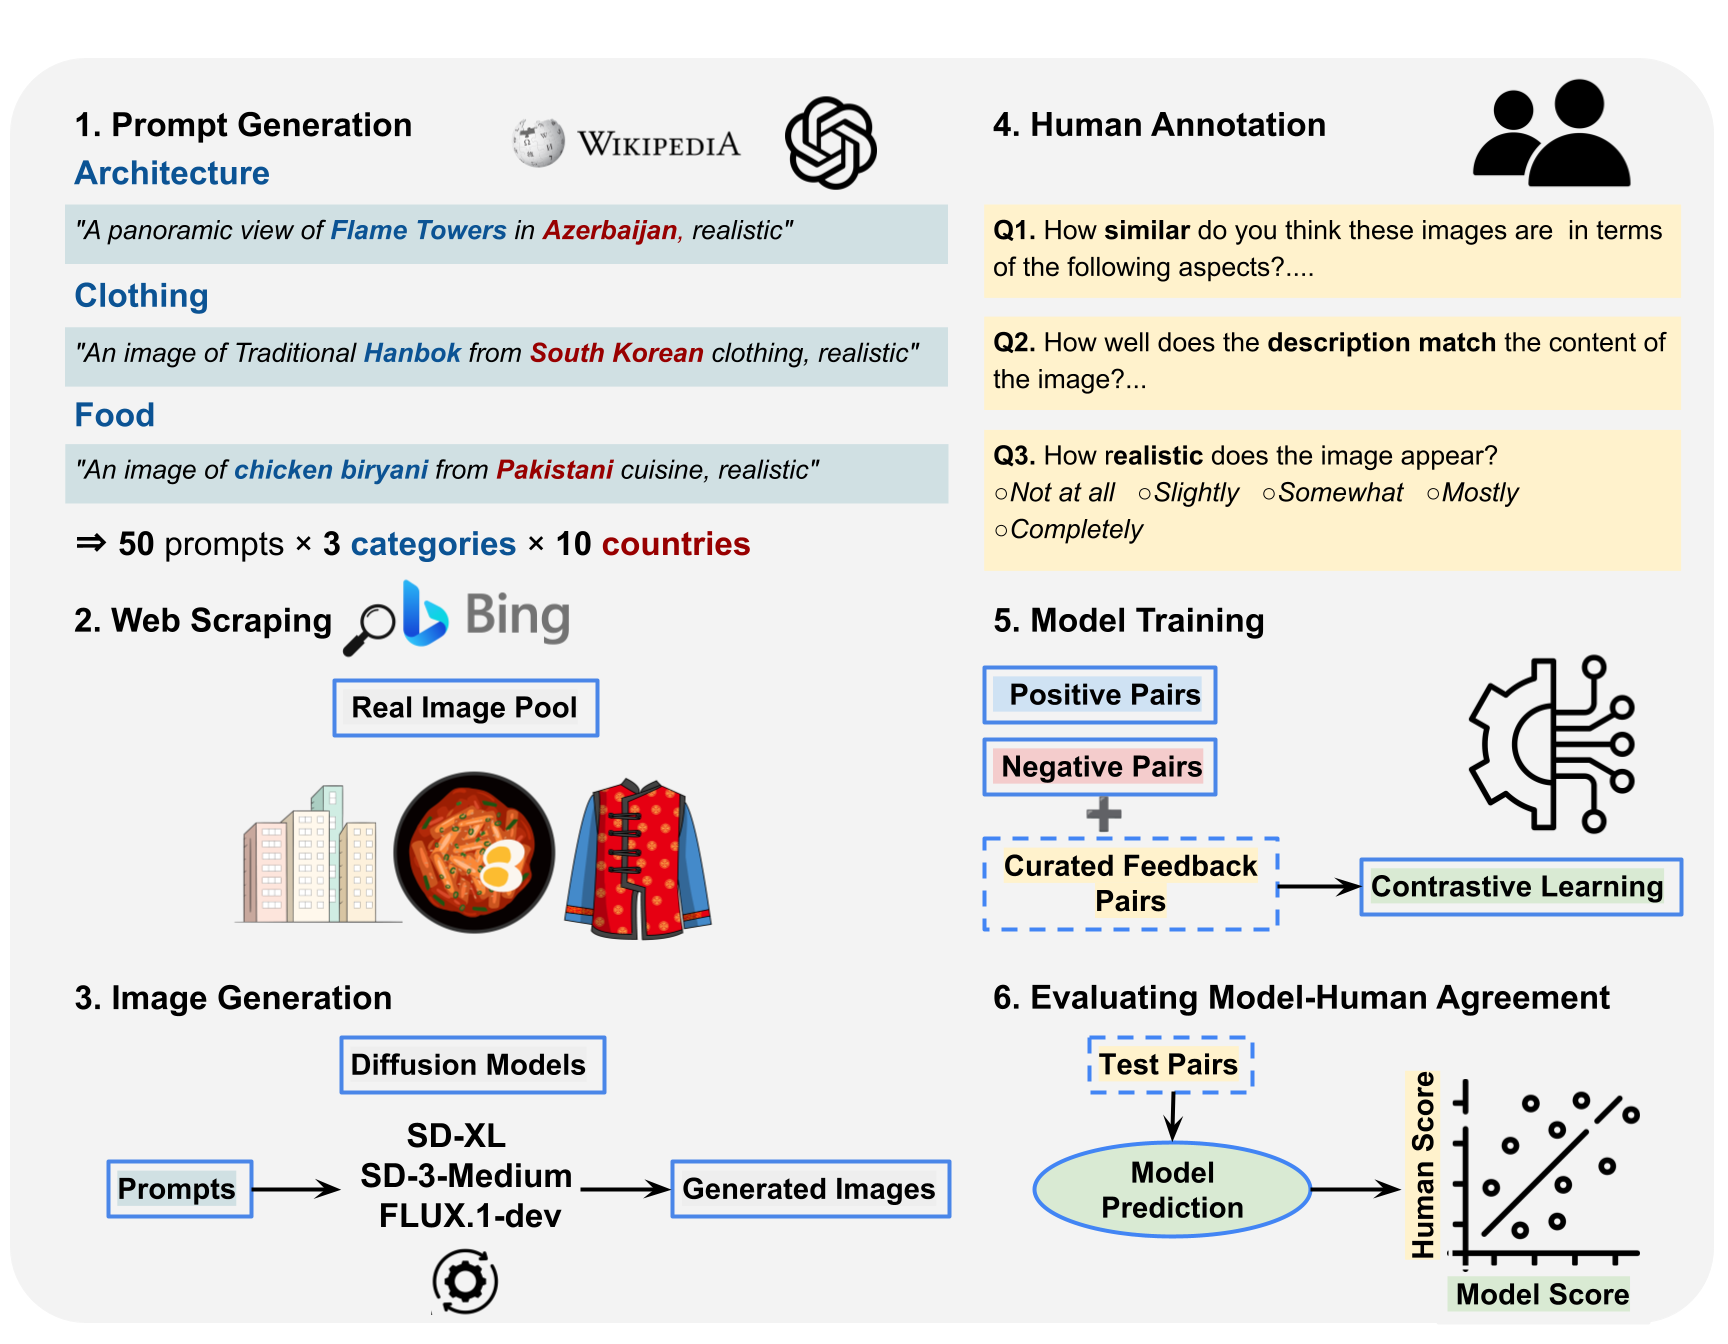
This section outlines the process of building our CultDiff benchmark, including the data construction (steps 1-3 in Figure 1 and Section 3.1), human annotation (step 4 in Figure 1 and Section 3.2), and design of the architectural framework for the metric evaluation (steps 5-6 in Figure 1 and Section 3.3).
3.1 CultDiff Dataset Construction
In this section, we present the construction of the CultDiff dataset, which is designed to evaluate the performance of diffusion models in generating culturally relevant images across various artifact categories and countries. The dataset creation process is composed of three key steps as outlined in Figure 1: (1) prompt generation, (2) collection of real images, and (3) synthetic image generation.
Prompt Generation.
To create the benchmark dataset for evaluating the diffusion models, we focused on three artifact categories: architecture (or landmarks), clothing, and food across ten countries. The prompt generation process involved the following steps: (1)Artifact Collection: Compiled a list of 50 artifact names per category and country using Wikipedia, cultural heritage websites, and travel platforms333https://www.tripadvisor.com for landmarks. (2) Prompt Engineering: Created custom-generated prompts for each artifact which are simple, structured prompts (e.g., "A panoramic view of {landmark} in {country}, realistic.") similar to the prompts used in Kannen et al. (2024) (refer to Appendix A.1 for the list of prompts).
Image Collection and Generation.
To acquire real images for training and evaluation, we collected images for each artifact across all categories and countries from the internet using the generated prompts. Recognizing that real-world images vary significantly due to factors such as location, camera angle, lighting, and weather conditions, we aimed to minimize potential biases by selecting five images rather than solely one for each artifact. The images were scraped using Bulk Bing Image Downloader (BBID)444https://github.com/ostrolucky/Bulk-Bing-Image-downloader, an open-source Python tool that enables fast downloads and filters out adult content.
The image generation process involved synthesizing images based on the generated prompts. We used three diffusion models: Stable Diffusion XL (Podell et al., 2023), Stable Diffusion 3 Medium Diffusers (Esser et al., 2024), and FLUX.1-dev555We refer to FLUX.1-dev as FLUX throughout this paper. (Labs, 2023).
| Diffusion Models | Stable Diffusion XL | Stable Diffusion 3 Medium Diffusers | FLUX.1 dev | ||||||
| Category | Architecture | Clothing | Food | Architecture | Clothing | Food | Architecture | Clothing | Food |
| Q1.1-Highest Score | S. Korea | Pakistan | USA | Azerbaijan | Mexico | Mexico | UK | Mexico | USA |
| UK | S. Korea | Spain | Mexico | UK | USA | S. Korea | Pakistan | Pakistan | |
| Mexico | Mexico | Pakistan | S. Korea | S. Korea | Pakistan | Mexico | S. Korea | Mexico | |
| USA | USA | Mexico | UK | Pakistan | Spain | USA | UK | UK | |
| Ethiopia | UK | Indonesia | Ethiopia | Indonesia | UK | Ethiopia | USA | Spain | |
| Spain | Indonesia | UK | USA | USA | Indonesia | Azerbaijan | Indonesia | Azerbaijan | |
| Azerbaijan | Azerbaijan | Azerbaijan | Indonesia | Azerbaijan | Azerbaijan | China | Azerbaijan | China | |
| Pakistan | Spain | S. Korea | China | Spain | Ethiopia | Indonesia | Spain | Indonesia | |
| Indonesia | Ethiopia | Ethiopia | Spain | Ethiopia | China | Pakistan | China | S. Korea | |
| Q1.1-Lowest Score | China | China | China | Pakistan | China | S. Korea | Spain | Ethiopia | Ethiopia |
| Q1.2-Highest Score | S. Korea | S. Korea | USA | USA | UK | USA | USA | S. Korea | USA |
| Mexico | UK | Spain | Mexico | S. Korea | Spain | UK | Indonesia | Spain | |
| UK | Mexico | Pakistan | S. Korea | Mexico | Pakistan | Mexico | Mexico | Azerbaijan | |
| USA | USA | Indonesia | Azerbaijan | Indonesia | Mexico | S. Korea | Pakistan | Pakistan | |
| Spain | Indonesia | Azerbaijan | UK | Pakistan | China | Ethiopia | USA | Mexico | |
| Ethiopia | Pakistan | S. Korea | Ethiopia | USA | Indonesia | Azerbaijan | UK | UK | |
| Azerbaijan | Azerbaijan | Mexico | Pakistan | Azerbaijan | Azerbaijan | China | Azerbaijan | China | |
| Pakistan | Spain | UK | China | China | UK | Pakistan | Spain | S. Korea | |
| China | Ethiopia | Ethiopia | Spain | Ethiopia | S. Korea | Spain | China | Indonesia | |
| Q1.2-Lowest Score | Indonesia | China | China | Indonesia | Spain | Ethiopia | Indonesia | Ethiopia | Ethiopia |
3.2 Human Evaluation
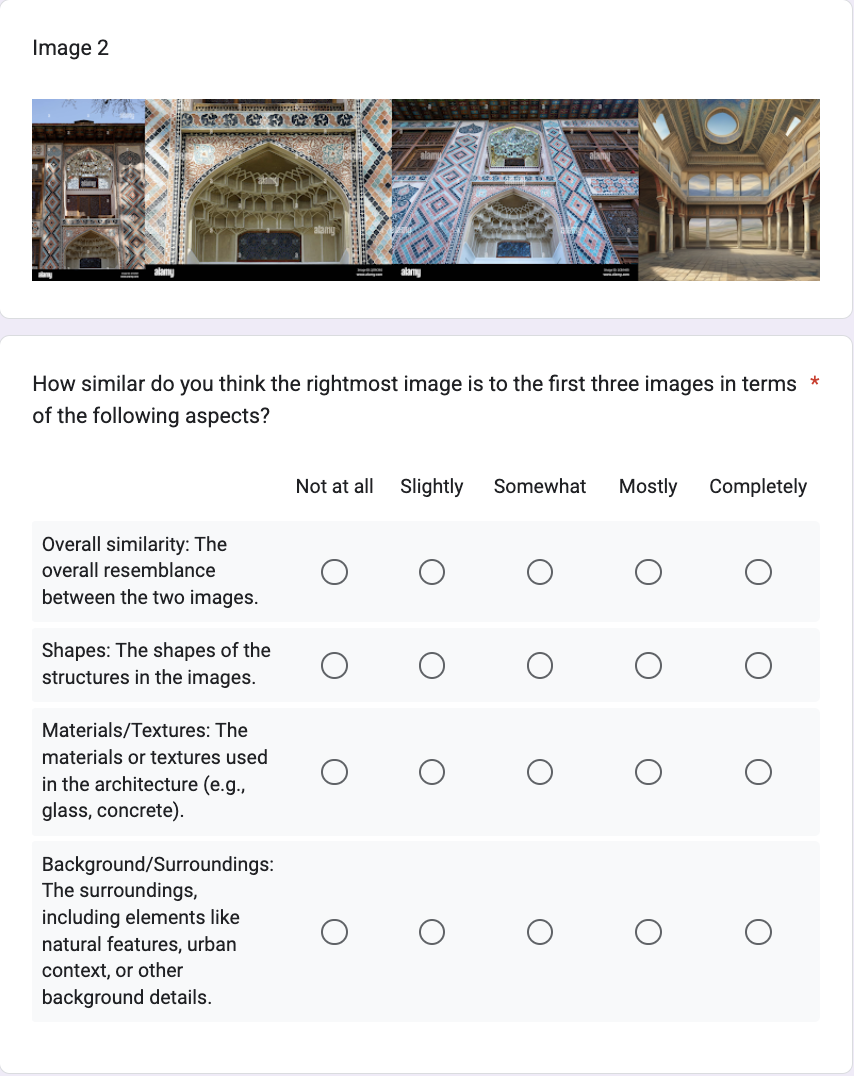
A critical part of our experimental design involved human annotation to assess the cultural and contextual relevance of AI-generated images. We first created a survey comprising 150 images for all ten countries (e.g., United States, China, Azerbaijan, Indonesia), where the images for each country were equally divided across three categories: architecture, clothing, and food items. Each survey included a set of four images for each artifact: three real images (collected via web scraping) and one AI-generated image (produced by one of the three diffusion models).
To prevent model bias, each human annotator was distributed with randomly selected images generated from one of three diffusion models for each question. Three human annotators from each country participated in the study, ensuring cultural familiarity and context-specific insights. All 30 annotators were asked to evaluate each image based on the following multiple-choice questions:
Image-image similarity scores
are collected for each category as follows:
-
•
Architecture: How similar is the rightmost image (i.e., AI-generated image) to the first three images (i.e., real reference images) in terms of overall similarity, shapes, materials/textures, and background/surroundings?
-
•
Clothing: How similar is the rightmost image to the first three images in terms of overall similarity, color/texture, design/patterns, and background elements?
-
•
Food: How similar is the rightmost image to the first three images regarding overall similarity, presentation/plating, colors/textures, and ingredients/components?
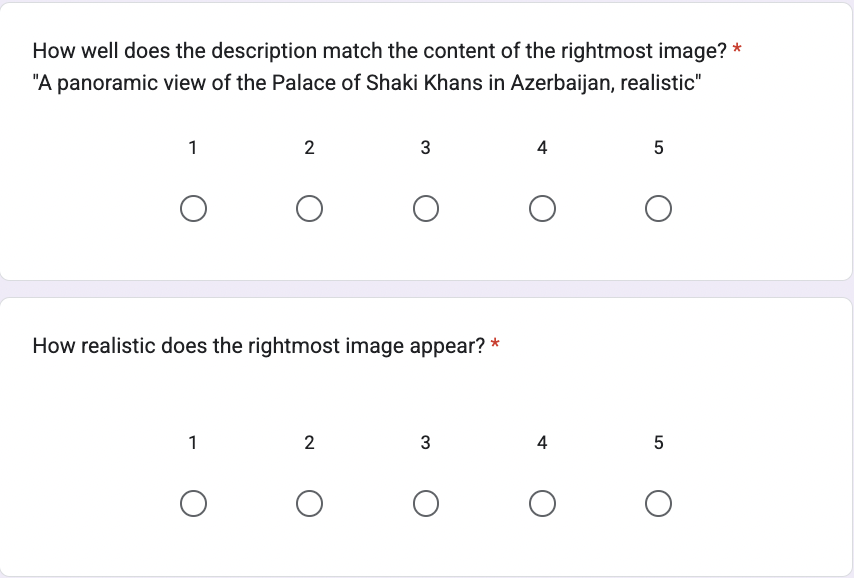
Image-text alignment scores
are calculated how well the description (i.e., prompts mentioned in Section 3.1) matches the content of the AI-generated image?
Realism scores
are assessed based on how realistic the AI-generated image appears.
Each question for these three multiple-choice subquestions was rated using a Likert scale of 1 to 5: (1) Not at all, (2) Slightly, (3) Somewhat, (4) Mostly, (5) Completely, allowing annotators to express their level of agreement or similarity with the presented image (detailed in Appendix A.2). We recruited 30 annotators from 10 countries: Azerbaijan, Pakistan, Ethiopia, South Korea, Indonesia, China, Spain, Mexico, the United States, and the United Kingdom. Annotators from the first five countries were recruited through college communities, while those from the remaining countries were recruited via the Prolific666https://www.prolific.com crowdsourcing platform. The recruitment on Prolific involved screening participants based on their location, nationality, and birthplace.
3.3 Model Evaluation
3.3.1 Pair and Dataset Creation
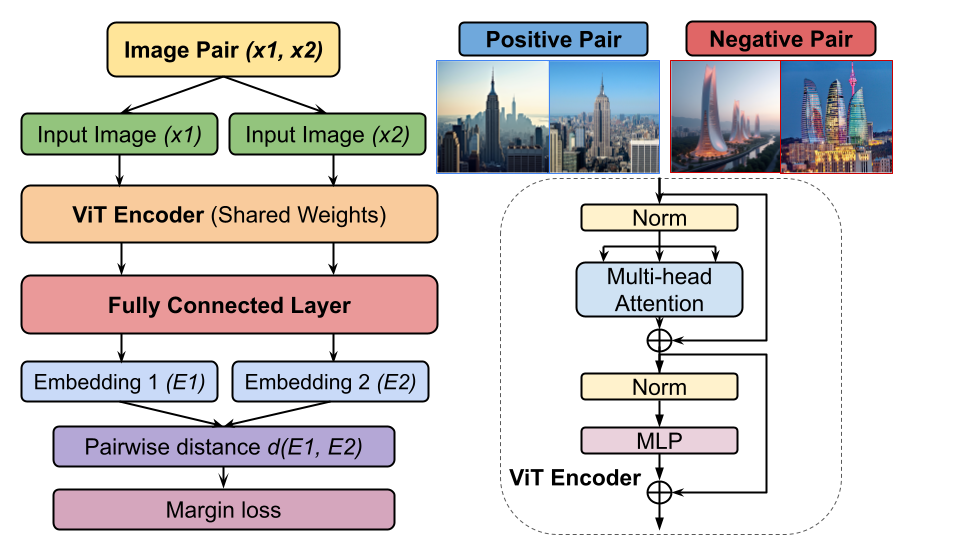
Our training data consists of real image and real-synthetic image pairs, ensuring a rich, wide variety of training samples. Specifically, we constructed the following image pairs:
Real image pairs: Positive pairs consist of real images of the same artifact (e.g., two images of the Flame Towers in Azerbaijan), while negative pairs include real images of different artifacts from the same country or any artifacts from different countries (e.g., the Flame Towers vs. the Empire State Building).
Real-synthetic image pairs: The positive image pairs generated by diffusion models (as described in Section 3.1) with an average image-image similarity score , paired with three real images used in the human evaluation. The negative pairs consist of AI-generated images with an average image-image similarity score , paired with three real images similar to the positive pairs.
We split our dataset using disjoint prompts for each set to ensure no overlap between the training, validation, and test sets. We selected 30 random prompts for the training set, 10 for the validation set, and 10 for the test set, along with their respective pairs from each model, across all categories and countries. In total, the training set consists of approximately 11k image pairs, while both the validation and test sets contain 2.7k image pairs each. The training set includes both real image pairs and real-synthetic image pairs, while the validation and test sets consist solely of real-synthetic image pairs, with no overlapping images between the sets.
3.3.2 Similarity Metric
To build a model-based image-image similarity metric, CultDiff-S, we adopted a contrastive learning approach, utilizing Vision Transformers (ViT) (Alexey, 2020) to learn embeddings for both real and AI-generated images, as illustrated in Figure 2. The global attention mechanism in ViT enables effective "local-to-global" correspondence, enhancing self-supervised learning (Caron et al., 2021; Mo et al., 2023). This ViT property is particularly important in our work, where it helps evaluate the cultural and contextual relevance of images by capturing both local features and their broader context. To achieve this, we employed a weighted margin loss during the training process, utilizing the scores (collected from our human annotation process explained in Section 3.2) as weights (, in the equation below, motivated by previous studies that utilized GPT feedback scores as the weights in building sentence embedding models Cheng et al. (2023); An et al. (2024). These scores are normalized to 0 to 1 and applied to their corresponding real-synthetic (human-annotated) positive and negative image pairs. For real-image pairs that were not annotated by humans, we assigned a default weight of . Our margin loss is defined as:
where denotes the weight derived from the normalized human score when available (default is 1.0), represents the Euclidean distance between the embeddings of a pair of images (), and is the embedding function learned by the Vision Transformer. The binary label indicates whether a pair is positive () or negative (). The margin enforces a minimum distance between embeddings of negative pairs, while is the total number of image pairs in the batch.
This loss function is optimized to make the model learn to (1) push the positive image pairs together and pull the negative image pairs apart and (2) assign importance to pairs with human judgment scores. The second goal guides the model to attend more to the image pairs with higher human scores and less with lower human scores.
4 Results
4.1 Benchmark Results and Analysis
4.1.1 Overall Image-Image Similarity
We first analyze the similarity results (image-image similarity scores) of the real and generated images from the survey’s first question (Q1), which examined various aspects of similarity. In particular, Q1.1 asked participants to rate the overall similarity. Table 1 highlights the average scores for all countries across three models. The first half of Table 1 summarizes the country results: overrepresented countries (South Korea, USA, UK, Mexico) predominantly occupy the top half (highest scores), while underrepresented countries (Azerbaijan, Ethiopia) are mostly in the lower half, with some exceptions.
Q1.2 specifically addressed distinct features: shapes for architectural structures, color/texture for clothing, and presentation/plating for food. The results, summarized in Table 1, highlight that the USA, UK, and South Korea consistently ranked among the highest-scoring countries across all categories and models. In contrast, Ethiopia and Indonesia frequently appeared in the lower half of the rankings. Interestingly, China also consistently received some of the lowest scores in this analysis. These findings suggest a need for the development of diffusion models that better represent underrepresented countries, such as Ethiopia and Indonesia, to improve their cultural and contextual accuracy compared to overrepresented countries like the USA, UK, and South Korea.
4.1.2 Image-Description Match
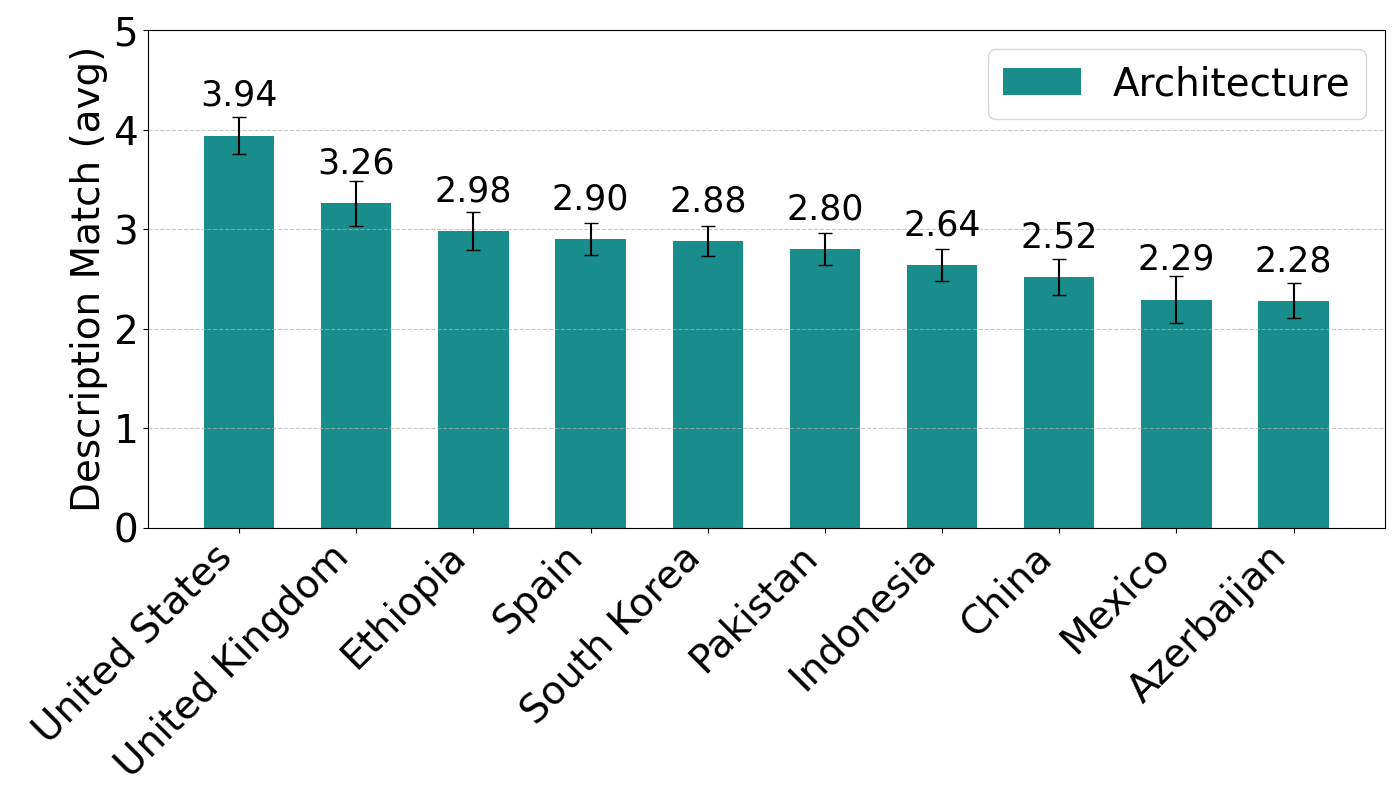
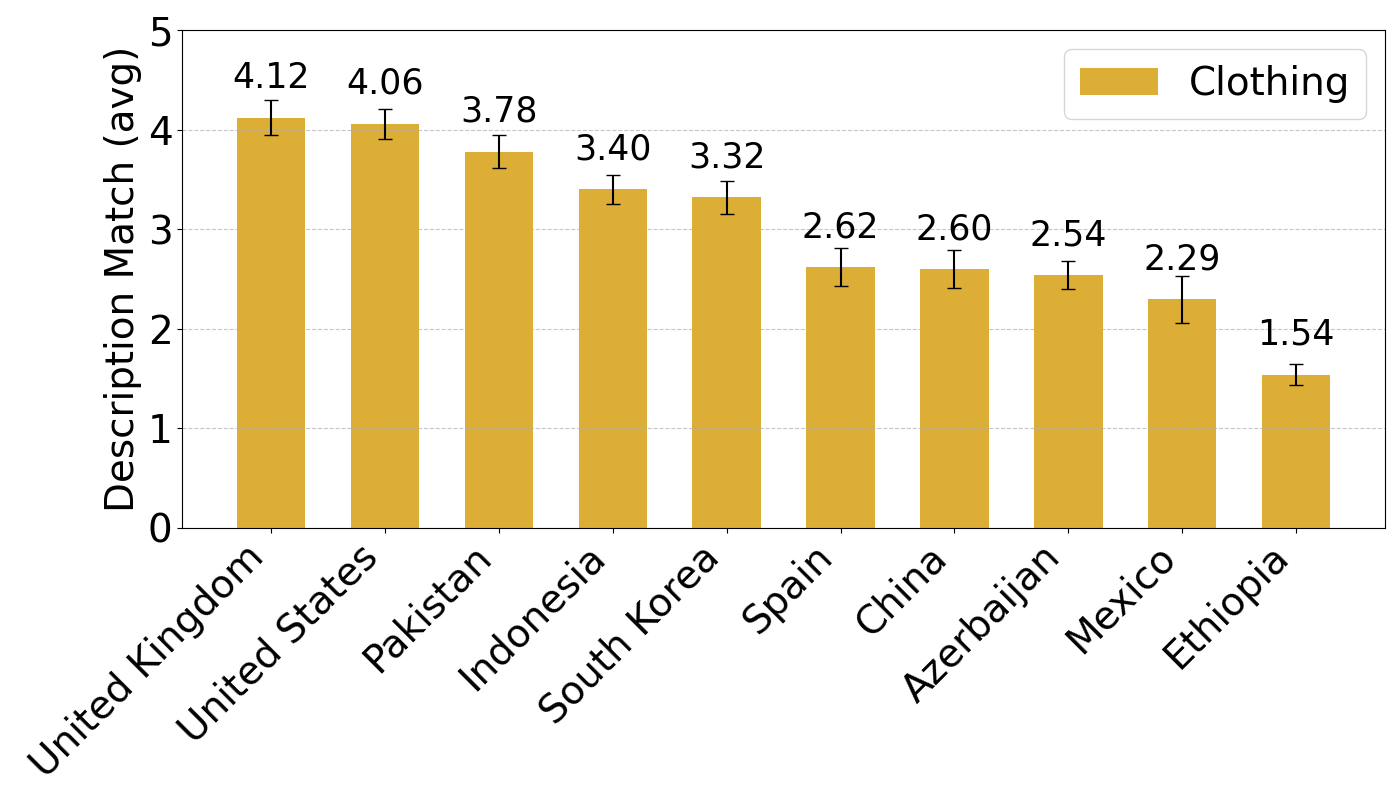
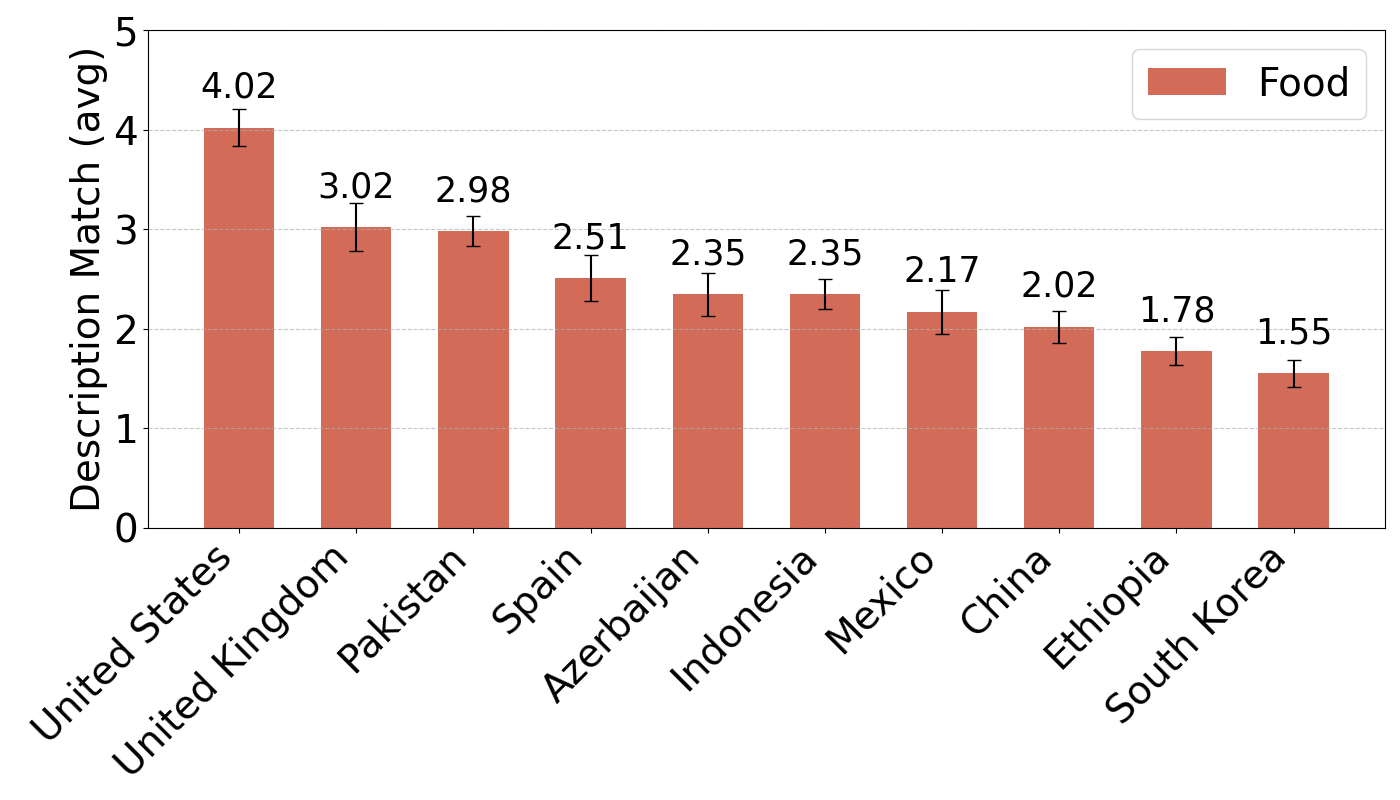
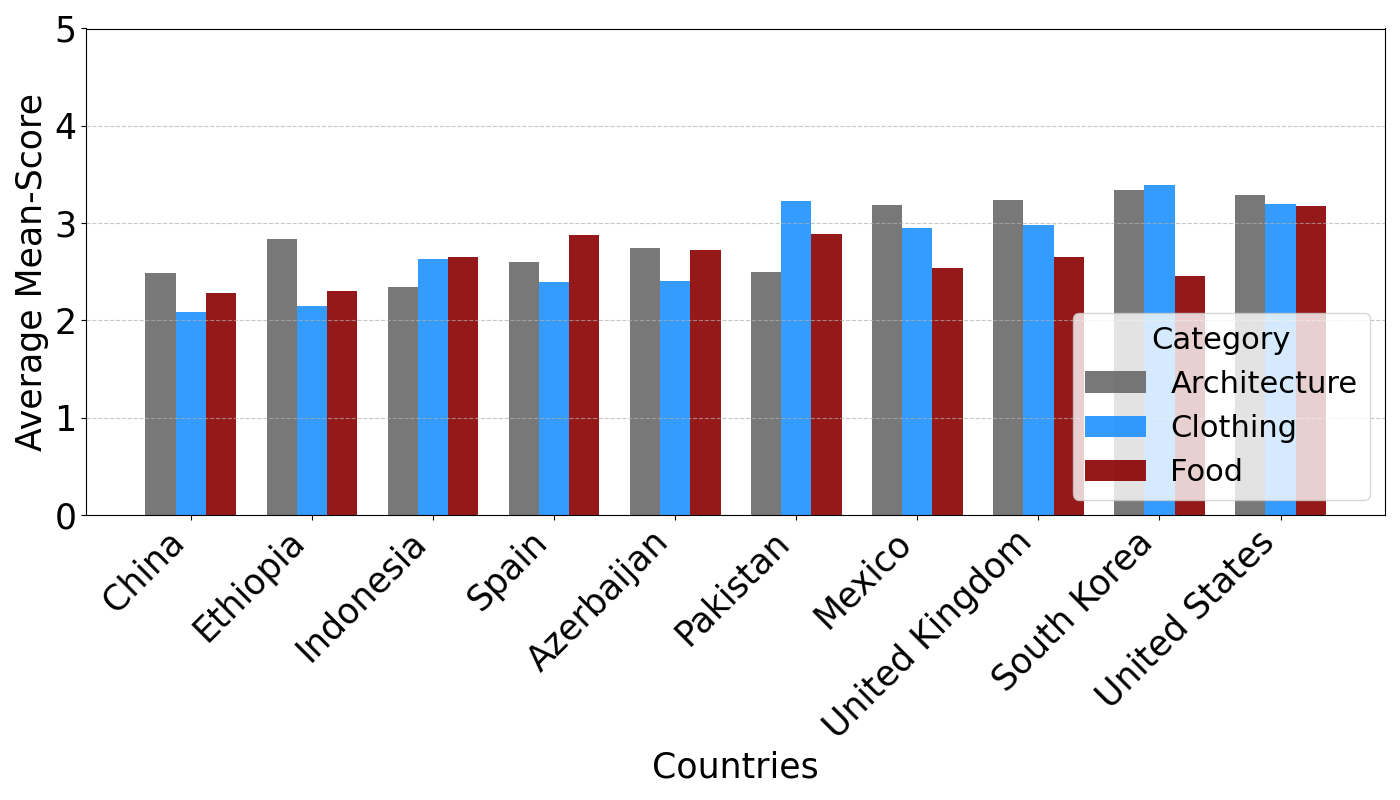
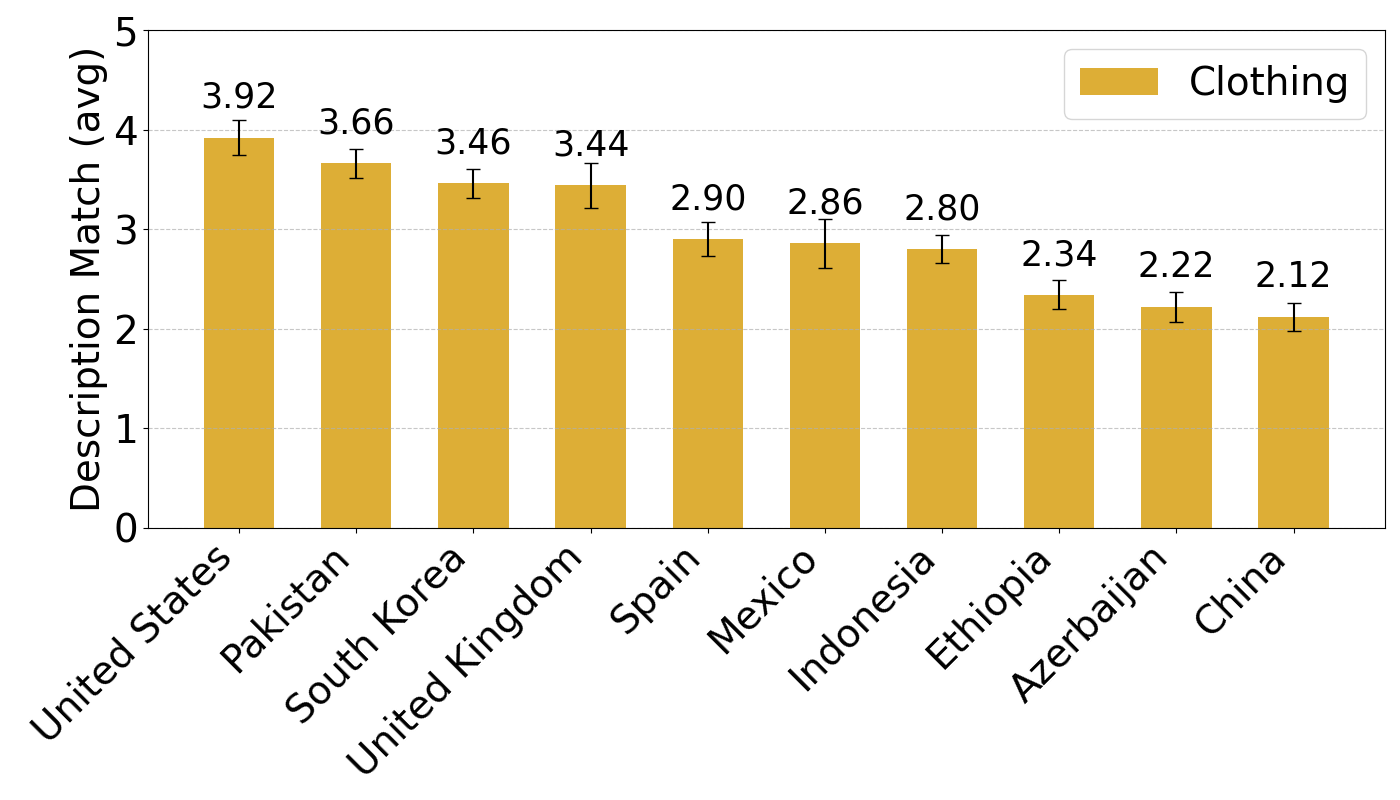
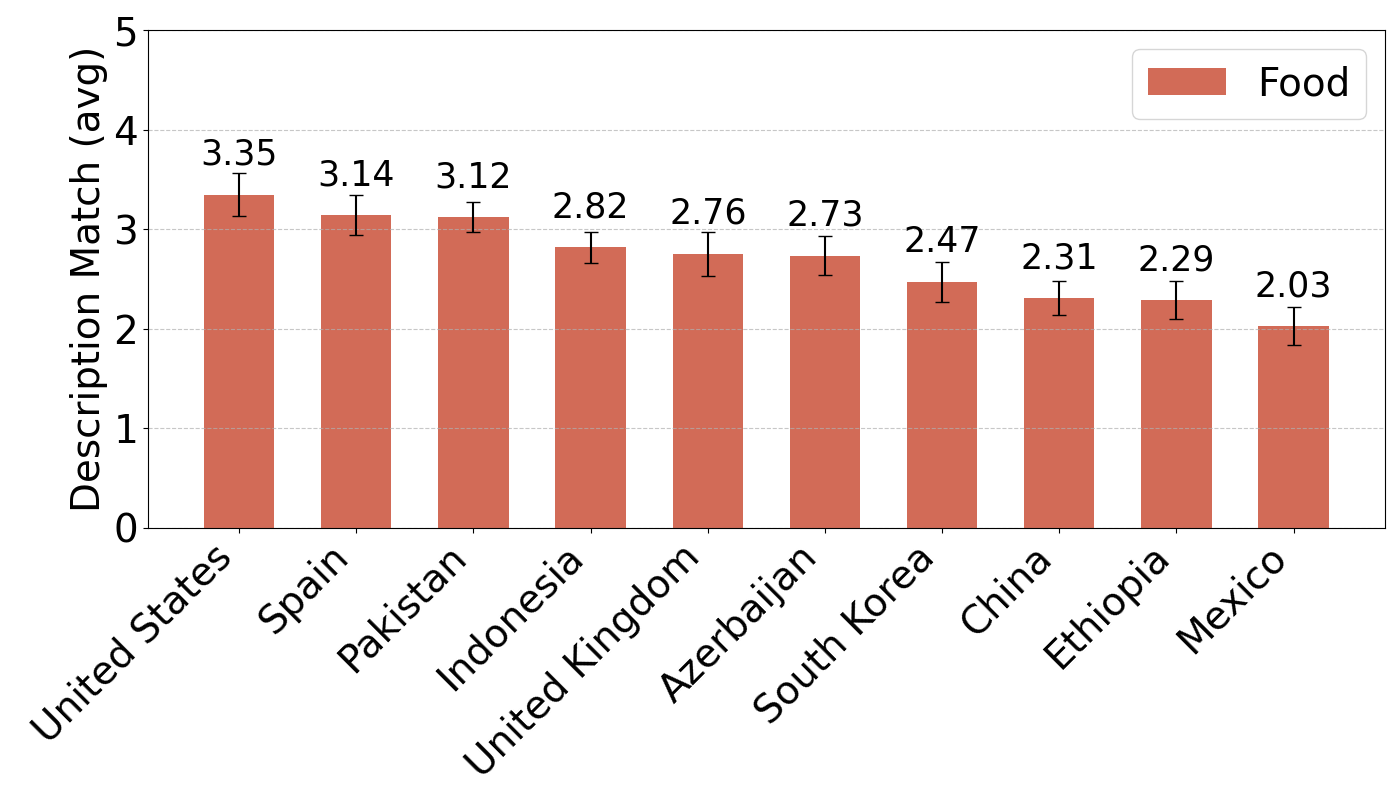
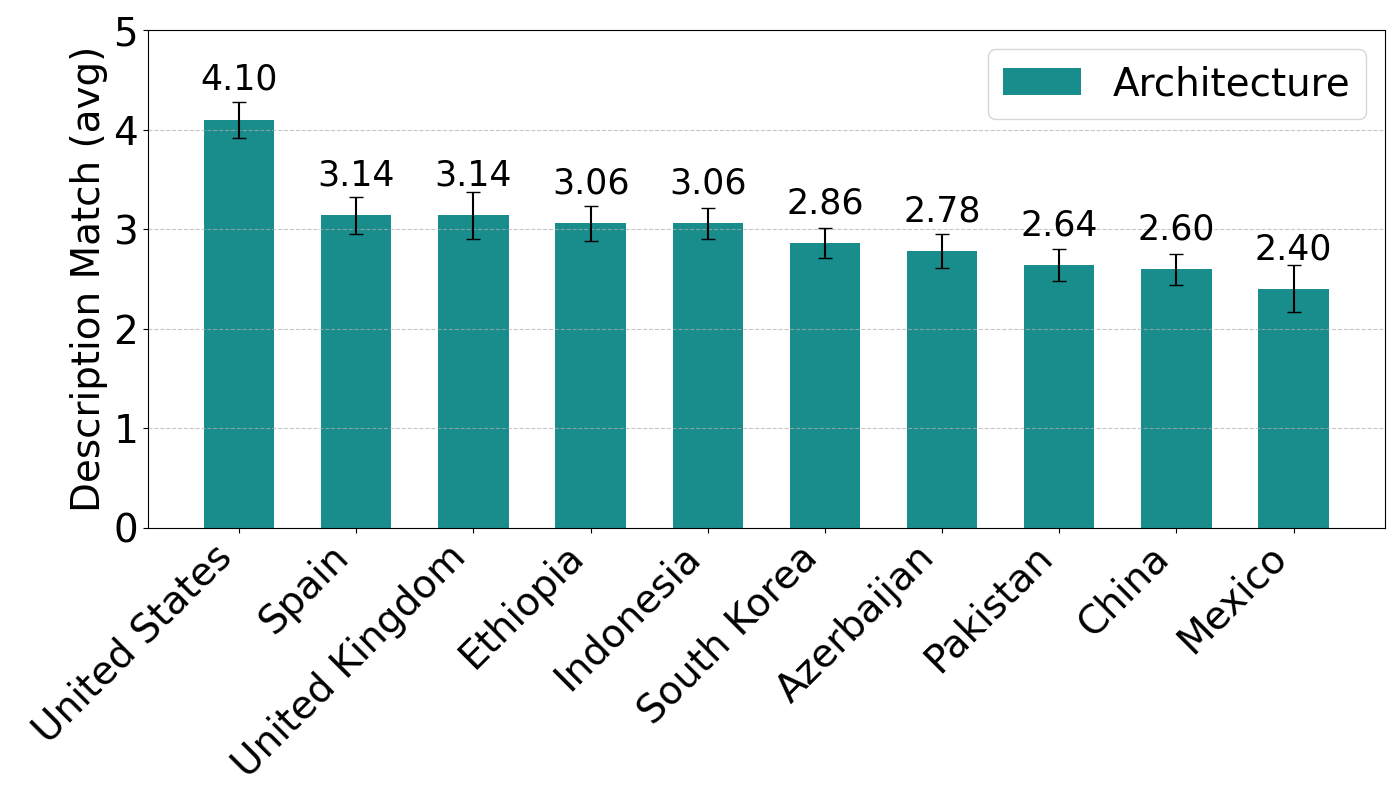
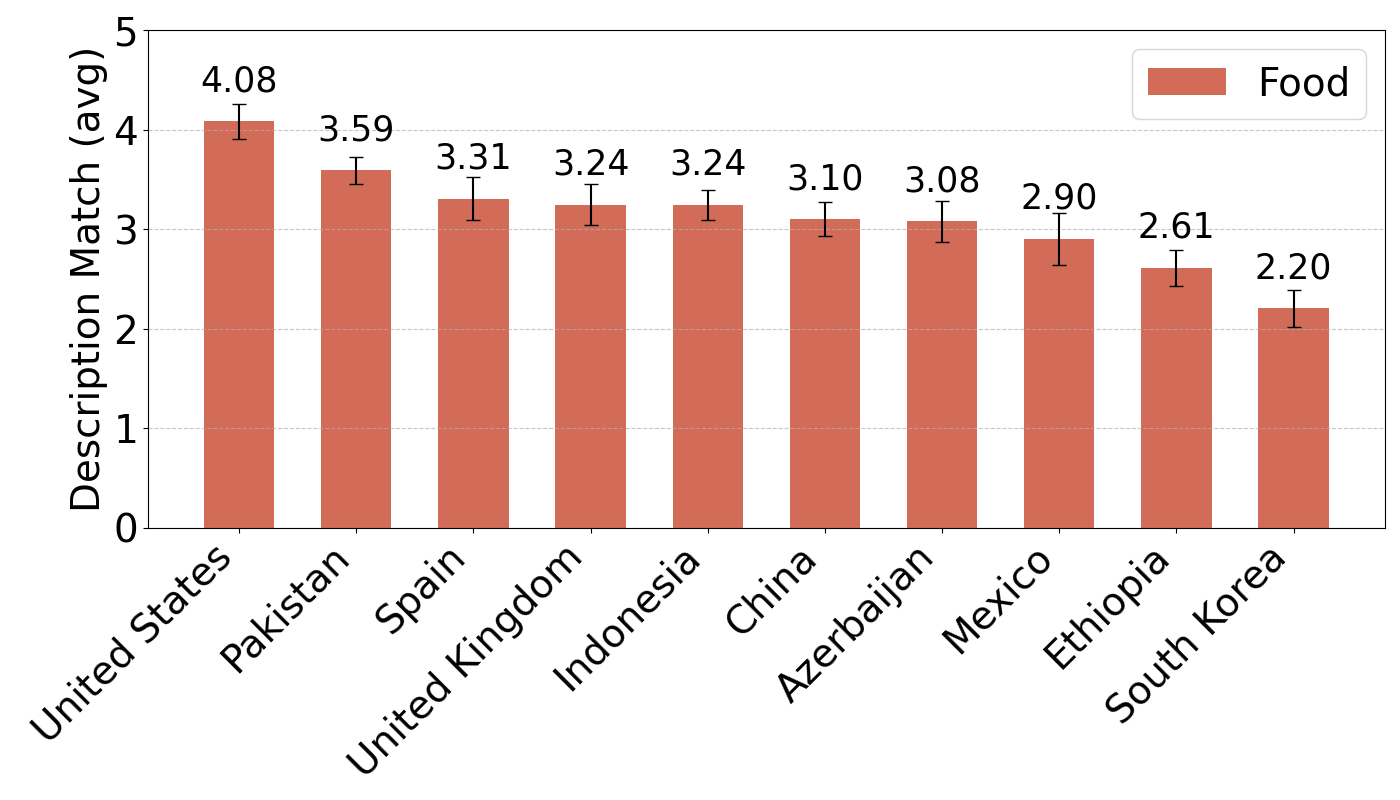
Our analysis focused on the responses to the second question (Q2), which assessed the fidelity of the generated content to the provided description. Figure 3 presents the results for the FLUX model’s outputs across architecture, clothing, and food, respectively (refer to Appendix A.3 for results from other models).
The United States and the United Kingdom consistently achieved the highest average fidelity scores across all three categories. In contrast, Azerbaijan, South Korea, and Ethiopia recorded the lowest average scores of 2.28, 1.55, and 1.54 in the architecture, food, and clothing categories, respectively. Nevertheless, these average scores reveal a noticeable gap between the scores of the United States and those of other countries across all categories. These results suggest a potential bias in the model, favoring countries with a more extensive cultural presence on the internet. Addressing this limitation by incorporating more diverse and balanced datasets could improve the model’s fidelity for underrepresented countries and enhance its overall cultural accuracy Ananthram et al. (2024); Liu et al. (2025).
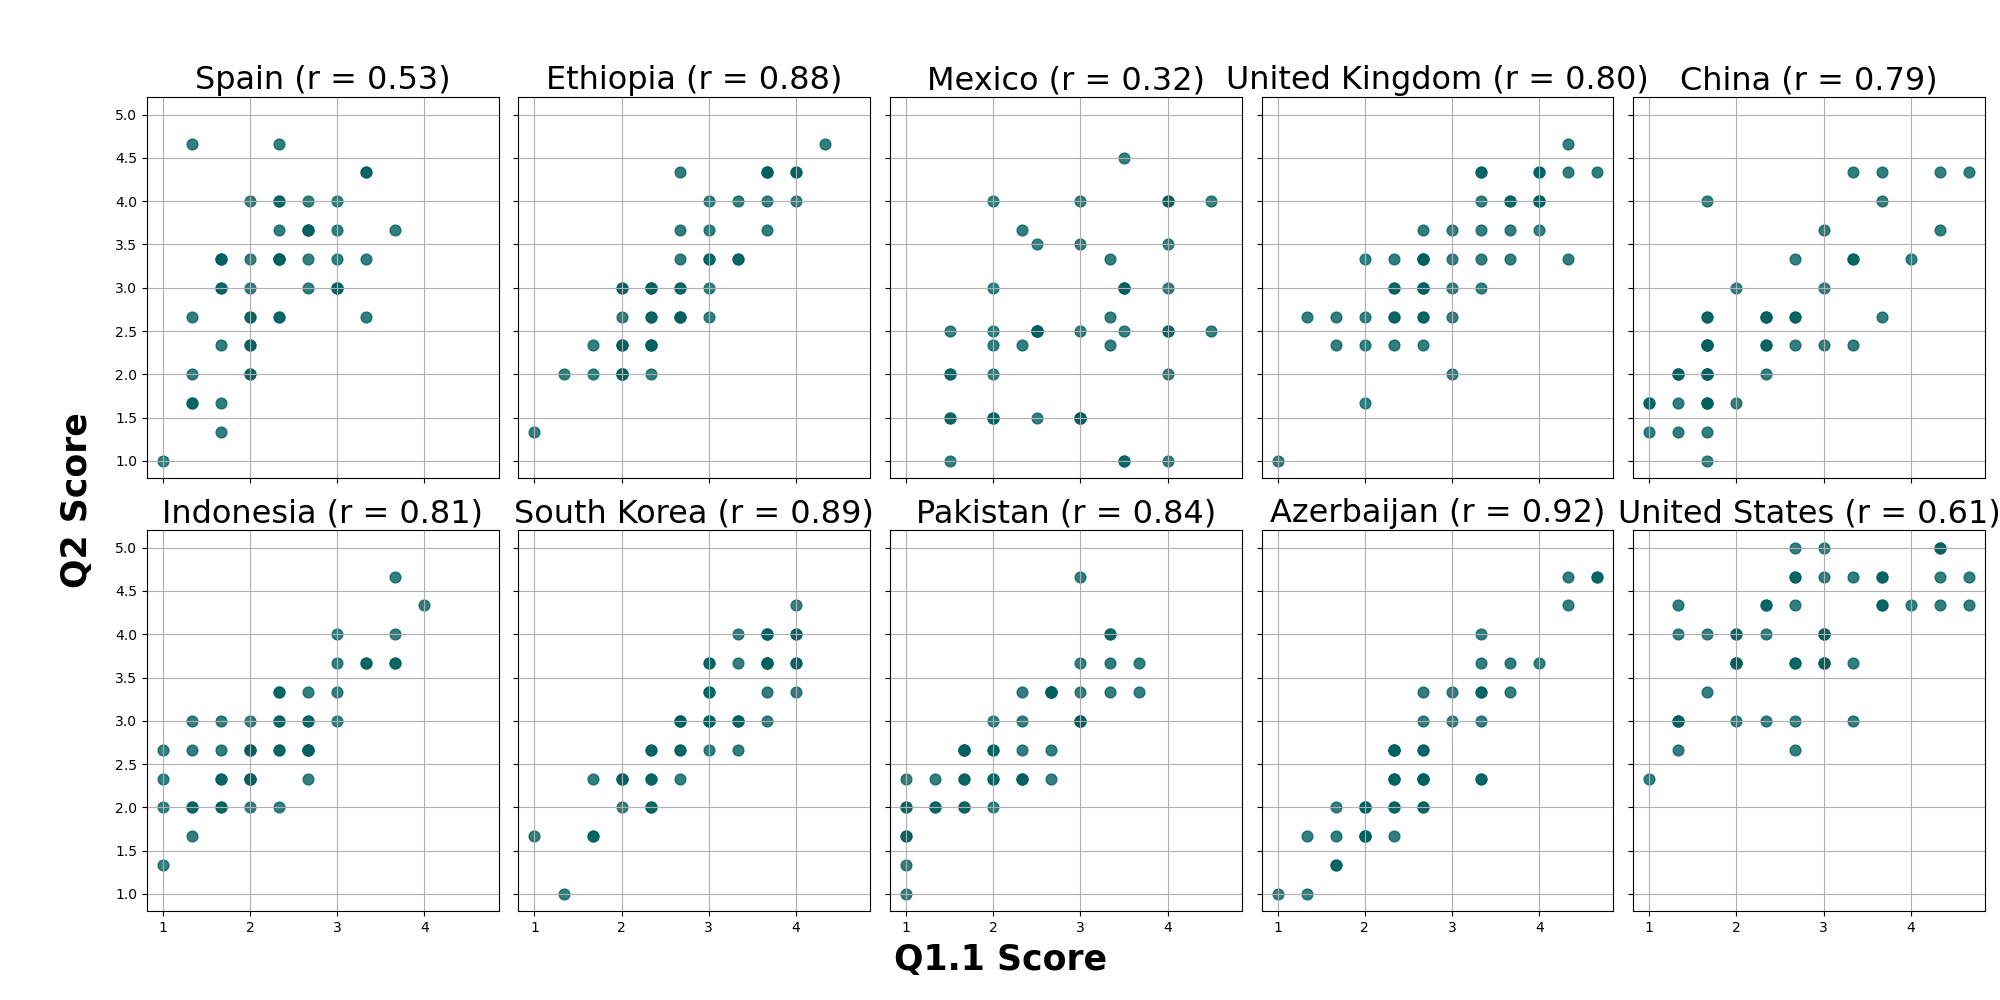
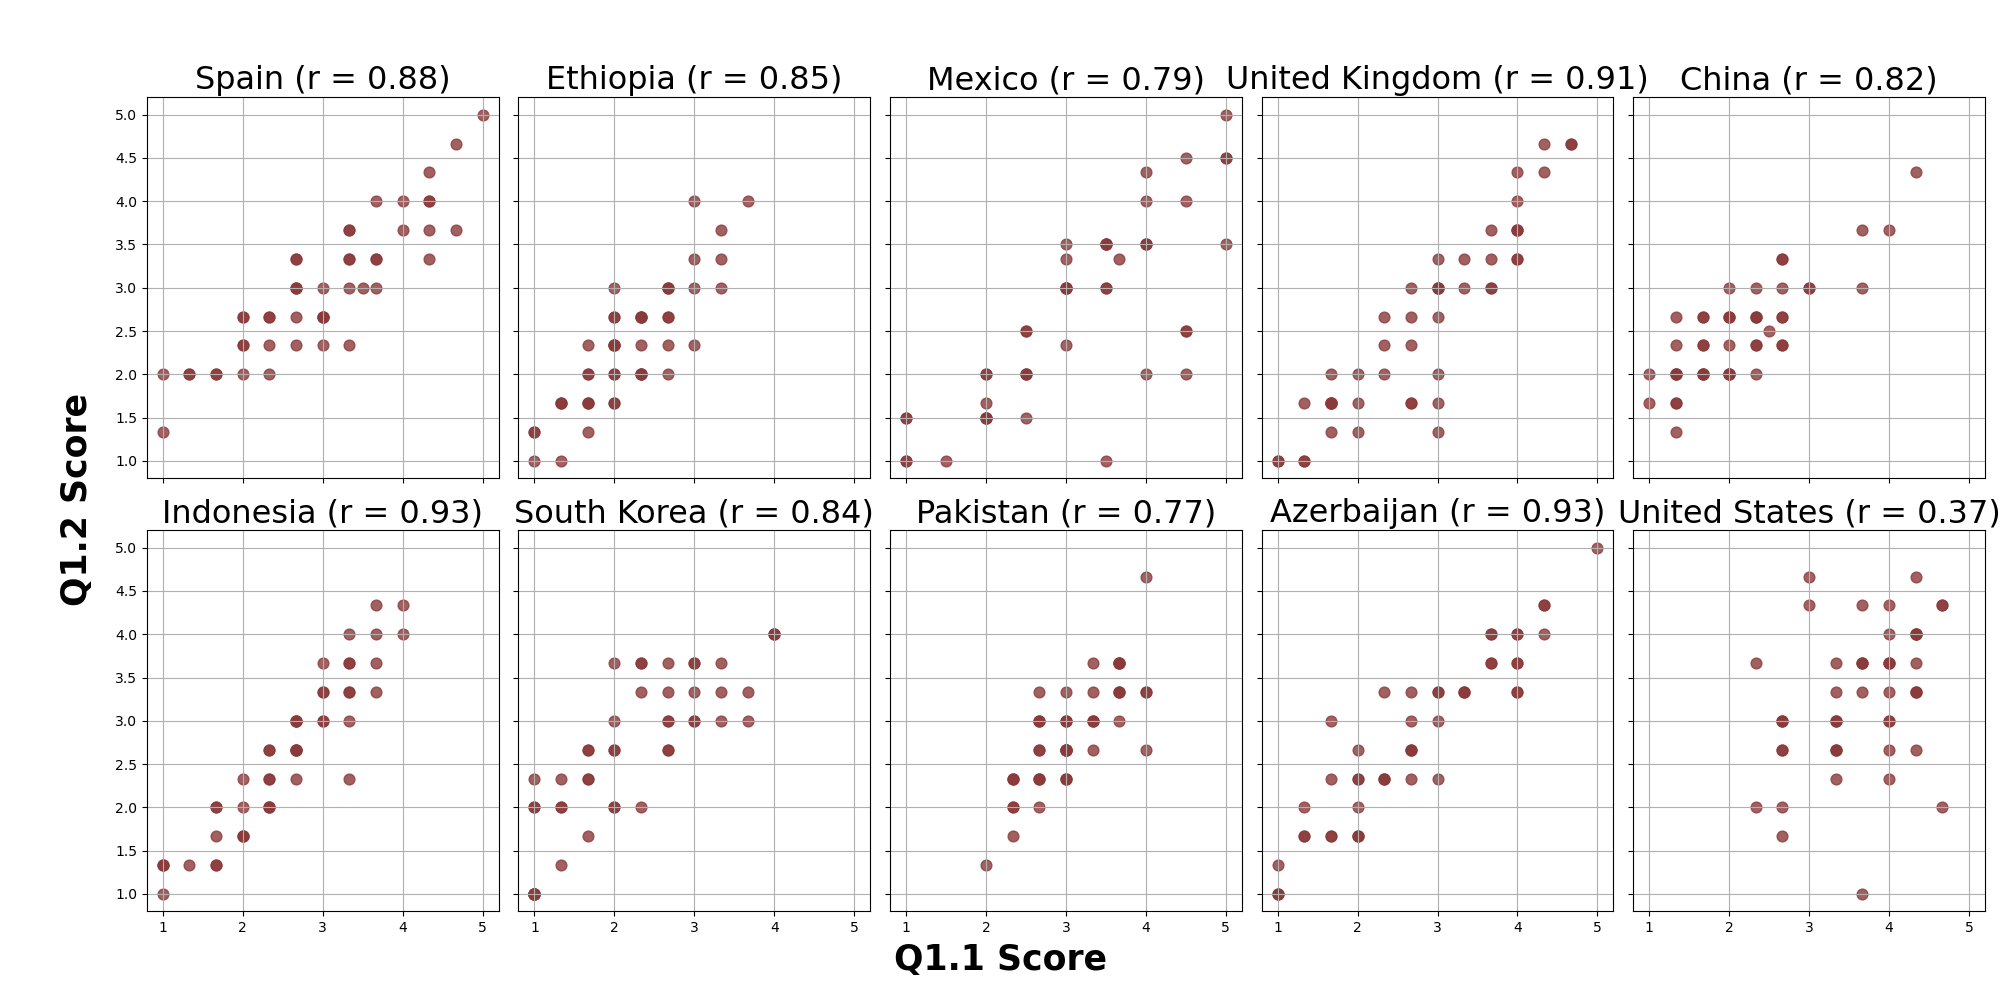
We also visualized the correlations between responses to the overall similarity question (Q1.1) for real and generated images and the text-image alignment score (Q2). As shown in Figure 4, most countries exhibit a strong positive Pearson correlation coefficient () in the Food category (refer to Appendix A.4 for results on architecture and clothing), indicating consistent agreement between Q1.1 and Q2 responses across most countries.
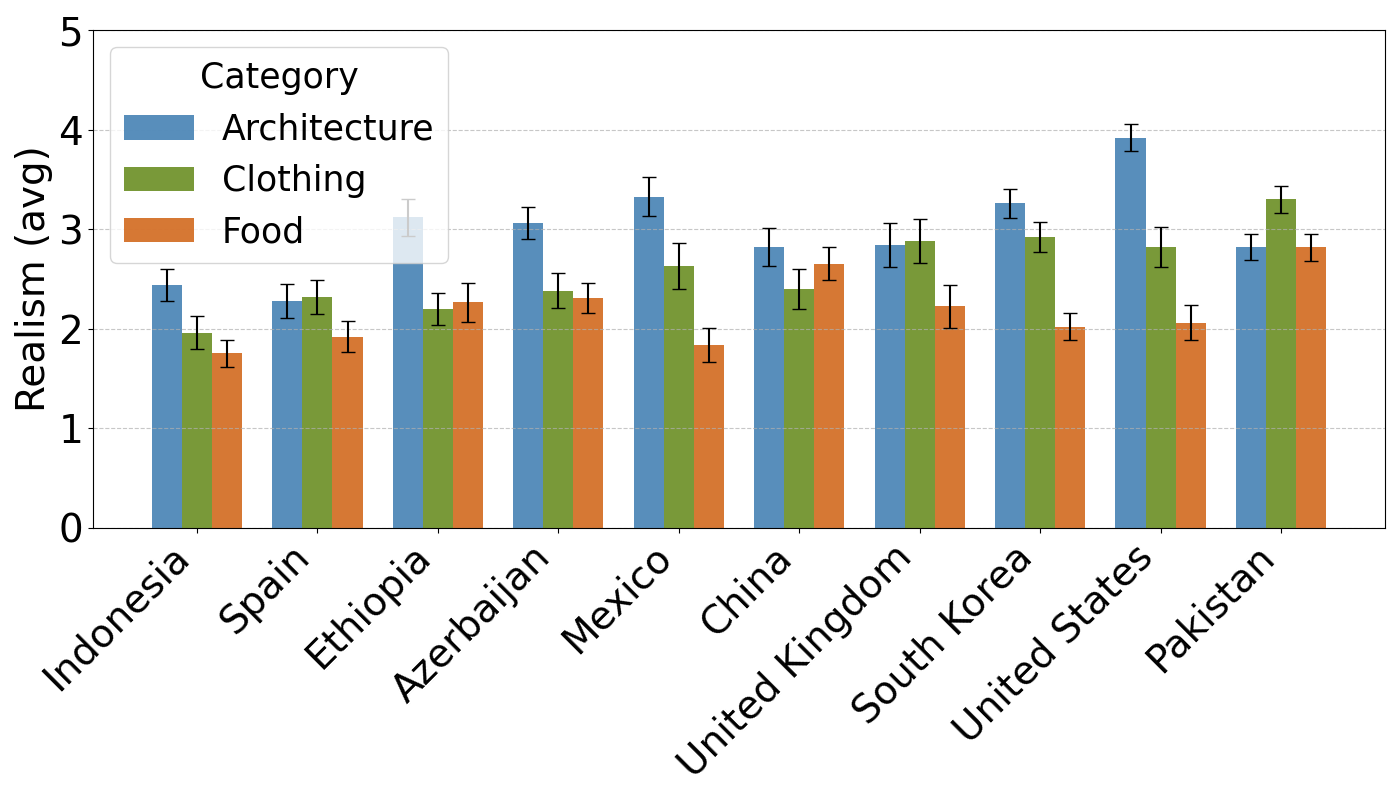
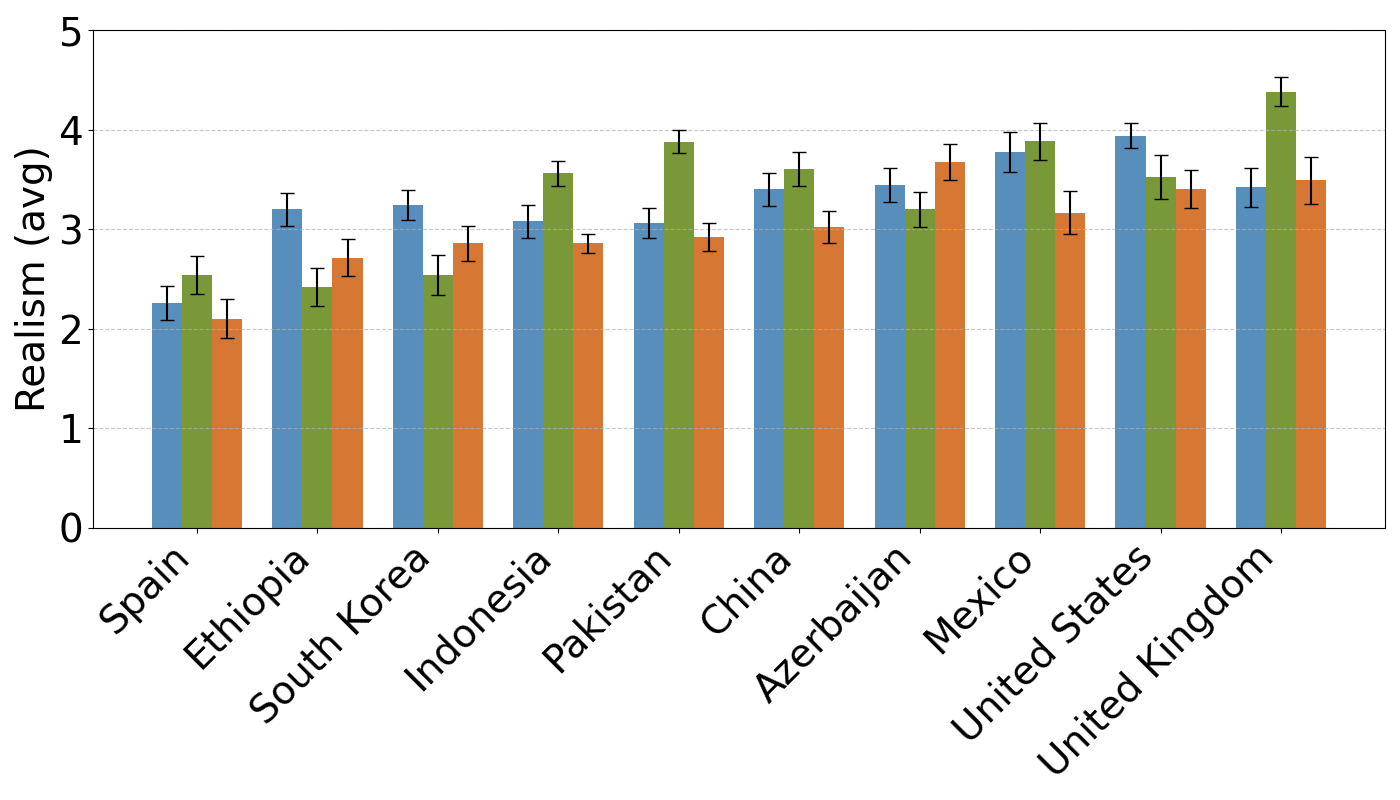
4.1.3 Realism
The third question, which focused on rating the realism of the generated images, is visualized in the bar graphs in Figure 5. The FLUX model’s output shows that realism scores are relatively higher for the United Kingdom, United States, and Mexico, while Spain, Ethiopia, and South Korea have lower scores. In contrast, the Stable Diffusion 3 Medium model exhibits relatively consistent realism scores across all countries. Meanwhile, the Stable Diffusion XL model demonstrates slightly lower average realism scores across all countries and categories compared to the other two models.
| Similarity Metrics | Spearman | Pearson | Kendall | Kendall |
| SISM | 0.0458 | 0.0464 | 0.0315 | 0.0324 |
| FID | -0.1078 | -0.1085 | -0.0768 | -0.0783 |
| LPIPS | -0.1352 | -0.1376 | -0.1002 | -0.1029 |
| CultDiff-S | 0.1848 | 0.1559 | 0.1278 | 0.1312 |
4.2 Similarity Metric Analysis
After training the similarity model, we evaluated its performance using our test dataset pairs. For each evaluation pair, we computed additional similarity metrics, including Fréchet Inception Distance (FID) (Heusel et al., 2017), Learned Perceptual Image Patch Similarity (LPIPS) (Zhang et al., 2018), and the Structural Similarity Index Measure (SSIM) (Wang et al., 2004). Additionally, we calculated the correlation between image-image similarity scores—derived by averaging the responses to the first four questions in the survey—and each of these similarity metrics. In our metric model, we compute the cosine similarity of the embeddings produced by the model during evaluation as the final similarity score. The results of these correlations are summarized in Table 2. The proposed metric, CultDiff-S, achieves notably higher correlation values, suggesting the usefulness of using our automatic pre-trained image-image metric, showing potential to replace the previous metrics.
5 Discussion
5.1 Human-Aligned Image-Image Similarity Evaluation Metric
Designing an image-image similarity metric that closely correlates with human rankings is inherently difficult due to the complexity of cultural attributes and subjective interpretations. Culture itself is a broad and multifaceted concept, making it challenging to define in a universally accepted manner Liu et al. (2024a). In fact, many previous studies in related domains that incorporate cultural aspects either provide only a high-level definition or avoid in-depth discussions on its nuances Adilazuarda et al. (2024); Huang and Yang (2023); Zhou et al. (2023); Cao et al. (2024a); Wan et al. (2023). In our study, we treated countries as representatives of distinct cultures. However, individuals, even within the same country, may have diverse interpretations of cultural artifacts, reflecting regional, ethnic, and personal differences in cultural perception, which can lead to subjective similarity scores given by human annotators. Additionally, cultural artifacts often evolve over time, influenced by various internal or external factors, further complicating the task of cultural representations. As a result, an effective similarity metric that correlates more closely with human perception must account for both objective attributes, such as structural and visual features, and subjective factors, including historical context, regional variations, and personal interpretations. We believe that developing such a metric necessitates integrating human feedback into the process, combining both data-driven approaches and human-centered evaluations to bridge the gap, as has been demonstrated in other contexts and domains in prior works Xu et al. (2023); Stiennon et al. (2020); Ouyang et al. (2022), as well as in our research.
5.2 Culturally Aware Diffusion Models
Recent advancements in fine-tuning diffusion models have demonstrated significant improvement Ruiz et al. (2023). Following similar approaches in cultural contexts, fine-tuning diffusion models on smaller, culturally-curated datasets has been shown to lead to more culturally relevant image generation Liu et al. (2023). While approaches relying on large culture-specific datasets, such as Japanese Stable Diffusion Shing and Sawada (2022), have been generally successful in enhancing cultural awareness for specific cultures, the limited resource presence of underrepresented cultures creates a challenge for applying similar methods. In this context, our dataset further provides a foundation for incorporating data from underrepresented cultures/countries, broadening the reach of culturally inclusive image generation. We hope that our work will inspire further research into improving the fairness of T2I generation models, particularly by expanding representation for low-resource cultures in both model training and evaluation.
6 Conclusion
In this paper, we assessed the cultural awareness diffusion models spanning 10 countries and 3 categoriessingby our proposed CultDiff Benchmark Dataset. Our human evaluations of various aspects—such as the similarity of AI-generated images to real counterparts, description fidelity, and realism—revealed that the diffusion models exhibit better cultural awareness for high-resource countries than low-resource countries, such as Ethiopia, Azerbaijan, and Indonesia. Furthermore, we proposed an automatic image-image similarity metric that shows improvement in correlating with human judgments to evaluate cultural aspects.
Limitations
The main limitation of our work lies in recruiting only three annotators per country due to budget constraints, similar to most human experiments in other studies. While we could derive valuable insights from the human evaluation results, increasing the number of survey participants per country would enhance the robustness and generalizability of our findings.
Ethical Statement
This study was conducted with prior approval from the Institutional Review Board (IRB), ensuring adherence to ethical research standards. All participants recruited through Prolific were compensated at a competitive rate (18 pounds 22.38 USD in January 2025), meeting or exceeding ethical guidelines. Similarly, participants recruited directly, primarily from low-resource countries, were fairly compensated (30K KRW 20.89 USD in January 2025).
To ensure the appropriateness of the materials, all generated images were reviewed by the authors before being provided to the annotators. Additionally, we included a question at the end of the survey asking whether each image was inappropriate or disturbing. All annotators responded "No" to this question, confirming the suitability of the content used in the study.
References
- Adilazuarda et al. (2024) Muhammad Farid Adilazuarda, Sagnik Mukherjee, Pradhyumna Lavania, Siddhant Singh, Alham Fikri Aji, Jacki O’Neill, Ashutosh Modi, and Monojit Choudhury. 2024. Towards measuring and modeling" culture" in llms: A survey. arXiv preprint arXiv:2403.15412.
- Alexey (2020) Dosovitskiy Alexey. 2020. An image is worth 16x16 words: Transformers for image recognition at scale. arXiv preprint arXiv: 2010.11929.
- An et al. (2024) Na Min An, Sania Waheed, and James Thorne. 2024. Capturing the relationship between sentence triplets for llm and human-generated texts to enhance sentence embeddings. In Findings of the Association for Computational Linguistics: EACL 2024, pages 624–638.
- Ananthram et al. (2024) Amith Ananthram, Elias Stengel-Eskin, Carl Vondrick, Mohit Bansal, and Kathleen McKeown. 2024. See it from my perspective: Diagnosing the western cultural bias of large vision-language models in image understanding. arXiv preprint arXiv:2406.11665.
- Basu et al. (2023) Abhipsa Basu, R Venkatesh Babu, and Danish Pruthi. 2023. Inspecting the geographical representativeness of images from text-to-image models. In Proceedings of the IEEE/CVF International Conference on Computer Vision, pages 5136–5147.
- Betker et al. (2023) James Betker, Gabriel Goh, Li Jing, Tim Brooks, Jianfeng Wang, Linjie Li, Long Ouyang, Juntang Zhuang, Joyce Lee, Yufei Guo, et al. 2023. Improving image generation with better captions. Computer Science. https://cdn. openai. com/papers/dall-e-3. pdf, 2(3):8.
- Birhane et al. (2021) Abeba Birhane, Vinay Uday Prabhu, and Emmanuel Kahembwe. 2021. Multimodal datasets: misogyny, pornography, and malignant stereotypes. arXiv preprint arXiv:2110.01963.
- Blattmann et al. (2023) Andreas Blattmann, Robin Rombach, Huan Ling, Tim Dockhorn, Seung Wook Kim, Sanja Fidler, and Karsten Kreis. 2023. Align your latents: High-resolution video synthesis with latent diffusion models. In Proceedings of the IEEE/CVF Conference on Computer Vision and Pattern Recognition, pages 22563–22575.
- Cao et al. (2024a) Yong Cao, Yova Kementchedjhieva, Ruixiang Cui, Antonia Karamolegkou, Li Zhou, Megan Dare, Lucia Donatelli, and Daniel Hershcovich. 2024a. Cultural adaptation of recipes. Transactions of the Association for Computational Linguistics, 12:80–99.
- Cao et al. (2024b) Yong Cao, Wenyan Li, Jiaang Li, Yifei Yuan, Antonia Karamolegkou, and Daniel Hershcovich. 2024b. Exploring visual culture awareness in gpt-4v: A comprehensive probing. arXiv preprint arXiv:2402.06015.
- Caron et al. (2021) Mathilde Caron, Hugo Touvron, Ishan Misra, Hervé Jégou, Julien Mairal, Piotr Bojanowski, and Armand Joulin. 2021. Emerging properties in self-supervised vision transformers. In Proceedings of the IEEE/CVF international conference on computer vision, pages 9650–9660.
- Chen et al. (2023) Yunzhuo Chen, Naveed Akhtar, Nur Al Hasan Haldar, and Ajmal Mian. 2023. On quantifying and improving realism of images generated with diffusion. arXiv preprint arXiv:2309.14756.
- Cheng et al. (2023) Qinyuan Cheng, Xiaogui Yang, Tianxiang Sun, Linyang Li, and Xipeng Qiu. 2023. Improving contrastive learning of sentence embeddings from AI feedback. In Findings of the Association for Computational Linguistics: ACL 2023, pages 11122–11138, Toronto, Canada. Association for Computational Linguistics.
- Esser et al. (2024) Patrick Esser, Sumith Kulal, Andreas Blattmann, Rahim Entezari, Jonas Müller, Harry Saini, Yam Levi, Dominik Lorenz, Axel Sauer, Frederic Boesel, et al. 2024. Scaling rectified flow transformers for high-resolution image synthesis. In Forty-first International Conference on Machine Learning.
- Gaviria Rojas et al. (2022) William Gaviria Rojas, Sudnya Diamos, Keertan Kini, David Kanter, Vijay Janapa Reddi, and Cody Coleman. 2022. The dollar street dataset: Images representing the geographic and socioeconomic diversity of the world. Advances in Neural Information Processing Systems, 35:12979–12990.
- Henrich et al. (2010) Joseph Henrich, Steven J Heine, and Ara Norenzayan. 2010. The weirdest people in the world? Behavioral and brain sciences, 33(2-3):61–83.
- Hessel et al. (2021) Jack Hessel, Ari Holtzman, Maxwell Forbes, Ronan Le Bras, and Yejin Choi. 2021. Clipscore: A reference-free evaluation metric for image captioning. In Proceedings of the 2021 Conference on Empirical Methods in Natural Language Processing, pages 7514–7528.
- Heusel et al. (2017) Martin Heusel, Hubert Ramsauer, Thomas Unterthiner, Bernhard Nessler, and Sepp Hochreiter. 2017. Gans trained by a two time-scale update rule converge to a local nash equilibrium. Advances in neural information processing systems, 30.
- Huang and Yang (2023) Jing Huang and Diyi Yang. 2023. Culturally aware natural language inference. In Findings of the Association for Computational Linguistics: EMNLP 2023, pages 7591–7609.
- Huang et al. (2023) Kaiyi Huang, Kaiyue Sun, Enze Xie, Zhenguo Li, and Xihui Liu. 2023. T2i-compbench: A comprehensive benchmark for open-world compositional text-to-image generation. Advances in Neural Information Processing Systems, 36:78723–78747.
- Jha et al. (2023) Akshita Jha, Aida Mostafazadeh Davani, Chandan K Reddy, Shachi Dave, Vinodkumar Prabhakaran, and Sunipa Dev. 2023. SeeGULL: A stereotype benchmark with broad geo-cultural coverage leveraging generative models. In Proceedings of the 61st Annual Meeting of the Association for Computational Linguistics (Volume 1: Long Papers), pages 9851–9870, Toronto, Canada. Association for Computational Linguistics.
- Jha et al. (2024) Akshita Jha, Vinodkumar Prabhakaran, Remi Denton, Sarah Laszlo, Shachi Dave, Rida Qadri, Chandan Reddy, and Sunipa Dev. 2024. Visage: A global-scale analysis of visual stereotypes in text-to-image generation. In Proceedings of the 62nd Annual Meeting of the Association for Computational Linguistics (Volume 1: Long Papers), pages 12333–12347.
- Joshi et al. (2020) Pratik Joshi, Sebastin Santy, Amar Budhiraja, Kalika Bali, and Monojit Choudhury. 2020. The state and fate of linguistic diversity and inclusion in the nlp world. arXiv preprint arXiv:2004.09095.
- Kannen et al. (2024) Nithish Kannen, Arif Ahmad, Vinodkumar Prabhakaran, Utsav Prabhu, Adji Bousso Dieng, Pushpak Bhattacharyya, Shachi Dave, et al. 2024. Beyond aesthetics: Cultural competence in text-to-image models. In The Thirty-eight Conference on Neural Information Processing Systems Datasets and Benchmarks Track.
- Labs (2023) Black Forest Labs. 2023. Flux. https://github.com/black-forest-labs/flux.
- Li et al. (2024a) Baiqi Li, Zhiqiu Lin, Deepak Pathak, Jiayao Li, Yixin Fei, Kewen Wu, Tiffany Ling, Xide Xia, Pengchuan Zhang, Graham Neubig, et al. 2024a. Genai-bench: Evaluating and improving compositional text-to-visual generation. arXiv preprint arXiv:2406.13743.
- Li et al. (2024b) Huihan Li, Liwei Jiang, Jena D Hwang, Hyunwoo Kim, Sebastin Santy, Taylor Sorensen, Bill Yuchen Lin, Nouha Dziri, Xiang Ren, and Yejin Choi. 2024b. Culture-gen: Revealing global cultural perception in language models through natural language prompting. arXiv preprint arXiv:2404.10199.
- Li et al. (2024c) Wenyan Li, Xinyu Zhang, Jiaang Li, Qiwei Peng, Raphael Tang, Li Zhou, Weijia Zhang, Guimin Hu, Yifei Yuan, Anders Søgaard, et al. 2024c. Foodieqa: A multimodal dataset for fine-grained understanding of chinese food culture. arXiv preprint arXiv:2406.11030.
- Lin et al. (2025) Zhiqiu Lin, Deepak Pathak, Baiqi Li, Jiayao Li, Xide Xia, Graham Neubig, Pengchuan Zhang, and Deva Ramanan. 2025. Evaluating text-to-visual generation with image-to-text generation. In European Conference on Computer Vision, pages 366–384. Springer.
- Liu et al. (2024a) Chen Cecilia Liu, Iryna Gurevych, and Anna Korhonen. 2024a. Culturally aware and adapted nlp: A taxonomy and a survey of the state of the art. arXiv preprint arXiv:2406.03930.
- Liu et al. (2021) Fangyu Liu, Emanuele Bugliarello, Edoardo Maria Ponti, Siva Reddy, Nigel Collier, and Desmond Elliott. 2021. Visually grounded reasoning across languages and cultures. In Proceedings of the 2021 Conference on Empirical Methods in Natural Language Processing, pages 10467–10485.
- Liu et al. (2024b) Minghao Liu, Le Zhang, Yingjie Tian, Xiaochao Qu, Luoqi Liu, and Ting Liu. 2024b. Draw like an artist: Complex scene generation with diffusion model via composition, painting, and retouching. arXiv preprint arXiv:2408.13858.
- Liu et al. (2025) Shudong Liu, Yiqiao Jin, Cheng Li, Derek F Wong, Qingsong Wen, Lichao Sun, Haipeng Chen, Xing Xie, and Jindong Wang. 2025. Culturevlm: Characterizing and improving cultural understanding of vision-language models for over 100 countries. arXiv preprint arXiv:2501.01282.
- Liu et al. (2023) Zhixuan Liu, Youeun Shin, Beverley-Claire Okogwu, Youngsik Yun, Lia Coleman, Peter Schaldenbrand, Jihie Kim, and Jean Oh. 2023. Towards equitable representation in text-to-image synthesis models with the cross-cultural understanding benchmark (ccub) dataset. arXiv preprint arXiv:2301.12073.
- Mo et al. (2023) Shentong Mo, Zhun Sun, and Chao Li. 2023. Multi-level contrastive learning for self-supervised vision transformers. In Proceedings of the IEEE/CVF Winter Conference on Applications of Computer Vision, pages 2778–2787.
- Myung et al. (2024) Junho Myung, Nayeon Lee, Yi Zhou, Jiho Jin, Rifki Afina Putri, Dimosthenis Antypas, Hsuvas Borkakoty, Eunsu Kim, Carla Perez-Almendros, Abinew Ali Ayele, et al. 2024. Blend: A benchmark for llms on everyday knowledge in diverse cultures and languages. arXiv preprint arXiv:2406.09948.
- Nayak et al. (2024) Shravan Nayak, Kanishk Jain, Rabiul Awal, Siva Reddy, Sjoerd Steenkiste, Lisa Hendricks, Karolina Stanczak, and Aishwarya Agrawal. 2024. Benchmarking vision language models for cultural understanding. In Proceedings of the 2024 Conference on Empirical Methods in Natural Language Processing, pages 5769–5790.
- Nguyen and Dieng (2024) Quan Nguyen and Adji Bousso Dieng. 2024. Quality-weighted vendi scores and their application to diverse experimental design. arXiv preprint arXiv:2405.02449.
- Ouyang et al. (2022) Long Ouyang, Jeffrey Wu, Xu Jiang, Diogo Almeida, Carroll Wainwright, Pamela Mishkin, Chong Zhang, Sandhini Agarwal, Katarina Slama, Alex Ray, et al. 2022. Training language models to follow instructions with human feedback. Advances in neural information processing systems, 35:27730–27744.
- Podell et al. (2023) Dustin Podell, Zion English, Kyle Lacey, Andreas Blattmann, Tim Dockhorn, Jonas Müller, Joe Penna, and Robin Rombach. 2023. Sdxl: Improving latent diffusion models for high-resolution image synthesis. arXiv preprint arXiv:2307.01952.
- Ramesh et al. (2022) Aditya Ramesh, Prafulla Dhariwal, Alex Nichol, Casey Chu, and Mark Chen. 2022. Hierarchical text-conditional image generation with clip latents. arXiv preprint arXiv:2204.06125, 1(2):3.
- Ruiz et al. (2023) Nataniel Ruiz, Yuanzhen Li, Varun Jampani, Yael Pritch, Michael Rubinstein, and Kfir Aberman. 2023. Dreambooth: Fine tuning text-to-image diffusion models for subject-driven generation. In Proceedings of the IEEE/CVF conference on computer vision and pattern recognition, pages 22500–22510.
- Saharia et al. (2022) Chitwan Saharia, William Chan, Saurabh Saxena, Lala Li, Jay Whang, Emily L Denton, Kamyar Ghasemipour, Raphael Gontijo Lopes, Burcu Karagol Ayan, Tim Salimans, et al. 2022. Photorealistic text-to-image diffusion models with deep language understanding. Advances in neural information processing systems, 35:36479–36494.
- Salimans et al. (2016) Tim Salimans, Ian Goodfellow, Wojciech Zaremba, Vicki Cheung, Alec Radford, and Xi Chen. 2016. Improved techniques for training gans. Advances in neural information processing systems, 29.
- Schuhmann et al. (2021) Christoph Schuhmann, Richard Vencu, Romain Beaumont, Robert Kaczmarczyk, Clayton Mullis, Aarush Katta, Theo Coombes, Jenia Jitsev, and Aran Komatsuzaki. 2021. Laion-400m: Open dataset of clip-filtered 400 million image-text pairs. arXiv preprint arXiv:2111.02114.
- Shing and Sawada (2022) Makoto Shing and Kei Sawada. 2022. Japanese stable diffusion. https://github.com/rinnakk/japanese-stable-diffusion.
- Stiennon et al. (2020) Nisan Stiennon, Long Ouyang, Jeffrey Wu, Daniel Ziegler, Ryan Lowe, Chelsea Voss, Alec Radford, Dario Amodei, and Paul F Christiano. 2020. Learning to summarize with human feedback. Advances in Neural Information Processing Systems, 33:3008–3021.
- Wan et al. (2023) Yixin Wan, Jieyu Zhao, Aman Chadha, Nanyun Peng, and Kai-Wei Chang. 2023. Are personalized stochastic parrots more dangerous? evaluating persona biases in dialogue systems. arXiv preprint arXiv:2310.05280.
- Wang et al. (2023) Zhizhong Wang, Lei Zhao, and Wei Xing. 2023. Stylediffusion: Controllable disentangled style transfer via diffusion models. In Proceedings of the IEEE/CVF International Conference on Computer Vision, pages 7677–7689.
- Wang et al. (2004) Zhou Wang, Alan C Bovik, Hamid R Sheikh, and Eero P Simoncelli. 2004. Image quality assessment: from error visibility to structural similarity. IEEE transactions on image processing, 13(4):600–612.
- Wu et al. (2023) Xiaoshi Wu, Yiming Hao, Keqiang Sun, Yixiong Chen, Feng Zhu, Rui Zhao, and Hongsheng Li. 2023. Human preference score v2: A solid benchmark for evaluating human preferences of text-to-image synthesis. arXiv preprint arXiv:2306.09341.
- Xu et al. (2023) Jiazheng Xu, Xiao Liu, Yuchen Wu, Yuxuan Tong, Qinkai Li, Ming Ding, Jie Tang, and Yuxiao Dong. 2023. Imagereward: learning and evaluating human preferences for text-to-image generation. In Proceedings of the 37th International Conference on Neural Information Processing Systems, pages 15903–15935.
- Zhang et al. (2018) Richard Zhang, Phillip Isola, Alexei A Efros, Eli Shechtman, and Oliver Wang. 2018. The unreasonable effectiveness of deep features as a perceptual metric. In Proceedings of the IEEE conference on computer vision and pattern recognition, pages 586–595.
- Zhang et al. (2023) Yuxin Zhang, Nisha Huang, Fan Tang, Haibin Huang, Chongyang Ma, Weiming Dong, and Changsheng Xu. 2023. Inversion-based style transfer with diffusion models. In Proceedings of the IEEE/CVF conference on computer vision and pattern recognition, pages 10146–10156.
- Zhou et al. (2023) Li Zhou, Antonia Karamolegkou, Wenyu Chen, and Daniel Hershcovich. 2023. Cultural compass: Predicting transfer learning success in offensive language detection with cultural features. In Findings of the Association for Computational Linguistics: EMNLP 2023, pages 12684–12702, Singapore. Association for Computational Linguistics.
Appendix A Appendix
A.1 Prompt Details
For each category, we used prompts in the following format:
-
•
“A panoramic view of {landmark} in {country}, realistic”
-
•
“An image of {clothes} from {country} clothing, realistic”
-
•
“An image of {food} from {country} cuisine, realistic”
For example:
-
•
“A panoramic view of the Empire State Building in the United States, realistic”
-
•
“An image of Hanfu from Chinese clothing, realistic”
-
•
“An image of plov from Azerbaijani cuisine, realistic”
Additionally, we experimented with various prompting techniques, including GPT-4-generated detailed prompts. However, we observed that these prompts occasionally introduced hallucinations leading to inaccurate image generation. Through empirical analysis, we found that simpler prompts tended to provide more accurate and culturally relevant generations.
A.2 Survey Question Details
This section provides additional details regarding the survey questions and instructions used during the study. Annotators received clear guidance to ensure consistent evaluations of both real and AI-generated images (Figure 6 left). Examples of specific survey questions for cultural contexts, such as those related to Azerbaijan, are shown in Figure 6 right top and right bottom. The estimated time to complete the survey was approximately 1.5 to 2 hours. Table 3 presents the Fleiss’ Kappa scores, which reflect the level of agreement between annotators for each country.
| Country | Fleiss’ Kappa |
| Azerbaijan | 0.14 |
| China | 0.13 |
| Ethiopia | 0.13 |
| Indonesia | 0.10 |
| Mexico | 0.10 |
| Pakistan | 0.11 |
| South Korea | 0.17 |
| Spain | 0.11 |
| United Kingdom | 0.12 |
| United States | 0.07 |
A.3 Survey Responses
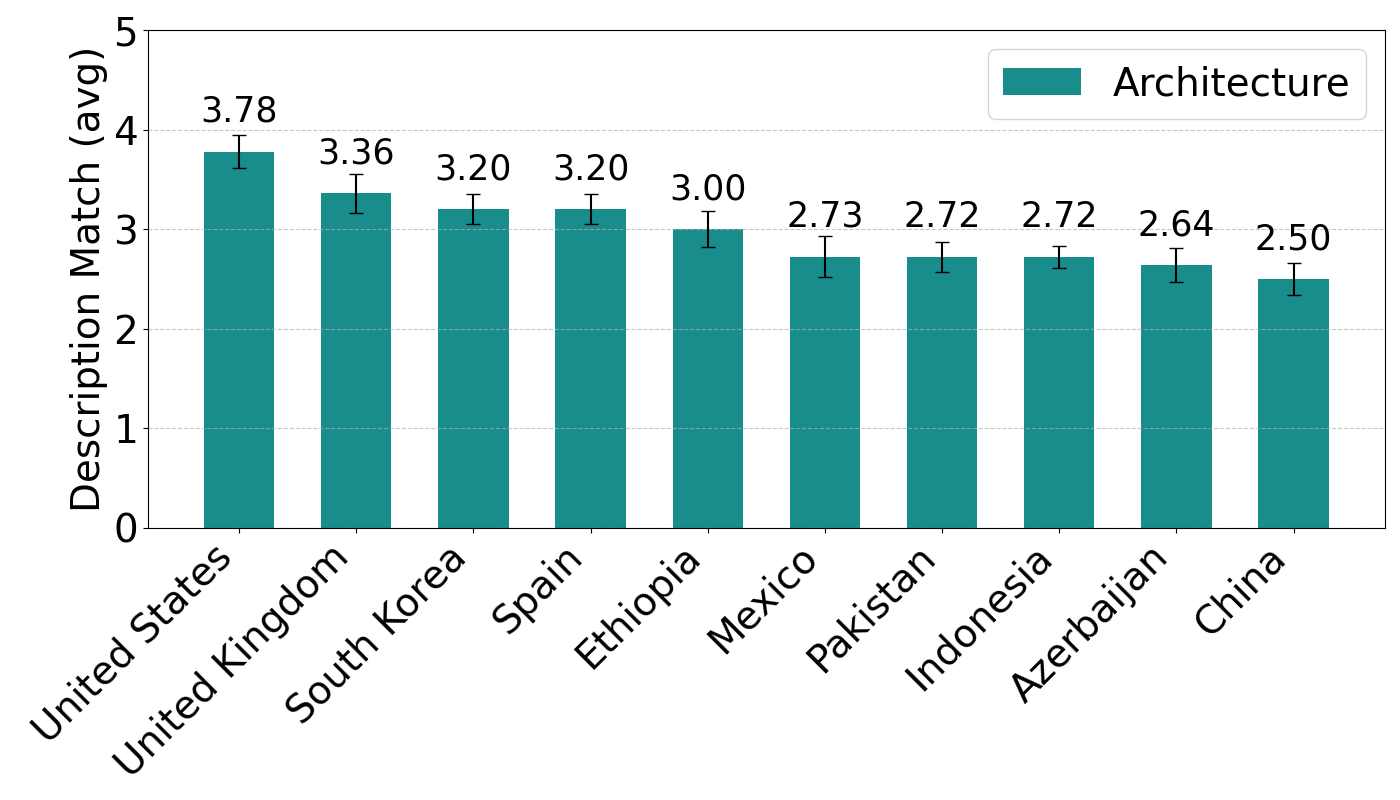
We analyzed the scores for each image quadruple by averaging the scores from six questions, assigning the resulting value as the final score for each image. We then calculated the average of these final scores for each category and country, as shown in Figure 7.
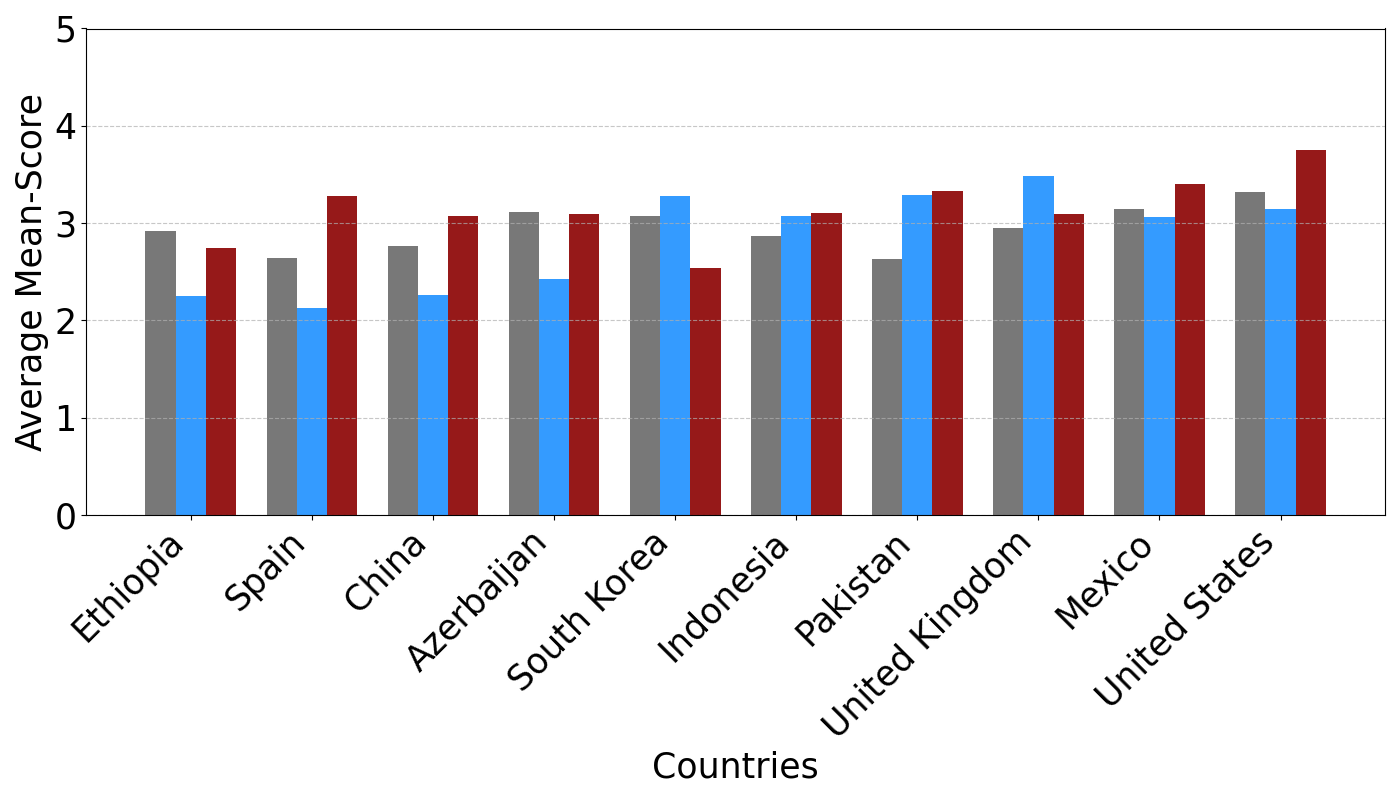
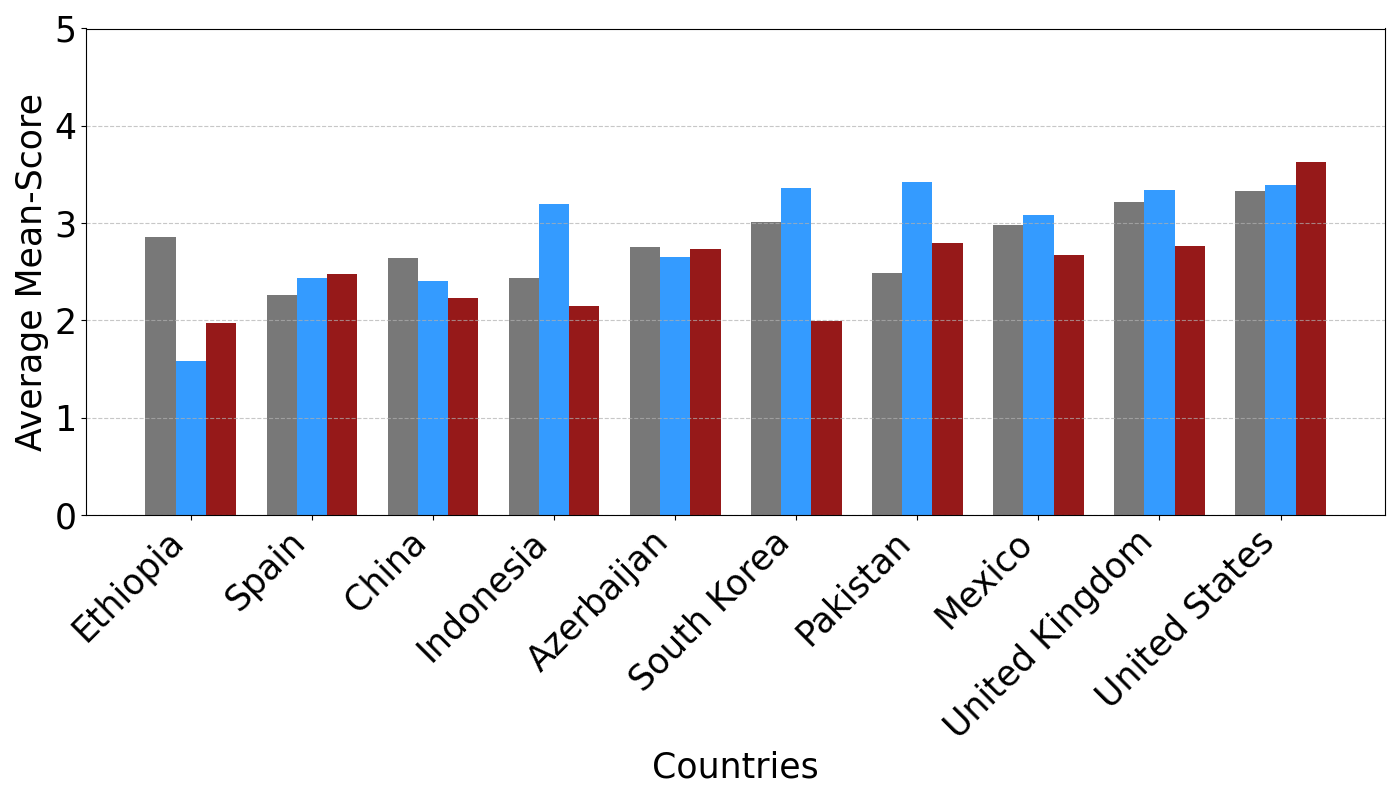
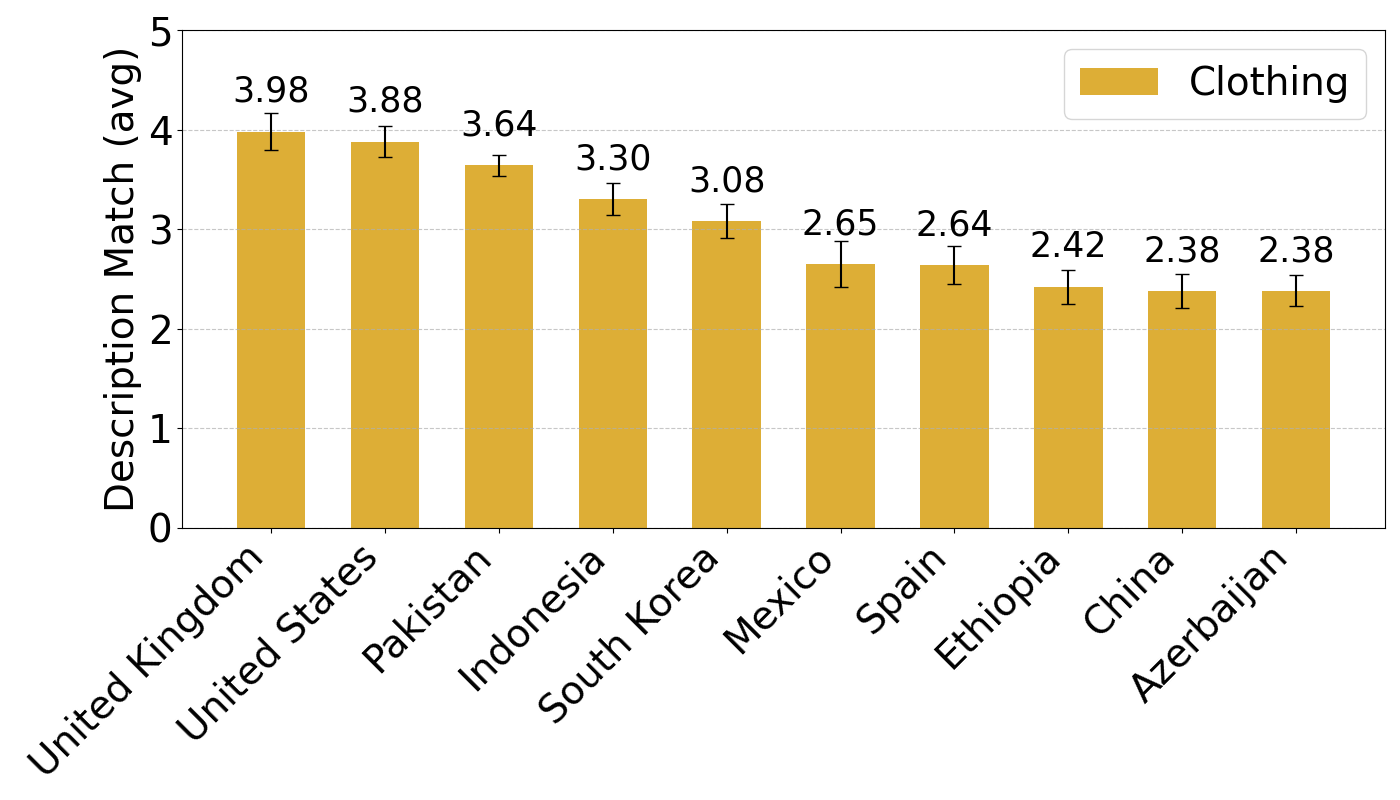
The description match scores for Stable Diffusion XL and Stable-Diffusion 3 Medium Diffusers are presented in Figures 8 and 9 respectively.
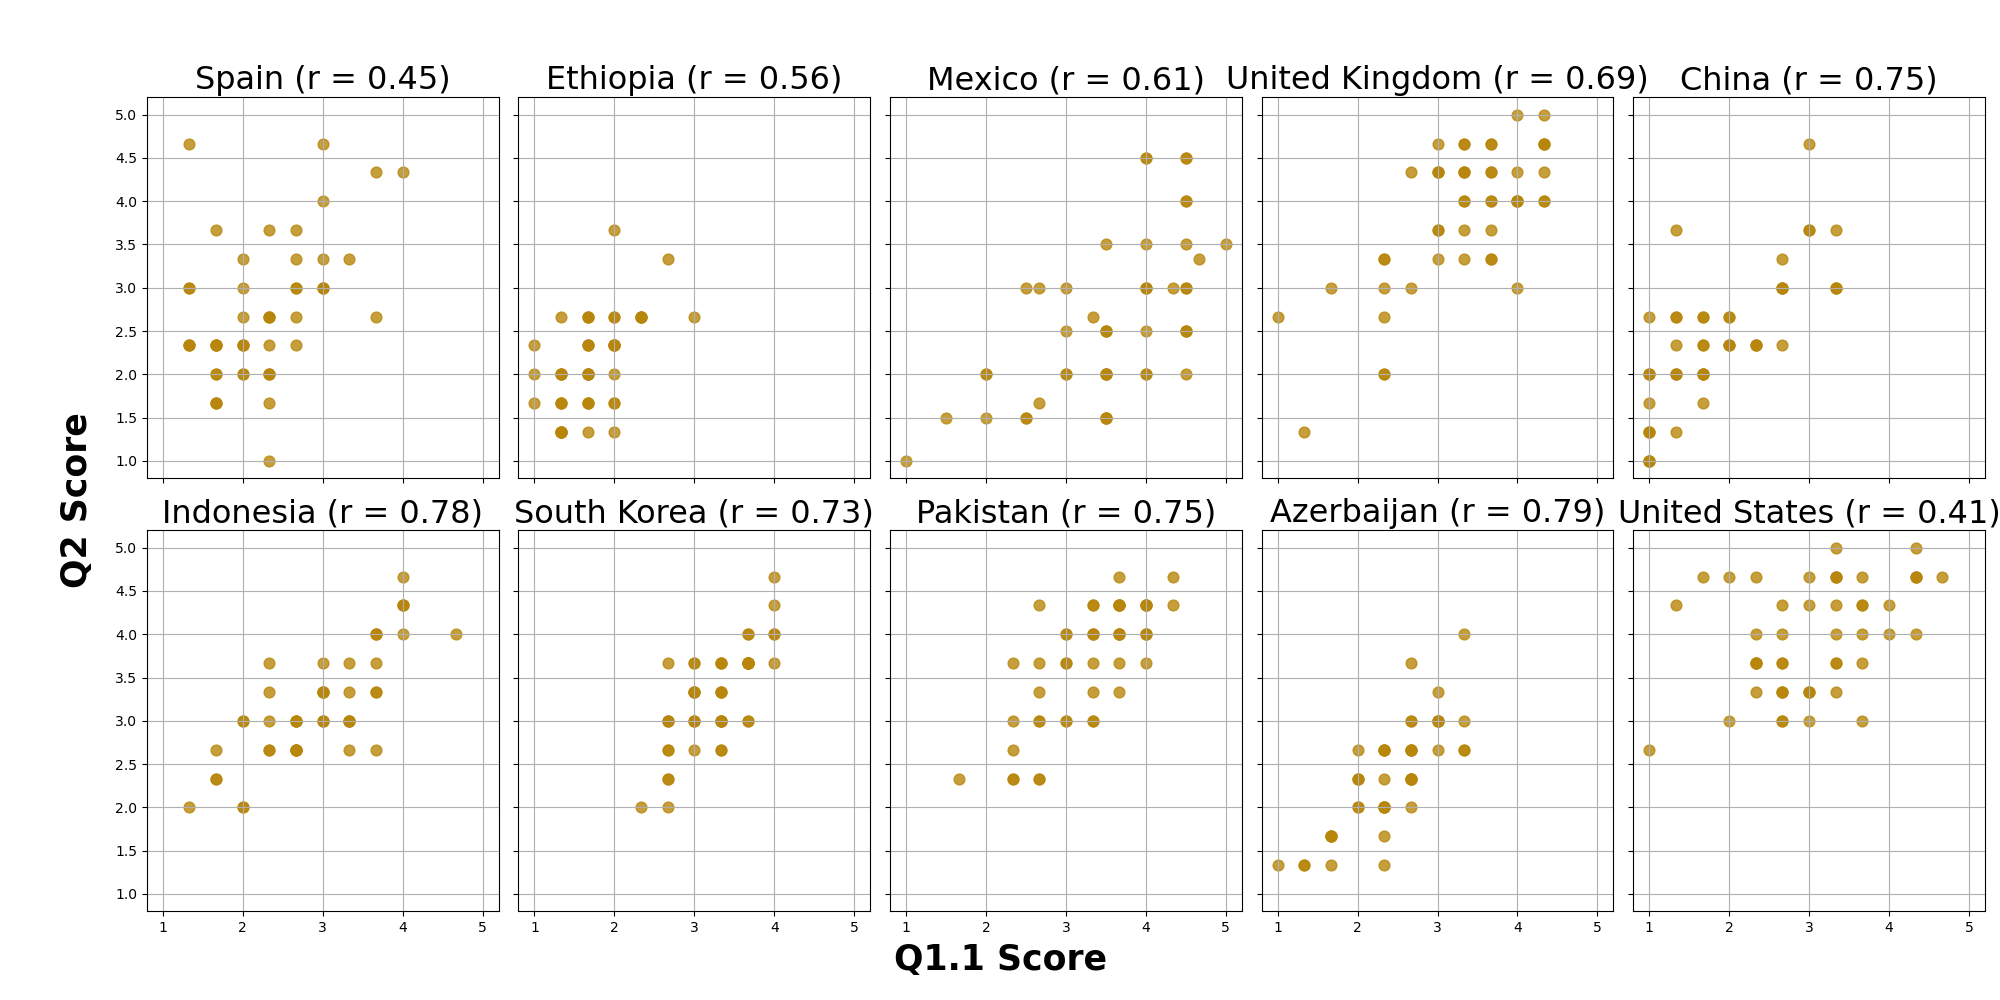
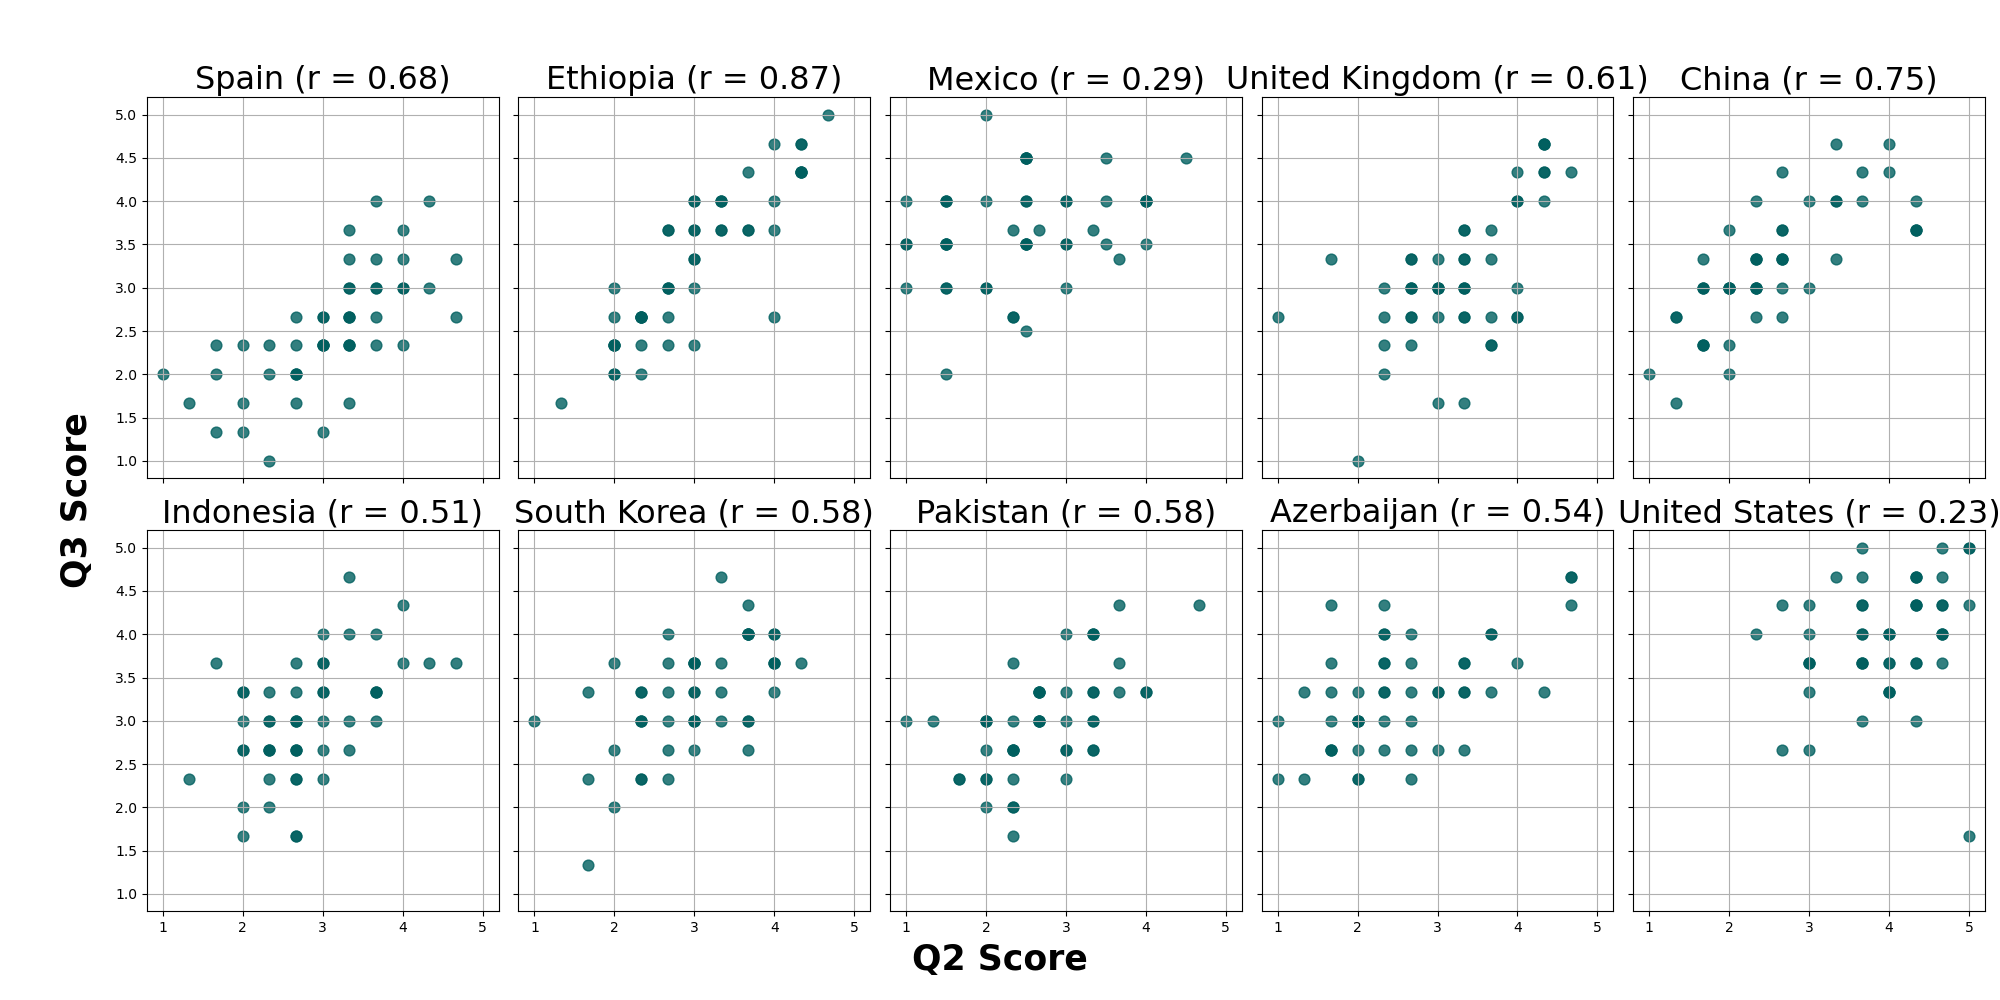
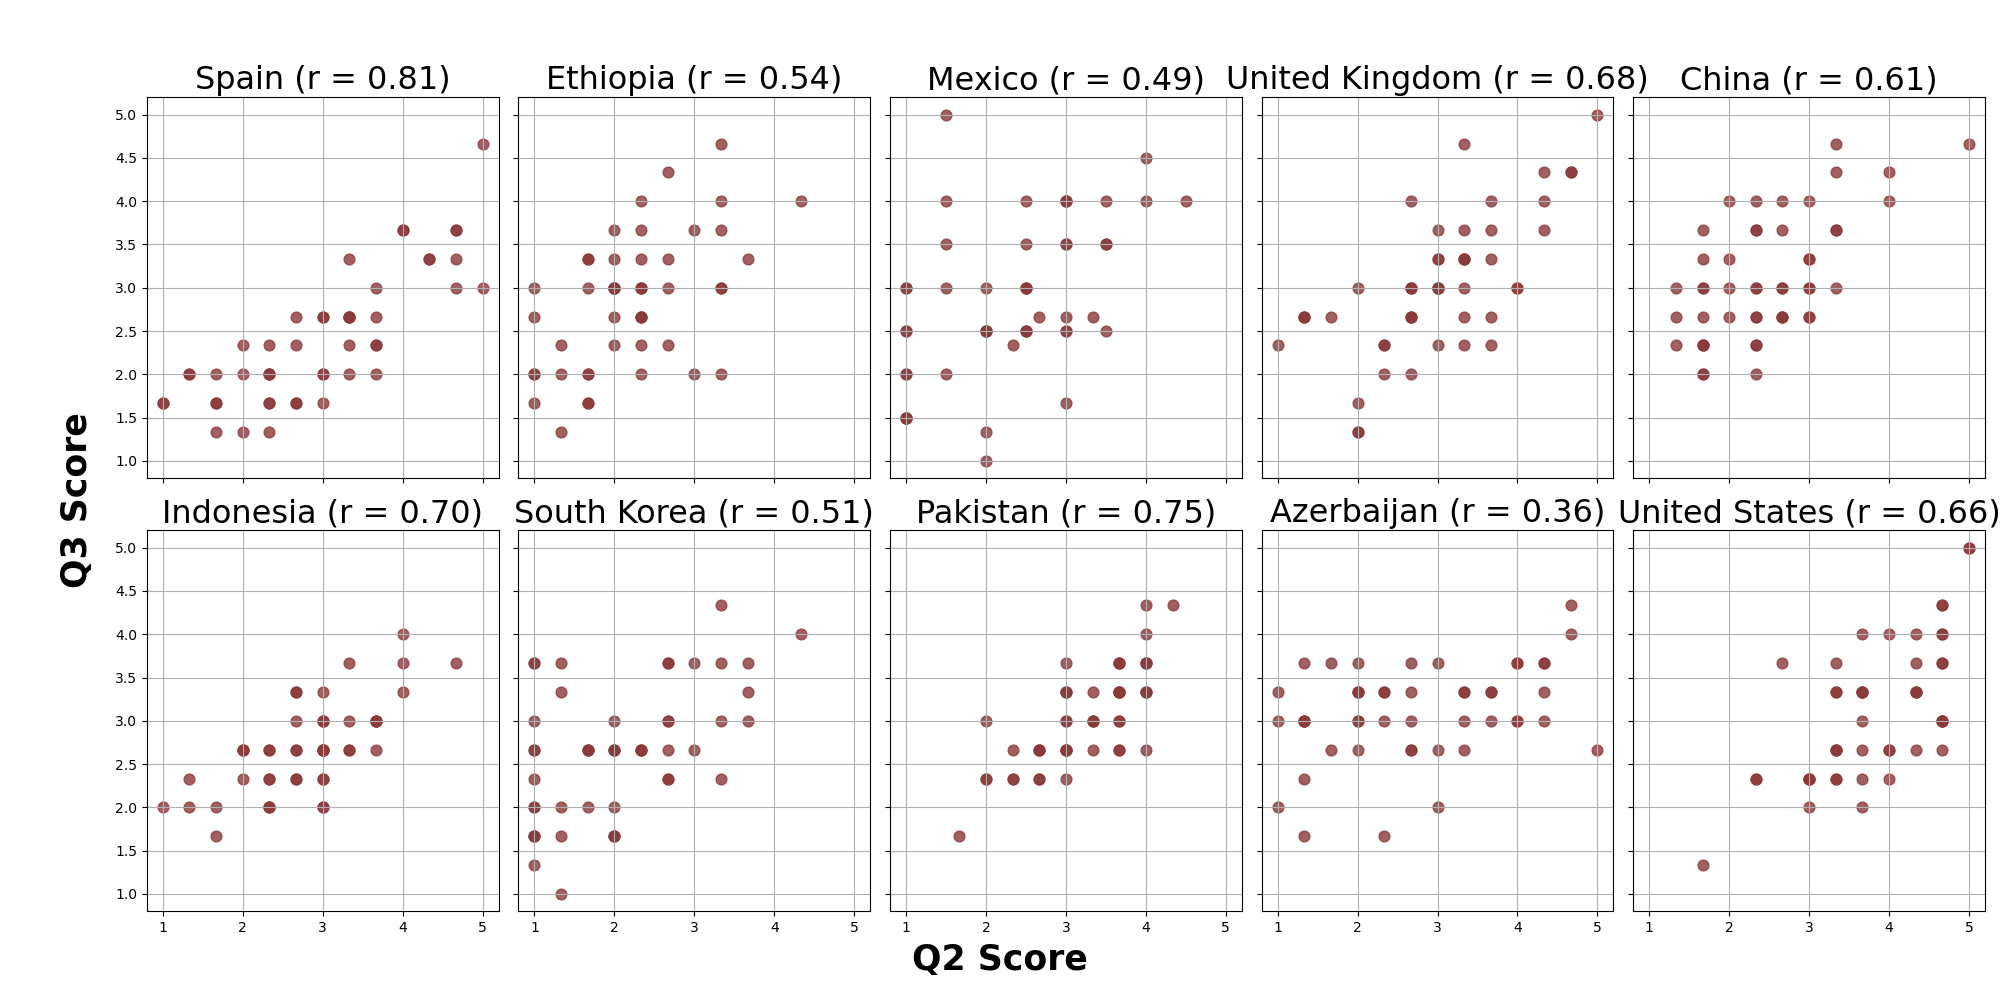
A.4 Survey Response Correlations
We calculated the correlations between the scores for Q1.1 (overall similarity) and Q1.2 for three distinct image categories: Architecture, Clothing, and Food. For each image, we first averaged the responses across the models to compute a unified score. These scatter plots (Figure 10, 11, 12) depict the relationship between the two survey questions. Similarly, the correlation results for the Architecture and Clothing categories for Q1.1 (overall similarity) and Q2 (description match) are presented in Figures 13 and 14, respectively. Moreover, we present the correlation scores for all three categories for Q2 (description match) and Q3 (realism) in Figures 15, 16, and 17.