Diffusion dynamics of star-shaped macromolecules in dilute solutions
Abstract
Polymer chains dissolved in a solvent take random conformations due to large internal degrees of freedom and are characterized geometrically by their average shape and size. The diffusive dynamics of such large macromolecules play an indispensable role in a plethora of engineering applications. The influence of the size of the polymer chain on its diffusion is well studied, whereas the same cannot be said for the shape of the polymer chain. In the present work, the influence of shape on the center-of-mass diffusion of the star-shaped chains in solution is investigated using Multi-particle Collision Dynamics. Star-shaped chains of varying degrees of functionality are modeled in a good solvent at infinite dilution. The radius of gyration() of the star-shaped chains follows a functionality-independent scaling law with the chain length(), , where . The shape of the polymer chains is calibrated by relative shape anisotropy. Highly anisotropic star-shaped polymer chains are found to have a faster rate of diffusion along the translational direction due to a slower rate of rotational diffusion when the radius of gyration of the polymer chains is maintained constant.
keywords:
American Chemical Society, LaTeXIndian Institute of Science] Department of Mechanical Engineering, Indian Institute of Science, Bengaluru, India \abbreviationsIR,NMR,UV
1 Introduction
Polymeric fluids are a unique class of complex fluids that show a plethora of fascinating non-Newtonian behaviours1, which can be understood with the transport and rheological properties of the fluid. One key challenge of the complex fluid community is understanding how the macroscopic properties of the polymeric fluids arise from microscopic interactions of the macromolecules2. The polymer chain dissolved in a solvent can take a multitude of conformations due to its large internal degrees of freedom. The average shape and size are used to characterize a polymer chain geometrically: the radius of gyration is widely used to describe the size and the eigenvalues of the gyration tensor for the shape calibration3. Advances in controlled polymerization have led to synthesizing complex polymer structures like star-shaped, comb-shaped, H-shaped, ring, and many more.4. The diffusive dynamics of such complex polymer chains are of fundamental interest in the biophysics community and are ubiquitous in numerous engineering applications. Star-shaped polymers are used for the controlled delivery of drugs in biomedical applications5 and as viscosity index modifiers in oil industries6. Polyethylene glycol stars are used for protein delivery7. Understanding macromolecular diffusion in a biological cell is important for its various functions, such as the movement of plasmids and transport of amino acids 8 9. Hence, the influence of the shape and size of the polymer chain on its diffusive dynamics in solution is essential.
Most studies on the diffusion of complex polymer chains have been done by keeping the length of the polymer chain constant. Using fluorescence microscopy, Robertson et al.10 have shown a lower radius of gyration and a higher diffusion coefficient for circular DNA molecules than linear ones for the same chain length. Using Brownian dynamics simulations with hydrodynamic interaction, Kanaeda and Deguchi11 have reported higher diffusion coefficients for the ring polymers than for the linear polymers of the same chain length. Hegde et al.12 have reported similar findings for the ring polymers in comparison to the linear chains for the same chain length by using three different simulation techniques. Singh et al.13 have shown, using Multi-particle Collision Dynamics(MPCD), that the center-of-mass diffusion coefficient of the star polymer chains decreases with an increase in their radius of gyration. Hence, when it comes to size, it is clear that the higher the size of the polymer chain, the lower the center-of-mass diffusion coefficient. However, it is difficult to comment on the influence of the shape of the polymer chain on its diffusion from the same polymer chain length study as both shape and size are distinct for different polymer chain architectures14. The diffusion study of complex polymer chains for the same size case is scanty. Hegde et al.12 have reported a higher diffusion coefficient for the linear chains than the ring chains for the same radius of gyration using Molecular Dynamics, MPCD, and the Lattice Boltzmann method and also noted that size could not be the only factor that influences the diffusion of the chain. Therefore, the effect of the shape parameter on the center-of-mass diffusion of the polymer chains still remains an open question.
In this work, the effect of the shape parameter on the center-of-mass diffusion of the star-shaped polymer chains in solution is studied in the limit of infinite dilution using a mesoscopic coarse-grained simulation method, namely MPCD. For simulating the Brownian motion of the complex polymer chains in a solution, MPCD is frequently used as it incorporates both thermal fluctuation and long-range hydrodynamic interactions15. At first, the shape and size of star-shaped polymer chains with different functionality are analyzed using the gyration tensor and compared with linear polymer chains at the same chain length. Subsequently, the translational diffusion of six different types of chains (one linear and five star-shaped chains) with the same radius of gyration is studied using the center-of-mass mean square displacement, followed by their rotational diffusion using the reorientation correlation function. Finally, the diffusion study is correlated to the shape characterization study in order to find the effect of the shape parameter on the center-of-mass diffusion of the star-shaped polymer chains in a solution.
2 Numerical formulation
The coarse-grained bead-spring model represents the polymer chains dissolved in the solution. To replicate good solvent conditions, the excluded volume interactions between the monomer beads are modeled using the repulsive part of the 12-6 Lennard-Jones (LJ) potential, also known as Weeks-Chandler-Andersen potential16 (), defined as:
| (1) |
where is the diameter of a monomer bead, is the distance between two beads and is the strength of interaction, is the Boltzmann’s constant and is temperature. The neighboring monomers of the polymer chain are connected with springs, the potential of which is given by Finitely Extensible Nonlinear Elastic (FENE)17, defined as:
| (2) |
where is the spring constant, and is the maximum length of the extension. The values of and are 30 and respectively, as recommended by Kremer and Grest18. The bead spring model, FENE potential, and Kreme and Grest parameters are widely used in the coarse-grained modeling of the polymer chains19. The star-shaped polymer chains of varying degrees of functionality (number of arms) have been modeled by connecting different linear arms at their ends instead of connecting them to a single central monomer, ensuring equal flexibility of the arms for all the functionalities.
The solvent is modeled explicitly as an ensemble of non-interacting point particles of finite mass () using a mesoscopic coarse-grained simulation technique, MPCD20. MPCD consists of alternating streaming and collision steps. In the streaming step, the MPCD particles with velocity undergo ballistic motion and their positions () are updated as:
| (3) |
In the collision step, the simulation box is divided into cubic cells of equal size(), and all the particles within a cell undergo stochastic collision. The collision of the MPCD particles is modeled using a momentum-conserving version of the Andersen Thermostat, also known as MPCD-AT21, in which the particle velocities () are updated as:
| (4) |
where is the center-of-mass velocity of the collision cell, is a random velocity selected from a Maxwell-Boltzmann distribution, and is the change in center-of-mass velocity of the collision cell due to the addition of . During the streaming interval of MPCD, the positions, and velocities of the monomer beads evolve by the velocity-Verlet algorithm22 with a time step . During the collision step, the monomers are considered MPCD particles and undergo stochastic collisions. The three components of are selected from a Gaussian distribution with variance for the solvent particles and for the monomer beads, where is the mass of a monomer. This way of considering the monomers just like other MPCD particles in the collision step for modeling solvent-monomer interaction is often used in recent studies1223242526 due to its advantage of avoiding spurious depletion forces27 which could lead to breakage of FENE bonds. Galilean invariance is ensured by randomly shifting the cells before each collision step by a vector with the three components randomly chosen from 28. All the simulations have been performed using the MPCD-AT routines in LAMMPS29(Chen et al.26 30).
The size of the collision cells is taken to be the same as the size of the monomer beads, . The average density of the MPCD solvent equals 5. The mass of a monomer() is taken as 5 to achieve neutral buoyancy. The MD time step () equals . The MPCD collision time step () is , where is the intrinsic unit of time equals . The resulting viscosity and Schmidt number() of the MPCD fluid are and 12, respectively. The size of the cubic simulation box is increased with polymer chain length to avoid the finite size effects following the previous studies.1225 Box size() equals for the set of chain lengths , for the set of chain lengths , and for the set of chain lengths . The equilibration simulation run is performed for MD time steps. The results are time averaged over MD time steps and ensemble-averaged over five system replicas, each with a unique set of random velocities at starting of the simulation and during the stochastic collision, both taken from Maxwell-Boltzmann distribution. The measured parameters will be expressed in reduced units using the energy scale , length scale , and mass scale . Periodic boundary conditions are implemented in all directions. The snapshots of the simulations are shown in Figure 1.

To validate the MPCD routines, the Brownian motion of 250 colloidal particles of the same size as the monomer beads are modeled in the MPCD solvent. The variation of their average mean square displacement (MSD) with lag time () is plotted in Figure 2(a). Typically, power law describes the variation of MSD with lag time: MSD . The dynamics of the solutes can be diffusive (), sub-diffusive (), or super-diffusive (). From Figure 2(a), we note that we obtain b = 1 as expected for the colloids. Hence, the dynamics of the colloids are captured well by the simulation. Further, the radius of gyration() vs. chain length () is plotted for the linear chain in Figure 2(b). A power law behavior can be observed with a scaling exponent of 0.623 for the linear chain. The value of the power law exponent reported by Chen et al.26 using similar simulation parameters is 0.61. Linear chains have been studied widely, and their corresponding scaling exponent values for good solvent conditions are summarized in Table 1. The exponent value calculated in the present work agrees well with earlier studies. In addition, the diffusion coefficient() is calculated from the center-of-mass mean square displacement(MSD) vs. lag time plot for the linear chains of different lengths. The variation of with is shown in Figure 2(b). It also follows a power law , where . The equality of with confirms the Zimm theory for the diffusion of a polymer chain with intra-chain hydrodynamic interactions, which predicts .


| Literature source | value of | |
|---|---|---|
| Theory | Flory theory32 | 0.6 |
| Renormalization group theory33 | 0.588 | |
| Perturbation calculations34 | 0.588 | |
| Experiments | Synthetic polymers(neutron scattering)35 | |
| DNA molecules(fluorescence microscopy)36 | ||
| HPAM(intrinsic viscosity measurements)37 | ||
| Simulations | Brownian dynamics12 | |
| MPCD12 | ||
| Lattice Boltzmann12 | ||
| MD14 | ||
| MPCD-AT26 | ||
| Present Work |
The difference between a good solvent and a poor solvent can be demonstrated by introducing attraction using the standard 12-6 LJ potential with a cutoff of for the pairwise interaction between monomer beads instead of WCA potential as explained by Peng et al.38. In a good solvent, the polymer chain forms a coil, whereas it becomes a globule in the case of a poor solvent. This coil-to-globule transition is shown in Figure 3 and can be observed by measuring the radius of gyration, which is approximately in a good solvent for the chain length of , contrary to for the poor solvent case. This reduction in the size of the polymer chain is also visible in the values of the resulting diffusion coefficients, which are and for poor and good solvents, respectively.

3 Results and discussion
3.1 Shape and size of star-shaped chains
The gyration tensor(S) of a polymer chain is defined as the dyadic product of the position vector(P) of a monomer bead in the center-of-mass reference frame with its transpose and averaged over all the monomers of the chain3.
| (5) |
where () represents the centre-of-mass of the polymer chain consisting of identical monomers () and is calculated as follows:
| (6) |
The elements of S can be written using indicial notation as:
| (7) |
The polymer chain’s shape and size can be easily measured by the eigenvalues of S, i.e., , and . The radius of gyration() represents the size of the polymer chain, the square of which is equal to the trace of the gyration tensor3.
| (8) |


We evaluate for four different types of chain: linear, 3-armed star, 4-armed star, and 6-armed star using seven different chain lengths, and the results are summarized in Figure 4(a). The radius of gyration follows a power law with polymer chain length, . The power law’s exponent() represents the quality of the solvent. The value of calculated in the present simulations are 0.623, 0.627, 0.631, and 0.626 for the linear, 3-armed star, 4-armed star, and 6-armed star chains, respectively. The scaling law is found to be independent of the functionality of the star-shaped chains in which the average value of , indicating similar scaling behavior of the linear and star-shaped chains under good solvent conditions143940. Table 1 summarizes the values of for linear chains reported by experiments, simulation, and theory. The calculated average value of is in good agreement with the existing results in the literature. For the same chain length, linear chains are bigger than the star-shaped chains, and among the star-shaped chains, size decreases with an increase in functionality, i.e. number of arms, as expected. Compared to the linear chain, this reduction in the size of the branched chains for the same polymer chain length is measured using the geometrical shrinking factor() defined as the ratio of the mean squared radius of gyration of the branched chain to that of the linear chain, 14. The values of of star chains with different functionality and chain lengths are shown in Figure 4(b). We note that doesn’t vary much over the chain length for a particular chain type. The values of for star chain with reported by Khabaz and Khare14 is approximately 0.5, which falls between 0.41(6-armed star) and 0.58(4-armed star) calculated in the present work and suggests linear variation in with .
The shape of the polymer chains can be calibrated using asphericity() and relative shape anisotropy() defined as,143
| (9) |
| (10) |


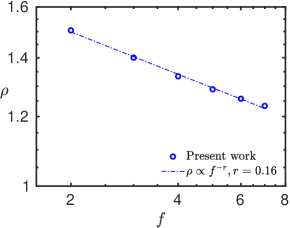
The variation of the two shape parameters with the polymer chain length is given in figure 5. The asphericity values are normalized by to make these independent of size. For the individual architectures, the values of both shape parameters do not vary much over the chain lengths. The normalized asphericity can take any value between 0 and 1. It will be 0 for a spherical shape or any shape of the platonic solids and 1 for a rod-like structure. As expected, the linear chains have higher asphericity values than the star-shaped chains. Its value is 0.64 for the linear chain in the present work, which is close to 0.625(calculated using eigenvalues), reported by Koyama41 and 0.66, reported by Theodorou and Suter3. Among the star-shaped chains, the normalized asphericity decreases with an increase in functionality. Khabaz and Khare14 have reported 0.362 for the 5-armed star chain, which falls between 0.29(6-armed star) and 0.4(4-armed star) in the present work. The other shape parameter is the relative shape anisotropy(), which also varies between 0 and 1. Its value is 1 for a rigid rod and 0 for a sphere and all platonic solids. It is also higher for linear chains than the star-shaped ones, as expected. In the present work, the value of for the linear chain is 0.45, which is nearly the same as 0.44 reported by Khabaz and Khare14. As anticipated, for star-shaped chains, decreases with increasing functionality. In the present work, 0.3(3-armed star), 0.21(4-armed star), and 0.12(6-armed star) which are slightly lower than 0.3454(3-armed star), 0.2463(4-armed star), and 0.1512(6-armed star), respectively, reported by Zifferer42. The value of reported by Khabaz and Khare14 for a 5-armed star chain is 0.16, which falls between 0.12(6-armed star) and 0.21(4-armed star) calculated in the present work. To summarize, linear chains are less spherical and more anisotropic than the star-shaped chains. The higher the functionality among the star-shaped chains, the more spherical and less anisotropic the chain is. The variation of the shape parameters with functionality is plotted in Figure 10(a) and correlated with the diffusion coefficients in a later section.
3.2 Translational diffusion of star-shaped chains


The diffusion rate of a polymer chain in a solution can be measured by the variation of center-of-mass mean square displacement(MSD) with lag time. One linear and five star-shaped chains are modeled to investigate the influence of the shape of the polymer chain on its diffusion. The effect of chain size is eliminated by selecting the polymer’s chain length () such that the resulting radius of gyration is approximately for all six types. The simulation box size is for all six cases. The MSD() vs. lag time() plot is shown in Figure 6. At short times(less than ), MSD increases at a stronger rate than linearly with time due to the inertia of the chain. For longer times, the MSD reaches the linear diffusive regime, from which diffusion coefficients() are calculated using the relation, and summarized in the second last column of Table 2.
| 2 | 28 | 0.0032 | |||||
| 3 | 23 | 0.0028 | |||||
| 4 | 20 | 0.0026 | |||||
| 5 | 19 | 0.0025 | |||||
| 6 | 18 | 0.0022 | |||||
| 7 | 17 | 0.0021 |
The linear chain can be considered a star chain with and has the highest value of diffusion coefficient. Among the star chains, the diffusion coefficient value decreases with increased functionality. Using the values of the diffusion coefficients, the hydrodynamic radius of the polymer chains can be calculated as43,
| (11) |
where is the translational diffusion coefficient of the polymer chain, and is the solvent viscosity. The ratio of the radius of gyration and hydrodynamic radius, , is a size-independent quantity and represents the effect of the architecture of the polymer chain on its diffusion. The variation of with the functionality of the star polymers is plotted in Figure 7. We note that decreases with an increase in the functionality of the star chain, as reported by Huber et al. 44 and Singh et al. 13. Since all six types of chains are of the same size, this difference in the diffusion coefficient values can only be attributed to their shape parameters. In Figure 5, we have shown that the linear chain is more anisotropic and less spherical than the star-shaped chains, and among the star chains, and decrease with increased functionality. Hence, the higher a star chain’s relative shape anisotropy and normalized asphericity, the faster it diffuses along the translational direction. We investigate this further by computing the rotational diffusion of the polymer chains.
3.3 Rotational diffusion of star-shaped chains
The polymer chain reorients itself continuously in the solution while diffusing along the translational direction. The gyration tensor has real eigenvalues and orthogonal eigenvectors as it is a symmetric tensor approximating the polymer chain as an ellipsoidal shape3. The reorientation of the polymer chain is equivalent to the rotation of the imaginary ellipsoid, as explained using a schematic representation in Figure 8. Any vector rigidly attached to the polymer chain can be used for measuring the rate of reorientation. In this work, the eigenvector() corresponding to the largest eigenvalue() of the gyration tensor is selected for measuring the rate of reorientation of the corresponding polymer chain. The relevant reorientational correlation function of the polymer chain can be defined as,
| (12) |
where , is the second-order Legendre polynomial, and the angle bracket represents the time and ensemble average over five system replicas. For any isotropically reorienting polymer chain, following Wong et al.45, the reorientational correlation function can be approximated as,
| (13) |
where is the rotational diffusion coefficient of the polymer chain.

The variation of the reorientational correlation function with time is plotted in Figure 9. We note that decays faster for the star-shaped chains than the linear chain. For the star-shaped chains, the higher the functionality, the faster the decay of . The rotational diffusion coefficients are calculated from the exponential fit using the least square method and are summarized in the last column of Table 2. The corresponding coefficient of determination() is more than 0.99 for all the cases. The faster the decay of the reorientational correlation function, the higher the value of . The linear chain has the lowest value of , and among the star chains, increases with increased functionality. As discussed earlier for translational diffusion, this difference in the values of the rotational diffusion coefficient is because of the shape parameters, as all the six types of polymer chains considered here are of the same size. In terms of shape parameters, star polymer chains with lower values of relative shape anisotropy and normalized asphericity have a higher rate of rotational diffusion. The lower values of and represent higher symmetry of monomer distribution with respect to the coordinate axes. It is intuitive that a star-shaped chain reorients faster when the distribution of its monomers is symmetrical with respect to the coordinate axes. It is to be noted that the variation in the rotational diffusion coefficient with functionality and shape parameters is opposite to that of the translational diffusion coefficient.

3.4 Correlation of diffusion and shape parameters of star-shaped chains


The variation of the shape parameters and the two types of diffusion coefficients with the functionality of the chains are plotted in Figure 10(a) and Figure 10(b), respectively, where the linear chain is considered a star chain with . Out of the two shape parameters, relative shape anisotropy() can be expressed in terms of the invariants of the gyration tensor and is the overall measure of shape anisotropy3. By making two-to-one correspondence between the two types of diffusion coefficients in Figure 10(b) and the relative shape anisotropy in Figure 10(a), it can be stated that, for star-shaped chains with higher values, the value of is higher, and the value of is lower. The origin of a polymer chain’s translational and rotational diffusive motion is the collision with the surrounding solvent particles. The radius of gyration can be interpreted as the radius of the imaginary sphere surrounding the polymer chain in the solution. Maintaining the same for all six types of chains leads to the same size of the corresponding imaginary sphere. Therefore, all six types of chains interact with an approximately equal number of solvent particles on average. Highly spherical and isotropic star-shaped polymer chains utilize more energy in rotational diffusion, which results in less energy for diffusing along the translational direction. The opposite is the case for highly anisotropic star-shaped chains. Hence, the higher the relative shape anisotropy value of a star-shaped chain, the slower the rotational diffusion rate and the faster the rate of translational diffusion, as shown in Figure 10(b).

The variation of the translational diffusion coefficient and the rotational diffusion coefficient with relative shape anisotropy of the star-shaped chains having the same value of is shown in Figure 11. The higher values of lead to a lower value of the rotational diffusion coefficient and a higher value of the translational diffusion coefficient. From these results, we conclude that a star polymer chain with a higher value of relative shape anisotropy will have a slower rate of rotational diffusion and diffuse faster in the translational direction. Even though this is demonstrated using star-shaped chains, the argument can be extended to other polymer configurations as well. Hegde et al. have reported that the linear chains have higher translational diffusion coefficients than the ring chains when both have the same radius of gyration12. From the definition of relative shape anisotropy(equation 10), it is intuitive that the linear polymer chain will have a higher value of than the ring polymer chain. Hence, our argument also holds for the ring vs. linear case. Nevertheless, to verify this argument for generic polymer configurations, the study of other polymer chain architectures is essential.
4 Conclusion
In this work, the Brownian diffusion of the linear and star-shaped polymer chains of different functionalities is simulated using MPCD. It is shown that the radius of gyration of the star-shaped polymer chains follows a functionality-independent scaling law with chain length, in which the scaling exponent . The linear chain is shown to be more anisotropic than the star-shaped chains, and for star-shaped chains, the value of relative shape anisotropy decreases with an increase in functionality. For the same radius of gyration, the linear chain diffuses at a faster rate along the translational direction and has a slower rate of rotational diffusion than the star-shaped chains. Among star-shaped chains with the same radius of gyration, higher functionality leads to a higher value of rotational diffusion coefficient and a slower rate of diffusion along the translational direction. In terms of the shape parameter, we conclude that the star-shaped chains with higher values of relative shape anisotropy have a slower rate of rotational diffusion and therefore diffuse at a faster rate along the translational direction. Hence, shape anisotropy leads to faster center-of-mass diffusion of star-shaped polymer chains in a solution.
G.T. acknowledges partial support from the Department of Science and Technology National Supercomputing Mission HPC system in the Supercomputing Education and Research Center-Indian Institute of Science. A.K. acknowledges partial support from SERB CRG/2022/005381. P.K.P. acknowledges partial support from the Ministry of Education, Government of India.
References
- Bird and Curtiss 1984 Bird, R. B.; Curtiss, C. F. Fascinating polymeric liquids. Physics Today 1984, 37, 36–43
- Schroeder 2018 Schroeder, C. M. Single polymer dynamics for molecular rheology. Journal of Rheology 2018, 62, 371–403
- Theodorou and Suter 1985 Theodorou, D. N.; Suter, U. W. Shape of unperturbed linear polymers: polypropylene. Macromolecules 1985, 18, 1206–1214
- Fournier et al. 2007 Fournier, D.; Hoogenboom, R.; Schubert, U. S. Clicking polymers: a straightforward approach to novel macromolecular architectures. Chemical Society Reviews 2007, 36, 1369–1380
- Duro-Castano et al. 2015 Duro-Castano, A.; England, R. M.; Razola, D.; Romero, E.; Oteo-Vives, M.; Morcillo, M. A.; Vicent, M. J. Well-Defined Star-Shaped Polyglutamates with Improved Pharmacokinetic Profiles As Excellent Candidates for Biomedical Applications. Molecular Pharmaceutics 2015, 12, 3639–3649, PMID: 26355563
- Port et al. 1951 Port, W. S.; O’Brien, J. W.; Hansen, J. E.; Swern, D. Viscosity Index Improvers for Lubricating Oils. Polyvinyl Esters ofLong-Chain Fatty Acids. Industrial & Engineering Chemistry 1951, 43, 2105–2107
- Peppas et al. 1999 Peppas, N. A.; Keys, K. B.; Torres-Lugo, M.; Lowman, A. M. Poly (ethylene glycol)-containing hydrogels in drug delivery. Journal of controlled release 1999, 62, 81–87
- Mika and Poolman 2011 Mika, J. T.; Poolman, B. Macromolecule diffusion and confinement in prokaryotic cells. Current opinion in biotechnology 2011, 22, 117–126
- Trevors 2012 Trevors, J. A perspective on the mobilization, localization and delivery of molecules in the crowded bacterial cytoplasm. Current Issues in Molecular Biology 2012, 14, 39–46
- Robertson et al. 2006 Robertson, R. M.; Laib, S.; Smith, D. E. Diffusion of isolated DNA molecules: Dependence on length and topology. Proceedings of the National Academy of Sciences 2006, 103, 7310–7314
- Kanaeda and Deguchi 2008 Kanaeda, N.; Deguchi, T. Diffusion of a ring polymer in good solution via the Brownian dynamics with no bond crossing. Journal of Physics A: Mathematical and Theoretical 2008, 41, 145004
- Hegde et al. 2011 Hegde, G. A.; Chang, J.-f.; Chen, Y.-l.; Khare, R. Conformation and diffusion behavior of ring polymers in solution: A comparison between molecular dynamics, multiparticle collision dynamics, and lattice Boltzmann simulations. The Journal of chemical physics 2011, 135, 184901
- Singh et al. 2014 Singh, S. P.; Huang, C.-C.; Westphal, E.; Gompper, G.; Winkler, R. G. Hydrodynamic correlations and diffusion coefficient of star polymers in solution. The Journal of chemical physics 2014, 141, 084901
- Khabaz and Khare 2014 Khabaz, F.; Khare, R. Effect of chain architecture on the size, shape, and intrinsic viscosity of chains in polymer solutions: A molecular simulation study. The Journal of chemical physics 2014, 141, 214904
- Gompper et al. 2009 Gompper, G.; Ihle, T.; Kroll, D.; Winkler, R. Multi-particle collision dynamics: A particle-based mesoscale simulation approach to the hydrodynamics of complex fluids. Advanced computer simulation approaches for soft matter sciences III 2009, 1–87
- Weeks et al. 1971 Weeks, J. D.; Chandler, D.; Andersen, H. C. Role of repulsive forces in determining the equilibrium structure of simple liquids. The Journal of chemical physics 1971, 54, 5237–5247
- Warner Jr 1972 Warner Jr, H. R. Kinetic theory and rheology of dilute suspensions of finitely extendible dumbbells. Industrial & Engineering Chemistry Fundamentals 1972, 11, 379–387
- Kremer and Grest 1990 Kremer, K.; Grest, G. S. Dynamics of entangled linear polymer melts: A molecular-dynamics simulation. The Journal of Chemical Physics 1990, 92, 5057–5086
- Gartner III and Jayaraman 2019 Gartner III, T. E.; Jayaraman, A. Modeling and simulations of polymers: a roadmap. Macromolecules 2019, 52, 755–786
- Malevanets and Kapral 1999 Malevanets, A.; Kapral, R. Mesoscopic model for solvent dynamics. The Journal of chemical physics 1999, 110, 8605–8613
- Allahyarov and Gompper 2002 Allahyarov, E.; Gompper, G. Mesoscopic solvent simulations: Multiparticle-collision dynamics of three-dimensional flows. Physical Review E 2002, 66, 036702
- Allen and Tildesley 1989 Allen, M.; Tildesley, D. Computer simulation of liquids: Oxford university press.[Google Scholar]. 1989,
- Jiang et al. 2013 Jiang, L.; Watari, N.; Larson, R. G. How accurate are stochastic rotation dynamics simulations of polymer dynamics? Journal of Rheology 2013, 57, 1177–1194
- Nikoubashman and Howard 2017 Nikoubashman, A.; Howard, M. P. Equilibrium dynamics and shear rheology of semiflexible polymers in solution. Macromolecules 2017, 50, 8279–8289
- Chen et al. 2017 Chen, A.; Zhao, N.; Hou, Z. The effect of hydrodynamic interactions on nanoparticle diffusion in polymer solutions: a multiparticle collision dynamics study. Soft matter 2017, 13, 8625–8635
- Chen et al. 2018 Chen, R.; Poling-Skutvik, R.; Nikoubashman, A.; Howard, M. P.; Conrad, J. C.; Palmer, J. C. Coupling of nanoparticle dynamics to polymer center-of-mass motion in semidilute polymer solutions. Macromolecules 2018, 51, 1865–1872
- Padding and Louis 2006 Padding, J.; Louis, A. Hydrodynamic interactions and Brownian forces in colloidal suspensions: Coarse-graining over time and length scales. Physical Review E 2006, 74, 031402
- Ihle and Kroll 2001 Ihle, T.; Kroll, D. Stochastic rotation dynamics: A Galilean-invariant mesoscopic model for fluid flow. Physical Review E 2001, 63, 020201
- Thompson et al. 2022 Thompson, A. P.; Aktulga, H. M.; Berger, R.; Bolintineanu, D. S.; Brown, W. M.; Crozier, P. S.; in ’t Veld, P. J.; Kohlmeyer, A.; Moore, S. G.; Nguyen, T. D.; Shan, R.; Stevens, M. J.; Tranchida, J.; Trott, C.; Plimpton, S. J. LAMMPS - a flexible simulation tool for particle-based materials modeling at the atomic, meso, and continuum scales. Comp. Phys. Comm. 2022, 271, 108171
- 201 2017 GitHub - palmergroup/mpcd_polymer_colloid: Adaptation of LAMMPS’ stochastic rotation dynamics module to perform multi-particle collision dynamics simulations of polymer and colloid solutions using an Andersen thermostat. https://github.com/palmergroup/mpcd_polymer_colloid, 2017; [Online; accessed 2023-01-28]
- Stukowski 2009 Stukowski, A. Visualization and analysis of atomistic simulation data with OVITO–the Open Visualization Tool. Modelling and simulation in materials science and engineering 2009, 18, 015012
- Rubinstein et al. 2003 Rubinstein, M.; Colby, R. H., et al. Polymer physics; Oxford university press New York, 2003; Vol. 23
- Witten Jr and Schäfer 1981 Witten Jr, T.; Schäfer, L. Spatial monomer distribution for a flexible polymer in a good solvent. The Journal of Chemical Physics 1981, 74, 2582–2588
- Doi and Edwards 1986 Doi, M.; Edwards, S. Modern Theory of Polymer Dynamics. Clarendon, Oxford 1986,
- Cotton et al. 1974 Cotton, J. P.; Decker, D.; Farnoux, B.; Jannink, G.; Ober, R.; Picot, C. Experimental Determinations of the Excluded-Volume Exponent in Different Environments. Phys. Rev. Lett. 1974, 32, 1170–1172
- Smith et al. 1996 Smith, D. E.; Perkins, T. T.; Chu, S. Dynamical scaling of DNA diffusion coefficients. Macromolecules 1996, 29, 1372–1373
- Poling-Skutvik et al. 2015 Poling-Skutvik, R.; Krishnamoorti, R.; Conrad, J. C. Size-dependent dynamics of nanoparticles in unentangled polyelectrolyte solutions. ACS Macro Letters 2015, 4, 1169–1173
- Peng et al. 2022 Peng, B.; Yang, Z.; Yang, L.; Chen, J.; Liu, L.; Wang, D. Reducing the Solvent Quality Gives Rise to the Outward Migration of a Star Polymer in Poiseuille Flow. Macromolecules 2022, 55, 3396–3407
- Daoud and Cotton 1982 Daoud, M.; Cotton, J. Star shaped polymers: a model for the conformation and its concentration dependence. Journal de Physique 1982, 43, 531–538
- Grest et al. 1987 Grest, G. S.; Kremer, K.; Witten, T. Structure of many arm star polymers: a molecular dynamics simulation. Macromolecules 1987, 20, 1376–1383
- Koyama 1968 Koyama, R. Excluded Volume Effect on the Intrinsic Viscosity of Chain Polymers. Journal of the Physical Society of Japan 1968, 24, 580–588
- Zifferer 1999 Zifferer, G. Monte Carlo simulation studies of the size and shape of linear and star-branched polymers embedded in the tetrahedral lattice. Macromolecular theory and simulations 1999, 8, 433–462
- Burchard and Schmidt 1980 Burchard, W.; Schmidt, M. Static and dynamic structure factors calculated for flexible ring macromolecules. Polymer 1980, 21, 745–749
- Huber et al. 1984 Huber, K.; Burchard, W.; Fetters, L. J. Dynamic light scattering from regular star-branched molecules. Macromolecules 1984, 17, 541–548
- Wong et al. 2009 Wong, V.; Case, D. A.; Szabo, A. Influence of the coupling of interdomain and overall motions on NMR relaxation. Proceedings of the National Academy of Sciences 2009, 106, 11016–11021