Differential thermopower images as a probe of many-body effects in quantum point contacts
Mesoscopic circuit elements such as quantum dots and quantum point contacts (QPCs) offer a uniquely controllable platform for engineering complex quantum devices, whose tunability makes them ideal for generating and investigating interacting quantum systems. However, the conductance measurements commonly employed in mesoscopics experiments are poorly suited to discerning correlated phenomena from those of single-particle origin. Here, we introduce non-equilibrium thermopower measurements as a novel approach to probing the local density of states (LDOS), offering an energy-resolved readout of many-body effects. We combine differential thermopower measurements with non-equilibrium density functional theory (DFT) to both confirm the presence of a localized state at the saddle point of a QPC and reveal secondary states that emerge wherever the reservoir chemical potential intersects the gate-induced potential barrier. These experiments establish differential thermopower imaging as a robust and general approach to exploring quantum many-body effects in mesoscopic circuits.
Thermal measurements are currently emerging as powerful probes for the investigation of strongly correlated quantum states in low-dimensional systems. For instance, thermal conductance provides strong evidence for non-abelian quasiparticles in fractional quantum Hall samples Banerjee et al. (2018), and chemical-potential measurements have demonstrated the emergence of Pomeranchuk-like local moments in twisted bilayer graphene Rozen et al. (2021); Saito et al. (2021). With a view to experimental implementations, thermopower is of particular interest, as it can be read out as easily as conductance while still probing thermodynamic characteristics. Thermopower has been proposed as a metric to characterize the non-Fermi liquid nature of strongly interacting quantum states in, for example, multi-channel charge Kondo circuits Nguyen and Kiselev (2020) and condensed matter realizations of the SYK model Kruchkov et al. (2020). However, experimental investigations of mesoscopic thermodynamics are still in their infancy. Typically, comparisons are made to single-particle predictions of the Mott formula Cutler and Mott (1969) as a way of testing for the presence of interactions, but without offering microscopic insight into what role those interactions might play. Here, we show that non-equilibrium thermopower measured in a mesoscopic system offers an energy-resolved readout of many-body effects in the density of states, that can be compared directly with state-of-the-art modelling.
As an initial test for this approach, we turn our attention to the most prototypical of mesoscopic devices, the quantum point contact (QPC). QPCs are short saddle-point constrictions in a 2D sheet of high-mobility electrons whose transmission can be tuned by a gate voltage van Wees et al. (1988); Wharam et al. (1988); Büttiker (1990). Near pinchoff, interactions dominate the potential landscape seen by electrons in a QPC, and it has been proposed that localized states emerge in and near the constriction due to interactions Hirose et al. (2003); Rejec and Meir (2006); Ihnatsenka and Zozoulenko (2009); Güçlü et al. (2008); Qian and Halperin (2008). Such localized states can, for example, explain the phenomenology of an extra plateau — the famed 0.7 structure — that appears in the conductance of the cleanest QPCs Thomas et al. (1998); Cronenwett et al. (2002). Beyond their ability to explain the conductance characteristics of 0.7 structure, however, direct evidence for localized states remains scarce Iqbal et al. (2013); Brun et al. (2014), and what evidence there is leaves open the possibility of different interpretations Bauer et al. (2013). Here, we demonstrate that non-equilibrium thermopower data offers a complete spectroscopic map of the energy of localized states in a QPC and their effect on the local density of states, enabling a direct comparison to DFT (or other) models as a test of their accuracy.
Thermopower, , quantifies the excess voltage that appears across a device due to a temperature difference, , between drain and source reservoirs when the current through the device fixed: . typically reflects an imbalance between the electron flow above the chemical potential, , and hole flow below . That imbalance yields a temperature-driven current that must be counteracted by a voltage to keep the net current constant. Multiplying by the differential conductance, , the product is often more useful to analyze than itself as it provides direct access to the temperature-driven current rather than the voltage that builds up to oppose it. is connected to the derivative of the energy-dependent transmission through the device at , , making it sensitive to fine features in the density of states and offering therefore an important advantage over conductance, which depends on . Early measurements of QPC thermopower confirmed peaks in at the entry of each new subband, where is large Kozub and Rudin (1994); Houten et al. (1999), whereas later experiments identified significant deviations from the thermopower that would be expected in a simple picture of non-interacting 1D subbands, and inspired the measurements presented here Appleyard et al. (2000).
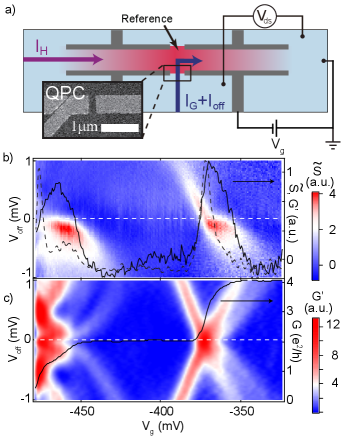
Although is often measured with the current fixed at zero, differential measurements of may also be performed with a bias current that offsets source and drain chemical potentials by ( is defined in the limit ). The temperature of one of the reservoirs is then oscillated to measure . In mesoscopic systems such as QPCs, () offers a spectroscopic readout of thermopower that quantifies at the chemical potential of the reservoir whose temperature changes Appleyard et al. (2000). This represents a further distinct advantage of over standard measurements of differential conductance at finite bias, which superimpose features at both source and drain potentials. (See, for example, Fig. 1b vs 1c.)
In this paper, we analyze spectra of QPCs covering weakly to strongly interacting regimes [Fig. 1b]. The data are broadly consistent with published experiments Appleyard et al. (2000), but a careful examination reveals robust signatures that are inconsistent with existing theoretical models. The new realization described in this paper is that those signatures are in fact a direct readout of many-body modifications to the density of states in the QPC. In order to clarify this connection, we extend density functional theory (DFT) previously developed to describe the microscopic state of QPCs at equilibrium, to incorporate non-equilibrium effects on the potential due to finite bias and different source/drain temperatures. Although exact steady-state DFT has, in principle, been formulated for non-equilibrium conditions Stefanucci and Kurth (2015); Sobrino et al. (2019), a Landauer+DFT approach Hirose and Tsukada (1995); Lang (1995) is used here (see the SI) due to the lack of a corresponding exchange-correlation functional.
The result of our analysis is a more complete understanding of QPCs as strongly interacting mesoscopic elements: the convenient but naive picture in which gate voltages uniquely define a saddle-point potential barrier evolves to one in which the self-consistent barrier that determines transmission is additionally a result of charge and spin degrees of freedom at the barrier responding to non-equilibrium conditions imposed by the reservoirs. Our data highlight the critical role of localized states that emerge when the bottom of a 1D subband crosses the chemical potential. These states were previously invoked to explain 0.7 structure in QPC conductance Meir et al. (2002); Meir (2008); here they explain striking thermopower signatures that defy other explanation.
QPCs were defined in the wall of a micron-wide channel (Fig. 1a). The interior of the channel formed the grounded drain of the QPC, which could be Joule-heated to mK by passing current while the source remained at base temperature (mK) due to its low-resistance connection to an ohmic contact. Independent AC currents and enabled simultaneous lock-in measurement of and , while at DC was used to offset and , see Methods. The thermal voltage across the QPC was dominated by diffusion thermopower, with phonons nearly absent at mK.
Figure 1b shows for a typical QPC. For comparison, Fig. 1c shows the trans-conductance, , another metric that is related to when controls . This connection is, however, indirect in interacting systems where itself depends on , and when the shape of the potential changes with as is often the case in mesoscopic devices. Because is based on conductance, Fig. 1c is symmetric around , superimposing features at the source chemical potential (lower left to upper right in the image) on others at the drain (upper left to lower right). For the discussion that follows, the lack of symmetry in [Fig. 1b] is greatly clarifying, distinguishing responses at negative energy from those at positive energy (below vs above the average ). This will, for example be key to identifying the role of localized states in the analysis to come.
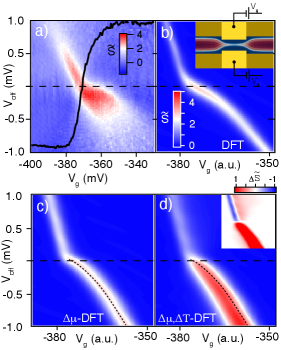
We first consider measurements in a regime of relatively weak interactions, at the transition where the second subband drops below the chemical potential. Figure 2 compares experimental data to three levels of numerical simulation. Fig. 2b [DFT] represents an equilibrium calculation: the QPC potential and LDOS are calculated self-consistently for each , assuming and mK, with obtained from Kohn–Sham scattering statesHirose and Tsukada (1995); Lang (1995). is determined from the simulation by comparing the current through the device for {mK, mK} and mK, where current is calculated by integrating over thermally broadened source and drain reservoirs offset by .
Figures 2c [-DFT] and 2d [,-DFT] bring in the non-equilibrium character of the experiment at increasing levels. First, in Fig. 2c [-DFT] the LDOS and are recalculated for each {, } pair, including different reservoir potentials but still assuming mK. As before, is determined for each by comparing the currents at and mK. Fig. 2d [,-DFT] extends this to include different values of from the beginning, that is, including the effect of the elevated drain temperature on the LDOS and thereby on .
All simulations capture the diagonal motion of the subband, with a kink in the slope at due to the divergence in the 1D density of states at the bottom of of the subband. But Figs. 2b,c miss the broadening of the subband thermopower after crossing , which only appears once finite temperature difference is taken into account (Fig. 2d). The difference between Fig. 2c and 2d, shown in the inset of Fig. 2d, highlights one of the most important insights to be gained from this work: temperature affects mesoscopic transport, including thermopower, not only by broadening the reservoir Fermi distributions (Figs. 2b,c), but also by changing the screened QPC potential itself, the LDOS, and thereby (Fig. 2d). We take advantage of this sensitivity to probe sharp features in the LDOS, which are more strongly affected by a change in temperature.
For insight into this effect, consider the full electrostatic potential seen by an incoming electron just at the entry of the second subband, including the potential defined by electrostatic gates as well as repulsion from electrons occupying the first or second subbands. With at the bottom of second subband, the density of states is significantly larger just above than below, so thermal broadening around leads to a net increase in electron density (more electrons occupying the second subband). This extra negative charge creates a more repulsive potential for the incoming electron, reducing the total (positive) current and suppressing when . The contribution is opposite when the potentials are reversed, yielding the broad positive feature in when . For further discussion of Fig. 2d, see the SI.
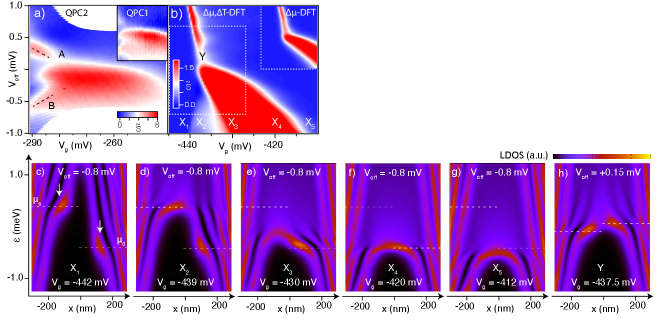
Building off this insight, we turn to the entry of the first subband into the QPC, the transition, where interactions are widely believed to dominate conductance phenomenology (Fig. 3a). As in the case of the second-subband data, the feature moving diagonally down from the upper left reflects the subband lowering in energy with more positive gate voltage. In contrast to Fig. 2a, however, this feature reduces significantly in strength just before crossing (location ‘A’ in Fig. 3a), then after crossing it broadens and strengthens much more dramatically than for the second subband. In fact, the extension of this feature to more negative is so extreme as to create an extra ‘leg’ of strong that moves down and to the left, as if associated with the movement of the source instead of the drain (‘B’ in Fig. 3a). Analogous features were observed in all QPCs measured.
These new features in the first-subband thermopower are clearly reproduced in the -DFT (Fig. 3b), but are missing from simulations that leave temperature difference out of the self-consistent potential calculation (inset in Fig. 3b). This demonstrates that they originate in the temperature-dependent screening effect described previously. In order to understand this phenomenology more fully, we examine the LDOS at several points in Fig. 3b. Consider, first, the row of points XX5 at mV, for which energy-dependent LDOS maps along the axis of the QPC are illustrated in Fig. 3c–g. Localized enhancements of the LDOS (localized states) are clearly visible anywhere or intersect the potential barrier, especially noticeable in Fig. 3c–e. The fact that these states are pinned close to or is key to their strong effect on the thermopower.
The simplest cases are the extremes, X1 and X5. At X1, is zero simply because the barrier is well above and , so that no current can flow ( as at both and ). At , again because in the fully transmitting first subband, where both chemical potentials lie. Next simplest is X4, where large is expected from a conventional thermopower picture, due to the alignment of with the bottom of the subband, where is maximum.
Points X2 and X3 are more interesting. At X2, for example, the conventional picture would predict , because and are both zero at , and the large at does not contribute to the thermopower because is not varied. However, significant is observed, in both simulation and experiment. A closer analysis of the simulation results shows that appearing at this location is due to temperature-induced charging of the localized state at , which affects the barrier potential and thereby the current. This effect is even stronger at , where the localized state is sharper and the barrier maximum is far from either reservoir potential, free to shift as the localized state charges.
Thermopower observed at is analogous to, but much stronger than, the broadening of second-subband thermopower in Fig. 2d, compared to Fig. 2c. In both cases, temperature-induced charging of the LDOS where intersects the bottom of the subband shifts the entire subband up in energy, tending to reduce the current. This broadening is stronger for the first subband due to the localized state at , as seen from the significantly wider extent of large in Fig. 3b compared to Fig. 2d.
The fact that a large remains all the way to in Fig. 3b can be traced, in the simulation, to the second localized state at (see Fig. 3d). The exchange term included in the DFT is what allows for the emergence of localized states; analogous simulations without the exchange term retain the thermopower at , but the extension to (which maps to feature ‘B’ in the data) is gone. The localized state at makes the potential at the barrier top especially sensitive to charging of the state at , just as quantum dots at a Coulomb blockade transition charge sharply in response to a small changes in gate voltage (see the SI).
The weakening of thermopower just above , marked in Fig. 3b, is again a signature that appears only when temperature-induced screening is taken into account, and can be motivated by the same qualitative arguments as above. As seen in Fig. 3h, a localized state is pinned at , but in this case is above . Thermally induced charging of the localized state (which raises the QPC barrier) therefore reduces the current from drain to source, opposing the conventional sign of thermopower and leading to the reduction seen at .
It is remarkable that this qualitative picture, involving a localized state becoming more occupied (more negatively charged) at higher temperatures, so consistently explains the sign of thermopower modifications throughout the pinchoff region. These modifications depend on the derivative of 1D subband LDOS with respect to energy: when is just below a peak in the LDOS, the state will charge with ; when it is just above, the state will discharge, and the opposite sign of thermopower will be observed. The consistency of the sign observed in both experiment and simulation is therefore a clear indication that the localized state is pinned to just above , regardless of the details of the QPC electrostatic potential.
This pinning of the localized state just above was a characteristic specifically of the unpolarized solution of the DFT equations, even though there was another, polarized, solution that, at equilibrium, was lower in free energy. Polarized DFT solutions are ones in which the LDOS may be different between the two spin species; the thermopower calculated from this solution did not match the experiment, see the SI. The unpolarized solution, presented throughout this paper, forces them to remain the same. The fact that the unpolarized solution more closely matches the data supports the role of Kondo physics in the low-energy spectrum of QPCs: Kondo correlations would tend to lower the energy of the spin-singlet (unpolarized) state, but these correlations are not captured in the local density functional used here.
In conclusion, we have discovered a new route to probing the LDOS in mesoscopic structures, by differential thermopower measurements at finite bias. Whereas conventional thermopower is a single-particle effect that probes energy-dependent scattering, this new mechanism is based on interactions and reflects thermal screening of the self-consistent potential landscape due to an energy-dependent density of states. As 0.7 structure in QPC conductance is difficult to explain without a localized state, our data reflect robust signatures in QPC thermopower, covering a large fraction of parameter space near pinchoff, that also cannot be explained without this state. Remarkably, a non-equilibrium DFT calculation that includes mean-field Coulomb interaction, spin via an exchange potential, and finite temperatures in the leads, reproduces nearly all features of the thermopower data with no fine-tuning of parameters.
METHODS: Multiple bias currents are used in this experiment to measure and independently, and to control the chemical potential offset between source and drain reservoirs. The measurement of is analogous to nonlinear conductance data reported by many groups in the past, albeit in a less-conventional current biased configuration. A small oscillating , at frequency , is added to a DC . Locking in to oscillations in at then yields the differential conductance at a that is fixed by . Although can in principle be measured directly for a given as the DC component of , in practice we find it by a numerical integration of over , an approach that was found to yield less measurement noise while giving consistent values.
The measurement of proceeds in a similar way: temperature is oscillated by Joule heating due to current bias through the channel. With oscillated at frequency , the thermal voltage is detected by locking in to at as is scanned (as above) to investigate for varying source and drain chemical potentials. The combination of two AC bias currents and and one DC current thus enables a simultaneous measurement of and while scanning (and measuring) . on the order of nA elevated the temperature by mK, estimated using the magnitude of for at higher subband transitions, where thermopower in QPCs is well understood.
In practice the measured includes contributions both from QPC thermopower and from the 2DEG in the channel. The extra 2DEG contribution can be quantified by measuring the thermal voltage across the reference QPC set at on a condutance plateau, where the thermopower is zero, but in practice this contribution was found to be negligible.
ACKNOWLEDGEMENTS: This project has received funding from European Research Council (ERC) under the European Union’s Horizon 2020 research and innovation programme under grant agreement No 951541. YM acknowledges support by the Israel Science Foundation (grant 3523/2020). TR acknowledges support by Slovenian Research Agency under Contract No. P1-0044. JF acknowledges support from the Stewart Blusson Quantum Matter Institute, the Natural Sciences and Engineering Research Council of Canada, the Canada Foundation for Innovation, the Canadian Institute for Advanced Research, and the Canada First Research Excellence Fund, Quantum Materials and Future Technologies Program.
References
- Banerjee et al. (2018) M. Banerjee, M. Heiblum, V. Umansky, D. E. Feldman, Y. Oreg, and A. Stern, Nature 559, 205 (2018).
- Rozen et al. (2021) A. Rozen, J. M. Park, U. Zondiner, Y. Cao, D. Rodan-Legrain, T. Taniguchi, K. Watanabe, Y. Oreg, A. Stern, E. Berg, P. Jarillo-Herrero, and S. Ilani, Nature 592, 214 (2021).
- Saito et al. (2021) Y. Saito, F. Yang, J. Ge, X. Liu, T. Taniguchi, K. Watanabe, J. I. A. Li, E. Berg, and A. F. Young, Nature 592, 220 (2021).
- Nguyen and Kiselev (2020) T. K. T. Nguyen and M. N. Kiselev, Phys. Rev. Lett. 125, 026801 (2020).
- Kruchkov et al. (2020) A. Kruchkov, A. A. Patel, P. Kim, and S. Sachdev, Phys. Rev. B 101, 205148 (2020).
- Cutler and Mott (1969) M. Cutler and N. Mott, Physical Review 181, 1336 (1969).
- van Wees et al. (1988) B. J. van Wees, H. van Houten, C. W. J. Beenakker, J. G. Williamson, L. P. Kouwenhoven, D. van der Marel, and C. T. Foxon, Phys. Rev. Lett. 60, 848 (1988).
- Wharam et al. (1988) D. A. Wharam, T. J. Thornton, R. Newbury, M. Pepper, H. Ahmed, J. E. F. Frost, D. G. Hasko, D. C. Peacock, D. A. Ritchie, and G. A. C. Jones, J. Phys. C 21, L209 (1988).
- Büttiker (1990) M. Büttiker, Phys. Rev. B 41, 7906(R) (1990).
- Hirose et al. (2003) K. Hirose, Y. Meir, and N. Wingreen, Physical Review Letters 90, 026804 (2003).
- Rejec and Meir (2006) T. Rejec and Y. Meir, Nature 442, 900 (2006).
- Ihnatsenka and Zozoulenko (2009) S. Ihnatsenka and I. V. Zozoulenko, Phys. Rev. B 79, 235313 (2009).
- Güçlü et al. (2008) A. D. Güçlü, A. Ghosal, C. J. Umrigar, and H. U. Baranger, Phys. Rev. B 77, 041301 (2008).
- Qian and Halperin (2008) J. Qian and B. I. Halperin, Phys. Rev. B 77, 085314 (2008).
- Thomas et al. (1998) K. J. Thomas, J. T. Nicholls, N. J. Appleyard, M. Y.Simmons, M. Pepper, D. R. Mace, W. R. Tribe, and D. A. Ritchie, Phys. Rev. B 58, 4846 (1998).
- Cronenwett et al. (2002) S. M. Cronenwett, H. J. Lynch, D. Goldhaber-Gordon, L. P. Kouwenhoven, C. M. Marcus, K. Hirose, N. S. Wingreen, , and V. Umansky, Phys. Rev. Lett. 88, 226805 (2002).
- Iqbal et al. (2013) M. J. Iqbal, R. Levy, E. J. Koop, J. B. Dekker, J. P. de Jong, J. H. M. van der Velde, D. Reuter, A. D. Wieck, R. Aguado, Y. Meir, and C. H. van der Wal, Nature 501, 79 (2013).
- Brun et al. (2014) B. Brun, F. Martins, S. Faniel, B. Hackens, G. Bachelier, A. Cavanna, C. Ulysse, A. Ouerghi, U. Gennser, D. Mailly, S. Huant, V. Bayot, M. Sanquer, and H. Sellier, Nature Communications 5 (2014), 10.1038/ncomms5290.
- Bauer et al. (2013) F. Bauer, J. Heyder, E. Schubert, D. Borowsky, D. Taubert, B. Bruognolo, D. Schuh, W. Wegscheider, J. von Delft, and S. Ludwig, Nature 501, 73 (2013).
- Kozub and Rudin (1994) V. Kozub and A. Rudin, Phys. Rev. B 50, 2681 (1994).
- Houten et al. (1999) H. v. Houten, L. W. Molenkamp, C. W. J. Beenakker, and C. T. Foxon, Semiconductor Science and Technology 7, B215 (1999).
- Appleyard et al. (2000) N. Appleyard, N. Appleyard, J. Nicholls, J. Nicholls, M. Pepper, M. Pepper, W. Tribe, W. Tribe, M. Simmons, M. Simmons, D. Ritchie, and D. Ritchie, Phys. Rev. B 62, R16275 (2000).
- Stefanucci and Kurth (2015) G. Stefanucci and S. Kurth, Nano Letters 15, 8020 (2015).
- Sobrino et al. (2019) N. Sobrino, R. D’Agosta, and S. Kurth, Phys. Rev. B 100, 195142 (2019).
- Hirose and Tsukada (1995) K. Hirose and M. Tsukada, Phys. Rev. B 51, 5278 (1995).
- Lang (1995) N. D. Lang, Phys. Rev. B 52, 5335 (1995).
- Meir et al. (2002) Y. Meir, K. Hirose, and N. S. Wingreen, Physical Review Letters 89, 196802 (2002).
- Meir (2008) Y. Meir, J. Phys.: Condens. Matter 20, 164208 (2008).