Determined Multichannel Blind Source Separation with Clustered Source Model
Abstract
The independent low-rank matrix analysis (ILRMA) method stands out as a prominent technique for multichannel blind audio source separation. It leverages nonnegative matrix factorization (NMF) and nonnegative canonical polyadic decomposition (NCPD) to model source parameters. While it effectively captures the low-rank structure of sources, the NMF model overlooks inter-channel dependencies. On the other hand, NCPD preserves intrinsic structure but lacks interpretable latent factors, making it challenging to incorporate prior information as constraints. To address these limitations, we introduce a clustered source model based on nonnegative block-term decomposition (NBTD). This model defines blocks as outer products of vectors (clusters) and matrices (for spectral structure modeling), offering interpretable latent vectors. Moreover, it enables straightforward integration of orthogonality constraints to ensure independence among source images. Experimental results demonstrate that our proposed method outperforms ILRMA and its extensions in anechoic conditions and surpasses the original ILRMA in simulated reverberant environments.
Index Terms:
Independent low rank matrix analysis, multichannel blind audio source separation, block term decomposition.I Introduction
In real-world applications, the observation of a source signal of interest frequently suffers from interference. Therefore, it is essential to use signal processing techniques to extract latent sources from observed mixtures by multiple microphones [1, 2]. Generally, there are two different paradigms for source separation. One is beamforming, which extracts the components from mixed signals using direction information with spatial filtering techniques [3, 4, 5]. They usually assume that the geometry of array and the incidence angle of each source are known. Another paradigm is to perform multichannel blind audio source separation (MBASS) based on independent component analysis (ICA) [6], which exploits the statistical independence of source signals. This study focuses on the latter paradigm.
Generally, MBASS is conducted in the short-time Fourier transform (STFT) domain to address convolutive mixing. However, a significant challenge arises due to inner permutations, which can greatly affect separation performance. To tackle this issue, independent vector analysis (IVA) [7] was then adopted, and the majorization-minimization (MM) principle [8] was introduced to derive fast update rules for IVA [9]. Despite its effectiveness in handling permutations, IVA-based methods often overlook spectral structure information. To incorporate spectral structure, nonnegative matrix factorization (NMF) [10] was extended to multichannel cases for MBASS [11, 12, 13]. However, Multichannel NMF methods are computationally demanding and sensitive to parameter initialization. In response to these challenges, the independent low-rank matrix analysis (ILRMA) method was devised [14]. ILRMA enforces an interpretable low-rank structure constraint on the spectrogram and employs a rank-one relaxation for the spatial model.
To further improve performance, efforts have been directed towards enhancing the source model by generalizing the distribution of source signals and achieving initialization-robust performance [15, 16, 17, 18, 19]. Additionally, research has explored the integration of prior constraints into parameters associated with the source model to enhance MBASS performance [20, 21]. However, these NMF-based methods are typically inadequate to capture inter-channel dependencies and higher-order structures inherent in multichannel data. While Kitamura [14] also discussed a CPD-based source model, its spectral distinctiveness remains somewhat deficient.
In this paper, we propose a clustered source model for determined blind source separation. Utilizing nonnegative block-term decomposition (NBTD), the source model parameters are expressed as a summation of several components, each being the outer product of a vector and a matrix. By applying orthogonality constraints to the latent vectors of this decomposition, they gain a clear interpretation, revealing distinct clusters of sources.
II Signal model and problem formulation
Let and be the number of microphones and sources, respectively. The observed signal in the STFT domain can be expressed as:
| (1) |
where the subscripts and denote, respectively, the frequency and frame indices, and denote, the total number of STFT bins and time frames, and are, respectively, the vectors consisting of the STFTs of the observation and source signals, respectively, represents the image of the th source, and is called the mixing matrix. All the signals are assumed to have zero mean.
With the signal model given in (1), the problem of blind source separation (BSS) becomes one of identifying a demixing matrix such that
| (2) |
where denotes an estimate of the source signal , and . The difficulty of this identifiying depends on many factors, e.g., number of sources, number of sensors, the nature of the source signals, the property of the mixing system. In this work, we focus on the case where the number of souces is equal to the number of microphone sensors, i.e., and assume that the source signals are mutually independent and their distributions are stationary. Given these conditions, the problem of MBSS can be solved using only the second-order statistics [2].
From (1), the covariance matrix of mixtures is . Using the signal model given in (1), we obtain
| (3) |
Under the assumption of statistical independence among sources, the covariance matrix of sources should be a diagonal matrix, which can be represented as . Let us stack all the non-zeros parameters in to form a large matrix, i.e.,
| (5) |
where is a matrix consisting of all the parameters associated with the th source, and is a matrix of size , i.e., , which encompass all the parameters of the source model,
In ILRMA, the NMF tool is used to decompose the matrix , , into the following form:
| (6) |
where is a basis matrix of size with being the number of bases, and is called the activation matrix, whose dimension is . This decomposition based source modeling is referred to as the NMF source model.
Another way to model the source model parameters is through a rank-one-tensor decomposition of the matrix , leading to the non-negative CPD (NCPD) based source model. In NCPD, the matrix is expressed as
| (7) |
where
| (9) | ||||
| (11) | ||||
| (13) |
and denotes the outer product.
II-A Proposed source model
While the NCPD method adeptly captures the intricate nature of multi-channel data by expressing the source parameter tensor as a summation of a series of rank-one tensors, it is essential to acknowledge that multi-channel signals often exhibit a more nuanced structure in the time-frequency domain. This nuanced structure can be better modeled with the so-called nonnegative block term decomposition (NBTD), which emerges as a potent tensor factorization model tailor-made to precisely capture localized and recurring patterns within the time-frequency representation of speech signals [22]. The decomposition process is illustrated in Fig. 1 and can be mathematically written as follows:
| (14) | ||||
| (16) |
where , , , and are all non-negative matrices, and denotes the outer product. It is easy to check that in this decomposition each elements of is presented as . This decomposition based source modeling is referred to as the NBTD source model.
Let us introduce two matrices:
| (17) | ||||
| (18) |
where the matrix satisfies the orthogonal constraint. This constraint not only relates the NBTD based source model to the k-means clustering of spectral components, but also allows the formula (14) to be expressed in the form of a diagonal matrix under each time-frequency bins:
| (19) |
Following the orthogonal constraints on matrix , we have . It can also be expressed as:
| (20) |
It indicates the clusters of sources of source model in cILRMA which fully utilize the spectral structure. Then, We build the generative model of covariance matrix for cILRMA as:
| (21) |
Generally, it is assumed that mixed signal in each STFT bin follow a complex Gaussian distribution, i.e.,
| (22) |
The maximum likelihood cost function for estimating the model parameters is then written as
| (23) |
where denotes the Lagrange multiplier with respect to . Then the problem of cILRMA is converted into one of estimating the source model related parameters and spatial model related parameters .
III Parameters Optimization
In this section, we derive the update rules for source model related parameters using the objective function given in (II-A). For , the the objective function can be expressed as
| (24) |
Since is a unitary orthogonal matrix, (24) can be further expressed as
| (25) |
Direction optimization of with respect to is rather difficult. To circumvent this, we introduce the Jensen’s inequality and the tangent line inequality to obtain the following auxiliary function for (III):
| (26) |
where and are two auxiliary variables and the equality holds if and only if , .
Identifying partial derivatives of with respect to and and forcing the results to zero, we obtain:
| (27) | |||
| (28) |
Similarly, the maximum likelihood function with respect to can be expressed as
| (29) |
Following the previous analysis, one can obtain the auxiliary function for (III) with respect to :
| (30) |
where and are two auxiliary variables, and the equality satisfies if and only if , and . Identifying the partial derivative of(III) with respect to and forcing the result to zero gives the following update rule:
| (31) |
The update rules of the demixing matrix in cILRMA is similar to that in AuxIVA [9], which are as following:
| (32) | |||
| (33) | |||
| (34) |
where denotes the auxiliary variable, and denotes the th column vector of the identity matrix of size .

(a) female+female

(b) female+female

(c) male+male

(d) male+male

(e) female+male

(f) female+male
IV Experiments
IV-A Experimental configuration
We followed the SISEC challenge [23] and selected speech signals from the Wall Street Journal (WSJ0) corpus [24] as the clean speech source signals. Subsequently, we constructed evaluation signals for specific speech separation task with and simulated room environments. The dimensions of the room were set to m. Two microphones are positioned at the center of the room and their spacing is cm. The two sources were positioned 2 m from the center of the two microphones. The incident angles of the two source signals were designated as and respectively, with the direction normal to the line connecting the two microphones marked as . We employed the image model method [25] to generate room impulse responses where the sound absorption coefficients were determined using Sabine’s Formula [26]. The reverberation time is controlled to be in the range from to ms with an interval of ms. For each gender combinations (there are three combinations) and every value of , 100 sets of mixed signals are generated for evaluation. The sampling rate is kHz.
The value of the hyperparameter in cILRMA was set to 1. We compared cILRMA with AuxIVA [9], MNMF [13], ILRMA [14], ILRMA [15], Generalized Gaussian distributed ILRMA (GGDILRMA) [17] and ILRMA [27]. Signal-to-distortion ration (SDR) and source-to-interferences ratio (SIR) are used as the performance metrics for evaluation and the definitions of these metrics can be found in [28].


IV-B Main results
Figure 2 plots the averaged performance in different reverberant environments. It is evident that the cILRMA method exhibits greater improvements in SDR and SIR compared to the other algorithms, although the discrepancy diminishes as the reverberation time increases.
An essential parameter in the proposed source model is parameter . To explore its impact on performance, a set of experiments were conducted. Figure 3 depicts the SDR and SIR improvements across various values of , with the source signals originating from two female speakers. The results indicate that performance enhances with increasing values of , suggesting that a higher value leads to a more accurate source model.
Figure 4 illustrates the SDR and SIR improvements achieved by cILRMA and ILRMA across varying numbers of bases. The results demonstrate that regardless of the number of bases, cILRMA consistently outperforms ILRMA by approximately dB in terms of performance.
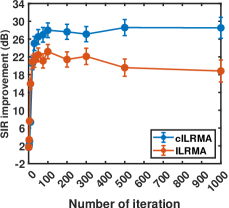
The convergence behavior for cILRMA and ILRMA are shown in Fig. 5. It is seen that it is approximately 100 iterations for cILRMA to perform better than ILRMA.
V Conclusions
The paper presented a clustered source model tailored for ILRMA-based MBASS. Leveraging the NBTD technique, this model defines blocks as outer products of vectors (clusters) and matrices for spectral structure modeling, thus providing interpretable latent vectors. By integrating orthogonality constraints, the model ensures independence among source images. Experimental results demonstrated the superiority of the proposed method over its traditional counterparts in anechoic environments.
References
- [1] Y. Huang, J. Benesty, and J. Chen, Acoustic MIMO signal processing, Springer Science & Business Media, 2006.
- [2] A. Belouchrani, K. Abed-Meraim, J.F. Cardoso, and E. Moulines, “A blind source separation technique using second-order statistics,” IEEE Trans. Signal Process., vol. 45, no. 2, pp. 434–444, Feb. 1997.
- [3] J. Benesty, Chen J., and Huang Y., Microphone Array Signal Processing, 2008.
- [4] J. Benesty, I. Cohen, and J. Chen, Fundamentals of signal enhancement and array signal processing, John Wiley & Sons, Singapore Pte. Ltd., 2018.
- [5] S. Lee, S. H. Park, and K.M. Sung, “Beamspace-domain multichannel nonnegative matrix factorization for audio source separation,” IEEE Signal Process. Lett., vol. 19, no. 1, pp. 43–46, Jan. 2011.
- [6] P. Comon, “Independent component analysis, a new concept?,” Signal Process., vol. 36, no. 3, pp. 287–314, Apr. 1994.
- [7] T. Kim, T. Eltoft, and T.-W. Lee, “Independent vector analysis: An extension of ica to multivariate components,” in Proc. Int. Conf. Independent Compon. Anal. Blind Source Separation. Springer, Oct. 2006, pp. 165–172.
- [8] Y. Sun, P. Babu, and D. P. Palomar, “Majorization-minimization algorithms in signal processing, communications, and machine learning,” IEEE Trans. Signal Process., vol. 65, no. 3, pp. 794–816, Feb. 2016.
- [9] N. Ono, “Stable and fast update rules for independent vector analysis based on auxiliary function technique,” in Proc. IEEE Workshop Appl. Signal Process. Audio Acoust. IEEE, Oct. 2011, pp. 189–192.
- [10] D. Lee and H. S. Seung, “Algorithms for non-negative matrix factorization,” in Proc. Adv. Neural Inf. Process. Syst. May. 2000, pp. 556–562, MIT Press.
- [11] A. Ozerov and C. Févotte, “Multichannel nonnegative matrix factorization in convolutive mixtures for audio source separation,” IEEE Trans. Audio, Speech, Lang. Process., vol. 18, no. 3, pp. 550–563, Mar. 2009.
- [12] N. Duong, E. Vincent, and R. Gribonval, “Under-determined reverberant audio source separation using a full-rank spatial covariance model,” IEEE Trans. Audio, Speech, Lang. Process., vol. 18, no. 7, pp. 1830–1840, Sept. 2010.
- [13] H. Sawada, H. Kameoka, S. Araki, and N. Ueda, “Multichannel extensions of non-negative matrix factorization with complex-valued data,” IEEE Trans. Audio, Speech, Lang. Process., vol. 21, no. 5, pp. 971–982, May. 2013.
- [14] D. Kitamura, N. Ono, H. Sawada, H. Kameoka, and H. Saruwatari, “Determined blind source separation unifying independent vector analysis and nonnegative matrix factorization,” IEEE Trans. Audio, Speech, Lang. Process., vol. 24, no. 9, pp. 1626–1641, Sept. 2016.
- [15] S. Mogami, D. Kitamura, Y. Mitsui, N. Takamune, H. Saruwatari, and N. Ono, “Independent low-rank matrix analysis based on complex student’s t-distribution for blind audio source separation,” in Proc. IEEE 27th Int. Workshop Mach. Learn. Signal Process. IEEE, Sept. 2017, pp. 1–6.
- [16] D. Kitamura, S. Mogami, Y. Mitsui, N. Takamune, H. Saruwatari, N. Ono, Y. Takahashi, and K. Kondo, “Generalized independent low-rank matrix analysis using heavy-tailed distributions for blind source separation,” EURASIP J. Adv. Signal Process., vol. 2018, no. 1, pp. 1–25, May. 2018.
- [17] R. Ikeshita and Y. Kawaguchi, “Independent low-rank matrix analysis based on multivariate complex exponential power distribution,” in Proc. IEEE ICASSP. IEEE, Apr. 2018, pp. 741–745.
- [18] S. Mogami, N. Takamune, D. Kitamura, H. Saruwatari, Y. Takahashi, K. Kondo, H. Nakajima, and N. Ono, “Independent low-rank matrix analysis based on time-variant sub-gaussian source model,” in Proc. Asia-Pacific Signal Inf. Process. Assoc. Annu. Summit Conf. IEEE, Nov. 2018, pp. 1684–1691.
- [19] S. Mogami, N. Takamune, D. Kitamura, H. Saruwatari, Y. Takahashi, K. Kondo, and N. Ono, “Independent low-rank matrix analysis based on time-variant sub-gaussian source model for determined blind source separation,” IEEE Trans. Audio, Speech, Lang. Process., vol. 28, pp. 503–518, Dec. 2019.
- [20] Y. Mitsui, D. Kitamura, S. Takamichi, N. Ono, and H. Saruwatari, “Blind source separation based on independent low-rank matrix analysis with sparse regularization for time-series activity,” in Proc. IEEE ICASSP. IEEE, Mar. 2017, pp. 21–25.
- [21] J. Wang, S. Guan, S. Liu, and X. Zhang, “Minimum-volume multichannel nonnegative matrix factorization for blind audio source separation,” IEEE Trans. Audio, Speech, Lang. Process., vol. 29, pp. 3089–3103, Oct. 2021.
- [22] L. De Lathauwer, “Decompositions of a higher-order tensor in block terms—part ii: Definitions and uniqueness,” SIAM Journal on Matrix Analysis and Applications, vol. 30, no. 3, pp. 1033–1066, 2008.
- [23] S. Araki, F. Nesta, E. Vincent, Z. Koldovskỳ, G. Nolte, A. Ziehe, and A. Benichoux, “The 2011 signal separation evaluation campaign (sisec2011):-audio source separation,” in LVA/ICA. Springer, 2012, pp. 414–422.
- [24] J. Garofolo, D. Graff, D. Paul, and D. Pallett, “Csr-i (wsj0) complete ldc93s6a,” Linguistic Data Consortium, vol. 83, 1993.
- [25] J. Allen and D. Berkley, “Image method for efficiently simulating small-room acoustics,” J. Acoust. Soc. Am., vol. 65, no. 4, pp. 943–950, June. 1979.
- [26] Robert W Young, “Sabine reverberation equation and sound power calculations,” J. Acoust. Soc. Am., vol. 31, no. 7, pp. 912–921, July. 1959.
- [27] Jianyu Wang, Shanzheng Guan, and Xiao-Lei Zhang, “Minimum-volume regularized ilrma for blind audio source separation,” in APSIPA ASC, 2021, pp. 630–634.
- [28] E. Vincent, R. Gribonval, and C. Févotte, “Performance measurement in blind audio source separation,” IEEE Trans. Audio, Speech, Lang. Process., vol. 14, no. 4, pp. 1462–1469, July. 2006.