Determination of the Electronic Localized-to-Extended-State Transition Point around the Metal-to-Insulator Transition Region of Fluid Mercury Using the Framework of Multifractal Analysis
Abstract
The metal-to-insulator transition and the presence of the disorder induced localization of electronic orbitals of fluid mercury (f-Hg) were investigated. The electronic structure of f-Hg was simulated by means of ab initio molecular dynamics. To see the behavior of the simulation size dependency of the electronic orbital, systems with different number of atoms were simulated. The size dependency of the multifractal measure of the electronic orbitals reversed with decreasing the density, which suggests there exists the extended-to-localized-state transition near the metal-to-insulator transition region of f-Hg.
keywords:
fluid Hg , ab initio molecular dynamics , metal-to-insulator transition , multifractal analysisPACS:
71.22+i1 Introduction
Several experimental measurements showed that fluid mercury (f-Hg) undergoes metal-to-insulator transition (MIT) during the expansion along the liquid-gas coexistence curve and over the liquid-gas critical point in the - diagram. For example, electrical conductivity measurements [1, 2, 3, 4, 5] showed that electrical conductivity of f-Hg continuously decreases as the density decreases and it crosses the value of cm-1 at around the density of 8 g cm-3. This density of 8 g cm-3 is the approximate value of the MIT, where the knight shift disappears [6, 7] and the optical gap appears [8, 9, 10].
As of a usual explanation, the mechanism of MIT of f-Hg is basically explained as the Bloch-Wilson band crossing transition [11]. In addition to the band crossing transition, the existence of an effect of atomic disorder of the f-Hg was suggested. If the interatomic potential is highly disordered, electrons are localized and the system becomes insulator even if there exists finite density of states (DOS) at the Fermi energy (), the scheme of which was proposed by Mott [12]. Mott also proposed that localized states near and extended states away from are separated by the mobility edge. Cohen and Jortner [13, 14] described metal-nonmetal transition of f-Hg using percolation theory with the relation to the heterogeneity of f-Hg under the high temperature. Winn and Logan [15] studied this mechanism of MIT of f-Hg, especially on the relation between the extended-to-localized-state transition and the Bloch-Wilson transition of electron band. Bruce and Morgan [16] paid attention to the quasielastic scattering of electrons and showed that the change of the conductivity by quantum interference for the liquid metals was comparable to that for the amorphous alloys.
Kresse et al. [17, 18] performed ab initio molecular dynamics (MD) of f-Hg with 50 atoms. They calculated the participation ratio [19, 20] to evaluate the localization of the electronic orbitals. Their results showed that the DOS at of f-Hg decreased with the decreasing of the density and it became zero at the density between 8.78 and 5.8 g cm-3, whereas the participation ratio near the showed weak trend to lower value at the density of 5.8 g cm-3. They concluded that MIT of f-Hg is explained mainly with the Bloch-Wilson transition and the extended-to-localized-state transition playing only the minor role. Carderín et al. [21, 22] also performed ab initio MD of f-Hg with 90 atoms. Their results showed similar DOS’s with those obtained by Kresse et al. [18]. Their results also showed that the DOS at of f-Hg becomes zero near the density of 7.0 g cm-3. Unfortunately, as the participation ratio continuously varies within the finite value, one can’t determine the electronic extended-to-localized-state-transition point clearly.
We focus on following two methodologies for the determination of this transition point. The first methodology is the scaling theory by Abrahams et al. [23, 24]. According to Abrahams et al. [23], in the case of three dimension, there exists an unstable critical point between localized and extended systems. Also, the conductance of the system, that is not at the critical point, increases or decreases monotonically with the change of the scale of the system. These property imply that most systems are classified as localized or extended state when the size of the system is infinite. The numerical studies on the scaling behavior of the electronic orbital under the uniform random potential distributed with a width of were performed [25, 24, 26, 27]. MacKinnon et al. calculated the localization length of quasi one dimensional systems and obtained the critical disorder for three dimensional case as about 16.5. Moreover, recent study [27] using the transfer matrix method reported the value of about 16.543.
The second methodology is the multifractal analysis of electronic orbital [28, 29, 30, 31]. Rodriguez et al. [30] showed that the scale invariant feature of electronic orbitals at the criticality can be described using the framework of the multifractal analysis. They calculated the multifractal measure defined by the following equation:
| (1) |
where , is the orbital, is the coordination of real space, is the space of a small box and is the ratio of linear size of the box to linear size of original cell. With the much larger than , e.g. =18, with fixed increased with increasing of the system size. On the other hand, with much smaller than , e.g. =15, it decreased with increasing of system size. At near the critical point, showed scale invariant feature. They also considered the finite size scaling feature and derived the value of the critical disorder as 16.56. Though the relation between the transfer matrix method and the multifractal analysis is not obvious, both method gave the very close value of . We relied on this fact and used the framework of multifractal analysis to determine the criticality of extended-to-localized-state transition of f-Hg.
In the recent years, the multifractal analyses toward electronic state began to be applied to more figurative objects, for example, analysis of sulfur-doped silicon using tight-binding model constructed with ab initio calculation [32, 31], quasicrystals [33] and dilute magnetic semiconductor using scanning tunneling microscopy [34]. These works used the multifractal analysis aiming to clarify the critical behavior, which is displayed as the multifractal spectrum [35].
2 Method
The ab initio MD simulations for f-Hg were performed using Quickstep scheme implemented in the CP2K program package [36] with Perdew-Burke-Ernzerhof functionals based on the GGA [37]. The Kohn-Sham orbitals were expanded in Gaussian basis set with double- plus polarization quality, whereas the electron density was expanded in plane waves up to a cutoff of 400 Ry. Goedecker-Teter-Hutter [38] (GTH) pseudopotential with 12 valence electrons () was used for Hg. Brillouin zone integration was restricted to the point. Target convergence threshold of Hartree was used for the self-consistent field (SCF) calculation.
The initial atomic configurations were created by a set of reverse Monte Carlo simulations with X-ray diffraction data [39]. The linear sizes of systems for every density as well as the number of atoms are listed in the table 1. The ab initio MD simulations in the ensemble were carried out using the GLE thermostat [40, 41]. Time step for the system with temperature of 293.15 K was set as 6 fs. For the other temperatures, time steps were scaled so as the mean displacement of atoms per one MD step were to be the same with that for 293.15 K. The thermalizations were done in the first 1000 steps. The samplings were done in the next 2000 steps for the system of 100 atoms and 1000 steps for the systems of 200 atoms and 400 atoms.
The multifractal measure was calculated using the Eq.1 with the fixed of value 0.50. To obtain the distribution of in a MD cell, the coordination of the small box was placed at every point of the space of the MD cell as:
| (2) |
which is the periodic convolution of and , where is a support of or a rectangular filter function, is for translated with vector . Then is obtained using Eq.1 as: . The mean of for a single orbital is defined as:
| (3) |
where is the volume of the MD cell. For the systems with 400 atoms or 200 atoms, was sampled from 11 different configurations of atoms of the intervals of 100 MD steps. For 100 atom system, was sampled from 21 different configurations of the intervals of 100 MD steps. These numbers are listed in Table 2. As the result of statistics of the different orbitals in the certain energy range and the atomic configurations, we can consider and , which are the mean value and the standard deviation of , respectively. Since the order of the averaging operations for the origin of box and for the orbitals and atomic configurations are commutative, the could be ambiguously called as the mean value of , but not for the .
3 Results
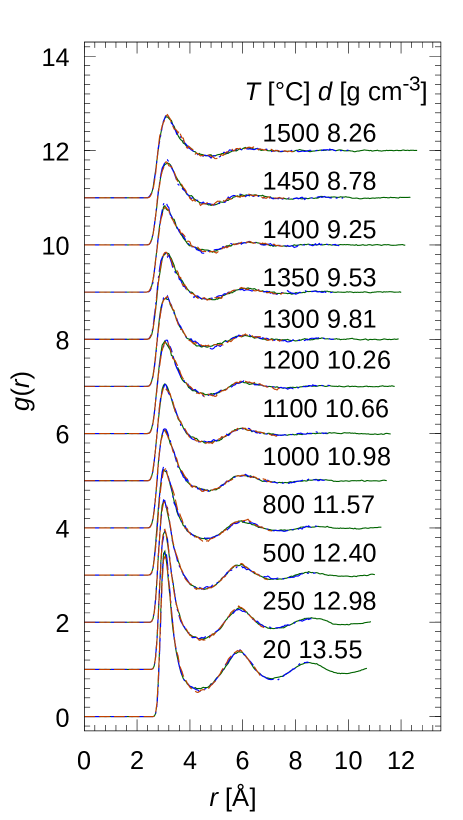
The pair distribution functions of atomic structures of f-Hg are shown in Fig.1. For the systems of 100, 200 and 400 atoms with the same temperatures and densities, ’s were in accord except for the maximum of which is defined by half of the linear size of MD cell. These ’s obtained in this MD study almost agreed with the X-ray diffraction data [39, 42]. Note that for the density of 10.66 g cm-3, the shape of the first peak agreed better with the data of 10.7 g cm-3 by Inui et al. [42] rather than the earlier data by Tamura et al. [39]. The data with the densities smaller than about 10.98 g cm-3 also showed good agreement with the data by Inui et al.
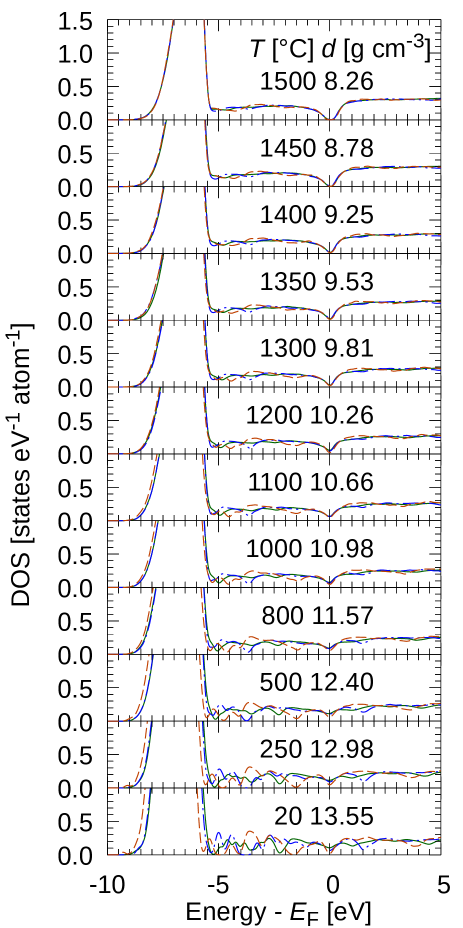
Fig.2 shows the electronic density of states (DOS) of f-Hg. The DOS plotted here was broadened with the normal distribution function with the standard deviation of 0.1 eV. The DOS at decreased with decreasing the density, became almost zero at the density of 8.78 g cm-3. For the DOS of the density of 13.55 g cm-3, a pseudogap appeared for the system of 100 atoms; however, it was filled up as the numbers of atoms increased.
4 Discussion
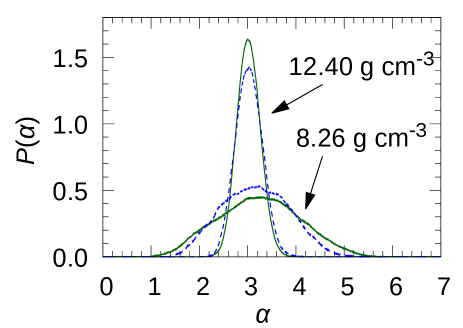
The distributions of multifractal measure : sampled for the energy levels from to eV are shown in Fig.5. The for the density of 12.40 g cm-3, which correspond to the metallic state region, became narrower as the number of atoms increased from 200 to 400. On the other hand, the of the density of 8.26 g cm-3 became wider as the number of atoms increased. This feature could be corresponded with the report of the electronic orbitals under uniform random potential by Rodriguez et al. [30]. Their result shows the becomes narrower as the system size increases when disorder parameter is 15 which is much smaller than the extended-to-localized-state transition disorder (16.543) [27]. Also, when =18, which is much larger value, becomes wider as the system size increases. These two features show the possibility of f-Hg undergoing the extended-to-localized-state transition near MIT. Also, it suggests that for f-Hg, the potential disorder increase monotonically as the density decrease.
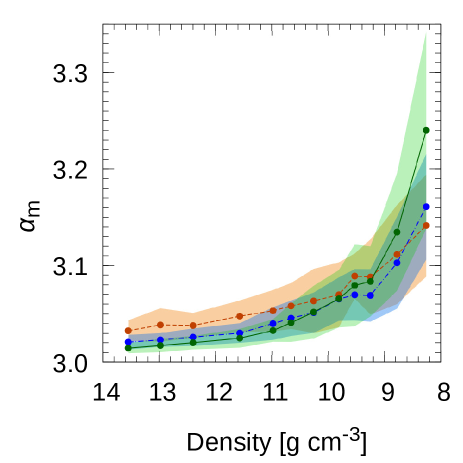
Actually, Rodriguez et al. [30] analyzed the mean value of rather than standard deviation of it. Therefore, we analyzed the mean value of , . The are shown in Fig.6 as a function of density. The energy levels picked here were for to eV from . The number of orbitals used to obtain at around eV as a function of density is listed in the Table 3. The standard deviation of , is also displayed in Fig.6. In the Fig.6, at the density of 12.40 g cm-3, decreased as the system size increased whereas at the density of 8.26 g cm-3, it decreased as the system size increased. As we can see in Fig.6, the size dependency of reversed in the region of density between 11 and 8 g cm-3. Further analysis would allow us figure out the finite size effect. Rodriguez et al. had investigated the behavior of with random potential of randomness [30] and it can be seen from Fig. 3 of Ref.[30] as follows: A curve is defined as the locus on the - plain with the system size . is value of the crossing point of curves and . It can be seen that the of finite different system sizes , is larger than . It also can be seen that approaches to as the system sizes becomes large. Here, we associate atoms to sites in the study of Rodriguez et al. Our results for f-Hg shows the crossing point of the curves of versus density of 100 atoms and 200 atoms was at about the density of 8.6 g cm-3, whereas number of atoms of 200 and 400, 10.0 g cm-3. We think more precise analysis required to determine the relation between this shift and the finite size effect.
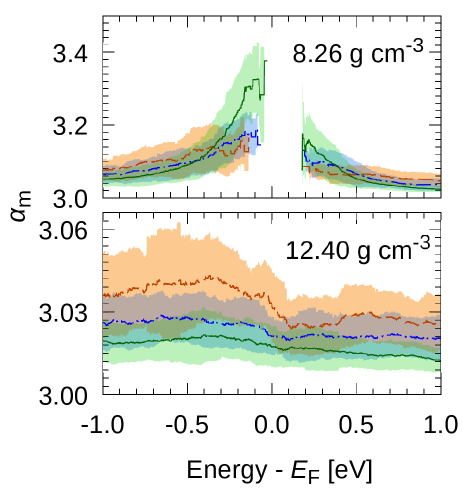
The as a function of energy levels are shown in Fig.7; in the case of Figs.5 and 6, only the energy level of eV was shown. The at the density of 8.26 g cm-3 showed discontinuous curve at the due to the lack of the electronic states. For the density of 12.40 g cm-3, at all the energy range of from to eV, the decreased as the size became large. This means that electron orbitals in this energy range were extended. At the density of 8.26 g cm-3, the size dependency of was different for the energy levels. At about eV, increased as size became larger, which means that the orbitals were localized. At about eV, decreased as the size became larger, which means that the orbitals were extended. The energy region higher than also showed that the orbitals which were close to the were localized and orbitals which were far from the were extended. These phenomena shows an existence of mobility edges of liquid which was proposed by Mott [12]. Further analysis would allow us determine the locus of mobility edge on the energy-density plain. Comparing with the locus of the band edges, we can clarify the relation between the band crossing transition and extended-to-localized-state transition in the MIT of f-Hg.
The reversed size dependency of could be observed for 100 to 400 atom systems for f-Hg, however, Carnio et al. [31] reported the similar phenomena for sulfur doped silicon for huge 4096 and 10648 atom system. The reason of the such difference of the system size is estimated the amplitude of the randomness of liquid material, which is much larger than that of solid materials. Therefore, similar size dependency with small number of atoms could be observed in the amorphous systems.
5 Conclusions
We studied fluid mercury (f-Hg) at thermodynamic states including the metal-to-insulator transition (MIT) region by means of ab initio molecular dynamics. We simulated systems of three different number of atoms: 100, 200 and 400. The multifractal measure showed opposite size dependency in the densities of 12.40 and 8.26 g cm-3. This phenomenon suggests there exists extended-to-localized-state transition near the MIT of the f-Hg.
Acknowledgement
One of the author (K. K.) would like to thank Yoshiaki Ōno (Niigata University) for his advice on the Anderson localization and Masaki Saito (Niigata University) for the technical support. Numerical calculations were performed in part using Oakforest-PACS system provided by Multidisciplinary Cooperative Research Program (68) in CCS, University of Tsukuba, and MASAMUNE-IMR system provided in CCMS, IMR, Tohoku University. This work was supported by JSPS KAKENHI Grant Numbers 15K05206 and 23540441.
References
- Kikoin et al. [1966] I. K. Kikoin, A. P. Senchenkov, E. V. Gel’man, M. M. Korsunskiĭ, S. P. Naurzakov, Electrical conductivity and density of a metal vapor, Soviet Journal of Experimental and Theoretical Physics 22 (1966) 89.
- Hensel and Franck [1968] F. Hensel, E. U. Franck, Metal-nonmetal transition in dense mercury vapor, Rev. Mod. Phys. 40 (1968) 697.
- Schönherr et al. [1979] G. Schönherr, R. W. Schmutzler, F. Hensel, Electrical and thermodynamic properties of mercury in the metal–semiconductor transition range, Philos. Mag. B 40 (1979) 411.
- Yao and Endo [1982] M. Yao, H. Endo, Thermodynamic properties of expanded liquid mercury in the metal–nonmetal transition range, J. Phys. Soc. Jpn. 51 (1982) 966.
- Hensel [1990] F. Hensel, Critical behaviour of metallic liquids, J. Phys.: Condens. Matter 2 (1990) SA33.
- El-Hanany and Warren, Jr. [1975] U. El-Hanany, W. W. Warren, Jr., Knight shift in expanded liquid mercury, Phys. Rev. Lett. 34 (1975) 1276.
- Warren, Jr. and Hensel [1982] W. W. Warren, Jr., F. Hensel, Knight shift and dielectric anomaly in fluid mercury, Phys. Rev. B 26 (1982) 5980.
- Yao et al. [1990] M. Yao, W. Hayami, H. Endo, Optical absorption coefficient of dense mercury vapor, J. Non-Cryst. Solids 117-118 (1990) 473.
- Yao et al. [1993] M. Yao, K. Takehana, H. Endo, Cluster formation in expanded fluid mercury and dilute amalgams near the liquid–gas critical point, J. Non-Cryst. Solids 156-158 (1993) 807.
- Hensel and Yao [1996] F. Hensel, M. Yao, Critical behaviour in liquid mercury, J. Non-Cryst. Solids 205-207 (1996) 231.
- Yonezawa and Martino [1976] F. Yonezawa, F. Martino, Multiband formulation for the electronic structure of nonsimple disordered metals and its application to expanded mercury, Solid State Communications 18 (1976) 1471.
- Mott [1966] N. F. Mott, The electrical properties of liquid mercury, Philos. Mag. 13 (1966) 989.
- Cohen and Jortner [1973] M. H. Cohen, J. Jortner, Inhomogeneous transport regime in disordered materials, Phys. Rev. Lett. 30 (1973) 699.
- Cohen and Jortner [1974] M. H. Cohen, J. Jortner, Conduction regimes in expanded liquid mercury, Phys. Rev. A 10 (1974) 978.
- Winn and Logan [1990] M. D. Winn, D. E. Logan, Localization versus band crossing transitions in a multiband model of spatially disordered materials, J. Chem. Phys. 93 (1990) 6756.
- Bruce and Morgan [1995] N. A. Bruce, G. J. Morgan, Quantum interference in liquid metals, Phys. Rev. B 51 (1995) 12313.
- Kresse [1996] G. Kresse, Ab initio molecular dynamics applied to the dynamics of liquid metals and to the metal—-non–metal transition, J. Non-Cryst. Solids 205-207 (1996) 833.
- Kresse and Hafner [1997] G. Kresse, J. Hafner, Ab initio simulation of the metal/nonmetal transition in expanded fluid mercury, Phys. Rev. B 55 (1997) 7539.
- Bell and Dean [1970] R. J. Bell, P. Dean, Atomic vibrations in vitreous silica, Discuss. Faraday Soc. (1970) 55.
- Edwards and Thouless [1972] J. T. Edwards, D. J. Thouless, Numerical studies of localization in disordered systems, J. Phys. C: Solid State Phys. 5 (1972) 807.
- Calderín et al. [2011a] L. Calderín, L. E. González, D. J. González, Expanded fluid mercury in the metal–nonmetal transition range. an ab–initio md study, Eur. Phys. J. Special Topics 196 (2011a) 27.
- Calderín et al. [2011b] L. Calderín, L. E. González, D. J. González, Static, dynamic and electronic properties of expanded fluid mercury in the metal-nonmetal transition range. an ab initio study, J. Phys.: Condens. Matter 23 (2011b) 375105.
- Abrahams et al. [1979] E. Abrahams, P. W. Anderson, D. C. Licciardello, T. V. Ramakrishnan, Scaling theory of localization: absence of quantum diffusion in two dimensions, Phys. Rev. Lett. 42 (1979) 673.
- MacKinnon and Kramer [1981] A. MacKinnon, B. Kramer, One–parameter scaling of localization length and conductance in disordered systems, Phys. Rev. Lett. 47 (1981) 1546.
- Pichard and Sarma [1981] J. L. Pichard, G. Sarma, Finite size scaling approach to anderson localization, J. Phys. C: Solid State Phys. 14 (1981) L127.
- MacKinnon and Kramer [1983] A. MacKinnon, B. Kramer, The scaling theory of electrons in disordered solids: Additional numerical results, Z. Phys. B 53 (1983) 1.
- Slevin and Ohtsuki [2018] K. Slevin, T. Ohtsuki, Critical exponent of the anderson transition using massively parallel supercomputing, J. Phys. Soc. Jpn. 87 (2018) 094703.
- Vasquez et al. [2008] L. J. Vasquez, A. Rodriguez, R. A. Römer, Multifractal analysis of the metal-insulator transition in the three-dimensional anderson model. i. symmetry relation under typical averaging, Phys. Rev. B 78 (2008) 195106.
- Rodriguez et al. [2008] A. Rodriguez, L. J. Vasquez., R. A. Römer, Multifractal analysis of the metal-insulator transition in the three-dimensional anderson model. ii. symmetry relation under ensemble averaging, Phys. Rev. B 78 (2008) 195107.
- Rodriguez et al. [2010] A. Rodriguez, L. J. Vasquez, K. Slevin, R. A. Römer, Critical parameters from a generalized multifractal analysis at the anderson transition, Phys. Rev. Lett. 105 (2010) 046403.
- Carnio et al. [2019a] E. G. Carnio, N. D. Hine, R. A. Römer, Multifractality of ab initio wave functions in doped semiconductors, Physica E: Low-dimensional Systems and Nanostructures 111 (2019a) 141.
- Carnio et al. [2019b] E. G. Carnio, N. D. M. Hine, R. A. Römer, Resolution of the exponent puzzle for the anderson transition in doped semiconductors, Phys. Rev. B 99 (2019b) 081201.
- Macé et al. [2017] N. Macé, A. Jagannathan, P. Kalugin, R. Mosseri, F. Piéchon, Critical eigenstates and their properties in one- and two-dimensional quasicrystals, Phys. Rev. B 96 (2017) 045138.
- Richardella et al. [2010] A. Richardella, P. Roushan, S. Mack, B. Zhou, D. A. Huse, D. D. Awschalom, A. Yazdani, Visualizing critical correlations near the metal-insulator transition in ga1-xmnxas, Science 327 (2010) 665–669.
- Riedi [2002] R. H. Riedi, Multifractal processes, in: P. Doukhan, G. Oppenheim, M. S. Taqqu (Eds.), Theory and applications of long-range dependence, Birkhäuser, 2002, pp. 625–715.
- VandeVondele et al. [2005] J. VandeVondele, M. Krack, F. Mohamed, M. Parrinello, T. Chassaing, J. Hutter, Quickstep: Fast and accurate density functional calculations using a mixed gaussian and plane waves approach, Computer Physics Communications 167 (2005) 103.
- Perdew et al. [1996] J. P. Perdew, K. Burke, M. Ernzerhof, Generalized gradient approximation made simple, Phys. Rev. Lett. 77 (1996) 3865.
- Goedecker et al. [1996] S. Goedecker, M. Teter, J. Hutter, Separable dual-space gaussian pseudopotentials, Phys. Rev. B 54 (1996) 1703.
- Tamura and Hosokawa [1998] K. Tamura, S. Hosokawa, Structural studies of expanded fluid mercury up to the liquid-vapor critical region, Phys. Rev. B 58 (1998) 9030.
- Ceriotti et al. [2009a] M. Ceriotti, G. Bussi, M. Parrinello, Nuclear quantum effects in solids using a colored-noise thermostat, Phys. Rev. Lett. 103 (2009a) 030603.
- Ceriotti et al. [2009b] M. Ceriotti, G. Bussi, M. Parrinello, Langevin equation with colored noise for constant-temperature molecular dynamics simulations, Phys. Rev. Lett. 102 (2009b) 020601.
- Inui et al. [2003] M. Inui, X. Hong, K. Tamura, Local structure of expanded fluid mercury using synchrotron radiation: From liquid to dense vapor, Phys. Rev. B 68 (2003) 094108.
| Density [g cm-3] | 100 atom | 200 atom | 400 atom |
|---|---|---|---|
| 8.26 | 15.916988 | 20.054148 | 25.266643 |
| 8.78 | 15.596341 | 19.650159 | 24.757648 |
| 9.25 | 15.327582 | 19.311544 | 24.331020 |
| 9.53 | 15.175975 | 19.120530 | 24.090359 |
| 9.81 | 15.030193 | 18.936857 | 23.858945 |
| 10.26 | 14.807160 | 18.655853 | 23.504902 |
| 10.66 | 14.619589 | 18.419528 | 23.207151 |
| 10.98 | 14.476163 | 18.238822 | 22.979476 |
| 11.57 | 14.225792 | 17.923374 | 22.582037 |
| 12.40 | 13.901031 | 17.514201 | 22.066511 |
| 12.98 | 13.690816 | 17.249347 | 21.732816 |
| 13.55 | 13.496085 | 17.004001 | 21.423699 |
| Sampling time | Configurations | |
|---|---|---|
| 100 atom | 1000 to 3000 step | 21 |
| 200 atom | 1000 to 2000 step | 11 |
| 400 atom | 1000 to 2000 step | 11 |
| Density [g cm-3] | 100 atom | 200 atom | 400 atom |
|---|---|---|---|
| 8.26 | 6 | 14 | 28 |
| 8.78 | 17 | 26 | 41 |
| 9.25 | 25 | 26 | 66 |
| 9.53 | 35 | 38 | 64 |
| 9.81 | 35 | 39 | 79 |
| 10.26 | 37 | 42 | 78 |
| 10.66 | 44 | 49 | 86 |
| 10.98 | 44 | 48 | 88 |
| 11.57 | 41 | 46 | 98 |
| 12.40 | 45 | 56 | 107 |
| 12.98 | 53 | 57 | 106 |
| 13.55 | 47 | 47 | 111 |