Deep Feature Fusion via Graph Convolutional Network for Intracranial Artery Labeling
Abstract
Intracranial arteries are critical blood vessels that supply the brain with oxygenated blood. Intracranial artery labels provide valuable guidance and navigation to numerous clinical applications and disease diagnoses. Various machine learning algorithms have been carried out for automation in the anatomical labeling of cerebral arteries. However, the task remains challenging because of the high complexity and variations of intracranial arteries. This study investigates a novel graph convolutional neural network with deep feature fusion for cerebral artery labeling. We introduce stacked graph convolutions in an encoder-core-decoder architecture, extracting high-level representations from graph nodes and their neighbors. Furthermore, we efficiently aggregate intermediate features from different hierarchies to enhance the proposed model’s representation capability and labeling performance. We perform extensive experiments on public datasets, in which the results prove the superiority of our approach over baselines by a clear margin.
Clinical relevance— The graph convolutions and feature fusion in our approach effectively extract graph information, which provides more accurate intracranial artery label predictions than existing methods and better facilitates medical research and disease diagnosis.
I INTRODUCTION
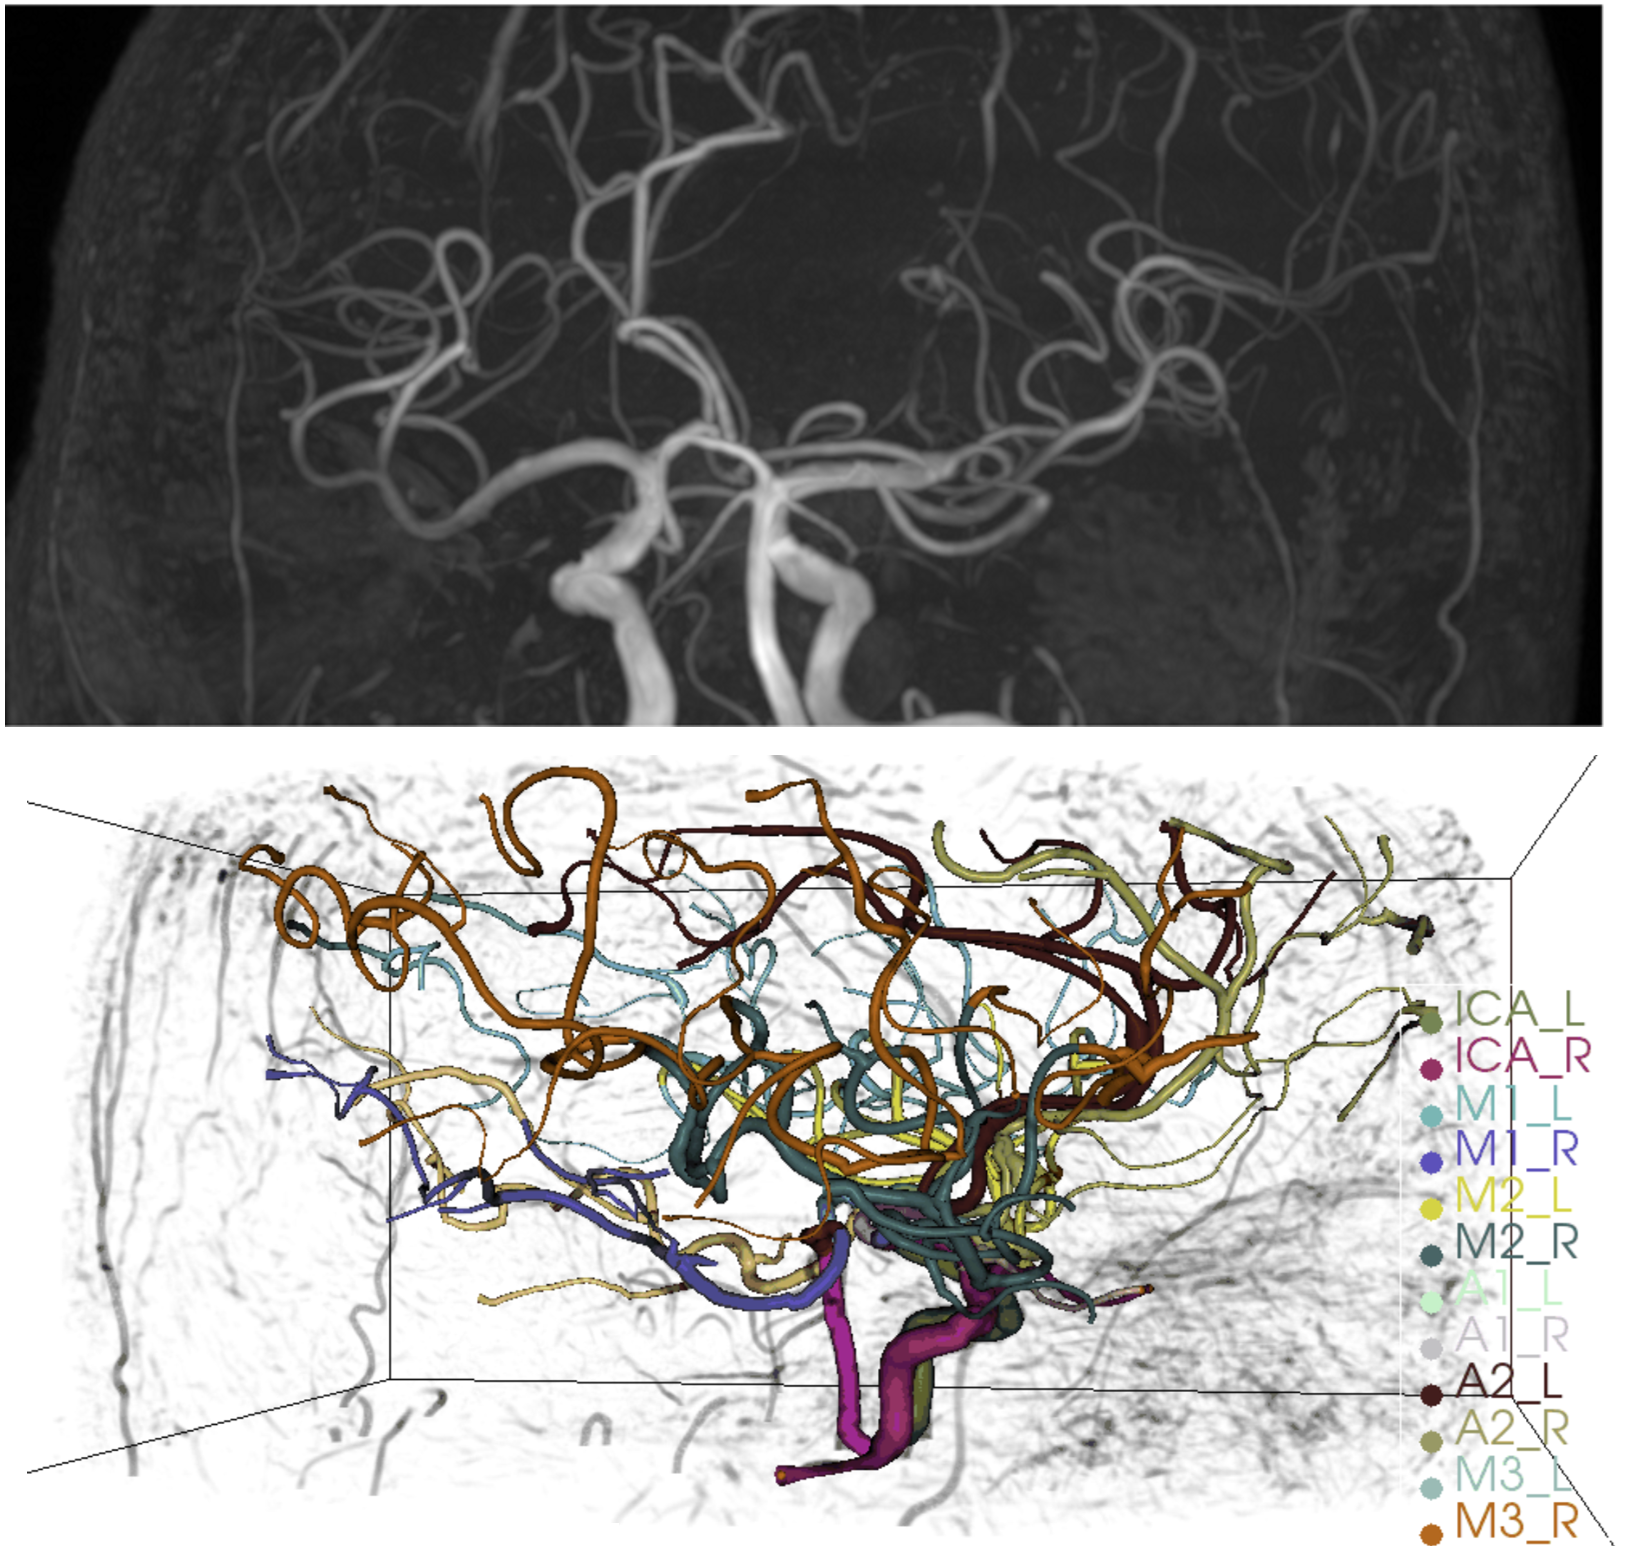
Intracranial arteries (ICA) play a crucial role in supplying human brains with sufficient blood. Disease in intracranial arteries, e.g., cerebral aneurysm and cerebral infarction, severely harms the patients’ health and significantly lowers the survival rate. Accurate labeling of ICA provides deep insights into brain vascular structures, guiding subsequent clinical diagnosis and research on brain magnetic resonance imaging (MRI) and magnetic resonance angiography (MRA) images. Manual labeling of ICA demands a considerable amount of time and expertise. Therefore automation of ICA labeling becomes imminent.
Continuous efforts have been made in the automation of ICA labeling. Handcrafted and statistical features are widely used in early research, including the vessel count (VC), average radius (AVRAD), sum of angles metric (SOAM), volumetric flow rate (VFR), etc. [1, 2, 3]. Morphological constraints of predefined lengths and volumes of the arteries are also taken as classification criteria in [4]. However, the problem of ICA labeling remains challenging because of the high complexity in cerebral arteries and high variability in the vascular structure. For instance, it is claimed that the presence of partial integral circle of Willis (CoW) is higher than in healthy subjects, while non-variation CoW integrity is only found in of the investigated subjects [5]. Moreover, imaging quality also limits the labeling accuracy, in which crossing and overlapping arteries are indistinct.
Recently, graph representation and graph feature learning approaches have been studied on large datasets with heterogeneous sources [6, 7, 8, 9]. A directed graph representation of intracranial arteries is proven effective in [10], in which the ICA network is abstracted as a graph of connected 3D points and centerlines of arteries. The emerging graph neural network (GNN) is employed to learn informative properties of arteries for ICA labeling [11]. Despite the progress from handcrafted features, these methods either suffer from high model complexity [10] or limited feature extraction capability [11].
In this study, we propose a graph convolutional network with deep feature fusion to enhance the automated feature learning from graph embeddings of vascular information for ICA labeling. The graph convolution operations effectively exploit structural information of the current node and its direct and indirect neighbors in a graph. The stacked graph convolutional layers leverage properties from local to global scales in the graph to determine the label of the current node. We further enhance the feature representation by aggregating hidden features from intermediate levels of the network with concatenation and pooling operations. Contributions in this paper are summarized as follows:
-
•
We develop a novel graph convolutional network with deep feature fusion for ICA labeling. The model captures artery structures and relations at different scales, based on which the artery labels are determined.
-
•
We perform extensive experiments of our approach on the newly released ICA dataset [11]. Extensive experimental results show noticeable improvement in our method compared to baselines.
II RELATED WORK
Early studies on ICA labeling rely on handcrafted features and templates generalized from small datasets. Abnormalities in vessel tortuosity associated with brain tumors are characterized in [1]. A CoW template is generalized from subjects, and scans are aligned for ICA labeling [13]. A probabilistic atlas over cerebral arteries is built from individuals, from which an automatic atlas-based artery identification algorithm (AAIM) is derived [4]. These studies are bounded by the limited sizes of datasets, while there are much more variations in vascular structures unrepresented.
Graph representations of arteries are adopted in recent research, based on which Bilgel et al. develop a random forest classifier for artery labeling and a Bayesian network incorporating messages from connected vessels [14]. Graph templates are used together with maximizing a posteriori probability (MAP) estimate for CoW labeling [15]. Simultaneous segmentation and labeling of cerebral vasculature are carried out, in which anatomical labels are determined by a branch-and-cut algorithm on overfull graphs [10].
A graph neural network (GNN) is designed to exploit global artery structures and relations in [11]. Chen et al. also release an ICA dataset with heterogeneous sources and the construction from MRA to graph embeddings. While the research in [11] constitutes the baselines of our work, we argue that substantial improvement can be made to the GNN architecture in [11], in which the multi-layer-perception (MLP) based model is insufficient to utilize information from the graph fully. Convolutional neural network (CNN) have obtained great success on various biomedical applications [16, 17, 18, 19]. And Graph convolutional neural network (GCN) generalizes classic CNN on graph structure [20]. An efficient GCN has been implemented to obtain graph node features [21], which inspires our approach.
III METHODOLOGY
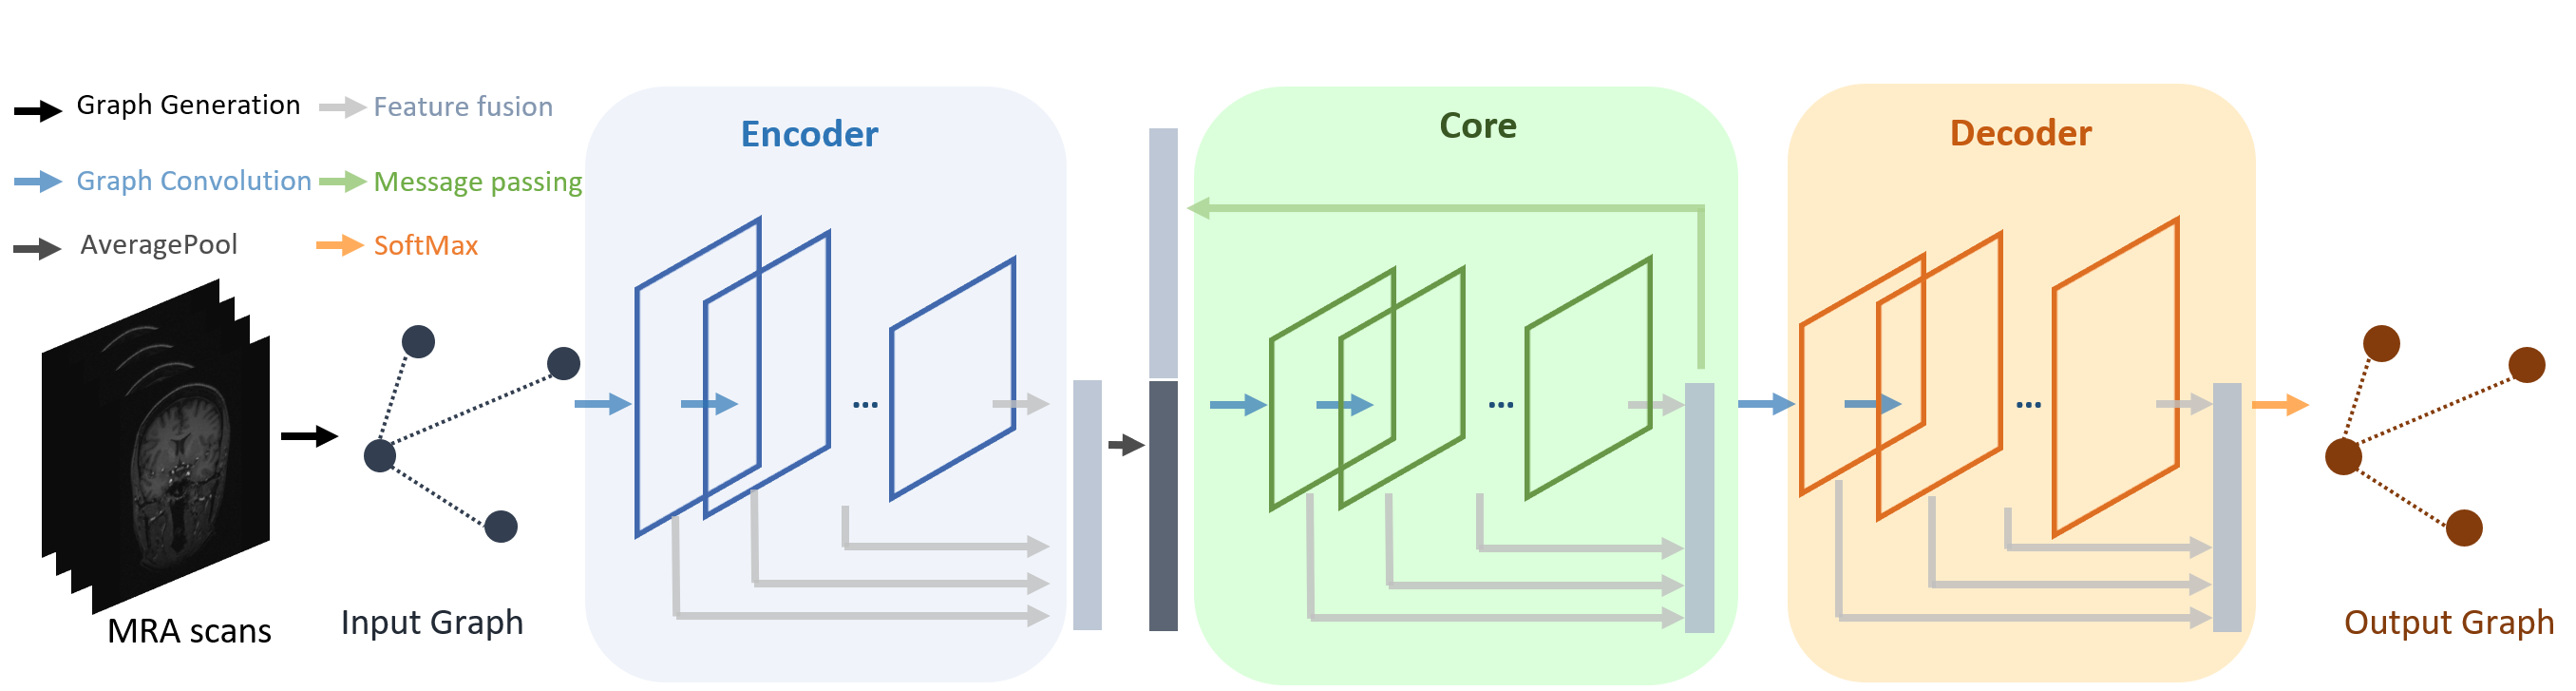
The proposed network is illustrated in Fig. 2, in which ICA graphs containing node and edge features are taken as input, respectively. The network consists of components sequentially, i.e., encoder, core, and decoder. Graph convolutional layers are stacked in each component to enable feature extraction from graph nodes and their neighbors, which is described in Sec. III-A. Deep feature fusion is carried out on output features from each component to enhance the latent representation further, which is elaborated in Sec. III-B. Predictions of node and edge types are computed in the last fully connected layer based on restored node and edge features in the decoder and embedded in the output graphs for nodes and edges.
III-A Graph Convolutional Network
The graph convolution is the essential operation that extracts node features based on their structural information. The components of our network consist of stacked graph convolutional layers with Sigmoid activation (), as illustrated in Fig. 2. Let denote the normalized adjacency matrix, denote the input signals of the th graph convolutional layer, denote the output, and stand for the parameter matrix of the th graph convolution operation. A graph convolutional layer in our work is defined as follows,
| (1) |
where depending on the depth of the network. In each graph convolutional layer, attributes in the edge graph are updated first, followed by attributes in the node graph.
III-B Deep Feature Fusion
We adopt strategies to aggregate latent features for model optimization. First, we concatenate intermediate features from graph convolutional layers in the encoder as the input for the following component before the average pooling operation. The updated feature covers high-resolution, low-context information from the early feature extraction stages and low-resolution, high-context information from the later stages. The feature fusion operation is represented in Eqn. 2,
| (2) |
where the maximum depends on the number of graph convolutional layers in the encoder. Features are directly concatenated in the core and decoder, in which is calculated as follows,
| (3) |
Furthermore, we iteratively update feature representations in the core component by concatenating its output to output from the encoder as its input for the next training iteration of the core. We follow the notation in [11] and refer to this process as message passing. In the first round of message passing, the core takes duplicated output from the encoder. In the subsequent iterations, it takes its output in the previous iteration concatenated to output from the encoder as input. In our experiments, message passing is repeated for times.
IV EXPERIMENTS
IV-A Dataset and Implementation
We carry out experiments on the ICA dataset released in [11]. Both healthy subjects and subjects with vascular diseases are included in the dataset. The dataset is randomly split into training, validation, and test sets. Following [11], MRA images with ICA labels are pre-processed to generate relational graphs with attributes. In a Graph , stands for all starting and ending points of artery centerlines with node features. denotes all edges where the edge is connected to nodes and . Features for node include the 3D coordinates, radius, and approximated directional embedding. Features for edge include the edge direction, distance, and mean radius. There are bifurcation or ending types of nodes, and the edges are labeled by their starting and ending nodes.
In our implementation, node positions are normalized in images with different resolutions. Random translation of node position up to is applied as data augmentation. The network is randomly initialized. The Adam optimizer is used to train the network with initial learning rate of and a batch size of for epochs. The model is evaluated during training on the validation set, and the epoch with the best validation result is used for testing.
| Method | Node_Acc | Node_Wrong | CoW_Node_Solve | Edge_Acc | Precision | Recall |
|---|---|---|---|---|---|---|
| Template [2] | - | - | ||||
| Atlas [4] | - | - | ||||
| MAP [22] | - | - | ||||
| GNN [11] | ||||||
| GCN | 0.9739 | 2.3 | 0.6667 | 0.9258 | 0.9323 | 0.8667 |
| GCN_Fusion | 0.9777 | 1.9 | 0.6190 | 0.9336 | 0.9464 | 0.8836 |
IV-B Evaluation Metrics
Following previous works [4, 11], we evaluate our method on the following metrics:
-
•
Node_Acc: The accuracy of node label prediction.
-
•
Node_Wrong: The average number of wrong node predictions in MRA scan.
-
•
CoW_Node_Solve: The percentage of scans in which all CoW nodes are correctly predicted.
-
•
Edge_Acc: The accuracy of edge label prediction.
-
•
Precision: The overall precision for both node and edge prediction.
-
•
Recall: The overall recall for both node and edge prediction.
IV-C Baseline Methods
The following baselines are studied. In [12], a probability model is developed to label ICA based on hand-crafted features. More statistical patterns are exploited to label vessels in [2]. An atlas-based artery identification method is studied in [4]. GNN with hierarchical refinement is probed in [11], which constitutes the backbones of our approach. Our methods with different configurations are described in the following,
-
•
GCN: Graph convolutional network.
-
•
GCN_Fusion: Graph convolutional network with deep feature fusion.
IV-D Results and Discussion
We compare experimental results of baselines and our approach, as presented in Table. I. It is evident that our method outperforms baselines in all evaluation metrics. We can observe that GNN [11] has made remarkable improvements from other baselines on ICA data with a graph structure, which is further enhanced in our paper by substituting the multi-layer-perceptron architecture in [11] with graph convolutions and deep feature fusion. It is worth mentioning that there is a heavily engineered hierarchical refinement postprocessing step after GNN in [11], which is also incorporated in our method.
Model performance comparison on posterior cerebral arteries is shown in Table. II, in which our model consistently outperforms the baseline except in the Pcomm/ICA nodes. There is a higher mutation rate in posterior cerebral arteries than the rest of the arteries, which increases its structural variability and makes it more challenging to label. Therefore the results confirm the robustness of our method on challenging cases. We also perform ablation studies on the model architecture. As revealed in Table. III, deeper GCN networks generally perform better than shallower ones. Besides, the average pooling operation proves to be an essential step in deep feature fusion, which provides a noticeable increment in all evaluation metrics.
| GNN [11] | GNN_Fusion | |||
|---|---|---|---|---|
| Node | Precision | Recall | Precision | Recall |
| OA_L | 0.9828 | 0.9344 | 0.9831 | 0.9508 |
| OA_R | 0.9643 | 0.9000 | 0.9818 | 0.9000 |
| PCA/BA | 0.8447 | 0.8878 | 0.8654 | 0.9184 |
| P1/P2/Pcomm_L | 0.7455 | 0.7593 | 0.8276 | 0.8889 |
| P1/P2/Pcomm_R | 0.7407 | 0.7843 | 0.8800 | 0.8627 |
| Pcomm/ICA_L | 0.9070 | 0.7800 | 0.8958 | 0.8600 |
| Pcomm/ICA_R | 0.9091 | 0.8163 | 0.9048 | 0.7755 |
| Experiments | Node_Acc | Precision | Recall |
|---|---|---|---|
| 1 GCN layer | 0.9700 | 0.9349 | 0.8499 |
| 2 GCN layers | 0.9731 | 0.9374 | 0.8659 |
| 3 GCN layers | 0.9615 | 0.9101 | 0.8242 |
| 4 GCN layers | 0.9715 | 0.9373 | 0.8601 |
| GCN_Fusion, no pooling | 0.9739 | 0.9323 | 0.8667 |
| GCN_Fusion | 0.9777 | 0.9464 | 0.8836 |
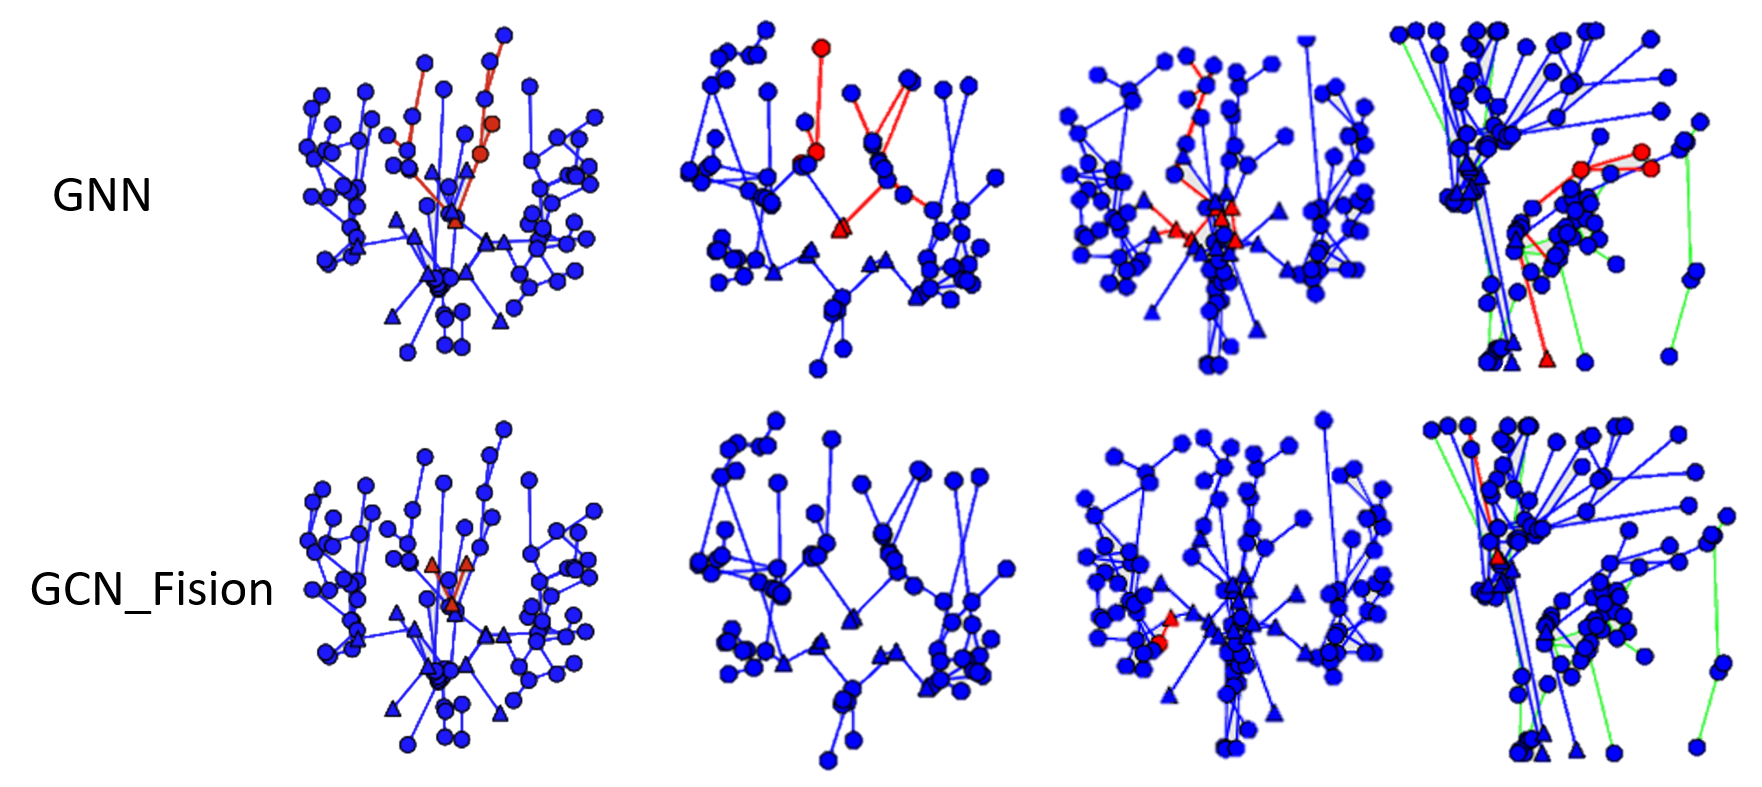
Inference results on the test set are illustrated in Fig. 3. In the first column, we can observe fewer prediction errors from GCN_Fusion than the baseline. However, similar mistakes are made in the last column, where both models predict non-existent edges at the same positions. Future studies could investigate these cases.
V CONCLUSIONS
In a nutshell, we design a network with deep feature fusion for intracranial artery labeling, which consists of stacked graph convolutions in the encoder-core-decoder architecture. Latent features are pooled in the encoder and concatenated in each network component to enhance node and edge representation for better labeling performance. Experimental results have validated our approach. In the future, we can conduct additional experiments on multiple independent datasets, and focus on incorrectly labeled arteries.
References
- [1] Elizabeth Bullitt, Donglin Zeng, Guido Gerig, Stephen Aylward, Sarang Joshi, J Keith Smith, Weili Lin, and Matthew G Ewend, “Vessel tortuosity and brain tumor malignancy: a blinded study,” Academic radiology, 2005.
- [2] Oren Geri, Shelly I. Shiran, Jonathan Roth, Moran Artzi, Liat Ben-Sira, and Dafna Ben Bashat, “Vascular territorial segmentation and volumetric blood flow measurement using dynamic contrast enhanced magnetic resonance angiography of the brain,” Journal of Cerebral Blood Flow and Metabolism, 2017.
- [3] Jelmer M. Wolterink, Robbert W.van Hamersvelt, Max A. Viergever, Tim Leiner, and Ivana Išgum, “Coronary artery centerline extraction in cardiac ct angiography using a cnn-based orientation classifier,” Medical Image Analysis, 2019.
- [4] Tora Dunås, Anders Wåhlin, Khalid Ambarki, Laleh Zarrinkoob, Richard Birgander, Jan Malm, and Anders Eklund, “Automatic labeling of cerebral arteries in magnetic resonance angiography,” Magnetic Resonance Materials in Physics, Biology and Medicine, 2016.
- [5] Chuanya Qiu, Yong Zhang, Caixia Xue, Shanshan Jiang, and Wei Zhang, “Mra study on variation of the circle of willis in healthy chinese male adults,” BioMed research international, 2015.
- [6] Cen Chen, Kenli Li, Sin G Teo, Xiaofeng Zou, Kang Wang, Jie Wang, and Zeng Zeng, “Gated residual recurrent graph neural networks for traffic prediction,” in AAAI, 2019.
- [7] Xiaodong Qu, Qingtian Mei, Peiyan Liu, and Timothy Hickey, “Using eeg to distinguish between writing and typing for the same cognitive task,” in Int Conf on Brain Function Assessment in Learning, 2020.
- [8] Zeng Zeng, Wei Zhao, Peisheng Qian, Yingjie Zhou, Ziyuan Zhao, Cen Chen, and Cuntai Guan, “Robust traffic prediction from spatial-temporal data based on conditional distribution learning,” IEEE Transactions on Cybernetics, 2021.
- [9] Xiaodong Qu, Peiyan Liu, Zhaonan Li, and Timothy Hickey, “Multi-class time continuity voting for eeg classification,” in Int Conf on Brain Function Assessment in Learning, 2020.
- [10] David Robben, Engin Türetken, Stefan Sunaert, Vincent Thijs, Guy Wilms, Pascal Fua, Frederik Maes, and Paul Suetens, “Simultaneous segmentation and anatomical labeling of the cerebral vasculature,” Medical image analysis, 2016.
- [11] Li Chen, Thomas Hatsukami, Jenq-Neng Hwang, and Chun Yuan, “Automated intracranial artery labeling using a graph neural network and hierarchical refinement,” in MICCAI. Springer, 2020.
- [12] Li Chen, Mahmud Mossa-Basha, Niranjan Balu, Gador Canton, Jie Sun, Kristi Pimentel, Thomas S. Hatsukami, Jenq Neng Hwang, and Chun Yuan, “Development of a quantitative intracranial vascular features extraction tool on 3d mra using semiautomated open-curve active contour vessel tracing,” Magnetic Resonance in Medicine, 2018.
- [13] Akihiro Takemura, Masayuki Suzuki, Hajime Harauchi, and Yusuke Okumura, “Automatic anatomical labeling method of cerebral arteries in mr-angiography data set,” Jpn J of Med Phys, 2006.
- [14] Murat Bilgel, Snehashis Roy, Aaron Carass, Paul A Nyquist, and Jerry L Prince, “Automated anatomical labeling of the cerebral arteries using belief propagation,” in Medical Imaging 2013: Image Processing. International Society for Optics and Photonics, 2013.
- [15] Hrvoje Bogunović, José María Pozo, Rubén Cárdenes, Luis San Román, and Alejandro F Frangi, “Anatomical labeling of the circle of willis using maximum a posteriori probability estimation,” IEEE transactions on medical imaging, 2013.
- [16] Geert Litjens, Thijs Kooi, Babak Ehteshami Bejnordi, Arnaud Arindra Adiyoso Setio, Francesco Ciompi, Mohsen Ghafoorian, Jeroen Awm Van Der Laak, Bram Van Ginneken, and Clara I Sánchez, “A survey on deep learning in medical image analysis,” Med Image Anal, 2017.
- [17] Jiapan Gu, Ziyuan Zhao, Zeng Zeng, Yuzhe Wang, Zhengyiren Qiu, Bharadwaj Veeravalli, Brian Kim Poh Goh, Glenn Kunnath Bonney, Krishnakumar Madhavan, Chan Wan Ying, et al., “Multi-phase cross-modal learning for noninvasive gene mutation prediction in hepatocellular carcinoma,” in EMBC. IEEE, 2020.
- [18] Ziyuan Zhao, Kaixin Xu, Shumeng Li, Zeng Zeng, and Cuntai Guan, “Mt-uda: Towards unsupervised cross-modality medical image segmentation with limited source labels,” in Med Image Comput Comput Assist Interv (MICCAI). Springer, 2021.
- [19] Peisheng Qian, Ziyuan Zhao, Cong Chen, Zeng Zeng, and Xiaoli Li, “Two eyes are better than one: Exploiting binocular correlation for diabetic retinopathy severity grading,” in EMBC. IEEE, 2021.
- [20] Zonghan Wu, Shirui Pan, Fengwen Chen, Guodong Long, Chengqi Zhang, and S Yu Philip, “A comprehensive survey on graph neural networks,” IEEE Trans. Neural Netw. Learn. Syst., 2020.
- [21] Thomas N. Kipf and Max Welling, “Semi-supervised classification with graph convolutional networks,” in ICLR, 2017.
- [22] Li Chen, Jie Sun, Daniel S. Hippe, Niranjan Balu, Quan Yuan, Isabelle Yuan, Xihai Zhao, Rui Li, Le He, Thomas S. Hatsukami, Jenq Neng Hwang, and Chun Yuan, “Quantitative assessment of the intracranial vasculature in an older adult population using icafe,” Neurobiology of Aging, 2019.