Cross-Survey Image Transformation: Enhancing SDSS and DECaLS Images to Near-HSC Quality for Advanced Astronomical Analysis
Abstract
This study focuses on transforming galaxy images between astronomical surveys, specifically enhancing images from the Sloan Digital Sky Survey (SDSS) and the Dark Energy Camera Legacy Survey (DECaLS) to achieve quality comparable to the Hyper Suprime-Cam survey (HSC). We proposed a hybrid model called Pix2WGAN, which integrates the pix2pix framework with the Wasserstein Generative Adversarial Network with Gradient Penalty (WGAN-GP) to convert low-quality observational images into high-quality counterparts. Our model successfully transformed DECaLS images into pseudo-HSC images, yielding impressive results and significantly enhancing the identification of complex structures, such as galaxy spiral arms and tidal tails, which may have been overlooked in the original DECaLS images. Moreover, Pix2WGAN effectively addresses issues like artifacts, noise, and blurriness in both source and target images. In addition to the basic Pix2WGAN model, we further developed an advanced architecture called Cascaded Pix2WGAN, which incorporates a multi-stage training mechanism designed to bridge the quality gap between SDSS and HSC images, demonstrating similarly promising outcomes. We systematically assessed the similarity between the model-generated pseudo-HSC images and actual HSC images using various metrics, including Mean Squared Error (MSE), Peak Signal-to-Noise Ratio (PSNR), and Structural Similarity Index (SSIM), along with perceptual metrics such as Learned Perceptual Image Patch Similarity (LPIPS) and Fréchet Inception Distance (FID). The results indicate that images transformed by our model outperform both the original SDSS and DECaLS images across nearly all evaluation metrics. Our research is expected to provide significant technical support for astronomical data analysis, cross-survey image integration, and high-precision astrometry.
1 Introduction
In astronomical research, galaxy images are essential resources that provide critical visual evidence of galaxy structures and evolution, as well as vital data for understanding the formation and development of the universe. For example, the citizen science project Galaxy Zoo engages the public in classifying and analyzing millions of galaxy images, assisting scientists in further investigations into galaxy formation and evolution, the structure of the universe, and the effects of dark matter and dark energy (Lintott et al., 2008, 2011; Willett et al., 2013).
As exploration of galaxies and the universe progresses, research increasingly relies on high-quality observational images. These high-quality images can reveal detailed structural features of galaxies, such as spiral arms, bars, and the distribution of interstellar gas and dust, as well as the dynamics of active star-forming regions. This information is crucial for studying the evolutionary history of galaxies, the physical state of the interstellar medium, and the environments in which star formation occurs (Madau & Dickinson, 2014). Moreover, high-quality galaxy images facilitate the examination of galaxy interactions, including mergers, gravitational interactions, and star formation activities. These phenomena not only illuminate the lifecycle of galaxies but also enhance our understanding of their roles within the larger cosmic structure and their impacts on cosmic evolution (Conselice, 2003, 2014).
Furthermore, high-quality images of galaxies play a critical role in the study of dark matter and large-scale cosmic structures. Through precise imaging, scientists can utilize gravitational lensing to infer the distribution of dark matter, leading to a deeper understanding of its influence on galaxy formation and evolution (Massey et al., 2010). Thus, the quality of observational images directly influences the extent of scientific discovery.
To improve image quality, the most straightforward method is to enhance the hardware of astronomical telescopes, commonly referred to as the “hardware approach”. Common hardware improvements include: 1) increasing the telescope aperture to enhance resolution and light-gathering capability (Roggemann et al., 1997; Early et al., 2004; Cai et al., 2019); 2) equipping telescopes with adaptive optics systems to compensate for atmospheric turbulence (Glindemann et al., 2000; Hickson, 2014; Hippler, 2019); 3) advancing photodetector technology to reduce noise and improve detection efficiency (Bai et al., 2008; Lesser, 2015; Kitchin, 2020); and 4) optimizing the design of optical components to minimize aberrations and increase light transmission (Paez & Strojnik, 2001; Breckinridge et al., 2015). While these hardware upgrades can significantly enhance the quality of astronomical images, they face challenges such as high manufacturing costs and material strength limitations, meaning that telescope performance cannot be improved indefinitely. Additionally, external factors such as atmospheric conditions, background noise, and light pollution further restrict the effectiveness of hardware improvements during observations (Popowicz et al., 2016; Schawinski et al., 2017; Jia et al., 2021).
Due to the limitations of hardware enhancements, “software methods” have become another important means of improving image quality. Traditional software techniques include image deconvolution, background noise removal, deblurring, and image stacking. For instance, wavelet transforms and deconvolution algorithms can be utilized to reduce noise and restore image details (Magain et al., 1998; Courbin et al., 1999; Starck et al., 2002). Additionally, flat field correction and dark current correction techniques can remove background noise, enhancing the contrast of celestial objects (Blanton et al., 2011; Ma et al., 2014). Stacking multiple observational datasets can also improve the signal-to-noise ratio and increase the visibility of faint celestial objects (Zibetti et al., 2007; Morales et al., 2018). However, these methods are constrained by the Shannon-Nyquist sampling theorem (Nyquist, 1928; Shannon, 1949). In situations with high noise and low-resolution images, traditional techniques may struggle to adequately restore details, thereby affecting the accurate study of celestial objects (Magain et al., 1998, 2007; Cantale et al., 2016).
Recently, rapid advancements in machine learning and artificial intelligence have led to data-driven image enhancement techniques across various fields. These technologies employ intelligent algorithms to recover image details in complex backgrounds and high-noise conditions, continually pushing the boundaries of image processing and often surpassing the diffraction limits of optical systems. They are widely used in medical imaging, autonomous driving, remote sensing, and other areas, significantly improving image analysis and decision-making capabilities.
However, the use of image enhancement techniques in astronomy remains relatively limited compared to other fields. This limitation is primarily due to the unique characteristics of astronomical images, such as high noise levels, low signal-to-noise ratios, and complex imaging conditions, which present additional processing challenges. Nevertheless, as research advances, more astronomers are exploring machine learning and image enhancement technologies to improve image quality and increase analytical accuracy. These applications encompass various areas, including denoising (Vojtekova et al., 2021; Sweere et al., 2022), deblurring (Reiman & Göhre, 2019), image restoration (Schawinski et al., 2017; Long et al., 2021), and super-resolution reconstruction (Li et al., 2018; Miao et al., 2024).
For instance, Dou et al. (2022) utilized a deep learning model called DownSampleGAN (DSGAN) to perform super-resolution reconstruction of magnetic field maps from the Michelson Doppler Imager (MDI), successfully achieving spatial resolution comparable to that of images from the Helioseismic and Magnetic Imager (HMI). Yang et al. (2023) applied three typical deep learning super-resolution models to enhance the resolution of FY-3E/X-EUVI 195 Å images, aligning them with the spatial resolution of Atmospheric Imaging Assembly (AIA) 193 Å images from the Solar Dynamics Observatory. Additionally, this study improved the temporal resolution of full-disk EUV solar images.
Notably, Schawinski et al. (2017) proposed the GalaxyGAN model based on conditional Generative Adversarial Networks (GANs), which was trained using samples from SDSS galaxy images to successfully recover high-detail original features from artificially degraded low-quality galaxy images. Since then, more advanced artificial intelligence algorithms have emerged to enhance original images and generate higher-resolution outputs, including the Enhanced Deep Super-Resolution Network (EDSR; Lim et al. 2017), the Very Deep Residual Channel Attention Network (RCAN; Zhang et al. 2018b), the Efficient Non-Local Contrastive Network (ENLCN; Xia et al. 2022), and the Super-Resolution Generative Adversarial Network (SRGAN; Ledig et al. 2017). These algorithms have been widely applied in the super-resolution reconstruction tasks of astronomical images (Li et al., 2022; Shibuya et al., 2024; Miao et al., 2024), demonstrating the tremendous potential of artificial intelligence algorithms in reconstructing details of galaxy images, thus maximizing resource utility and reducing the costs and time of repeated observations, which enhances the interpretability and scientific value of astronomical data (Kinakh et al., 2024).
However, most current algorithms primarily focus on improving the resolution of observational images, while resolution enhancement is only one aspect of overall image quality improvement. In reality, enhancing image quality also involves several key factors, such as contrast, color accuracy, detail retention, and noise suppression. Therefore, solely increasing the resolution while neglecting these other factors may limit the perceived quality of the generated images and their usefulness in scientific research.
Currently, another approach that is gaining attention among researchers is the use of deep learning techniques to transform images between different telescope observations, thereby improving the overall quality of existing low-quality observational images. However, due to variations in observational conditions, the complexity of image features, and challenges in algorithm adaptability, research in this area remains relatively limited. Therefore, there is an urgent need to develop new effective methods for mapping and transforming images from diverse observational facilities.
In this study, we present a novel hybrid model called Pix2WGAN, which builds upon the classical pix2pix framework (Isola et al., 2017). Our model combines the strengths of pix2pix with the Wasserstein GAN with Gradient Penalty (WGAN-GP) (Adler & Lunz, 2018). The original pix2pix model has been widely applied in various fields such as image-to-image translation, image restoration, style transfer, and satellite image analysis, demonstrating exceptional performance and flexibility across these tasks. By integrating WGAN-GP, our model enhances both the quality and stability of the generated images. Recent research has increasingly focused on the potential of such hybrid models in various computer vision applications; for instance, Tirel et al. (2024) successfully employed a similar model for denoising text images.
The primary aim of our work is to facilitate data transformation between different astronomical observation projects while enhancing the overall quality and detail representation of low-quality astronomical images. We apply the Pix2WGAN model to galaxy image transformation across three major astronomical survey datasets: the Sloan Digital Sky Survey (SDSS), the Dark Energy Camera Legacy Survey (DECaLS), and the Hyper Suprime-Cam Survey (HSC).
We note that Miao et al. (2024) investigated the transformation of SDSS to HSC images using four GAN-based super-resolution models (Ledig et al., 2017; Lim et al., 2017; Zhang et al., 2018b; Xia et al., 2022). However, their emphasis on integer scaling factors required downsampling HSC images to match the resolution of SDSS, which could compromise the quality of the generated pseudo-HSC images. In contrast, our Pix2WGAN does not rely on maintaining an integer scaling factor, allowing for the direct generation of high-quality pseudo-HSC galaxy images from low-quality SDSS or DECaLS data, thereby avoiding the quality loss associated with downsampling.
To evaluate the quality of the images generated by our model, we use both quantitative and qualitative assessment methods to compare the generated pseudo-HSC images with their corresponding observed HSC images. This evaluation not only verifies the reliability of the generated images but also offers a comprehensive analysis of the model’s performance in detail recovery and overall quality enhancement.
Our model can generate high-quality pseudo-HSC datasets within the observational areas of SDSS and DECaLS, as well as in regions that HSC has not yet observed. Additionally, the scalability of the Pix2WGAN model enhances its applicability for image transformation across various survey projects, enabling large-scale astronomical data processing across platforms and the production of multi-band images, thereby addressing future requirements for astronomical data integration.
The structure of this paper is organized as follows: Section 2 provides a brief overview of the data from the three observational projects used in this study—SDSS, DECaLS, and HSC—and outlines the data collection and sample construction processes. Section 3 provides a detailed analysis of the architecture and training process of the Pix2WGAN model. In Section 4, we present the application results of this model on SDSS, DECaLS, and HSC images, along with a comprehensive quality assessment of the generated pseudo-HSC images using both quantitative and qualitative evaluation methods. Finally, Section 5 summarizes the research findings and discusses the implications of our results.
2 Data Overview and Collection
The data used in this work are sourced from three survey projects: SDSS, DECaLS, and HSC. The differences in spatial resolution and depth among these surveys result in significant variations in their galaxy images. Here, we provide a brief overview of the imaging data from these three surveys, followed by an explanation of our sample collection process.
2.1 SDSS Images
The Sloan Digital Sky Survey (SDSS) 111https://www.sdss.org/ is a large-scale astronomical survey project that began in 2000 (York et al., 2000). It has produced the most detailed three-dimensional map of the universe to date, covering approximately one-third of the sky. SDSS provides multi-band deep images (, , , , bands) and spectral data for over 3 million celestial objects, significantly advancing our understanding of galaxies, dark matter, and large-scale structures in the universe (Gunn et al., 2006; Abazajian et al., 2009).
The SDSS project employs a 2.5-meter telescope located at Apache Point Observatory in New Mexico, USA, which is well-suited for extensive deep-sky observations. However, the telescope’s imaging depth and resolution (typically ranging from 1.5 to 2 arcseconds) are relatively low compared to subsequent high-resolution surveys, limiting its capability to capture fine details. The charge-coupled device (CCD) sensors used in the SDSS camera have a pixel resolution of 0.396 arcseconds per pixel (in the band). Despite processing techniques such as noise reduction and background light correction, these data may still struggle to resolve the intricate structures of galaxies.
While SDSS data is extensive and provides a wealth of astronomical information, its limitations in spatial resolution and depth hinder detailed structural studies compared to higher-resolution projects like DECaLS and HSC.
2.2 DECaLS Images
The Dark Energy Camera Legacy Survey (DECaLS) 222https://www.legacysurvey.org/decamls/ employs the Dark Energy Camera (DECam; Flaugher et al. 2015) to observe cosmic phenomena such as dark matter, dark energy, and galaxy evolution. DECam is mounted on the 4-meter Blanco telescope in Chile and features a wide field of view of 3.2 square degrees, with a pixel resolution of 0.262 arcseconds per pixel. Compared to SDSS, DECaLS significantly enhances image resolution, achieving full widths at half maximum (FWHM) of , , and in the , , and bands, respectively. Overall, the image resolution ranges from 0.6 to 1 arcsecond, enabling the detection of finer structures in celestial objects (DePoy et al., 2008).
The DECaLS survey plan provides approximately two-thirds of the optical imaging coverage for the ongoing Dark Energy Spectroscopic Instrument (DESI; Dey et al. 2019), focusing primarily on the northern Galactic cap (declination degrees) and the southern Galactic cap (declination degrees). Although the coverage area is extensive, there remains potential for further expansion compared to SDSS. In this study, we use the most up-to-date data release (DR15).
2.3 HSC Images
The Hyper Suprime-Cam Subaru Strategic Survey (HSC-SSP) 333https://hsc-release.mtk.nao.ac.jp/doc/ is another significant astronomical project focused on studying topics such as galaxy evolution, gravitational lensing, supernovae, and galactic structure (Miyazaki et al., 2012, 2018). HSC is mounted on the 8.2-meter Subaru telescope in Japan and features a field of view with a diameter of 1.5 degrees, as well as a pixel resolution of 0.168 arcseconds per pixel . The FWHM in the band is 0.6 arcseconds, enabling it to resolve the structures of spiral galaxies and other celestial details.
The HSC-SSP survey is divided into three components: wide, deep, and ultra-deep fields, which overlap with those of the SDSS (Ahumada et al., 2020), the Baryon Oscillation Spectroscopic Survey (BOSS; Dawson et al. 2012), the Galaxy and Mass Assembly survey (GAMA; Driver et al. 2011) and the Visible Multi-Object Spectrograph Very Large Telescope Deep Survey (VVDS; Le Fèvre et al. 2005). The third data release (PDR3), published in 2021, covers approximately 670 square degrees across five filters () and achieves a depth of 26 magnitude (). While the image quality and resolution of HSC surpass those of SDSS and DECaLS, its coverage area remains relatively small.
2.4 Data Collection
The main objective of this study is to utilize advanced deep learning methods to convert low-quality images from SDSS and DECaLS into high-quality images comparable to those from HSC. To achieve this, we need to construct a large sample that includes images from these survey projects. Our sample is derived from galaxies in the Galaxy Zoo DECaLS project, all of which are spectroscopic targets from SDSS. Consequently, the sample primarily includes galaxies with brightness greater than and covers redshifts of or lower. Additionally, these galaxies are required to have a Petrosian radius (as specified in the PETROTHETA4 column of the NASA–Sloan Atlas v1.0.0) of at least 3 arcseconds (Walmsley et al., 2022).
We first cross-matched the overlapping regions of these three observational projects and randomly selected 15,000 galaxies from these areas as training samples. This selection ensures that the model we build can learn a diverse range of features, including different types and morphologies of galaxies. Furthermore, we selected an additional 2,000 galaxies from these overlapping regions as test samples to evaluate the model’s generalization capabilities and the quality of the generated images. All images of these galaxies were obtained from the Legacy Survey website 444https://www.legacysurvey.org/.
The Legacy Survey website serves as a comprehensive platform for an astronomical project designed to showcase and provide access to observational data produced by DESI Legacy imaging survey. This website consolidates image data from various astronomical projects, including SDSS, DECaLS, HSC, and the Wide-field Infrared Survey Explorer (WISE). Users can access astronomical images and databases of celestial objects generated by the Legacy Survey, allowing them to browse imaging and photometric information for billions of celestial bodies. Additionally, the website provides various interactive tools to help users acquire and analyze this data, which is significant for research on dark energy, galaxy and star evolution, and the exploration of large-scale structures in the universe.
We used the JPEG cropping tool 555https://www.legacysurvey.org/viewer/ provided by the Legacy Survey website to download the corresponding images from SDSS, DECaLS, and HSC based on the right ascension and declination coordinates of the sample galaxies. To ensure consistency in the spatial coverage of images for the same galaxy, we utilized the algorithms provided by the website to adjust the pixel scale of all images to match that of HSC, which has a pixel scale of 0.168 arcseconds per pixel.
The Legacy Survey website also offers various band combinations for color synthesis of the images. After visual inspection, we selected the , , and bands for the synthesis of SDSS and HSC images, while for DECaLS images, we chose the , , and bands. This selection ensures that the final generated images maintain visually consistent colors, making images of galaxies from different data sources appear more harmonious and facilitating subsequent scientific analysis and comparison.
Due to hardware resource limitations, we constrained the image size to pixels. This size is sufficient to capture enough background sky while preserving the key structures of most galaxies, ensuring that the model can process efficiently under limited resource conditions. It is important to note that our model does not have a strict dependency on the size of the input images; larger or smaller sized images are also applicable. With appropriate adjustments, the model can maintain relatively stable performance across images of different sizes.
Figure 1 presents three examples of sample galaxies, displaying the galaxy images observed in HSC, DECaLS, and SDSS from bottom to top. It is clear that with increased exposure depth and resolution, the structures of the galaxies become more pronounced, and their sizes appear more extended. In images with shallower exposure depths, such as those from the SDSS project, fine structures in the outer regions of the galaxies are difficult to discern. However, with the greater exposure depth observed in the HSC project, these structures become clearer, revealing richer and more distinct internal details of the galaxies.
Our final sample consists of a training set made up of 15,000 groups of galaxies, while the test set consists of 2,000 groups of galaxies, with each group containing the corresponding three images from SDSS, DECaLS, and HSC. All images are adjusted to a resolution of 0.168 arcseconds per pixel and sized at pixels, with pixel values ranging from [0, 255], representing the intensity of the colors in the images.

3 Methodology
In this section, we will first provide a detailed introduction to the classic pix2pix model, which is widely used across various fields, primarily for image-to-image translation. Next, we will explain our improvements to this model by integrating WGAN-GP into the pix2pix framework, thereby constructing the Pix2WGAN hybrid model. To the best of our knowledge, this paper represents the first application of this hybrid model in the field of astronomy, with the aim of transforming SDSS and DECaLS images into high-quality images comparable to those from the HSC survey project.
3.1 Classical pix2pix Model
Pix2pix is an image translation model based on conditional GAN, proposed by Isola et al. (2017) at the 2017 CVPR (IEEE Conference on Computer Vision and Pattern Recognition). It is widely used for tasks that involve transforming one image style into another, including converting low-resolution images to high-resolution images, transforming sketches into realistic images, and changing daytime scenes to nighttime scenes (Chen & Hays, 2018; Chao et al., 2019; Liu et al., 2020; Henry et al., 2021; Liu & Xu, 2022; Kumar et al., 2024).
The core concept of pix2pix is to generate images that meet specific conditions using a conditional GAN. The model learns the mapping relationship between paired input and target images, enabling it to produce output images corresponding to the input images. Its network architecture, as illustrated in Figure 2, consists primarily of two components: a generator and a discriminator.

The generator employs a U-Net architecture (Ronneberger et al., 2015; Isola et al., 2017), which is a convolutional neural network (CNN) comprising an encoder and a decoder, specifically designed to transform input images into target images. In our specific task, the encoder is designed to consist of six modules, each composed of a convolutional layer, a batch normalization layer, and a Leaky ReLU activation function. This configuration progressively extracts low-level features while downsampling the images to capture essential information.
The decoder is similarly constructed with six modules, where each module includes a transposed convolution layer, a batch normalization layer, dropout layers (applied to the first three modules), and a Leaky ReLU activation function. This design gradually restores the spatial resolution of the images. In the U-Net architecture, the convolutional layers in the encoder are connected to the corresponding layers in the decoder through skip connections. This design effectively combines low-dimensional features with high-resolution features, preserving fine details and resulting in generated images that are more refined and realistic.
The discriminator employs a conditional PatchGAN architecture (Demir & Unal, 2018). A key feature of the PatchGAN is its ability to divide input images into multiple patches and evaluate their authenticity through local judgments of each patch. This approach not only emphasizes the consistency of local features but also enables the model to focus on details within each patch, effectively enhancing the quality of detail in the generated images.
In our specific task, the discriminator consists of five convolutional layers, each followed by a batch normalization layer and a Leaky ReLU activation function, ultimately producing a patch with the shape of (batchsize, 14, 14, 1). This patch is then averaged along the width and height dimensions to obtain a scalar value, which serves as the final output of the discriminator. The discriminator receives two sets of image pairs as input: one set contains the images outputted by the generator along with their corresponding input images, while the other set includes real/target images and their respective input images, with each set of image pairs concatenated along the channel dimension. The primary task of the discriminator is to learn to differentiate between the authenticity of these two sets of image pairs.
During the training process, the classical pix2pix model optimizes image transformation results primarily through an adversarial learning mechanism between the generator and the discriminator. The model total cost function is divided into generator loss and discriminator loss, with the generator loss comprising both adversarial loss and structural loss.
The adversarial loss aims to maximize the probability that the discriminator recognizes the generated image as a real image. It is calculated using a well-known loss function, the Binary Cross Entropy (BCE), represented by the following formula:
| (1) |
where represents the original low-quality input image, refers to the enhanced image generated by the generator, is a vector of ones of the size of the batch, denotes the generator and denotes the discriminator. In TensorFlow 2, the BCE can be implemented using .
Structural loss is quantified using loss to measure the difference between the generated image and the target image, ensuring that the generated image retains detailed information. The calculation formula is as follows:
| (2) |
where, refers to the high-quality target image and is also known as the Mean Absolute Error (MAE).
Integrating the above adversarial loss and structural loss, the total loss for the classical pix2pix generator can be expressed as follows:
| (3) |
where is a hyperparameter that balances the adversarial loss and the structural loss; its value is typically tuned according to the specific task at hand.
The discriminator loss evaluates the discriminator’s ability to distinguish between the target image and the generated image, with the calculation formula expressed as follows:
| (4) |
| (5) |
| (6) |
where is a vector of zeros of the size of the batch.
In each iteration of the training process, the generator first generates an image and calculates its loss. It then updates its weights using backpropagation with the goal of minimizing the total loss of the generator. Meanwhile, the discriminator’s loss is based on its evaluation of both real and generated images, aimed at optimizing its ability to distinguish between them. The discriminator updates its weights accordingly to reduce its loss.
Through this alternating update mechanism, the generator and discriminator mutually reinforce each other throughout the training process, continuously enhancing their performance. As training progresses, the generator increasingly produces high-quality images with a strong sense of realism, thereby ensuring the model’s effectiveness and stability in image-to-image translation tasks.
3.2 Hybrid Pix2pix WGAN-GP Model
The classic pix2pix model is based on conditional GAN. However, training GANs is often unstable, leading to fluctuations in the quality of the generated images and potentially resulting in mode collapse (Thanh-Tung & Tran, 2020). Mode collapse refers to a phenomenon where the generator exploits the weaknesses of the discriminator by optimizing along specific paths in the parameter space that can achieve high scores from the discriminator, yet fail to produce meaningful or diverse outputs. As a result, the generator begins to output only a limited range of results, failing to capture the rich features of the training data adequately. To address these issues, we employ WGAN-GP (Gulrajani et al., 2017; Chen, 2021) to improve the loss function structure of the classic pix2pix model and apply it to the specific task at hand . We refer to the modified model as Pix2WGAN.
Specifically, unlike the classical pix2pix model, which utilizes Jensen-Shannon (JS) divergence for binary classification in the discriminator, Pix2WGAN is trained by minimizing the Wasserstein distance between the distributions of real and generated data (Adler & Lunz, 2018). The Wasserstein distance, also known as the “Earth Mover’s” distance, quantifies the amount of “work” required to transform one probability distribution into another and serves as an effective method for measuring the distance between two distributions. A key advantage of this approach is its ability to provide a smoother and more continuous optimization curve, thereby mitigating the gradient vanishing problem that can arise with JS divergence in certain scenarios.
Additionally, WGAN-GP incorporates a Gradient Penalty technique to ensure that the gradients of the discriminator remain within an appropriate range across all input samples, thus satisfying the 1-Lipschitz condition. This method further enhances the model’s stability, enabling WGAN-GP to effectively generate high-quality samples across a wider range of application scenarios.
In our Pix2WGAN, the adversarial loss function of the generator has been modified to:
| (7) |
The structural loss term remains and is calculated using loss as before. Therefore, the total loss function for the generator is:
| (8) |
where is the hyperparameter that balances the adversarial loss and structural loss; in our study, it is set to a value of 100.
For the discriminator, the loss function has been modified to consist of two parts. The first part employs an averaging strategy similar to that of the classical pix2pix model, but its purpose is to measure the difference between real predictions and fake predictions:
| (9) |
The second part is the gradient penalty term, which is used to enforce gradient penalties. This term is defined by first setting as the interpolation between the target image and the generated image, as follows:
| (10) |
where is a random number. The gradient penalty is then defined as:
| (11) |
Where denotes the mathematical expectation. These two terms are combined to define the loss of the discriminator, as follows:
| (12) |
where is the weight for the gradient penalty, which is set to 10 in our study.
After improving the loss function of the classical pix2pix model, we developed a new Pix2WGAN hybrid model that exhibits substantial stability during the training process. In the next section, we will present the remarkable performance of this model in the task of transforming SDSS and DECaLS images into HSC-level images.
4 Experiments and Results
In this section, we apply the Pix2WGAN model to three major astronomical surveys: SDSS, DECaLS, and HSC, with the goal of transforming low-quality images from SDSS and DECaLS into high-quality images that closely resemble HSC observations. To evaluate the performance of Pix2WGAN in these image transformation tasks, we conduct both qualitative (visual inspection) and quantitative (metric assessment) analyses to compare the pseudo-HSC images generated by the model with the actual HSC images, as well as to assess them against the original images before transformation. Our focus will be on the overall quality, detailed structure, and denoising effectiveness of the transformed galaxy images.
4.1 Data Preprocessing
Data preprocessing is a critical step in ensuring the model’s performance. Before feeding the images into the model, we normalized the pixel values of the input images. In the downloaded raw images, all pixel values are restricted to the range of [0, 255]. To accelerate the model’s training speed and better retain the details in the images, we further scaled the pixel values of each image to the range of [-1, 1]. Specifically, let the original data be denoted as ; we calculate the scaled data using the following formula:
| (13) |
In this formula, 127.5 serves as the midpoint of the [0, 255] range. This scaling technique centers the pixel values while maintaining relative contrast, thus aiding in accelerating the model’s convergence and improving the quality of the generated images.
4.2 Transforming Images from DECaLS to HSC
In image-to-image transformation, a smaller difference between images typically simplifies the generator’s task, leading to generated images that more closely match the target images. This reduced disparity helps the model learn the mapping between input and target images more effectively. Given that the difference between DECaLS and HSC images is smaller than that between SDSS and HSC images, this subsection will begin by applying the Pix2WGAN model for the transformation from DECaLS to HSC.
We implemented the Pix2WGAN model using the Keras and TensorFlow 2 libraries (Abadi et al., 2016), and conducted training and testing on a computer equipped with an NVIDIA RTX 3090 GPU. During training, we set the batch size to 32. Both the generator and discriminator utilized the ADAM optimizer (Kingma, 2014), configured with parameters and . The initial learning rate was set to 0.0002 and was reduced to of its previous value after each epoch. To improve the stability and effectiveness of the training process, we adopted a strategy of updating the generator once every three iterations of training the discriminator. This approach helps maintain a balance between the model’s generative and discriminative capabilities, effectively enhancing the transformation from low-quality to high-quality images. The training was concluded after 500 epochs.
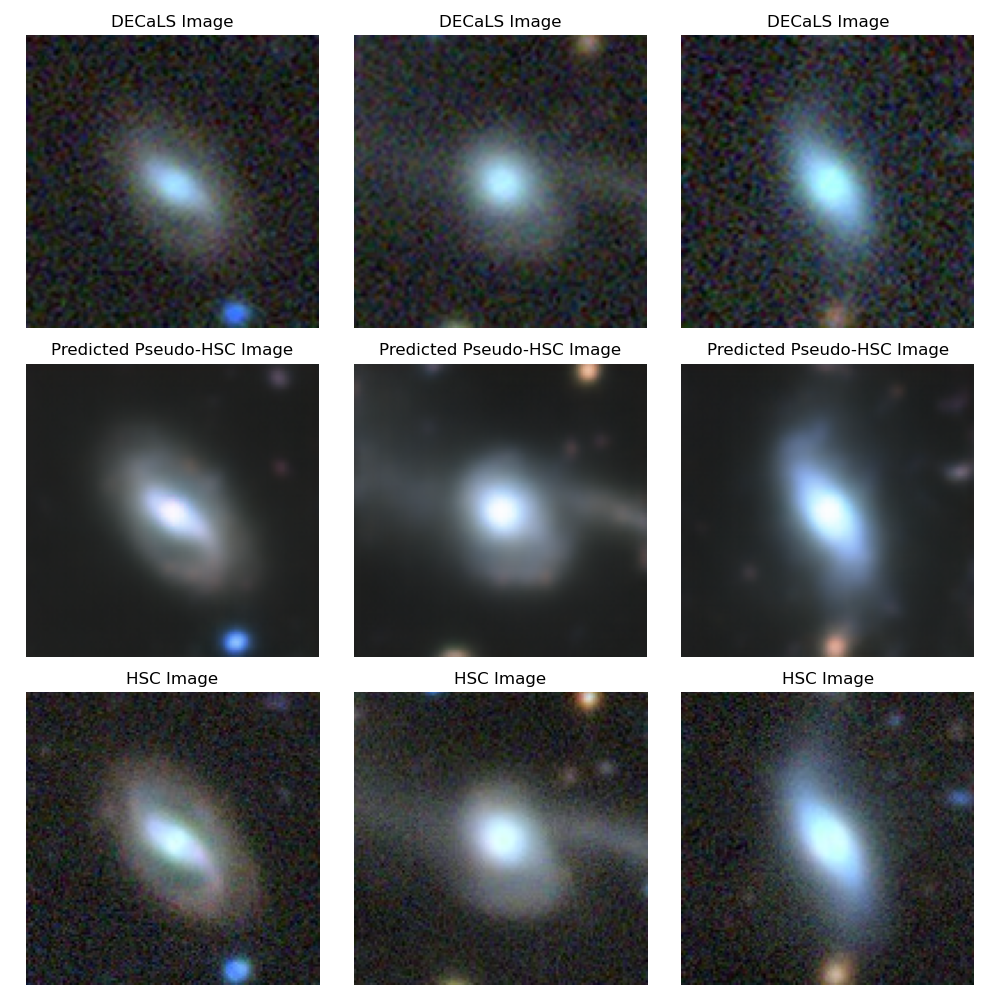
To qualitatively evaluate the performance of the Pix2WGAN model and the effects of image transformation, we visually examined the generated images and selected six representative galaxies from the testing set for presentation. These galaxies were chosen based on their diverse morphological features and varying complexities, enabling us to assess the model’s ability to capture different structures and details effectively.
For clarity, we organized the images of these selected galaxies into two figures: Figure 3 and Figure 4. Each figure displays three galaxies, illustrating their images before and after transformation alongside the target images. The first row presents the original DECaLS images, the second row showcases the model-transformed pseudo-HSC images, and the third row features the corresponding actual HSC images.
Through these images, we can clearly observe the quality and detail of the pseudo-HSC images generated from various DECaLS galaxy images after the Pix2WGAN transformation. This observation validates the effectiveness of the transformation method and its ability to enhance the features and details of celestial objects. By comparing the galaxy images in Figures 3 and 4, we note that the pseudo-HSC images produced by the Pix2WGAN model (second row) exhibit clearer structural features and richer details than the original DECaLS images (first row).
For example, in the first galaxy (leftmost column in both figures), the Pix2WGAN model nearly perfectly reconstructs the spiral structure with relatively smooth lines. Additionally, the disk structure of the second galaxy in Figure 4 (middle column) is more pronounced. Furthermore, the tidal tail of the second galaxy in Figure 3 (middle column) and the point-like structure of the third galaxy in Figure 4 (rightmost column) are also clearly reproduced by the model, whereas these features are nearly invisible in the original DECaLS images. This clearly demonstrates Pix2WGAN’s exceptional performance in image transformation.
Furthermore, through systematic comparisons of model-reconstructed pseudo-HSC images and actual HSC observational images, we found that the Pix2WGAN model can generate images that outperform actual results in specific cases, particularly when the observational HSC images exhibit artifacts, noise, or overexposure. To illustrate this, we selected three galaxies from the test samples that display noticeable issues, as shown in Figure 5. In the bottom row of the figure, the first galaxy shows streak-like artifacts, the second exhibits prominent noise, and the third is partially overexposed. After applying the Pix2WGAN model to transform the DECaLS images, the reconstructed pseudo-HSC images effectively removed artifacts, reduced noise, and corrected overexposure.
On the other hand, we also found that when the input images contain poor-quality data (such as artifacts, significant noise, and blurriness), the pseudo-HSC images generated after transformation by our Pix2WGAN model can effectively alleviate these issues. Figure 6 presents examples in this regard, where these galaxies exhibit clear problems in the DECaLS images: the leftmost galaxy shows noticeable streak-like artifacts, the middle galaxy has significant noise interference, and the rightmost galaxy’s image appears blurry. We observed that after the model transformation, the issues of all three galaxies showed significant improvement. Specifically, the streak-like artifacts in the leftmost DECaLS galaxy almost disappeared after transformation, the noise in the middle galaxy was greatly reduced, and the blurriness in the rightmost galaxy’s image was also alleviated to some extent.
In fact, a careful analysis of Figures 3 and 4 also shows that the Pix2WGAN model effectively reduces background noise during the generation of pseudo-HSC images. These results further highlight the potential of the Pix2WGAN model in addressing issues related to image artifacts, noise, overexposure, and blurriness. Particularly when the quality of observational images is limited or flawed, the model demonstrates the ability to provide effective image enhancement and repair capabilities.
However, it is important to note that the model-predicted pseudo-HSC images (second row) shown in Figures 3 and 4 exhibit similarities in structure and detail to the actual HSC observational images (third row); however, they still fall short in overall clarity and detail representation. This suggests that while deep learning models can significantly enhance the quality of the original images, they cannot completely replace the need for hardware upgrades and improvements. Therefore, the most effective strategy for improving image quality is to combine advanced deep learning techniques with high-performance hardware.


4.3 Transforming Images from SDSS to HSC
In this subsection, we explore the image transformation from SDSS to HSC. Compared to the transformation from DECaLS to HSC, there is a significant difference in the quality of the observed images produced by the SDSS and HSC survey projects. For example, the pixel resolution of SDSS images is 0.396 arcseconds per pixel, while HSC images have a resolution of 0.168 arcseconds per pixel, indicating that HSC images possess approximately 2.357 times the resolution advantage. This disparity is notably greater than the roughly 1.511 times difference between DECaLS and HSC, which makes the direct application of the Pix2WGAN model for transforming SDSS images to HSC images less than optimal.
To achieve better results in image transformation, we further enhanced the architecture of the hybrid model Pix2WGAN, allowing it to utilize intermediate images as a bridge. These intermediate images can be either DECaLS images or degraded HSC images (e.g., reducing the resolution of HSC images by approximately half). In this study, we have chosen DECaLS images as the bridging images, enabling us to simultaneously incorporate images from SDSS, DECaLS, and HSC for cascade training. We refer to this modified model as the Cascade Pix2WGAN model. The Cascade architecture of the model is illustrated in Figure 7, and the detailed training process is described as follows:
First, the SDSS images are input into the Cascade Pix2WGAN model, which generates pseudo-DECaLS images using the first generator, . Next, the pseudo-DECaLS images generated by are paired with the original SDSS images to form one set, while another set consists of real DECaLS images along with the original SDSS images. Both sets of images are then input into the first discriminator, , whose task is to measure the difference between the real and fake images in these sets.
Subsequently, the pseudo-DECaLS images generated by are fed into the second generator, , to produce pseudo-HSC images. The pseudo-HSC images are paired with their corresponding pseudo-DECaLS images to form one set, while another set consists of the corresponding real HSC images and pseudo-DECaLS images. These two sets of images are then input into the second discriminator, , which learns to measure the difference between the real and fake images in this context.
All the generators and discriminators in the Cascade Pix2WGAN model share the same structures and parameter settings as described in Section 4.2. During each training epoch, the generators and , along with the discriminators and , are optimized simultaneously. After multiple iterations, the final trained model can directly transform the original SDSS images into pseudo-HSC images using generators and , without the need for DECaLS images as an intermediate bridge.

To facilitate comparison with the previously mentioned results, we selected six galaxies from the test set that are the same as those shown in Figures 3 and 4. The transformation effects of the cascade model are displayed in Figures 8 and 9. Each figure showcases the transformation visual effects of the three galaxies: the top row displays the original SDSS images, the middle row presents the pseudo-HSC images generated by the Cascade Pix2WGAN model, and the bottom row shows the corresponding real HSC images.
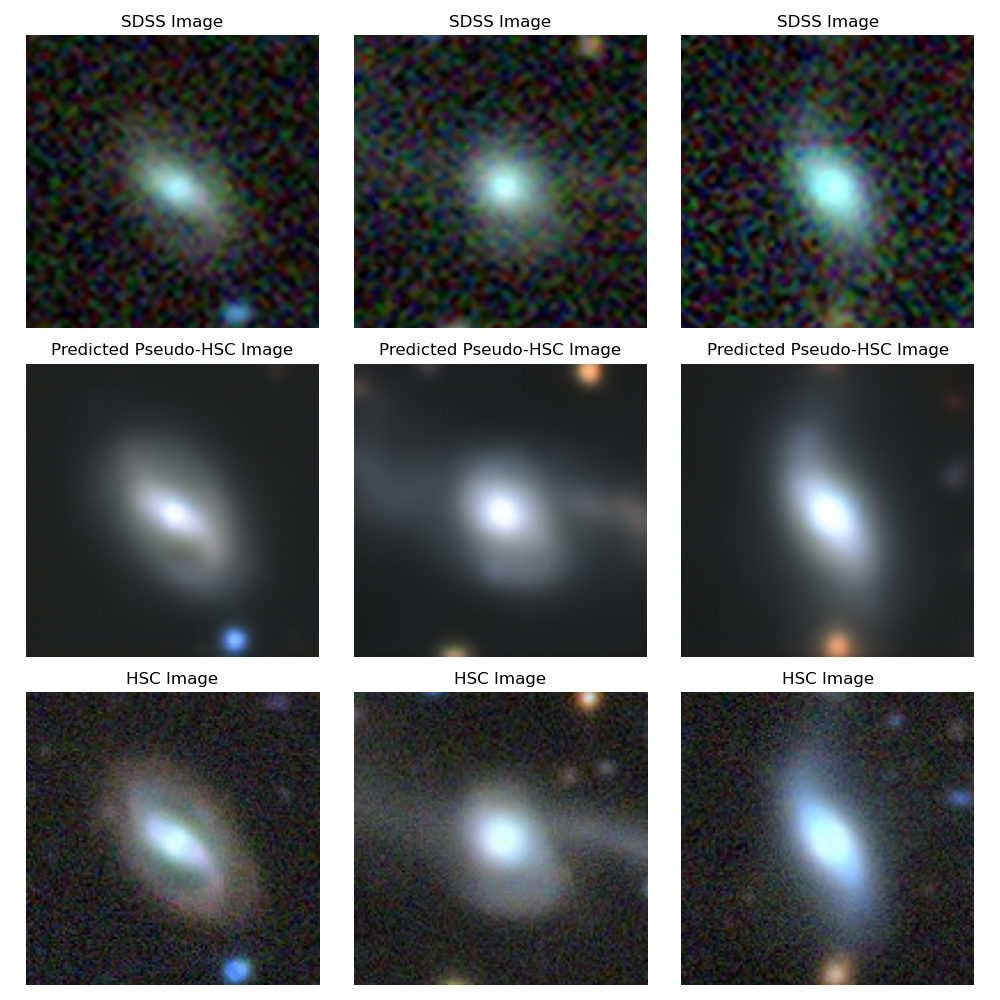

From Figures 8 and 9, it is evident that our Cascade Pix2WGAN model has achieved remarkable results. Many structural features that are not visible to the naked eye in SDSS—such as spiral arms, disks, tidal tails, bridges, and fine structures near the centers of galaxies—are clearly presented. The pseudo-HSC images generated by the model closely resemble the actual observed HSC images in terms of galaxy structure, morphology, and color. Compared to the original SDSS images, the transformed images exhibit significant improvements in resolution and detail recognition capability. We believe that these transformed SDSS images will serve as reliable data sources for future research in galaxy morphology classification and structural feature recognition. Additionally, as noted in the previous section, the generated pseudo-HSC images effectively reduce background noise, thereby improving the signal-to-noise ratio of the galaxy images.
Furthermore, we compared the middle row panels of Figures 8 and 9 with those in Figures 3 and 4. The results indicate that the pseudo-HSC images generated directly from SDSS images using the Cascade Pix2WGAN model perform slightly worse than those generated from DECaLS images using the Pix2WGAN model. This observation suggests that while the model’s performance is important, the quality of the initial input images is even more critical. We will explore this point in more detail in our subsequent quantitative comparisons.
4.4 Quantitative Metrics Assessment
In sections 4.2 and 4.3, we conducted a visual inspection of the generated pseudo-HSC images. The results indicated that the Pix2WGAN model significantly enhances the quality of SDSS and DECaLS images, and the generated pseudo-HSC images exhibit a high degree of similarity to the real HSC images. To further validate the model’s performance, this subsection introduces several quantitative evaluation metrics to assess the differences between the generated pseudo-HSC images and the real HSC images. These metrics include Mean Squared Error (MSE), Peak Signal-to-Noise Ratio (PSNR), and Structural Similarity Index (SSIM; Sheikh et al. 2004), as well as two perceptual metrics: Learned Perceptual Image Patch Similarity (LPIPS; Zhang et al. 2018a) and Fréchet Inception Distance (FID; Heusel et al. 2017).
MSE is a commonly used image similarity metric that measures the degree of difference between two images. This algorithm calculates the squared differences between corresponding pixels of the two images and then takes the average of these values to obtain a similarity score. A smaller MSE value indicates greater similarity between the two images, with a value of 0 representing that they are identical. For two multi-channel images of size , the calculation formula is:
| (14) |
where is the predicted image generated by the model and is the real image.
PSNR is also an important metric widely used to evaluate the performance of various image processing algorithms. Its value is derived from the MSE, establishing an interdependent relationship between the two metrics. PSNR is typically expressed in decibels (dB), where a higher value indicates greater similarity between the generated image and the real image, as well as better image quality. The calculation formula for PSNR is as follows:
| (15) |
where represents the maximum possible pixel value in the image; in this paper, the maximum pixel value is 255.
Unlike MSE and PSNR, which evaluate the quality of generated images based on pixel differences, SSIM measures the similarity between the real image and the generated image by comparing their brightness, contrast, and structural information. In contrast to MSE and PSNR, SSIM places greater emphasis on structural similarity rather than on pixel-by-pixel brightness differences, making it a more accurate reflection of human visual perception of image similarity. The SSIM value ranges from [-1, 1], with higher values indicating greater similarity between the two images. Its calculation involves comparing multiple features, including mean, variance, covariance, and two constants used for stability, as shown in the following formula:
| (16) |
In the formula, and represent the generated image and the real image, respectively, while , , , , and represent the mean, variance, and covariance of the generated image and the real image . and , where is the dynamic range of pixel values, and and are small constants used to ensure stability in calculations. In this study, , , and .
In addition, to better assess the differences between generated images and real images from the perspective of the human visual system, we introduce two commonly used metrics in deep learning: LPIPS and FID. These metrics evaluate image differences based on features extracted by deep learning models, enabling a more effective capture of perceptual similarity. Smaller values of LPIPS and FID indicate higher perceptual similarity between the two images. For detailed definitions and calculation methods of LPIPS and FID, please refer to the studies by Zhang et al. (2018a) and Szegedy et al. (2015). Compared to traditional image quality assessment methods, these metrics provide a more comprehensive analysis and complement the evaluation of generated image quality.
Using these evaluation metrics, we quantitatively assessed the similarity between the model-generated pseudo-HSC images and the real HSC observational images, as well as the similarity between the pre-transformed images and the real HSC images. The results for the test set are presented in Table 1. In the table, the superscript “1” after the term “pseudo-HSC” indicates that these images were generated from DECaLS images using the Pix2WGAN model, while the superscript “2” denotes that the images were generated from SDSS images using the Cascaded Pix2WGAN model.
| Image Pairs | MSE | PSNR | SSIM | LPIPS | FID |
|---|---|---|---|---|---|
| SDSS – HSC | 5.24 | 17.59 | 0.43 | 0.19 | 179.59 |
| Pseudo-HSC2 – HSC | 3.25 | 23.19 | 0.71 | 0.11 | 105.16 |
| DECaLS – HSC | 3.58 | 19.95 | 0.56 | 0.06 | 78.91 |
| Pseudo-HSC1 – HSC | 2.99 | 24.21 | 0.72 | 0.09 | 98.46 |
From Table 1, it is evident that the similarity between the pseudo-HSC images generated by the Cascaded Pix2WGAN model and the real HSC images is significantly higher across all metrics compared to the similarity between the original SDSS images and the real HSC images. Specifically, the SSIM measure increased significantly from 0.43 to 0.71, PSNR improved from 17.59 dB to 23.19 dB, and MSE decreased from 5.24 to 3.25. At the same time, the LPIPS and FID metrics also showed substantial improvement, with LPIPS decreasing from 0.19 to 0.11 and FID dropping from 179.59 to 105.16.
Similarly, the similarity between the pseudo-HSC images generated by the Pix2WGAN model and the real HSC images is significantly higher on most metrics compared to the similarity between the original DECaLS images and the real HSC images. Specifically, the SSIM metric improved from 0.56 to 0.72, PSNR increased from 19.95 dB to 24.21 dB, and MSE decreased from 3.58 to 2.99. This indicates that the Pix2WGAN model excels in reconstructing the details and optical quality of the images.
However, it is worth noting that the LPIPS and FID metrics showed limited change, with LPIPS rising slightly from 0.06 to 0.09 and FID increasing from 78.91 to 98.46. This may be because both LPIPS and FID rely on pre-trained deep learning models (such as VGG and Inception) to capture image features and assess similarity between images, and the performance of these models largely depends on the datasets on which they were trained. Generally, the pre-trained models for LPIPS and FID are trained on the ImageNet dataset, which encompasses a wide variety of objects and scenes but does not include astronomical images. Therefore, when evaluating galaxy images, these models may not effectively capture the unique structures, features, and visual information specific to galaxy images, leading to small differences in LPIPS and FID that do not accurately reflect the similarity or differences between galaxy images.
Nonetheless, the overall evaluation still indicates that the Pix2WGAN model effectively enhances image quality, particularly in terms of preserving structural integrity and visual information.
Furthermore, the results in Table 1 indicate that the pseudo-HSC images generated from DECaLS images using the Pix2WGAN model outperform those generated from SDSS images with the Cascaded Pix2WGAN model across all evaluation metrics. This suggests that while optimizing the performance of the model itself is crucial for the generated results, the quality of the original input images should not be overlooked. High-quality input images provide the model with richer details and more accurate information, significantly enhancing the transformation results. This is also visually evident in the comparisons between Figures 3, 4, and Figures 8, 9: the pseudo-HSC images generated from DECaLS images show superior performance in detail restoration, signal-to-noise ratio, and clarity compared to the results generated from SDSS images.
5 Summary
In recent years, deep learning technology has made significant advancements in image enhancement tasks and has been widely applied in the field of astrophysics. These technologies primarily focus on the denoising of astronomical images (Lin et al., 2021; Vojtekova et al., 2021) and super-resolution reconstruction (Li et al., 2022; Shibuya et al., 2024; Miao et al., 2024). By optimizing noise suppression and enhancing resolution, these methods have substantially improved the quality of astronomical images, allowing for clearer presentations of finer details and thereby supporting more precise astronomical analysis. However, the application of deep learning techniques to image transformation between different telescopes remains a relatively underexplored area.
Compared to denoising and super-resolution tasks, image transformation between telescopes involves not only issues of image resolution and noise processing, but also significant variations in the imaging characteristics of different telescopes, observing conditions, and data distributions. This transformation method can elevate low-resolution, low signal-to-noise ratio images to higher quality standards, thereby enhancing the scientific value of the data and more efficiently supporting astronomical analysis and research. Although research in this area is still limited, the rapid development of deep learning technology is gradually revealing the potential for cross-telescope image transformation, which is expected to become an important tool in astrophysics in the future.
In this study, we explored galaxy image transformation between different astronomical survey projects, specifically utilizing images from SDSS and DECaLS to generate images that are comparable to the high-quality galaxy images obtained from HSC observations. To achieve this, we proposed a hybrid model—Pix2WGAN—that combines the strengths of both pix2pix and WGAN-GP, enabling effective transformation of low-quality observational images into high-quality ones. We successfully applied this model to transform DECaLS images into pseudo-HSC images, achieving promising results.
Building on this, we further introduced a novel Cascaded Pix2WGAN model architecture specifically designed to address the significant differences between SDSS and HSC images. This architecture employs a multi-stage training mechanism that effectively manages the differences in resolution, dynamic range, and signal-to-noise ratio between the two types of images, significantly enhancing the model’s performance when transforming datasets with marked disparities. Through this design, the model systematically bridges the gap between low-quality SDSS images and high-quality HSC images, resulting in the generation of superior pseudo-HSC images.
To validate the quality of the images generated by the Pix2WGAN and Cascaded Pix2WGAN models, we conducted both qualitative and quantitative evaluation methods, comparing the model-generated pseudo-HSC images with their corresponding real HSC counterparts. The qualitative assessment involved visual inspection, which demonstrated that the overall quality of the generated images significantly exceeded that of the initial input images, particularly regarding galaxy structure, internal details, and noise levels. The generated pseudo-HSC images closely approximated the real HSC images in terms of detail richness and clarity, showcasing the model’s exceptional capability in structural representation.
In the quantitative evaluation, we measured the similarity between the model-generated images and the actual observed images by calculating various commonly used metrics. Specifically, we selected MSE, PSNR, SSIM, and two perceptual quality metrics: LPIPS and FID, to quantitatively assess the quality of the generated images. The results indicated that the pseudo-HSC images generated by the model performed excellently across most metrics, with the differences between them and the actual HSC observed images being significantly smaller than those between the initial input images and the real HSC observed images. This demonstrates that our constructed image transformation model can significantly improve the quality of SDSS and DECaLS images, producing pseudo-HSC images that closely resemble the actual HSC images.
Upon further inspection and analysis, we found that our model effectively addresses issues associated with low-quality input data, such as artifacts, significant noise, and blurriness. Furthermore, the model demonstrates the capability to generate images that surpass the quality of actual observed images under certain conditions. For instance, when HSC images contain artifacts, noise, or overexposure, the model can produce clearer and smoother images, thereby mitigating the impact of these observational errors. This finding indicates that the Pix2WGAN model possesses a degree of fault tolerance while enhancing image quality, allowing it to correct imaging defects caused by instrumental or environmental factors present in actual observations.
However, it is important to note that although the Pix2WGAN model can significantly improve the quality of input images, the generated pseudo-HSC images still exhibit differences in overall clarity and detail performance compared to the real HSC images. Specifically, the generative model has yet to fully capture small features with the precision of hardware observations. Therefore, while deep learning models demonstrate considerable potential in image transformation and enhancement, they cannot fully replace advanced hardware upgrades and improvements. Future image processing and enhancement efforts should integrate advanced deep learning technologies with high-performance observational equipment to collectively elevate the quality of astronomical images.
Our research has enabled the construction of a pseudo-HSC dataset within the observational regions of the SDSS and DECaLS, covering areas of the sky not yet observed by HSC, thus increasing the utilization efficiency of existing low-quality astronomical data. Additionally, the proposed model is not only applicable to image transformation between the SDSS, DECaLS, and HSC datasets, but can also be extended to other survey projects, such as the Dark Energy Survey (DES), the Large Synoptic Survey Telescope (LSST), the Hubble Space Telescope (HST), the Chinese Space Station Telescope(CSST) and the James Webb Space Telescope (JWST). In future applications, this method is anticipated to offer valuable technical support for astrophysical data analysis, facilitate image integration across different survey projects, and enable high-precision astrophysical measurements.
6 Acknowledgments
The Hyper Suprime-Cam (HSC) collaboration includes the astronomical communities of Japan and Taiwan, and Princeton University. The HSC instrumentation and software were developed by the National Astronomical Observatory of Japan (NAOJ), the Kavli Institute for the Physics and Mathematics of the Universe (Kavli IPMU), the University of Tokyo, the High Energy Accelerator Research Organization (KEK), the Academia Sinica Institute for Astronomy and Astrophysics in Taiwan (ASIAA), and Princeton University. Funding was contributed by the FIRST program from the Japanese Cabinet Office, the Ministry of Education, Culture, Sports, Science and Technology (MEXT), the Japan Society for the Promotion of Science (JSPS), Japan Science and Technology Agency (JST), the Toray Science Foundation, NAOJ, Kavli IPMU, KEK, ASIAA, and Princeton University.
The DESI Legacy Imaging Surveys consist of three individual and complementary projects: the Dark Energy Camera Legacy Survey (DECaLS), the Beijing-Arizona Sky Survey (BASS), and the Mayall z-band Legacy Survey (MzLS). DECaLS, BASS and MzLS together include data obtained, respectively, at the Blanco telescope, Cerro Tololo Inter-American Observatory, NSF’s NOIRLab; the Bok telescope, Steward Observatory, University of Arizona; and the Mayall telescope, Kitt Peak National Observatory, NOIRLab. NOIRLab is operated by the Association of Universities for Research in Astronomy (AURA) under a cooperative agreement with the National Science Foundation. Pipeline processing and analyses of the data were supported by NOIRLab and the Lawrence Berkeley National Laboratory (LBNL). Legacy Surveys also uses data products from the Near-Earth Object Wide-field Infrared Survey Explorer (NEOWISE), a project of the Jet Propulsion Laboratory/California Institute of Technology, funded by the National Aeronautics and Space Administration. Legacy Surveys was supported by: the Director, Office of Science, Office of High Energy Physics of the U.S. Department of Energy; the National Energy Research Scientific Computing Center, a DOE Office of Science User Facility; the U.S. National Science Foundation, Division of Astronomical Sciences; the National Astronomical Observatories of China, the Chinese Academy of Sciences and the Chinese National Natural Science Foundation. LBNL is managed by the Regents of the University of California under contract to the U.S. Department of Energy. The complete acknowledgments can be found at https://www.legacysurvey.org/acknowledgment/.
Funding for the Sloan Digital Sky Survey V has been provided by the Alfred P. Sloan Foundation, the Heising-Simons Foundation, the National Science Foundation, and the Participating Institutions. SDSS acknowledges support and resources from the Center for High-Performance Computing at the University of Utah. SDSS telescopes are located at Apache Point Observatory, funded by the Astrophysical Research Consortium and operated by New Mexico State University, and at Las Campanas Observatory, operated by the Carnegie Institution for Science. The SDSS web site is www.sdss.org.
SDSS is managed by the Astrophysical Research Consortium for the Participating Institutions of the SDSS Collaboration, including Caltech, the Carnegie Institution for Science, Chilean National Time Allocation Committee (CNTAC) ratified researchers, The Flatiron Institute, the Gotham Participation Group, Harvard University, Heidelberg University, The Johns Hopkins University, L’Ecole polytechnique fédérale de Lausanne (EPFL), Leibniz-Institut für Astrophysik Potsdam (AIP), Max-Planck-Institut für Astronomie (MPIA Heidelberg), Max-Planck-Institut für Extraterrestrische Physik (MPE), Nanjing University, National Astronomical Observatories of China (NAOC), New Mexico State University, The Ohio State University, Pennsylvania State University, Smithsonian Astrophysical Observatory, Space Telescope Science Institute (STScI), the Stellar Astrophysics Participation Group, Universidad Nacional Autónoma de México, University of Arizona, University of Colorado Boulder, University of Illinois at Urbana-Champaign, University of Toronto, University of Utah, University of Virginia, Yale University, and Yunnan University.
Z.J.L. acknowledges the support from the Shanghai Science and Technology Foundation Fund under grant No. 20070502400, and the science research grants from the China Manned Space Project. S.H.Z. acknowledges support from the National Natural Science Foundation of China (Grant No. 12173026), the National Key Research and Development Program of China (Grant No. 2022YFC2807303), the Shanghai Science and Technology Fund (Grant No. 23010503900), the Program for Professor of Special Appointment (Eastern Scholar) at Shanghai Institutions of Higher Learning and the Shuguang Program (23SG39) of the Shanghai Education Development Foundation and Shanghai Municipal Education Commission. L.P.F. acknowledges the support from the National Natural Science Foundation of China (NSFC 11933002). H.B.X. acknowledges the support from the National Natural Science Foundation of China (NSFC 12203034), the Shanghai Science and Technology Fund (22YF1431500), and the science research grants from the China Manned Space Project. W.D. acknowledges the support from NSFC grant No. 11890691. This work is also supported by the National Natural Science Foundation of China under Grants Nos. 12141302 and the science research grants from China Manned Space Project with Grand No. CMS-CSST-2021-A01.
References
- Abadi et al. (2016) Abadi, M., Barham, P., Chen, J., et al. 2016, in 12th USENIX symposium on operating systems design and implementation (OSDI 16), 265–283
- Abazajian et al. (2009) Abazajian, K. N., Adelman-McCarthy, J. K., Agüeros, M. A., et al. 2009, The Astrophysical Journal Supplement Series, 182, 543
- Adler & Lunz (2018) Adler, J., & Lunz, S. 2018, Advances in neural information processing systems, 31
- Ahumada et al. (2020) Ahumada, R., Prieto, C. A., Almeida, A., et al. 2020, The Astrophysical Journal Supplement Series, 249, 3
- Bai et al. (2008) Bai, Y., Bajaj, J., Beletic, J. W., et al. 2008, in High energy, optical, and infrared detectors for astronomy III, Vol. 7021, SPIE, 29–44
- Blanton et al. (2011) Blanton, M. R., Kazin, E., Muna, D., Weaver, B. A., & Price-Whelan, A. 2011, The Astronomical Journal, 142, 31
- Breckinridge et al. (2015) Breckinridge, J. B., Lam, W. S. T., & Chipman, R. A. 2015, Publications of the Astronomical Society of the Pacific, 127, 445
- Cai et al. (2019) Cai, J., Zeng, H., Yong, H., Cao, Z., & Zhang, L. 2019, in Proceedings of the IEEE/CVF international conference on computer vision, 3086–3095
- Cantale et al. (2016) Cantale, N., Courbin, F., Tewes, M., Jablonka, P., & Meylan, G. 2016, Astronomy & Astrophysics, 589, A81
- Chao et al. (2019) Chao, W., Chang, L., Wang, X., et al. 2019, in 2019 IEEE International Conference on Image Processing (ICIP), IEEE, 4699–4703
- Chen (2021) Chen, H. 2021in , IOP Publishing, 012066
- Chen & Hays (2018) Chen, W., & Hays, J. 2018, in Proceedings of the IEEE conference on computer vision and pattern recognition, 9416–9425
- Conselice (2003) Conselice, C. J. 2003, The Astrophysical Journal Supplement Series, 147, 1
- Conselice (2014) —. 2014, Annual Review of Astronomy and Astrophysics, 52, 291
- Courbin et al. (1999) Courbin, F., Magain, P., Sohy, S., Lidman, C., & Meylan, G. 1999, Messenger, 97
- Dawson et al. (2012) Dawson, K. S., Schlegel, D. J., Ahn, C. P., et al. 2012, The Astronomical Journal, 145, 10
- Demir & Unal (2018) Demir, U., & Unal, G. 2018, arXiv preprint arXiv:1803.07422
- DePoy et al. (2008) DePoy, D., Abbott, T., Annis, J., et al. 2008, in Ground-based and Airborne Instrumentation for Astronomy II, Vol. 7014, SPIE, 190–198
- Dey et al. (2019) Dey, A., Schlegel, D. J., Lang, D., et al. 2019, The Astronomical Journal, 157, 168
- Dou et al. (2022) Dou, F., Xu, L., Ren, Z., Zhao, D., & Zhang, X. 2022, Research in Astronomy and Astrophysics, 22, 085018
- Driver et al. (2011) Driver, S. P., Hill, D. T., Kelvin, L. S., et al. 2011, Monthly Notices of the Royal Astronomical Society, 413, 971
- Early et al. (2004) Early, J. T., Hyde, R., & Baron, R. L. 2004, in UV/Optical/IR Space Telescopes: Innovative Technologies and Concepts, Vol. 5166, SPIE, 148–156
- Flaugher et al. (2015) Flaugher, B., Diehl, H., Honscheid, K., et al. 2015, The Astronomical Journal, 150, 150
- Glindemann et al. (2000) Glindemann, A., Hippler, S., Berkefeld, T., & Hackenberg, W. 2000, Experimental Astronomy, 10, 5
- Gulrajani et al. (2017) Gulrajani, I., Ahmed, F., Arjovsky, M., Dumoulin, V., & Courville, A. C. 2017, Advances in neural information processing systems, 30
- Gunn et al. (2006) Gunn, J. E., Siegmund, W. A., Mannery, E. J., et al. 2006, The Astronomical Journal, 131, 2332
- Henry et al. (2021) Henry, J., Natalie, T., & Madsen, D. 2021, Research Gate Publication, 1
- Heusel et al. (2017) Heusel, M., Ramsauer, H., Unterthiner, T., Nessler, B., & Hochreiter, S. 2017, Advances in neural information processing systems, 30
- Hickson (2014) Hickson, P. 2014, The Astronomy and Astrophysics Review, 22, 1
- Hippler (2019) Hippler, S. 2019, Journal of Astronomical Instrumentation, 8, 1950001
- Isola et al. (2017) Isola, P., Zhu, J.-Y., Zhou, T., & Efros, A. A. 2017, in Proceedings of the IEEE conference on computer vision and pattern recognition, 1125–1134
- Jia et al. (2021) Jia, P., Ning, R., Sun, R., Yang, X., & Cai, D. 2021, Monthly Notices of the Royal Astronomical Society, 501, 291
- Kinakh et al. (2024) Kinakh, V., Belousov, Y., Quétant, G., et al. 2024, Sensors, 24, 1151
- Kingma (2014) Kingma, D. P. 2014, arXiv preprint arXiv:1412.6980
- Kitchin (2020) Kitchin, C. R. 2020, Astrophysical techniques (CRC press)
- Kumar et al. (2024) Kumar, D. P., Bhadula, S., Al-Farouni, M., et al. 2024, in 2024 International Conference on Communication, Computer Sciences and Engineering (IC3SE), IEEE, 1351–1357
- Le Fèvre et al. (2005) Le Fèvre, O., Vettolani, G., Garilli, B., et al. 2005, Astronomy & Astrophysics, 439, 845
- Ledig et al. (2017) Ledig, C., Theis, L., Huszár, F., et al. 2017, in Proceedings of the IEEE conference on computer vision and pattern recognition, 4681–4690
- Lesser (2015) Lesser, M. 2015, Publications of the Astronomical Society of the Pacific, 127, 1097
- Li et al. (2022) Li, W., Liu, Z., & Deng, H. 2022, in 2022 IEEE 8th International Conference on Computer and Communications (ICCC), IEEE, 1977–1981
- Li et al. (2018) Li, Z., Peng, Q., Bhanu, B., Zhang, Q., & He, H. 2018, Astrophysics and Space Science, 363, 1
- Lim et al. (2017) Lim, B., Son, S., Kim, H., Nah, S., & Mu Lee, K. 2017, in Proceedings of the IEEE conference on computer vision and pattern recognition workshops, 136–144
- Lin et al. (2021) Lin, Q., Fouchez, D., & Pasquet, J. 2021, in 2020 25th International Conference on Pattern Recognition (ICPR), IEEE, 5634–5641
- Lintott et al. (2011) Lintott, C., Schawinski, K., Bamford, S., et al. 2011, Monthly Notices of the Royal Astronomical Society, 410, 166
- Lintott et al. (2008) Lintott, C. J., Schawinski, K., Slosar, A., et al. 2008, Monthly Notices of the Royal Astronomical Society, 389, 1179
- Liu et al. (2020) Liu, B., Song, K., Zhu, Y., & Elgammal, A. 2020, in Proceedings of the Asian Conference on Computer Vision
- Liu & Xu (2022) Liu, C., & Xu, B. 2022, Computer-Aided Civil and Infrastructure Engineering, 37, 1737
- Long et al. (2021) Long, M., Soubo, Y., Cong, S., Weiping, N., & Tong, L. 2021, Monthly Notices of the Royal Astronomical Society, 504, 1077
- Ma et al. (2014) Ma, B., Shang, Z., Hu, Y., et al. 2014, in High energy, optical, and infrared detectors for astronomy vi, Vol. 9154, SPIE, 593–600
- Madau & Dickinson (2014) Madau, P., & Dickinson, M. 2014, Annual Review of Astronomy and Astrophysics, 52, 415
- Magain et al. (2007) Magain, P., Courbin, F., Gillon, M., et al. 2007, Astronomy & Astrophysics, 461, 373
- Magain et al. (1998) Magain, P., Courbin, F., & Sohy, S. 1998, The Astrophysical Journal, 494, 472
- Massey et al. (2010) Massey, R., Kitching, T., & Richard, J. 2010, Reports on Progress in Physics, 73, 086901
- Miao et al. (2024) Miao, J., Tu, L., Jiang, B., Li, X., & Qiu, B. 2024, The Astrophysical Journal Supplement Series, 274, 7
- Miyazaki et al. (2012) Miyazaki, S., et al. 2012, in Proc. SPIE Conf. Ser, Vol. 8446, 327
- Miyazaki et al. (2018) Miyazaki, S., Komiyama, Y., Kawanomoto, S., et al. 2018, Publications of the Astronomical Society of Japan, 70, S1
- Morales et al. (2018) Morales, G., Martínez-Delgado, D., Grebel, E. K., et al. 2018, Astronomy & Astrophysics, 614, A143
- Nyquist (1928) Nyquist, H. 1928, Transactions of the American Institute of Electrical Engineers, 47, 617
- Paez & Strojnik (2001) Paez, G., & Strojnik, M. 2001, in Handbook of Optical Engineering (CRC Press), 225–280
- Popowicz et al. (2016) Popowicz, A., Kurek, A., Blachowicz, T., Orlov, V., & Smolka, B. 2016, Monthly Notices of the Royal Astronomical Society, 463, 2172
- Reiman & Göhre (2019) Reiman, D. M., & Göhre, B. E. 2019, Monthly Notices of the Royal Astronomical Society, 485, 2617
- Roggemann et al. (1997) Roggemann, M. C., Welsh, B. M., & Fugate, R. Q. 1997, Reviews of Modern Physics, 69, 437
- Ronneberger et al. (2015) Ronneberger, O., Fischer, P., & Brox, T. 2015, in Medical image computing and computer-assisted intervention–MICCAI 2015: 18th international conference, Munich, Germany, October 5-9, 2015, proceedings, part III 18, Springer, 234–241
- Schawinski et al. (2017) Schawinski, K., Zhang, C., Zhang, H., Fowler, L., & Santhanam, G. K. 2017, Monthly Notices of the Royal Astronomical Society: Letters, 467, L110
- Shannon (1949) Shannon, C. E. 1949, Proceedings of the IRE, 37, 10
- Sheikh et al. (2004) Sheikh, S., et al. 2004, Image quality assessment: from error visibility to structural similarity, IEEE Trans. Image Process, 13, 600
- Shibuya et al. (2024) Shibuya, T., Ito, Y., Asai, K., et al. 2024, arXiv preprint arXiv:2403.06729
- Starck et al. (2002) Starck, J.-L., Pantin, E., & Murtagh, F. 2002, Publications of the Astronomical Society of the Pacific, 114, 1051
- Sweere et al. (2022) Sweere, S. F., Valtchanov, I., Lieu, M., et al. 2022, Monthly Notices of the Royal Astronomical Society, 517, 4054
- Szegedy et al. (2015) Szegedy, C., Liu, W., Jia, Y., et al. 2015, in Proceedings of the IEEE conference on computer vision and pattern recognition, 1–9
- Thanh-Tung & Tran (2020) Thanh-Tung, H., & Tran, T. 2020, in 2020 international joint conference on neural networks (ijcnn), IEEE, 1–10
- Tirel et al. (2024) Tirel, L., Ali, A. M., & Hashim, H. A. 2024, Systems and Soft Computing, 6, 200122
- Vojtekova et al. (2021) Vojtekova, A., Lieu, M., Valtchanov, I., et al. 2021, Monthly Notices of the Royal Astronomical Society, 503, 3204
- Walmsley et al. (2022) Walmsley, M., Lintott, C., Géron, T., et al. 2022, Monthly Notices of the Royal Astronomical Society, 509, 3966
- Willett et al. (2013) Willett, K. W., Lintott, C. J., Bamford, S. P., et al. 2013, Monthly Notices of the Royal Astronomical Society, 435, 2835
- Xia et al. (2022) Xia, B., Hang, Y., Tian, Y., et al. 2022in , 2759–2767
- Yang et al. (2023) Yang, Q., Chen, Z., Tang, R., Deng, X., & Wang, J. 2023, The Astrophysical Journal Supplement Series, 265, 36
- York et al. (2000) York, D. G., Adelman, J., Anderson Jr, J. E., et al. 2000, The Astronomical Journal, 120, 1579
- Zhang et al. (2018a) Zhang, R., Isola, P., Efros, A. A., Shechtman, E., & Wang, O. 2018a, in Proceedings of the IEEE conference on computer vision and pattern recognition, 586–595
- Zhang et al. (2018b) Zhang, Y., Li, K., Li, K., et al. 2018b, in Proceedings of the European conference on computer vision (ECCV), 286–301
- Zibetti et al. (2007) Zibetti, S., Ménard, B., Nestor, D. B., et al. 2007, The Astrophysical Journal, 658, 161