Corporate Bankruptcy Prediction with Domain-Adapted BERT
Abstract
This study performs BERT-based analysis, which is a representative contextualized language model, on corporate disclosure data to predict impending bankruptcies. Prior literature on bankruptcy prediction mainly focuses on developing more sophisticated prediction methodologies with financial variables. However, in our study, we focus on improving the quality of input dataset. Specifically, we employ BERT model to perform sentiment analysis on MD&A disclosures. We show that BERT outperforms dictionary-based predictions and Word2Vec-based predictions under time-discrete logistic hazard model, k-nearest neighbor (kNN-5), and linear kernel support vector machine (SVM). Further, instead of pre-training the BERT model from scratch, we apply self-learning with confidence-based filtering to corporate disclosure data. We achieve the accuracy rate of 91.56% and demonstrate that the domain adaptation procedure brings a significant improvement in prediction accuracy.
1 Introduction
Predicting imminent corporate bankruptcies has been of great importance both in academia and in industry. Early studies on bankruptcy prediction focuses on identifying financial variables that precede impending insolvencies. Altman (1968) finds out that z-score, a composite measure of several financial variables, predicts imminent insolvencies. Since then, numerous papers document additional financial variables that seem to predict bankruptcies (Ding et al., 2012; Bharath and Shumway, 2008; Dwyer et al., 2004). Among 39 distinct financial variables, Tian et al. (2015) choose seven key variables that effectively predict bankruptcies within 12 months by LASSO.
However, in contrast to the fact that the majority of corporate disclosures contain non-financial information, textual disclosures have received relatively less attention. Following Li (2008)’s call for research on textual corporate disclosures, there have been numerous attempts (Tetlock et al., 2008; Li, 2010; Mayew et al., 2015) to analyze the textual sentiments of corporate disclosures. They commonly find that textual non-financial information has orthogonal informational value to the existing financial information. However, the majority of the analyses are based on the dictionary-based approach suggested by Loughran and McDonald (2011).
In our study, we perform a BERT-based analysis on corporate disclosure data. BERT (Devlin et al., 2018) is the pre-trained language model based on the self-attention mechanism of Transformers Vaswani et al. (2017). BERT and its improved versions such as GLUE Wang et al. (2018), SQUAD Rajpurkar et al. (2016), and RACE Lai et al. (2017), have achieved state-of-the-art results in several NLP downstream tasks. In this research, we analyze the management, discussion, and analysis (MD&A) section of corporate disclosures and extract its context-specific sentiment. We then predict bankruptcies that occur within 12 months from the issuance of annual reports using the sentiment variables produced by BERT-based model. The reasons why we choose MD&A sections to be our target of BERT-based analysis are as follows.
First, managers are obliged to express their opinions regarding the future performance of firms in MD&A sections. Therefore, MD&A is a rich source of information to analyze managerial assessment regarding a firm’s ability to operate as a going concern. Second, negative future predictions are likely to be accompanied by other positive explanations (see Appendix A, Jung and Kwon, 1988). Therefore, even though humans can interpret implicit negative nuance in the written disclosures, the traditional dictionary-based approach likely leads to an erroneous conclusion. Lastly, MD&A sections are required when preparing 10-K filings for all firms. Therefore, we mitigate the sample selection bias by confining our analysis to observations archived in SEC filings.
Our paper makes several contributions to the existing line of literature. To our best knowledge, this is by far the first study to predict corporate outcomes other than stock market returns with BERT-based sentiment analysis. Unsophisticated investors have difficulty in understanding corporate disclosures since the disclosures are complex in nature (Bartov et al., 2000). Therefore, the dictionary-based approach displays a trivial limitation in analyzing disclosure texts. We expect that context-specific linguistic analysis will accurately examine the contextual sentiment of corporate disclosures. Specifically, by comparing the ability to predict impending bankruptcies, we show that BERT-based analysis outperforms analyses based on dictionary (key word lists) and word level embedding.
Second, there is no BERT model trained on corporate disclosures and the open-source BERT model which is trained on the closest domain is Fin-BERT (Araci, 2019). Fin-BERT is trained using financial news data. However, since the corporate disclosures and the financial news texts are in a similar but different domain, Fin-BERT is not perfectly suitable for interpreting corporate disclosures. We need to ensure that the data distributions of the training domain and the test domain are the same to improve the performance of machine learning models. Violation of this requirement, which is known as domain shift (Shimodaira, 2000), leads to underperformance of models (Glorot et al., 2011). Language models that are trained in two stages of pre-training and fine-tuning such as BERT, satisfy this assumption only when they are pre-trained and fine-tuned with a subset of their domain. Domain shift harms BERT model performance substantially (Lee et al., 2020; Beltagy et al., 2019). The most trivial way to overcome this problem is to pre-train BERT language model from scratch. However, language model pre-training is highly time and resource-consuming and it is inefficient to pre-train language models for only specific tasks.
Another way to deal with domain shift in BERT application is to fine-tune the model with labeled data from the target domain. However, in reality, labeled data for fine-tuning is often not available. In such cases, unsupervised domain adaption is a good alternative (Kim et al., 2020; Kundu et al., 2020). In this paper, we apply self-learning, one of the key methodologies of unsupervised domain adaption. We show that if the distance between the source and target domains is close enough, supervising a BERT-based classification model with self-generated pseudo-labels filtered with confidence level leads to a significant improvement in performance.
2 Related Studies
2.1 Bankruptcy predictions
In his seminal study, Altman (1968) finds that financial variables disclosed in annual reports predict bankruptcies. Shumway (2001) shows that in addition to financial statement-related variables, stock market-related variables such as market capitalization and stock price are also associated with future bankruptcies. However, considering that financial variables convey imperfect corporate information (Tennyson et al., 1990), prior literature extracts information from narrative disclosures. Cecchini et al. (2010) employ a complex vector space model to predict bankruptcies with MD&A disclosures. However, they remain silent on whether textual information has additional predictive ability to financial variables. Mayew et al. (2015) find that narrative disclosures indeed contain information which is orthogonal to the information provided by financial variables. They utilize words lists provided by Loughran and McDonald (2011) to analyze general tone of MD&A disclosures.
Related to prediction methodology, Wilson and Sharda (1994) use neural network with financial variables to predict bankruptcies. Premachandra et al. (2011) introduce data envelopment analysis (DEA) and show that bankrupt firms exhibit relatively lower operating efficiency. Shin et al. (2005) find that SVM is effective in predicting notable corporate events including bankruptcies and Chen et al. (2013) develop an adaptive fuzzy k-nearest neighbor method for insolvency prediction. Overall, prior literature has been successful in developing machine learning models that predict bankruptcies with considerable accuracy. However, few research focuses on improving the quality of input variables. Specifically, less effort has been made to produce precise semantic tone analysis with narrative disclosures.
2.2 Text classification
The most traditional method of text classification is the dictionary-based approach. The Harvard Psychological Dictionary is the most commonly used source in open domain text classification. Loughran and McDonald (2011) propose a dictionary specialized in the finance domain. However, dictionary-based approach has a limitation that it is difficult to create a dictionary that covers all the keywords needed for text classification and that the frequency of certain keywords does not necessarily contain sufficient information to classify sentences. Therefore, methods based on word embedding are suggested as alternatives.
Word embedding assigns a vector which encodes the meaning of the word to each text. Text classification methods based on word embedding include frequency-based methods as Tf-Idf (Salton and Buckley, 1988) and prediction-based embedding methods as Word2Vec (Mikolov et al., 2013). Word2vec, in particular, places each word in a vector space which approximates its semantic space. This algebraic transformation allows the vector operations among words. Therefore, we may set a word vector as the initial value of neural network and further classify sentences by exploring their contextual information. Kim et al. (2014) prove that CNN structure, combined with Word2Vec embedding, can be used to classify sentences.
Language models based on Recurrent Neural Network(RNN) (Liu et al., 2016) and its variations (Zhou et al., 2015; Wang et al., 2018) are also used on text classification. However, recently, Transformer-based language models as BERT (Devlin et al., 2018) and GPT-2(Radford et al., 2019) outperform RNN-based methods and have drawn attention with their performance in generic benchmarks. These models apply self-attention to generate contextualized embedding. Especially BERT, the origin of many SOTA (State–Of–The–Art) models, pre-trains contextual embedding model with masked LM tasks and sentence prediction tasks, and is then fine-tuned to be applied to downstream tasks.
2.3 Domain adaptation
In its early stage, domain adaptation takes a form of semi-supervised learnings. Semi-supervised domain adaptation is used when labeled data exists in the target domain but when its amount is not sufficient. For instance, Saenko et al. (2010) and Kulis et al. (2011) use metric learnings to solve domain shifts. In specific, they adopt methods to learn task-specific distance metrics with labeled data and assign labels to unlabeled data based on the learned distance.
However, in reality, we may not be able to find domains with labeled data. In such a case, unsupervised domain adaptation (UDA) can be an attractive alternative. The subspace-based methods consider both source and target domain a subspace of single domain space. On the other hand, a more popular approach in UDA is to consider source and target domain separate spaces and try to align the distributions of these. Some works first compare the mean of samples from each domain in Hilbert space and assign a weight to each sample of source domain (Gretton et al., 2012) or select samples in the source domain to minimize the maximum mean discrepancy of the two domains (Gong et al., 2013). But when source and target domains are significantly different, we may not expect these methods to perform well. To deal with this problem, other studies (Pan et al., 2010; Baktashmotlagh et al., 2013; Sun et al., 2016) map data from both domains to a latent space to deal with this problem.
Recently, with the advent of deep learning, feature extraction from raw data becomes an important process in every task. And the models that learn domain invariant features have become the mainstream in UDA (Ganin et al., 2016; Saito et al., 2018; Long et al., 2017). However, these methods require the data from the source domain to extract domain invariant features. Therefore, self-learning can be an alternative since the source domain data is not required in the setting. The most important consideration in self-learning is how to generate or filter accurate pseudo-labels. Kim et al. (2020) propose confidence-based filtering and similarity-based pseudo-labeling method in the image classification task. However, their methodology cannot be directly applied to NLP tasks since word embedding is more implicit and multidimensional than image features. Recently, Yoon et al. (2021) prove that fine-tuning the original model with pseudo-labels that are filtered based on confidence level increases accuracy in the target domain in the token classification task. To our best knowledge, our research is the first to show that self-learning without using samples from the source domain significantly improves model performance in sentence classification tasks.
3 Methodoloy
3.1 Sentiment analysis111For dictionary-based approach, we primarily utilize the following: https://github.com/rflugum/10K-MDA-Section. For the remainder, refer to our anonymized github: https://anonymous.4open.science/r/BankruptcyBert-CC19/
3.1.1 Dictionary-based approach
Loughran and McDonald (2011) develop word lists specifically suited for 10-K filings. They provide word lists that contain negative words and positive words, respectively. Following their methodology to calculate the tone of textual disclosures, we count the numbers of positive and negative words in each MD&A section and scale them by the number of total words in each section (DICTPOS and DICTNEG). Although the analysis provides value-relevant information, the measures are comparatively less accurate in that they do not consider context-specific tone of the texts. We calculate the tone variables with Python.
3.1.2 Word2Vec
Word2Vec is a prediction-based word embedding method which trains by predicting center words with context words (CBoW) or vice versa (Skip-Gram). After training, each word in a corpus corresponds one-on-one to a vector that contains its semantic information. Kim et al. (2014) achieve a remarkable performance on text classification by employing a structure with 1-layer convolutional neural network (CNN) and a fully connected output layer to classify sentences. This model takes pre-trained Word2Vec embedding as its input and the width of the filter in CNN equals the dimension of the word embedding. In our research, we replicate the CNN–static model of Kim et al. (2014) in which the Word2Vec model freezes during the training. We use Word2Vec weight trained on the 10-K corpus of 1996-2013 (Tsai et al., 2016), and train the network with the financial sentiment analysis dataset provided by Malo et al. (2014) which consists of 4,846 sentences. The model takes each sentence as input and assigns probability to each of three classes: positive, negative, and neutral. We sum the probabilities of all sentences in a document and normalize them to calculate the sentiment score of each document (W2VPOS and W2VNEG). We use nltk sentence tokenizer333https://www.nltk.org to split each document to sentences, gensim package444https://radimrehurek.com/gensim/ to load Word2Vec embedding, and Pytorch to implement CNN-based classifier. We use Cross-Entropy loss function and Adam optimizer. We train model for 60 epochs, with batch size 50. We set sentence length to 50 words in both training phase and inference phase.
3.1.3 BERT
BERT is a pre-trained language model with bidirectional transformers, which can be applied to downstream tasks after supervised fine-tuning with relatively low resources. We utilize the model structure based on the original BERT model (Devlin et al., 2018) and the fine-tuned weight of Fin-BERT (Araci, 2019) trained for financial sentiment analysis. Fin-BERT is pre-trained on the subset of Reuters TRC2 dataset which includes financial press articles and fine-tuned on the financial sentiment analysis dataset provided by Malo et al. (2014), which is identical to the dataset that we use to train the network of Word2Vec model. Similarly, the model takes each sentence as its input and assigns probability to each of three classes: positive, negative, and neutral. We sum the probabilities of all sentences in a document and normalize them to calculate the sentiment score of each document (BERTPOS and BERTNEG). Similarly, we use nltk sentence tokenizer and Huggingface Transformers package555https://huggingface.co with Pytorch to implement BERT. We set max sentence length to 512, which is the max length limit of BERT.
3.1.4 Unsupervised domain adaptation
We apply self-learning, one of the unsupervised domain-adaptation methods, to our BERT-based model. The self-learning procedure follows the three-step approach. First, we generate pseudo-labels with sentences from MD&A sections. Then we filter out “reliable” samples based on the self-confidence of the sentences. Since it is well known that erroneous labels may deteriorate the performance of the models, we filter the samples with high self-confidence. Specifically, we proxy for self-confidence with self-entropy (Zou et al., 2018; Saporta et al., 2020), Lastly, we perform supervised learning using the newly-obtained pseudo labels. Refer to Figure 1 for visual representation of the algorithm. We use the following equation to calculate self-entropy:
,where denotes each sentence and denotes the probability that belongs to class (). Here, we calculate with the BERT-based classification model that we use in section 3.1.3. Then we normalize the self-entropy by scaling the value with , which is the natural logarithm of the number of labels (here, ). We define three classes 0, 1, and 2. Each class represents positive, negative, or neutral, respectively.
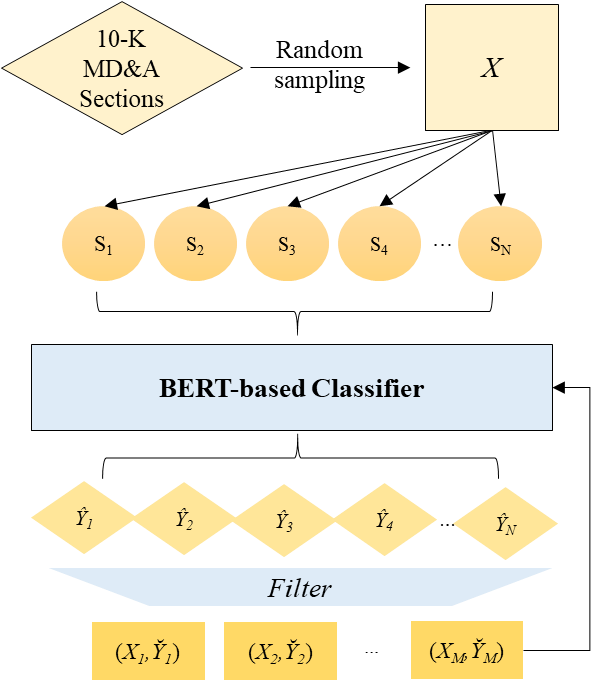
We obtain 59,389 cleansed MD&A filings merged with financial variables. Then we generate pseudo-labels by randomly picking 1,200 documents and doing inference on all sentences in the documents. In specific, we collect and analyze 589,858 distinct sentences. Next, we filter the results with the threshold of self-entropy 0.2 and discard the observations with self-entropy over 0.2. We obtain 38,703 reliable sentences through this process (6.56% of the sentence domain). We train the model for 2 epochs with batch size 32 and set the learning rate to be . We use Cross-Entropy loss and Adam optimizer. After training the model, the inference follows the same procedures as the previous two models and we generate sentiment variables DAPTPOS and DAPTNEG.
3.2 Classification model
We implement three basic machine-learning based classifiers (hazard time-discrete logistic model, SVM, and kNN) to evaluate the additional informativeness of textual data. Since models as DNN or RNN achieve state-of-the-art prediction accuracy only with financial variables, it is difficult to show the effect of adding textual variables. Therefore, we compare the relative performance of the baseline classifiers to highlight the incremental prediction accuracy from adding BERT-based sentiment variables.
3.2.1 Hazard model
We use proportional hazards model (Fine and Gray, 1999) to calculate prediction accuracy. Shumway (2001) finds that maximum log-likelihood estimation of discrete-time logistic regression yields consistent estimates. In specific, we estimate the following discrete-time logistic regression with maximum-likelihood estimation:
refers to the risk of bankruptcy for firm at time . refers to a vector of firm at time that consists of variables that are known to precede bankruptcies. In our study includes financial variables and MD&A sentiments. Specifically, we first run the regression with only financial variables (FIN). Then we add dictionary-based variables (FIN, DICTPOS, and DICTNEG), Word2Vec-based variables (FIN, W2VPOS, and W2VNEG), BERT-based variables (FIN, BERTPOS, and BERTNEG), and domain-adapted BERT-based variables (FIN, DAPTPOS, and DAPTNEG), respectively. Using the obtained coefficients, we calculate the fitted values of () and classify the observation to be bankrupt if and non-bankrupt otherwise. Continuous variables are winsorized at 1% level to minimize the effect of outliers on regression results.
3.2.2 k-Nearest Neighbors and Support Vector Machine
To further enhance the classification performance, we employ k-nearest neighbors (kNN) and Support Vector Machine (SVM) algorithms, following prior literature.
kNN is a simple non-parametric classification method. First, we calculate the Euclidean distance between any two pair of observations. That is for observation vectors and , we compute
, where denotes the inner product of the two vectors. Specifically, in our research, vector includes variables that precede insolvencies. We start from five financial variables and sequentially include sentiment variables calculated using different sentiment analysis models. Then, the algorithm computes the distances between observation which belongs to the test set and all other observations that belong to the train set. Next, it chooses smallest distances from the observation and label the distances. In our research, we set . The algorithm classifies to be bankrupt if the number of bankrupt labels is greater than the number of non-bankrupt labels.
Next, SVM aims at finding a hyperplane that divides the dataset into distinct categories with the largest margin. Let be a training data and two classes are labeled with as either +1 or -1. We solve the following minimization problem with respect to hyperplane :
,where . Here, denotes a slack variable and is a regularization parameter. In our setting, we set . Further, we choose linear kernel for SVM classification. Linear kernel reduces the cost of computation but yields comparatively less accurate results. In our sample, univariate analysis results in section 4.1 indicate that linear kernel is acceptable to classify the dataset. We choose the most basic models of kNN and SVM since the primary purpose of our research is to compare the relative performance of text sentiment classification models.
3.3 Accuracy calculation
We report two distinct accuracy measures to compare the performance of our models. A1 is the ratio of the number of observations that are classified as non-bankrupt (CNB) under each model to the number of total non-bankrupt (NB) observations (A1 = CNB/NB). On the other hand, A2 is the ratio of the number of observations that are classified as bankrupt (CB) under each model to the number of total bankrupt observations (B) (A2 = CB/B).
For hazard model, we also report adjusted R-square (Nagelkerke et al., 1991; Cox and Snell, 2018).
and refer to the maximum log likelihoods of the fitted model and null model containing only the intercept term, respectively. Then, the equation can be rewritten as
| BRUPT=1 | BRUPT=0 | Difference (t-stat) | |
| (1) | (2) | (1) - (2) | |
| WC | -0.5558 | 0.2091 | -0.7649*** |
| (-3.91) | |||
| RE | -0.3977 | 0.0450 | -0.4427*** |
| (-3.47) | |||
| SALE | 1.0161 | 0.9607 | 0.0554** |
| (2.15) | |||
| MVE | 1.8010 | 10.3129 | -8.5119*** |
| (-8.83) | |||
| EBIT | -0.7172 | 0.4907 | -1.2079*** |
| (-3.17) | |||
| DICTPOS | 0.0069 | 0.0072 | -0.0003*** |
| (-3.36) | |||
| DICTNEG | 0.0182 | 0.0136 | 0.0046*** |
| (17.79) | |||
| W2VPOS | 0.3786 | 0.4042 | -0.0256*** |
| (-5.53) | |||
| W2VNEG | 0.0969 | 0.0558 | 0.0411*** |
| (3.21) | |||
| BERTPOS | 0.1833 | 0.2257 | -0.0424*** |
| (-12.04) | |||
| BERTNEG | 0.2433 | 0.2140 | 0.0293*** |
| (9.41) | |||
| DAPTPOS | 0.1421 | 0.2362 | -0.0941*** |
| (-13.21) | |||
| DAPTNEG | 0.3512 | 0.1528 | 0.1984*** |
| (10.55) | |||
| n | 520 | 58,867 |
4 Empirical Experiments
4.1 Data
We first identify bankrupt firm-years from Compustat. The dataset provides us with the dates when firms file for bankruptcy and the dates when the bankruptcy procedure is complete. In our analysis, we use the dates when firms first file for bankruptcy as bankruptcy years. Then, following Altman (1968) and Mayew et al. (2015), we compute five key financial variables that are known to precede bankruptcies (WC, RE, EBITDA, MVE, and SALE). WC refers to the ratio of working capital to total asset. RE refers to retained earnings to total liability. EBITDA refers to earnings before interest, tax, depreciation, and amortization scaled by total asset. MVE is the market value of equity scaled by total liability. SALE is the ratio of sales revenue to total asset.
| Hazard Model | kNN-5 | Linear SVM | |||||
| Vars | R2 | A1 | A2 | A1 | A2 | A1 | A2 |
| FIN | 16.23% | 68.20% | 52.23% | 63.88% | 53.99% | 66.83% | 65.82% |
| (0.06) | (0.05) | (0.03) | (0.03) | ||||
| FIN+DICT | 21.33% | 70.25% | 54.55% | 72.01% | 66.98% | 85.11% | 73.28% |
| (0.03) | (0.03) | (0.05) | (0.06) | ||||
| FIN+W2V | 23.51% | 72.39% | 55.23% | 76.75% | 70.93% | 83.20% | 76.73% |
| (0.05) | (0.04) | (0.02) | (0.04) | ||||
| FIN+BERT | 24.83% | 85.44% | 62.00% | 81.73% | 80.32% | 89.98% | 85.20% |
| (0.05) | (0.05) | (0.03) | (0.06) | ||||
| FIN+DAPT | 26.38% | 86.12% | 66.12% | 83.22% | 85.08% | 93.26% | 91.56% |
| (0.06) | (0.04) | (0.04) | (0.02) | ||||
Next, we construct our main variables by extracting MD&A sections from annual reports. Specifically, we inspect 10-K, 10-KSB, 10-K405, and 10KSB40 filings and search for MD&A sections (Item 6 or Item 7). During the collection process, we exclude html notations, tables, and page numbers. This process ensures that we analyze only the textual components from MD&A sections. Our sample period spans from 1995 to 2020 since SEC started to require firms to disclose electronic (machine-readable) filings from 1995. BRUPT is an indicator variable that equals one for observations that face bankruptcy within 365 days from their issuance of annual report, and zero otherwise. We require all financial variables and MD&A section texts for each observation and obtain 59,389 distinct observations. Among the sample, we identify 520 bankrupt firm-year observations (BRUPT=1). We acquire financial data from Compustat database and filing texts from SEC archive.
To evaluate the performance of SVM and kNN models, we split the sample into three subsets: 60% assigned to train set, 20% to validation set, and 20% to test set. However, since the data that we use is panel, randomly assigning 20% of the sample to the test set may bias our results. That is, the model may learn from future information and use it to predict the same future. To mitigate this concern, we implement time-based split. That is, we choose 104 latest bankruptcy observations from 2018 to 2020 and randomly choose 104 non-bankruptcy observations from the same time period. To further ensure that our results are not driven by random sample selection, we repeat the selection procedure 100 times and report the average accuracy with its standard deviation.
In SVM, we test 10 different hyperparameters ranging from 0 to 1 and compare their relative performances. Next, for kNN model, we experiment five different hyperparameters (). Since the model follows the majority rule, we examine odd parameters 3, 5, 7, 9, and 11. We then set the regularization parameter in SVM to be and the number of nearest neighbors to be 5.
4.2 Results
To ensure that the selected variables move in accordance with BRUPT, we report the univariate analysis results depending on the variable BRUPT (See Table 1).
As evidenced by Altman (1968) and other prior studies, we find higher WC, RE, MVE, and EBIT, and lower SALE for non-bankrupt firms. Further, we demonstrate that DICTNEG, W2VNEG, BERTNEG, and DAPTNEG are higher for bankrupt firms and DICTPOS, W2VPOS, BERTPOS, and DAPTPOS are higher for non-bankrupt firms. This confirms that managers are likely to disclose negative-tone MD&A sections before imminent bankruptcies. More importantly, untabulated tests including quadratic terms do not find any evidence that there exists non-linear relationship between BRUPT and other independent variables. Taken together, univariate analysis results imply that we may choose linear kernel for SVM classification.
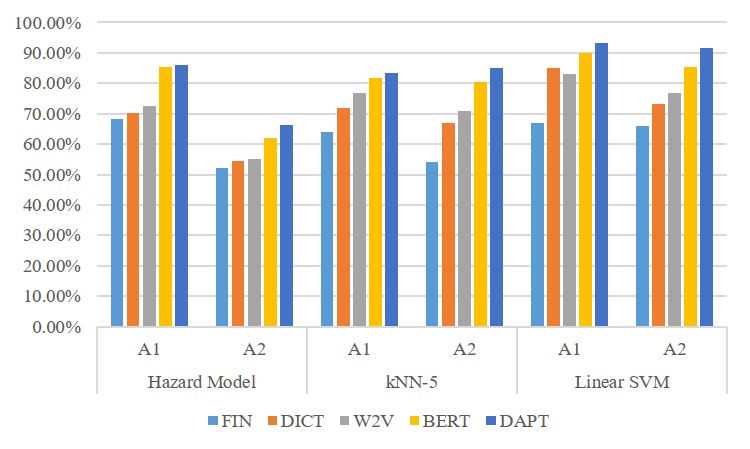
Table 2 and Figure 2 report the relative performance of the models. Consistent with the prior literature (Zhou et al., 2012; Wu et al., 2007), SVM generally performs the best among the three classifiers. Also, A1 is generally higher than A2 in all model specifications, implying that the models generally predict non-bankrupt firms more accurately than bankrupt firms.
Our main finding is that BERT-based analysis outperforms dictionary-based analysis and Word2Vec-based analysis. This indicates that context-specific sentiment analysis produces more accurate tone of the texts than non-context specific methods. Specifically, SVM with BERT-based sentiment variables display the bankruptcy prediction accuracy (A2) of 85.20%. Further, we observe that R-square increases as we proceed from analyzing only financial variables (16.23%) to including domain-adapted BERT-based sentiment variables (26.38%). Comparing this result with prior literature that utilizes SVM to predict corporate bankruptcies, we obtain relatively high accuracy. For instance, Zhou et al. (2012) obtain the accuracy rate of approximately 75% by analyzing financial variables with DSSVM and GASVM models. Taken together, our results imply that textual information has predictive ability which is orthogonal to the existing set of financial variables and that adding high-quality textual information in the classifiers significantly improves the prediction accuracy.
Next, we also find that domain-adaptation further improves prediction accuracy. Domain-adapted BERT-based analysis yields the best accuracy rate (A2) of 91.56% with linear SVM classifier among the models. These results strongly indicate that context-specific sentiment analysis of corporate disclosure texts provides more value-relevant information.
5 Conclusion
In our study, we examine whether context-specific textual sentiment analysis (BERT) improves the accuracy of corporate bankruptcy prediction. We utilize five financial variables calculated from the stock market and annual reports that are known to precede impending insolvencies. Further, we collect and examine a large sample of MD&A narrative disclosures from 1995 to 2020 to test whether textual sentiment is helpful in predicting financial distress. We find that textual sentiment has additional predictive ability to well-known financial variables. Most importantly, we show that BERT-based analysis outperforms dictionary-based analysis suggested by Loughran and McDonald (2011) and Word2Vec-based analysis combined with convolutional neural network. Further, we acknowledge the domain shifting problem of current BERT model. To assuage such a limitation, we perform domain-adaptation to the existing financial BERT model. This approach reduces computational costs compared to pre-training the BERT model with a new corpus and, at the same time, significantly improves the prediction accuracy.
6 Acknowledgement
The authors deeply appreciate helpful comments from Bok Baik and Yang Hoon Kim. Further, the authors appreciate the GPU support from Artificial Society.
References
- Altman (1968) Edward I Altman. 1968. Financial ratios, discriminant analysis and the prediction of corporate bankruptcy. The journal of finance, 23(4):589–609.
- Araci (2019) Dogu Araci. 2019. Finbert: Financial sentiment analysis with pre-trained language models. arXiv preprint arXiv:1908.10063.
- Baktashmotlagh et al. (2013) Mahsa Baktashmotlagh, Mehrtash T Harandi, Brian C Lovell, and Mathieu Salzmann. 2013. Unsupervised domain adaptation by domain invariant projection. In Proceedings of the IEEE International Conference on Computer Vision, pages 769–776.
- Bartov et al. (2000) Eli Bartov, Suresh Radhakrishnan, and Itzhak Krinsky. 2000. Investor sophistication and patterns in stock returns after earnings announcements. The Accounting Review, 75(1):43–63.
- Beltagy et al. (2019) Iz Beltagy, Kyle Lo, and Arman Cohan. 2019. Scibert: A pretrained language model for scientific text. arXiv preprint arXiv:1903.10676.
- Bharath and Shumway (2008) Sreedhar T Bharath and Tyler Shumway. 2008. Forecasting default with the merton distance to default model. The Review of Financial Studies, 21(3):1339–1369.
- Cecchini et al. (2010) Mark Cecchini, Haldun Aytug, Gary J Koehler, and Praveen Pathak. 2010. Detecting management fraud in public companies. Management Science, 56(7):1146–1160.
- Chen et al. (2013) Hui-Ling Chen, Chang-Cheng Huang, Xin-Gang Yu, Xin Xu, Xin Sun, Gang Wang, and Su-Jing Wang. 2013. An efficient diagnosis system for detection of parkinson’s disease using fuzzy k-nearest neighbor approach. Expert systems with applications, 40(1):263–271.
- Cox and Snell (2018) David Roxbee Cox and E Joyce Snell. 2018. Analysis of binary data. Routledge.
- Devlin et al. (2018) Jacob Devlin, Ming-Wei Chang, Kenton Lee, and Kristina Toutanova. 2018. Bert: Pre-training of deep bidirectional transformers for language understanding. arXiv preprint arXiv:1810.04805.
- Ding et al. (2012) A Adam Ding, Shaonan Tian, Yan Yu, and Hui Guo. 2012. A class of discrete transformation survival models with application to default probability prediction. Journal of the American Statistical Association, 107(499):990–1003.
- Dwyer et al. (2004) Douglas W Dwyer, Ahmet E Kocagil, and Roger M Stein. 2004. Moody’s kmv riskcalc v3. 1 model. White paper, Moody’s, https://www. moodys. com/sites/products/ProductAttachments/RiskCalc, 203.
- Fine and Gray (1999) Jason P Fine and Robert J Gray. 1999. A proportional hazards model for the subdistribution of a competing risk. Journal of the American statistical association, 94(446):496–509.
- Ganin et al. (2016) Yaroslav Ganin, Evgeniya Ustinova, Hana Ajakan, Pascal Germain, Hugo Larochelle, François Laviolette, Mario Marchand, and Victor Lempitsky. 2016. Domain-adversarial training of neural networks. The journal of machine learning research, 17(1):2096–2030.
- Glorot et al. (2011) Xavier Glorot, Antoine Bordes, and Yoshua Bengio. 2011. Domain adaptation for large-scale sentiment classification: A deep learning approach. In ICML.
- Gong et al. (2013) Boqing Gong, Kristen Grauman, and Fei Sha. 2013. Connecting the dots with landmarks: Discriminatively learning domain-invariant features for unsupervised domain adaptation. In International Conference on Machine Learning, pages 222–230. PMLR.
- Gretton et al. (2012) Arthur Gretton, Karsten M Borgwardt, Malte J Rasch, Bernhard Schölkopf, and Alexander Smola. 2012. A kernel two-sample test. The Journal of Machine Learning Research, 13(1):723–773.
- Jung and Kwon (1988) Woon-Oh Jung and Young K Kwon. 1988. Disclosure when the market is unsure of information endowment of managers. Journal of Accounting research, pages 146–153.
- Kim et al. (2014) Kwanho Kim, Beom-suk Chung, Yerim Choi, Seungjun Lee, Jae-Yoon Jung, and Jonghun Park. 2014. Language independent semantic kernels for short-text classification. Expert Systems with Applications, 41(2):735–743.
- Kim et al. (2020) Youngeun Kim, Sungeun Hong, Seunghan Yang, Sungil Kang, Yunho Jeon, and Jiwon Kim. 2020. Associative partial domain adaptation. arXiv preprint arXiv:2008.03111.
- Kulis et al. (2011) Brian Kulis, Kate Saenko, and Trevor Darrell. 2011. What you saw is not what you get: Domain adaptation using asymmetric kernel transforms. In CVPR 2011, pages 1785–1792. IEEE.
- Kundu et al. (2020) Jogendra Nath Kundu, Naveen Venkat, R Venkatesh Babu, et al. 2020. Universal source-free domain adaptation. In Proceedings of the IEEE/CVF Conference on Computer Vision and Pattern Recognition, pages 4544–4553.
- Lai et al. (2017) Guokun Lai, Qizhe Xie, Hanxiao Liu, Yiming Yang, and Eduard Hovy. 2017. Race: Large-scale reading comprehension dataset from examinations. arXiv preprint arXiv:1704.04683.
- Lee et al. (2020) Jinhyuk Lee, Wonjin Yoon, Sungdong Kim, Donghyeon Kim, Sunkyu Kim, Chan Ho So, and Jaewoo Kang. 2020. Biobert: a pre-trained biomedical language representation model for biomedical text mining. Bioinformatics, 36(4):1234–1240.
- Li (2008) Feng Li. 2008. Annual report readability, current earnings, and earnings persistence. Journal of Accounting and economics, 45(2-3):221–247.
- Li (2010) Feng Li. 2010. Textual analysis of corporate disclosures: A survey of the literature. Journal of accounting literature, 29(1):143–165.
- Liu et al. (2016) Pengfei Liu, Xipeng Qiu, and Xuanjing Huang. 2016. Recurrent neural network for text classification with multi-task learning. In Proceedings of the Twenty-Fifth International Joint Conference on Artificial Intelligence (IJCAI-16), pages 2873–2879.
- Long et al. (2017) Mingsheng Long, Zhangjie Cao, Jianmin Wang, and Michael I Jordan. 2017. Conditional adversarial domain adaptation. arXiv preprint arXiv:1705.10667.
- Loughran and McDonald (2011) Tim Loughran and Bill McDonald. 2011. When is a liability not a liability? textual analysis, dictionaries, and 10-ks. The Journal of finance, 66(1):35–65.
- Malo et al. (2014) Pekka Malo, Ankur Sinha, Pekka Korhonen, Jyrki Wallenius, and Pyry Takala. 2014. Good debt or bad debt: Detecting semantic orientations in economic texts. Journal of the Association for Information Science and Technology, 65(4):782–796.
- Mayew et al. (2015) William J Mayew, Mani Sethuraman, and Mohan Venkatachalam. 2015. Md&a disclosure and the firm’s ability to continue as a going concern. The Accounting Review, 90(4):1621–1651.
- Mikolov et al. (2013) Tomas Mikolov, Kai Chen, Greg Corrado, and Jeffrey Dean. 2013. Efficient estimation of word representations in vector space. arXiv preprint arXiv:1301.3781.
- Nagelkerke et al. (1991) Nico JD Nagelkerke et al. 1991. A note on a general definition of the coefficient of determination. Biometrika, 78(3):691–692.
- Pan et al. (2010) Sinno Jialin Pan, Ivor W Tsang, James T Kwok, and Qiang Yang. 2010. Domain adaptation via transfer component analysis. IEEE transactions on neural networks, 22(2):199–210.
- Premachandra et al. (2011) Inguruwatt M Premachandra, Yao Chen, and John Watson. 2011. Dea as a tool for predicting corporate failure and success: A case of bankruptcy assessment. Omega, 39(6):620–626.
- Radford et al. (2019) A Radford, J Wu, R Child, D Luan, D Amodei, and I Sutskever. 2019. Language models are unsupervised multitask learners.
- Rajpurkar et al. (2016) Pranav Rajpurkar, Jian Zhang, Konstantin Lopyrev, and Percy Liang. 2016. Squad: 100,000+ questions for machine comprehension of text. arXiv preprint arXiv:1606.05250.
- Saenko et al. (2010) Kate Saenko, Brian Kulis, Mario Fritz, and Trevor Darrell. 2010. Adapting visual category models to new domains. In European conference on computer vision, pages 213–226. Springer.
- Saito et al. (2018) Kuniaki Saito, Kohei Watanabe, Yoshitaka Ushiku, and Tatsuya Harada. 2018. Maximum classifier discrepancy for unsupervised domain adaptation. In Proceedings of the IEEE conference on computer vision and pattern recognition, pages 3723–3732.
- Salton and Buckley (1988) Gerard Salton and Christopher Buckley. 1988. Term-weighting approaches in automatic text retrieval. Information processing & management, 24(5):513–523.
- Saporta et al. (2020) Antoine Saporta, Tuan-Hung Vu, Matthieu Cord, and Patrick Pérez. 2020. Esl: Entropy-guided self-supervised learning for domain adaptation in semantic segmentation. arXiv preprint arXiv:2006.08658.
- Shimodaira (2000) Hidetoshi Shimodaira. 2000. Improving predictive inference under covariate shift by weighting the log-likelihood function. Journal of statistical planning and inference, 90(2):227–244.
- Shin et al. (2005) Kyung-Shik Shin, Taik Soo Lee, and Hyun-jung Kim. 2005. An application of support vector machines in bankruptcy prediction model. Expert systems with applications, 28(1):127–135.
- Shumway (2001) Tyler Shumway. 2001. Forecasting bankruptcy more accurately: A simple hazard model. The journal of business, 74(1):101–124.
- Sun et al. (2016) Baochen Sun, Jiashi Feng, and Kate Saenko. 2016. Return of frustratingly easy domain adaptation. In Proceedings of the AAAI Conference on Artificial Intelligence, volume 30.
- Tennyson et al. (1990) B Mack Tennyson, Robert W Ingram, and Michael T Dugan. 1990. Assessing the information content of narrative disclosures in explaining bankruptcy. Journal of Business Finance & Accounting, 17(3):391–410.
- Tetlock et al. (2008) Paul C Tetlock, Maytal Saar-Tsechansky, and Sofus Macskassy. 2008. More than words: Quantifying language to measure firms’ fundamentals. The journal of finance, 63(3):1437–1467.
- Tian et al. (2015) Shaonan Tian, Yan Yu, and Hui Guo. 2015. Variable selection and corporate bankruptcy forecasts. Journal of Banking & Finance, 52:89–100.
- Tsai et al. (2016) Ming-Feng Tsai, Chuan-Ju Wang, and Po-Chuan Chien. 2016. Discovering finance keywords via continuous-space language models. ACM Transactions on Management Information Systems (TMIS), 7(3):1–17.
- Vaswani et al. (2017) Ashish Vaswani, Noam Shazeer, Niki Parmar, Jakob Uszkoreit, Llion Jones, Aidan N Gomez, Łukasz Kaiser, and Illia Polosukhin. 2017. Attention is all you need. In Advances in neural information processing systems, pages 5998–6008.
- Wang et al. (2018) Alex Wang, Amanpreet Singh, Julian Michael, Felix Hill, Omer Levy, and Samuel R Bowman. 2018. Glue: A multi-task benchmark and analysis platform for natural language understanding. arXiv preprint arXiv:1804.07461.
- Wilson and Sharda (1994) Rick L Wilson and Ramesh Sharda. 1994. Bankruptcy prediction using neural networks. Decision support systems, 11(5):545–557.
- Wu et al. (2007) Chih-Hung Wu, Gwo-Hshiung Tzeng, Yeong-Jia Goo, and Wen-Chang Fang. 2007. A real-valued genetic algorithm to optimize the parameters of support vector machine for predicting bankruptcy. Expert systems with applications, 32(2):397–408.
- Yoon et al. (2021) Sangwon Yoon, Yanghoon Kim, and Kyomin Jung. 2021. Self-adapter at semeval-2021 task 10: Entropy-based pseudo-labeler for source-free domain adaptation. Proceedings of the 15th International Workshop on Semantic Evaluation.
- Zhou et al. (2015) Chunting Zhou, Chonglin Sun, Zhiyuan Liu, and C.M. Francis Lau. 2015. A c-lstm neural network for text classification. CoRR.
- Zhou et al. (2012) Jian Zhou, Xibing Li, and Xiuzhi Shi. 2012. Long-term prediction model of rockburst in underground openings using heuristic algorithms and support vector machines. Safety science, 50(4):629–644.
- Zou et al. (2018) Yang Zou, Zhiding Yu, BVK Kumar, and Jinsong Wang. 2018. Unsupervised domain adaptation for semantic segmentation via class-balanced self-training. In Proceedings of the European conference on computer vision (ECCV), pages 289–305.
Appendix A Sample MD&A
The following is an excerpt from an MD&A section of 10-K report of Learning Tree International, disclosed on September 30, 1996. Learning Tree International filed a bankruptcy in 1997.
In response to the continued strength in enrollments, the Company has further accelerated its development of new course titles, expanded its future direct mailing plans to capture additional market share and has taken steps to expand the number of classrooms in its education centers. However, there can be no assurance that the Company will be able to achieve an increase in market share after making such expenditures or will maintain its growth in revenues, profitability or market share in the future.
Positive words are colored in RED and negative words are colored in BLUE. Humans can interpret that this document conveys negative implication. However, there are 1 negative word and 4 positive words according to Loughran and McDonald (2011) word lists. In contrast, BERT-based sentiment vector of the paragraph equals (1.0365, 2.2161, 1.1704). Normalization yields BERTPOS = 0.2343 and BERTNEG = 0.5000. Therefore, BERT-based analysis outperforms the traditional dictionary-based approach.