∎
22email: [email protected]
Condensation and extremes for a fluctuating number of independent random variables
Abstract
We address the question of condensation and extremes for three classes of intimately related stochastic processes: (a) random allocation models and zero-range processes, (b) tied-down renewal processes, (c) free renewal processes. While for the former class the number of components of the system is fixed, for the two other classes it is a fluctuating quantity. Studies of these topics are scattered in the literature and usually dressed up in other clothing. We give a stripped-down account of the subject in the language of sums of independent random variables in order to free ourselves of the consideration of particular models and highlight the essentials. Besides giving a unified presentation of the theory, this work investigates facets so far unexplored in previous studies. Specifically, we show how the study of the class of random allocation models and zero-range processes can serve as a backdrop for the study of the two other classes of processes central to the present work—tied-down and free renewal processes. We then present new insights on the extreme value statistics of these three classes of processes which allow a deeper understanding of the mechanism of condensation and the quantitative analysis of the fluctuations of the condensate.
Keywords:
Condensationextremesrenewal processeszero-range processessubexponentiality1 Introduction
It is well known that independent and identically distributed (iid) positive random variables conditioned by an atypical value of their sum exhibit the phenomenon of condensation, whereby one of the summands dominates upon the others, when their common distribution is subexponential (decaying more slowly than an exponential at large values of its argument).
Let be these random variables, henceforth taken discrete with positive integer values, whose common distribution is denoted by . Hereafter we consider the particular case of a subexponential distribution with asymptotic power-law decay111 In the further course of this work, the symbol stands for asymptotic equivalence; the symbol means either ‘of the order of’, or ‘with exponential accuracy’, depending on the context.
| (1.1) |
where the index and the tail parameter are both positive. Assume—for the time being—that the first moment is finite (hence ) and that the sum of these random variables,
| (1.2) |
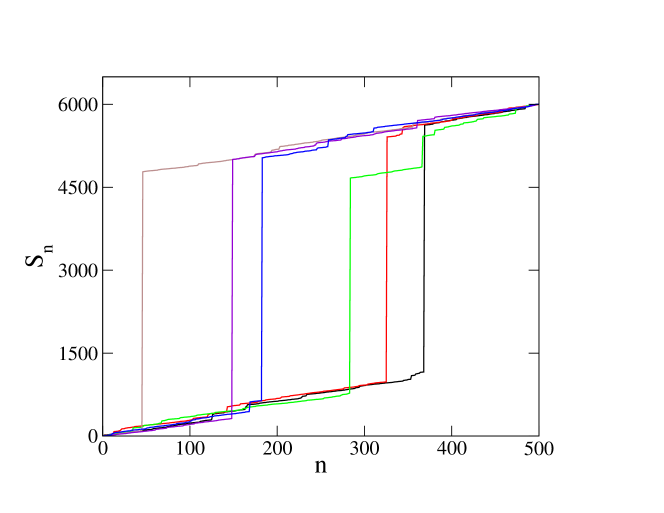
is conditioned to take the atypically large value . In the present context the phenomenon of condensation has a simple pictorial representation. Let us consider the partial sums as the successive positions of a random walk whose steps are the summands . Such a representation is used in figure 1, which depicts six different paths of this walk, conditioned by a large, atypical value of its final position after steps. The steps have distribution (1.1) with (see the caption for details). As can be seen on this figure, for most of the paths there is a single big step bearing the excess difference . In the thermodynamic limit, , with fixed, the distribution of the size of this big step becomes narrow around . This picture gives the gist of the phenomenon of condensation.
The two ingredients responsible for such a phenomenon are: (i) subexponentiality of the distribution , and: (ii) conditioning by an atypically large value of the sum . In contrast, keeping the same distribution (1.1), but conditioning the sum to be less than or equal to , yields a ‘democratic’ situation where all the steps are on the same footing, sharing the—now negative—excess difference . Otherwise stated, in this situation, the path responds ‘elastically’ to the conditioning.
When the distribution is decaying exponentially (e.g., a geometric distribution) the paths responds ‘elastically’ in all cases, i.e., regardless of whether the sum is conditioned to take an atypical value larger or smaller than . In both cases all the steps are on the same footing, sharing the excess difference (which is now either positive or negative).
This scenario of condensation has been investigated in great detail and is basically understood. It is for example encountered in random allocation models where sites (or boxes) contain altogether particles, the representing the occupations of these sites burda ; burda2 ; janson . This situation in turn accounts for the stationary state of dynamical urn models such as zero range processes (zrp) or variants spitzer ; andjel ; camia ; evans2000 ; jeon ; gl2002 ; cg2003 ; gross ; hanney ; gl2005 ; lux ; maj2 ; ferrari ; maj3 ; armendariz2009 ; armendariz2011 ; armendariz2013 ; armendariz2017 ; cg2019 . For short we shall refer to this class of models as the class of random allocation models and zrp. Condensation means that one of the sites contains a macroscopic fraction of all the particles.

Here we shall be concerned by a different situation where the number of random variables is itself a random variable, henceforth denoted by and defined by conditioning the sum,
| (1.3) |
to satisfy either the inequality
| (1.4) |
or the equality
| (1.5) |
where is a given positive integer number, see figure 2. These conditions are imposed irrespectively of whether the mean is finite or not.
The process conditioned by the inequality (1.4) defines a free renewal process feller ; doob ; smith ; cox , the process conditioned by the equality (1.5) defines a tied-down renewal process wendel ; wendel1 ; wendel2 . In the former case the process is pinned at the origin, in the latter case it is also pinned at the end point. For both, the random variables are the sizes of the iid (spatial or temporal) intervals between two renewals. Using the temporal language, the sum is the time of occurrence of the last renewal before or at time . The last, unfinished, interval is known as the backward recurrence time in renewal theory. Tied-down renewal processes (tdrp) are special because the pinning condition (1.5) imposes .
A simple implementation of a tdrp is provided by the Bernoulli bridge, or tied-down random walk, made of steps, starting from the origin and ending at the origin at time wendel ; wendel1 ; labarbe . The sizes of the intervals between the successive passages by the origin of the walk (where each tick mark on the axis represents two units of time) represent the random variables , as depicted in figure 3. The continuum limit of the tied-down random walk is the Brownian bridge, also known as tied-down Brownian motion or else pinned Brownian motion verv .

For renewal processes (both free or tied-down) with a subexponential distribution , we shall show that, by weighting the configurations according to the number of summands, a phase transition occurs, as , when the positive weight parameter conjugate to , varies from larger values, favouring configurations with a large number of summands, to smaller ones, favouring atypical configurations with a smaller number of summands. In the former case the weight parameter is to be interpreted as a reward, in the latter case as a penalty.
Characterising this transition is the aim of the present work, with main focus on the quantitative analysis of the fluctuations of the condensate. Again, the occurrence of the phenomenon of condensation is due to: (i) subexponentiality of the distribution , and: (ii) atypicality of the configurations.
Tied-down renewal processes fall into the class of linear systems considered by Fisher fisher . The latter are defined as one-dimensional chains of total length , made up, e.g., of alternating intervals of two kinds, and . This class encompasses the Poland-Scheraga model poland ; poland2 , consisting of an alternating sequence of straight paths and loops , wetting models, where and represent two phases, etc. If the direction of the chain is taken as a time axis, the loops in the perpendicular direction can be seen as random walks. The Bernoulli bridge or tied-down random walk of figure 3 is a natural implementation of this situation, where there is only one kind of intervals, say the loops , representing the intervals between two passages at the origin of the walk. In the same vein, a variant of the random allocation model defined in burda considers the case where the number of sites is varying burda3 , with an occupation variable starting at . This model, as well as the spin domain model considered in bar2 ; bar3 ; barma are examples of linear systems with only one kind of intervals. Both models are actually equivalent and are just particular instances of the tdrp considered in the present work. Let us finally mention the random walk (or polymer) models considered in gia1 ; gia2 which are free or tied-down renewal processes with a penalty (or reward) at each renewal events, as in the present work. In these models the condensation transition is interpreted as the transition between a localised phase and a delocalised one gia1 ; gia2 . For the example of figure 3, a localised configuration corresponds to many contacts of the walk with the origin, while a delocalised one corresponds to the presence of a macroscopic excursion.
Renewal theory is a classic in probability studies. It is also ubiquitous in statistical physics and has a wide range of applicability (see examples in gl2001 ; gms2015 ; cohen ; barkai2003 ). Yet, besides gia1 ; gia2 , which give rigorous mathematical results, studies of weighted free renewal processes are scarce. In particular, there are no available detailed characterisation of the condensation phenomenon for these processes in the existing literature, nor considerations on the statistics of extremes in the condensed phase.
We now describe the organisation of the paper, with further details on the literature on the subject.
The text is composed of three parts, which are respectively sections 2 and 3, dealing with the class of random allocation models and zrp, sections 4 to 8, dealing with tdrp, and finally, sections 9 to 11, dealing with free renewal processes. These three parts are both conceptually and analytically related.
Section 2 is a short presentation of how condensation arises for random allocation models and zrp. Subsection 2.1 gives the basic formalism. Equation (2.20) introduces a simple remark on the distribution of the maximum in the second half (), which will turn out to be instrumental in section 3, and which will be generalised in the later sections on renewal processes. Subsection 2.2 summarises the main features of the phenomenon of condensation in the thermodynamic limit. This classical topic has been much investigated in the past, both in statistical physics burda ; burda2 ; camia ; evans2000 ; gl2002 ; cg2003 ; gross ; hanney ; gl2005 ; lux ; maj2 ; maj3 and in mathematics jeon ; ferrari ; armendariz2009 ; armendariz2011 ; armendariz2013 ; armendariz2017 ; landim . The summary given in this section relies on the short review cg2019 to which we refer the reader for further bibliographical references. A mathematical review of a number of aspects of the subject and related matters can be found in janson .
Section 3, which will serve as a backdrop for the study contained in the two other parts, contains novel aspects of the phenomenon of condensation for the class of models at hand. Namely, instead of considering the thermodynamic limit , with fixed ratio , we investigate the situation where the number of summands is kept fixed and the value of the sum increases to infinity. Such a framework is precisely that considered in ferrari . In this reference it is shown that for fixed, , assuming that exists, i.e., , if the largest summand is removed, the measure on the remaining summands converges to the product measure with density , a feature which is apparent on figure 1. Therefore the largest summand is the unique condensate, with size . As emphasised in ferrari ‘this phenomenon is a combinatorial fact that can be observed without making the number of sites grow to infinity’. Simply stated, there is total condensation in this case, in the sense that the condensate essentially bears the totality of the particles. We shall prove this result by elementary means (see (3.8)) and extend it to the case where , thus proving that even though the first moment does not exist, there is however (total) condensation222The fact that condensation also occurs when in the present context has been previously mentioned in landim . I am indebted to S Grosskinsky for pointing this reference to me.. If , the correction of the mean largest summand to —in other words the fluctuations of the condensate—scales as , with a known amplitude, given in (3.6).
It turns out that this scenario of (total) condensation is precisely that prevailing for the two other processes studied in the present work, namely, tied-down and free renewal processes. This scenario will be the red thread for the rest of the paper, with all the complications introduced by a now fluctuating number of summands. This red thread in particular links the three figures 5, 9 and 11, and equations (3.6), (3.8), (8.31), (8.32), (11.27) and (11.28), which are the central results of the present study.
Sections 4 to 8 are devoted to tdrp with a power-law distribution of summands (1.1). Section 4 gives a systematic presentation of the formalism, valid for any arbitrary distribution , followed, in sections 6 to 8 by the analysis of the behaviour of the system in the different phases, when is a subexponential distribution of the form (1.1). As said in the abstract, these topics are scattered in the literature burda3 ; bar2 ; bar3 ; barma . The analyses presented in sections 6 to 8 are comprehensive and go deeper than previous studies, especially in the description of the condensation phenomenon and in the analysis of the statistics of extremes, as detailed in section 8.
Likewise, sections 9 to 11, devoted to free renewal processes with power-law distribution of summands (1.1), give a thorough analysis both of the formalism and of the phenomenon of condensation. It turns out that this case, which is more generic than that of tdrp since the process is not pinned at the end point , is yet more complicated to analyse, the reason being that besides the intervals , the last interval , depicted in figure 2, enters the analysis.
2 Condensation for random allocation models and ZRP
The key quantity for the study of the processes described above (random allocation models and zrp, free and tied-down renewal processes) is the statistical weight of a configuration, or in the language of the random walk of figure 1, the statistical weight of a path.
The choice of conventions on the initial values of , , is a matter of convenience which depends on the kind of reality that we wish to describe, as will appear shortly.
We start by giving, in §2.1, some elements of the formalism for random allocation models and zrp, where is any arbitrary distribution of the positive random variable . In the rest of section 2, has a power-law tail (1.1).
2.1 General formalism
2.1.1 Statistical weight of a configuration
Let be positive iid integer random variables with sum conditioned to be equal to . The joint conditional probability associated to a configuration , with given, reads333For the sake of simplicity we restrict the study to the case where is a normalisable probability distribution.
| (2.1) | |||||
where is the Kronecker delta, and where the denominator, whose presence stems from the constraint , is the partition function
| (2.2) | |||||
So is another notation for the distribution of the sum .
The physical picture associated to these definitions correspond to a system of sites (or boxes), particles in total, and where the summands are the occupation numbers of these sites, i.e., the number of particles on each of them. Since these sites can be empty, the occupation probability is non zero in general. It is therefore natural to initialise to 0. In particular, the probability that the sum of occupations be zero is that all sites are empty, i.e.,
| (2.3) |
It also turns out to be convenient to start at 0, and set
| (2.4) |
which serves as an initial condition for the recursion
| (2.5) |
As can be seen either from (2.2) or (2.5), the generating function of with respect to yields
| (2.6) |
where the generating function of with respect to is
| (2.7) |
The marginal distribution of the occupation of a generic site, say site , is
| (2.8) |
where is the average with respect to (2.1). The mean conditional occupation is
| (2.9) |
2.1.2 Distribution of the largest occupation
Condensation corresponds to the presence of a site with a macroscopic occupation. We are therefore led to investigate the statistics of the largest occupation. This topic has been discussed in janson ; jeon ; gross ; gl2005 ; maj3 ; armendariz2009 ; armendariz2011 ; cg2019 . We briefly revisit this topic and supplement it with equation (2.20) at the end of this subsection which sheds some new light on the subject and lay the ground for the parallel study of renewal processes.
Let be the largest summand (or occupation) under the conditioning ,
| (2.10) |
The distribution function of this variable is
| (2.11) |
whose numerator is
| (2.12) |
The generating function of the latter reads
| (2.13) |
where
| (2.14) |
The distribution of the largest occupation is thus given by the difference
| (2.15) |
where
| (2.16) |
Its generating function is
| (2.17) |
The numerator (2.12) obeys the recursion
| (2.18) |
with initial condition
| (2.19) |
Let us note that if the occupation number is larger than , then it is necessarily the largest one, . If so, the probability distribution of the latter, , is identical to , since there are possible choices of the generic summand . Denoting the restriction of to the range by , we thus have
| (2.20) |
We shall see later that this relation, as simple as it may seem, is instrumental for the analysis of the fluctuations of the condensate and extends naturally to the case of tdrp or free renewal processes. When we note that
| (2.21) |
since is necessarily less than (with ) when .
2.2 Phenomenology of condensation in the thermodynamic limit
This subsection is a reminder of well-known facts on the phenomenon of condensation for a thermodynamic system with a large number of sites and large total occupation , at fixed density . More detailed accounts or complements on this topic can be found, e.g., in burda ; burda2 ; janson ; gross ; hanney ; lux ; maj2 ; maj3 ; armendariz2009 ; armendariz2011 ; cg2019 . with further bibliographical references contained in the last reference.
This reminder will help emphasising the differences between the scenario of condensation in the thermodynamic limit, described in the present subsection, with another scenario of condensation, to be described in section 3, where is still large, but (the number of summands or sites) is kept fixed. In the latter regime, condensation will turn out to be total, with a condensed fraction asymptotically equal to unity.
For the time being, we consider the situation where and are both large, with kept fixed, assuming that has a power-law tail (1.1) and that is finite ().
2.2.1 Regimes for the single occupation distribution
Evidence for the existence of a condensate, i.e., a site with a macroscopic occupation, is demonstrated by the behaviour of the single occupation distribution (2.8). There are three regimes to consider, according to the respective values of and .
1. Subcritical regime ()
The asymptotic estimate of the partition function is given by the saddle-point method
| (2.22) |
where obeys the saddle-point (sp) equation
| (2.23) |
This equation has a solution for any . It follows that
| (2.24) |
which is no longer dependent on and separately and only depends on their ratio . Note that (2.23) and (2.24) entail that
| (2.25) |
consistently with (2.9). In this regime, the system is made of a fluid of independent particles with common distribution (2.24).
2. Critical regime ()
A phase transition occurs when the saddle-point value reaches the maximum value of , equal to one, where is singular, with a branch cut chosen to be on the negative axis.
The bulk of the partition function is given by the generalised central limit theorem and
| (2.26) |
up to finite-size corrections. At criticality the equality holds identically thanks to (2.9). In this regime, the system is made of a critical fluid of independent particles with common distribution (2.26).
3. Supercritical regime ()
In this regime the saddle-point equation (2.23) can no longer be satisfied because sticks to the head of the cut of .
The excess difference,
| (2.27) |
instead of being equally shared by all the sites, is, with high probability, accommodated by a single site, the condensate. The partition function is asymptotically given by its right tail (see cg2019 for more details),
| (2.28) |
In the supercritical regime, the marginal distribution has different behaviours in the three regions of values of the occupation variable.
(a) The critical background corresponds to values of finite, for which (2.26) holds again. The main contribution to the total weight comes from this region.
(b) The condensate is located in the region (i.e., the difference is subextensive). The ratio of to , given by (2.28), is asymptotically equal to
| (2.29) |
On the other hand, , is given by its bulk since . Hence, if ,
| (2.30) |
where is the stable Lévy distribution of index , asymmetry parameter , and tail parameter gnedenkoK , while, if ,
| (2.31) |
where is the Gaussian distribution gnedenkoK . These expressions describe the bulk of the fluctuating condensate which manifests itself by a hump in the marginal distribution , in the neighbourhood of , visible on figure 4. The weight of this region is obtained from (2.30) or (2.31), according to the value of , as
| (2.32) |
which demonstrates that the excess difference is typically borne by only one summand.
This hump becomes peaked in the thermodynamic limit. For a finite system, most often there is a single condensate, i.e., a site with a macroscopic occupation, while more rarely there are two sites with macroscopic occupations, both of order . This situation corresponds to the dip region, described next.
(c) The range of values of such that and are large and comparable, interpolates between the critical part of , for or order , and the condensate, for close to . It corresponds to the dip region on figure 4. In this region, is given by its right tail (2.28). So, for any ,
| (2.33) |
The interpretation of this result is that in the dip region typical configurations where one summand takes the value are such that the remaining excess difference is borne by a single other summand. The dip region is therefore dominated by rare configurations where the excess difference is shared by two summands gl2005 . An example of such a configuration is the green path in figure 1.
Setting in (2.33) and introducing a cutoff , the weight of these configurations can be estimated as
| (2.34) |
The relative weights of the dip (2.34) and condensate (2.32) regions is therefore of order , i.e., the weight of events where the condensate is broken into two pieces of order is subleading with respect to events with a single big summand.
2.2.2 Statistics of the largest summand in the condensed phase
In view of (2.32) and the following equations (2.33) and (2.34), we infer that, for larger than , which is the centre of the dip, the excess difference is typically borne by only one summand—namely the condensate —thus
| (2.35) |
According to (2.20) we know that the two sides of this equation are actually identical for , for any finite values of and . Note however that, while is always larger than , it can be smaller or larger than depending on whether is larger or smaller than . The significance of (2.35) is that the equality (2.20), valid for , extends asymptotically to the entire region .
More precise statements have been given on the asymptotic distribution of the largest summand in maj3 ; armendariz2009 ; armendariz2011 ; janson . The result is that, if , , , the rescaled variable converges to a stable law of index , with if , or if . This means that, asymptotically, the probability distribution of coincides, up to a factor , with the estimates of the marginal density in the condensate region (), that is with (2.30) or (2.31) according to the value of , which is precisely the content of (2.35).
On the other hand, denoting the th largest summand by (), with , the distributions of these ranked summands, denoted by with , sum up exactly to
| (2.36) |
Thus according to (2.35) the sum upon in the left side of (2.36) is negligible for .
As shown in armendariz2009 ; armendariz2011 ; janson , the distribution of the second largest summand, , is asymptotically Fréchet, and the subsequent ones, , are the order statistics of iid random variables with distribution , which amounts to saying that, in the supercritical regime, the dependency between the summands introduced by the conditioning goes asymptotically in the condensate .
Since typically scales as , while typically scale as , the condensate is increasingly separated from the background as increases, leaving space to the dip region ( and large and comparable). We know from the analysis made above (see discussion following (2.33)) that this region is dominated by configurations where the excess difference is shared by two summands, namely and , so
| (2.37) |
and that the contributions of these events to are of relative order . To the right of the predominant contribution to the sum on the left side of (2.37) comes from , to the left of it comes from .
An illustration

Figure 4 depicts a comparison between , obtained from (2.8), and obtained from (2.17), on the following example, defined by the normalised distribution
| (2.38) |
where is the Riemann zeta function. This model has been introduced in burda , then further investigated in camia ; burda2 ; glzeta .
In this figure, , , , . This choice of parameters corresponds to a density slightly larger than , where and coincide. The top of the hump is approximately located at and the minimum of the dip is a bit less than . These curves are practically indiscernible as soon as , which is less than , indicated by the vertical dotted line on the figure, from which the identity becomes exact.

Finally, let us compute the mean condensed fraction . For , using (2.31), it can be estimated as
| (2.39) | |||||
The same result holds if , using (2.30).
As increases, the peak of the condensate moves towards the right end , hence if the condensed fraction tends to unity, corresponding to total condensation. As detailed in section 3, this scenario still holds when is kept fixed.
3 Phenomenon of total condensation when is kept fixed and
As seen above, if , condensation becomes total, and the peak of the condensate is asymptotically located at . As we now show, this still holds true if the number of summands is kept fixed, and is large, irrespective of the existence of a first moment , or in other words, irrespective of whether is smaller or larger than one. Existence of condensation in such a situation has been pointed out in ferrari ; landim . The quantitative characterisation of this phenomenon is the aim of this section.
3.1 An illustration
We start by giving an illustration of the phenomenon on the following example, corresponding to a tail index for the decay of ,
| (3.1) |
which entails that
| (3.2) |
with , and
| (3.3) |
for kept fixed, large, which is a different regime from that leading to (2.28). In the general case, whenever obeys (1.1), the asymptotic estimate (3.3) becomes
| (3.4) |
as can be deduced from (2.6).
Figure 5 depicts a comparison of with for this example with , . These two quantities are identical for , The inset highlights the existence of a cusp at . The distribution of the maximum is significantly depressed for . It vanishes identically for (more generally ). These features are analysed in the two subsections below.
3.2 Fluctuations of the condensate
Let us turn to the general case. A measure of the fluctuations of the condensate is provided by the width of the peak of the maximum, i.e., the mass outside the condensate. It can be estimated by the sum (see §3.3 below for details)
| (3.5) |
where . The dominant contribution to this sum depends on whether is smaller or larger than one.
3.3 A finer analysis
Let us now add some more details on the derivations made above. The aim of this subsection is to give a detailed analysis of the distributions in the various regimes, in order to eventually compute the corrections to the scaling expressions predicted in (3.6) and (3.8) above.
We start with the discussion of the regimes for the single occupation distribution . There are such three regimes to consider (see figure 5):
-
1.
Downhill region. For finite, using (3.4), we have
(3.9) reflecting the fact that, with probability , a randomly chosen site belongs to the fluid.
Introducing a cutoff , such that , the weight of this region can be estimated by the sum
(3.10) -
2.
Dip region. In the dip region, where and are simultaneously large and comparable, setting in (2.8) where , and using (3.4), yields the estimate
(3.11) In this region the distribution is therefore U-shaped: the most probable configurations are those where almost all the particles are located on one of two sites. The dip centred around becomes deeper and deeper with .
The weight of this region reads, choosing ,
(3.12) -
3.
Uphill region. The condensate region corresponds to finite, where (2.8) simplifies into
(3.13) as in (2.30) or (2.31). The weight of this uphill region can be estimated as
(3.14) where is yet another cutoff, and where the last step is obtained by setting in the expression of the generating function (2.6). Thus, as seen in (3.10) and (3.14) the weights of the downhill and uphill regions add up to one, in line with the fact that the contribution of the dip region is subdominant, as shown in (3.12) above.
We now proceed to the discussion of the regimes for the distribution of the maximum, . There are again three regimes to consider, that we describe in turn, from right to left in figure 5. In the uphill and dip regions, such that , is denoted by (see (2.20)), whose estimates follow from those of seen above.
-
1.
Uphill region. For finite, using (3.13), we have
(3.15) with weight equal to 1 up to the subleading corrections detailed below. The interpretation of (3.15) is that, asymptotically, the difference between and has the same distribution as the sum of iid random variables, the latter composing the fluid,
(3.16) - 2.
-
3.
Left region. For , the weight of this region is subdominant with respect to that of the two previous ones. A simple argument shows that
(3.18) where is defined in (2.11).
The argument leading to (3.18) and the prediction of the amplitude are given in appendix A. In appendix B, we give an exact calculation of the weight of the left region when is the continuous Lévy stable density.
Equation (3.18) eventually justifies the approximation made in (3.5), where the contribution of the left region to the sum was neglected. In view of (3.18), this contribution is , thus subdominant by a factor with respect to the first correction—respectively if (see (3.6)), or for (see (3.8))—whether is smaller of larger than unity.
There is actually a hierarchy of weights for the distribution of the maximum in the successive regions , and so on. This can be intuitively grasped as follows.
-
1.
If , the total ‘mass’ is dominantly shared by two summands. The weight of this rare event scales as in (3.18).
-
2.
Then if , the total ‘mass’ is dominantly shared by three summands, which is a still rarer event, and so on.
-
3.
Finally, if , the probability vanishes since it is no longer possible to divide the ‘mass’ into pieces, all less than .
This hierarchy is reflected by the presence of cusps in the distribution of the maximum at , (see appendix A).
4 General statements on tied-down renewal processes
The random variables now represent the sizes of (spatial or temporal) intervals, that we take strictly positive, hence
| (4.1) |
In the temporal language is the total duration of the process, in the spatial language it is the length of the system. To each interval (equivalently, to each renewal event) is associated a positive weight , to be interpreted as a reward if or a penalty if . In the models considered in burda3 ; bar2 ; bar3 ; barma , has the interpretation of the ratio , where is a fugacity, and its value at criticality.
In the present section, is any arbitrary distribution of the positive random variable . Later on, in sections 5, 6, 7 and 8, will obey the form (1.1).
4.1 Joint distribution
The probability of the configuration , given that , reads
| (4.2) | |||||
where the denominator is the tied-down partition function
| (4.3) | |||||
The probability is still defined as in (2.2), except for the change of the initial value (4.1) of , which entails that is only defined for . The first term follows from (2.4). The first values of are
| (4.4) |
and so on. The generating function of with respect to is
| (4.5) |
Note that can be seen as the grand canonical partition function of the system with respect to .
For , the tied-down partition function,
| (4.6) |
is the probability that a renewal occurs at .
4.2 Distribution of the number of intervals
The distribution of the number of intervals is obtained by summing the distribution (4.2) upon all variables except ,
| (4.9) |
For instance, taking the successive terms of (4.3) divided by yields
| (4.10) |
and more generally, for ,
| (4.11) |
where the notation stands for the th coefficient of the series inside the brackets. Hence the generating function with respect to of the numerator of (4.9) reads
| (4.12) |
Taking the sum of the right side upon yields back given in (4.5).
The first moment of this distribution is by definition
| (4.13) |
The generating function of its numerator reads, using (4.12)
| (4.14) |
hence
| (4.15) |
as expected in the grand canonical ensemble with respect to . Alternatively, since
| (4.16) |
we have
| (4.17) |
More generally, the generating function of the moments of is given by
| (4.18) |
Taking the generating function with respect to of the numerator of this expression, using (4.12),
| (4.19) |
yields
| (4.20) |
Likewise, the inverse moment is
| (4.21) |
4.3 Single interval distribution
The marginal distribution of one of the summands, say , is by definition
| (4.22) |
where is the average with respect to (4.2), with a summation upon the variables (with ) and , resulting in
| (4.23) | |||||
Finally
| (4.24) |
where the first term corresponds to , i.e.,
| (4.25) |
Also, since , (4.24) can be more compactly written as
| (4.26) |
The generating function of the numerator of (4.26) with respect to yields
| (4.27) |
Summing (4.26) upon we obtain
| (4.28) |
which can also be obtained by multiplying the recursion (2.5) for by and summing on .
Remarks
4.4 Mean interval
This is, by definition,
| (4.31) |
Multiplying (4.27) by and summing upon yields
| (4.32) |
which can also be obtained by taking the derivative with respect to of the expression for the inverse moment . Indeed,
| (4.33) |
then, taking the generating function of the right side gives
| (4.34) | |||||
4.5 The longest interval
By definition, the longest interval is
| (4.35) |
Its distribution function is defined as
| (4.36) |
with initial value
| (4.37) |
The numerator in (4.36) reads
| (4.38) | |||||
where is defined in (2.12). Note that , hence . The generating function of the numerator is
| (4.39) | |||||
where
| (4.40) |
The numerator obeys the recursion (renewal) equation, which generalises the Rosén-Wendel’s result (2.4) of wendel1 ,
| (4.41) |
with initial condition (4.37).
The distribution of is given by the difference
| (4.42) |
where , with generating function
| (4.43) | |||||
Its end point value is the same as (4.25), i.e.,
| (4.44) |
Note that (4.43) can be obtained by multiplying (2.17) by and summing on . In other words,
| (4.45) |
as can also be inferred from (4.38). And therefore (see (4.8))
| (4.46) |
When , the longest interval is unique. Denoting the restriction of to the range by , and generalising the reasoning made in wendel ; wendel1 we can decompose a configuration into three contributions to obtain
| (4.47) | |||||
which, using (4.17), can be alternatively written as
| (4.48) |
that is (see (4.26)),
| (4.49) |
Remarks
1. An alternative route to (4.49) can be inferred from (4.45) as follows. We have
| (4.50) |
where is given in (2.8). So
| (4.51) | |||||
which, after division by , yields (4.49).
2. Comparison between (4.51) and (4.47) entails the equality
| (4.52) |
which can also be checked directly by taking the generating functions of both sides,
| (4.53) |
3. From (2.21) we infer that, if ,
| (4.54) |
5 Phase transition for tied-down renewal processes
In this section and in the following sections 6, 7 and 8 the distribution is taken subexponential with asymptotic power-law decay (1.1). Before discussing the phase diagram of the process, we give some illustrative examples of such distributions.
5.1 Illustrative examples
In the sequel, we shall illustrate the general results derived for tdrp in the current section, and for free renewal processes in section 9, on the following examples.
Example 1. This first example corresponds to the tied-down random walk of figure 3 on which we come back in more detail. The distribution of the size of intervals, , representing the probability of first return at the origin of the walk after steps, or equivalently after tick marks on figure 3, reads
| (5.1) |
since the number of such walks is equal to . Its generating function reads
| (5.2) |
The partition function (4.6) for represents the probability that the walk returns at the origin after steps, or equivalently after tick marks,
| (5.3) |
since the number of such walks is equal to . Its generating function reads
| (5.4) |
Note that
| (5.5) |
The partition function is explicit for this case,
| (5.6) |
with .
5.2 Phase diagram
Demonstrating the existence of a phase transition in the model defined by (4.2), with distribution given by (1.1), when crosses the value one, is a classical subject. This model is a particular instance of a linear system, as described in fisher , where the mechanism of the transition is explained in simple terms. This transition is also studied in burda3 ; bar2 ; bar3 ; barma for Example 2 (see (5.7)). Let us first analyse the large behaviour of . Recalling (4.5) we have, for a contour encircling the origin,
| (5.9) |
Since is monotonically increasing for the denominator of , , is monotonically decreasing between 1 and .
Disordered phase. If , the denominator vanishes for such that , hence has a pole at , and therefore is exponentially increasing,
| (5.10) |
Condensed phase. If , the denominator has no zero, but it is singular for (which is the singularity of ). Hence sticks to 1. The asymptotic estimate of is given in (8.1).
This is the switch mechanism of Fisher fisher : the condition determining switches from being the smallest root of the equation to being the closest real singularity of , which is a cut at . This non analytical switch signals the phase transition. The free energy density fisher
| (5.11) |
therefore vanishes when . The three cases above are successively reviewed in the next sections.
6 Disordered phase () for tied-down renewal processes
The asymptotic expression at large of the distribution of the size of a generic interval is obtained by carrying (5.10) in (4.26), which leads to
| (6.1) |
where is the correlation length, divergent at the transition. This expression is independent of and normalised, since summing on restores . This exponentially decaying distribution has a finite mean,
| (6.2) |
an expression which can also be inferred from (4.32). Thus (5.10) can be recast as
| (6.3) |
The distribution of is given by (4.9)
| (6.4) |
This distribution obeys the central limit theorem, as illustrated on the example below. Using (4.15), we obtain the asymptotic expression of ,
| (6.5) |
which means that
| (6.6) |
Let us denote the density of points (or intervals) for a finite system as
| (6.7) |
then, asymptotically, we have
| (6.8) |
We illustrate these general statements on Example 1 (see (5.1)), for which is explicit,
| (6.9) |
hence
| (6.10) |
and the following asymptotic expressions hold,
| (6.11) |
Figure 6 depicts a comparison between the exact finite-size expression of the density obtained by means of (4.14) for as a function of , and the asymptotic expression (6.11). It vanishes at the transition , where the system becomes critical.
More generally, if , close to the transition, we get
| (6.12) |
as can be easily inferred by means of the expansion (7.1), a result already present in burda3 , later recovered in bar2 .

If , the density tends to when , as can be seen on (6.2) and (6.8), using the expansion (7.2) (see also (7.24)). The density vanishes in the condensed phase since is finite (see (8.5)), it is therefore discontinuous at the transition, as noted in burda3 ; bar2 . Likewise, it is easy to see that
| (6.13) |
The correlation length diverges at the transition, while the order parameter is either continuous () or discontinuous (), as seen above. The transition is therefore of mixed order burda3 ; bar2 .
7 Critical regime () for tied-down renewal processes
In this regime, the behaviour of the quantities of interest strongly depends on whether the index is smaller or larger than unity. The discussion below is organised accordingly. Part of the material of this section can be found in more details in wendel ; wendel1 and is also addressed in bar3 ; barma . Here we summarise these former studies and complement them by a detailed analysis of the distribution of the number of intervals and of the distribution of the size of a generic interval. We also come back on the distribution of the longest interval.
If the singularity is at , or, setting , at . The generating function becomes the Laplace transform which has the expansion
| (7.1) | |||||
| (7.2) |
with
| (7.3) |
i.e., , where is a microscopic scale, defined as
| (7.4) |
The parameter is negative if , positive if , and so on. For instance, , , , and so on.
7.1 Distribution with index
Since , in Laplace space we have which yields the expression of the partition function (see (4.6) in wendel1 )
| (7.5) |
For instance, setting and restores (5.3).
7.1.1 The number of intervals
We have (see (4.10) in wendel1 ),
| (7.6) |
which can be easily deduced from (4.14). For the specific case of Example 1 (see (5.1)), we have the exact result (see (2.47) in wendel1 )
| (7.7) |
which is in agreement with (7.6), with . We know from (4.9) that the distribution of is given by the ratio
| (7.8) |
For and large has a scaling form. On the one hand, according to the generalised central limit theorem, the scaling form of the numerator is given by
| (7.9) |
where is the density of the stable law of index , tail parameter and asymmetry parameter (see e.g., cg2019 ). Then using (7.5), we get, with ,
| (7.10) |
The Lévy distribution of index has the explicit expression
| (7.11) |
hence (see (2.49) in wendel1 ), for Example 1 (see (5.1)),
| (7.12) |
Moreover, for this example, for and finite, is explicit since both given by (5.6) and , given by (5.3), are known explicitly.

7.1.2 Single interval distribution
Two regimes are to be considered.
(i) In all regimes where is large, using (7.5) we have
| (7.13) |
For instance, if ,
| (7.14) |
while if , with ,
| (7.15) |
which is minimum at .
(ii) On the other hand, if ,
| (7.16) |
In particular, for ,
| (7.17) |
In this regime the ratio of to the estimate (7.13) reads
| (7.18) |
which tends to one when becomes large, if one refers to (7.5).
All these results can be illustrated on Example 1 (see (5.1)). For instance figure 7 gives a comparison between the exact expression of computed for by means of the middle expression in (7.13) and its asymptotic form given by the rightmost expression in (7.13).
The generating function of the mean interval given in (4.32) yields the estimate, in Laplace space,
| (7.19) |
hence (see (4.18) in wendel1 )
| (7.20) |
This result can be recovered by taking the average of the estimate (7.13). It predicts correctly that the product . For Example 1, (see (5.1)), the computation leads to the exact result (see (2.58) in wendel1 )
| (7.21) |
7.1.3 The longest interval
The study of the statistics of the longest interval for the critical case, including the scaling analysis of for , is done in wendel ; wendel1 (see also bar3 for a study of Example 2).
For , in contrast with the case of random allocation models and zrp where (see §2.1.2), the ‘enhancement factor’ is now replaced by the factor (see (4.49)), which is equal to one for , where are equal, see (4.44). Using (7.6) for , and (7.13) for in (4.49) allows to recover the universal scaling expression valid for (see equation (4.48) in wendel1 ), in the limit where , with kept fixed,
| (7.22) |
where is given in (7.6).
Though there is no condensation at criticality, some features are precursors of this phenomenon. For instance, the mean longest interval scales as while the typical interval scales as . However, not only scales as but also all the following maxima () do so wendel ; wendel1 . Moreover continues to fluctuate when while for genuine condensation as in section 2 above or in section 8 below, its distribution is peaked. Finally, the dominant contribution to the weight of comes from values of less than a small cutoff.
7.2 Distribution with index
For , we have, using (4.5) (see (4.73) in wendel1 ),
| (7.23) |
The average value of is obtained by means of (4.14)444Equation (7.24) corrects the inaccurate expression (4.74) given in wendel1 for this quantity.
| (7.24) |
The subleading correction in the second line (i.e., for ) is given by the correction term of the first line which is now negative and decreasing. The distribution of reads
| (7.25) |
The asymptotic estimate for is obtained by analysing (4.32), yielding for ,
| (7.26) |
which is the same expression as for a free renewal process gl2001 . The single interval distribution has the form
| (7.27) |
except for finite, where in particular,
| (7.28) |
The distribution of the longest interval is analysed in wendel1 (see also bar3 for the case of Example 2 defined in (5.7)). The result is
| (7.29) |
where is related to the tail coefficient by . Setting
| (7.30) |
we have, as , , with limiting distribution
| (7.31) |
which is the Fréchet law frechet ; gnedenko . Therefore
| (7.32) |
as was already the case for free renewal processes gms2015 .
8 Condensed phase () for tied-down renewal processes
The aim of this section—central in the present work—is to investigate the statistics of the number of intervals and characterise the fluctuations of the condensate. We start by analysing the large behaviour of the quantities of interest which are functions of only (partition function, moments and distribution of ). We then investigate the regimes for the distributions of the size of a generic interval, , and of the longest one, . Related material can be found in gia1 ; bar3 ; barma .
8.1 Asymptotic estimates at large
Starting from (4.5) and linearising with respect to the singular part, we obtain, when , for any value of ,
| (8.1) |
Alternatively, it suffices to notice that, for fixed and large, for any subexponential distribution chistyakov ,
| (8.2) |
as for example in (5.6), which entails
| (8.3) |
hence restores (8.1). Likewise, we find
| (8.4) |
If one substitutes (8.1) in the expression of the mean (4.15), we obtain, the superuniversal result, independent of ,
| (8.5) |
This result can be found alternatively using (4.17) together with (8.1) and (8.4), or else using (8.7) below.

More generally, this superuniversality also holds for the asymptotic distribution of . Using (4.20), the latter reads
| (8.6) |
hence extracting the coefficient of order in of this expression leads to the asymptotic distribution, independent of ,
| (8.7) |
This distribution is depicted in figure 8. The same result can be found by noting that
| (8.8) |
using (8.2) again. The interpretation of (8.7) is simple: is the sum of two independent geometric random variables (see (11.4)), which represent the fluid on either side of the remaining interval, which is the condensate.
8.2 Regimes for the single interval distribution
For large, the asymptotic expression of the single interval distribution is obtained by substituting (8.1) in (4.24), leading to
| (8.11) |
Figure 9 depicts the distribution (together with the distribution of the longest interval , see §8.3 below), for and computed from (4.26), with Example 1 (see (5.1)). As can be seen on this figure, there are three distinct regions for , namely, from left to right, a downhill region, followed by a long dip region, then an uphill region which accounts for the fluctuations of the condensate.
Let us discuss the behaviour of given by (8.11) in each of these regions successively.
-
1.
Downhill region. For finite we have, using again (8.1),
(8.12) Introducing a cutoff , such that , the weight of this downhill region can be estimated as
(8.13) -
2.
Dip region. In the dip region, where and are simultaneously large, setting in (8.12) () and using (8.1) yields the estimate
(8.14) In this region the distribution is therefore U-shaped: the most probable configurations are those where almost all the particles are located on one of two sites. The dip centred around becomes deeper and deeper with .
The weight of the dip region can be estimated using (8.14), as
(8.15) where, for the sake of simplicity, we chose . The two downhill and uphill regions are therefore well separated by the dip region, as is conspicuous on figure 9. Note the similarity between (8.15) and (3.12), with the correspondence
(8.16) -
3.
Uphill region. The uphill region corresponds to finite, where (8.11) simplifies into
(8.17) The weight of this region can be estimated as
(8.18) where the last step is obtained by setting in the expression of the generating function (4.5). The right side of (8.18), , is precisely the limiting value of , see (8.9). This result is therefore the analogue of (3.14) with the correspondence given in (8.16).
8.3 Regimes for the distribution of the longest interval

As can be seen on figure 9, there are two main regions for the distribution of the maximum, . For , the contribution of to the total weight is vanishingly small. The argument is the same as in §3.3. Hence we restrict the rest of the discussion to the region , where has the simpler expression given by (4.47). Using (8.1), its asymptotic estimate is
| (8.19) |
or, equivalently, for ,
| (8.20) |
Let us note that the ratio
| (8.21) |
is an increasing function of , with first values
| (8.22) |
and so on, reaching the limit, for large ,
| (8.23) |
The inset in figure 9 depicts the prediction (see (4.49)) which coincides perfectly with in the second half . This graph is very similar to the inset in figure 5.
We now discuss the behaviour of in the two regions of interest.
- 1.
-
2.
If et are simultaneously large, with , we have
(8.27) which is proportional to (8.14), with ratio . Note the similarity of (8.27) with (3.17) with the correspondence
(8.28) The weight under the peak of the condensate tends to unity,
(8.29) by a computation similar to (8.18), using now the fact that the last sum is equal to , as can be seen by setting in the expression of the generating function .
We can further analyse the fluctuations of the condensate by considering the width of the peak,
| (8.30) |
The dominant contribution to this sum depends on whether is smaller or larger than one.
If , the dominant contribution comes from (8.27), i.e., for comparable to ,
| (8.31) | |||||
where is the incomplete beta function, which, for example, is equal to for .
If , the main contribution comes from (8.24),
| (8.32) | |||||
using (8.4). This last result (8.32) has a simple interpretation. It says that the correction is made of intervals, of mean length . It is therefore the perfect parallel of the result (3.8). Likewise, (8.31) is the perfect parallel of (3.6). In the present case the expression in the right side of this equation is proportional to times the critical mean interval , given in (7.20).
8.4 Discussion
In view of the above analysis the following picture emerges. The ‘contrast’ between the dip and the condensate region increases with , i.e., the dip centred around becomes deeper and deeper as (see (8.14)) relatively to the height of the peak, which is of order one. An estimate of the contribution of the condensate to the total weight can thus be operationally obtained by summing for in the layer . This sum is asymptotically equal to , according to (8.18), which turns out to be also the asymptotic estimate of . The interpretation of this result is clear. When is larger than , this interval is necessarily the longest one, i.e., . Furthermore, since this interval is chosen amongst intervals, we expect that, in average,
| (8.33) |
But the sum on the right side, namely the weight of in the same layer is asymptotically equal to one. This simple heuristic reasoning therefore recovers (8.18).
In the condensed phase () the number of intervals is finite and fluctuates around its mean, which is a superuniversal constant independent of . This situation is akin to the case of random allocation models and zrp, when and is kept fixed. Note that, for the latter, results were independent of the value of , too. In both situations condensation is total, the condensed fraction is asymptotically equal to unity.
Table 1 summarises the results found in sections 6, 7 and 8, which demonstrate a large degree of universality.
| disordered | critical | critical | condensed | |
|---|---|---|---|---|
9 General statements on free renewal processes
We now turn to the case of free renewal processes. The random number of intervals up to is defined through the condition (1.4), . The size of the current (unfinished) interval—named the backward recurrence time in renewal theory—is denoted by , see figure 2. As will appear shortly, free renewal processes are more complicated to analyse than tdrp, essentially because now there are two kinds of intervals to consider, the intervals on one hand, and the last unfinished interval , on the other hand.
In the present section, is any arbitrary distribution of the positive random variable . Later on, in sections 10 and 11, will obey the form (1.1).
9.1 Joint distribution
As for tdrp a weight is attached to each interval. The joint probability of the configuration , reads
| (9.1) | |||||
where is the tail probability (or complementary distribution function) defined in (7.4),
| (9.2) |
As mentioned in section 4, since the summands have the interpretation of the sizes of the intervals, we take . For ,
| (9.3) |
corresponding to the event of no renewal occurring between and , i.e., , and where means empty. The generating function of is
| (9.4) |
with .
9.2 Distribution of the number of intervals
As for tdrp we denote this distribution as555Whenever no ambiguity arises, we use the same notations for the observables of the tied-down and free renewal processes. Otherwise, when necessary, we add a superscript, as e.g., for , or in (9.18).
| (9.10) |
We read on the successive terms of that
| (9.11) |
and so on. More generally,
| (9.12) |
Summing (9.1) on and on the , and taking the generating function with respect to yields
| (9.13) |
to be compared to (9.8). Therefore
| (9.14) |
and
| (9.15) |
as for tdrp, see (4.15). More generally,
| (9.16) |
so we obtain, as for tdrp, see (4.20),
| (9.17) |
Finally, comparing (9.14) to (4.14), we note the relationship between the free and tied-down cases,
| (9.18) |
hence using (4.17), we have
| (9.19) |
or, equivalently,
| (9.20) |
9.3 Distribution of
We recall that this quantity is the sum of the intervals before , see (1.3) and figure 2. By definition,
| (9.21) |
Thus, using (9.1), we have
| (9.22) |
which generalises the expression for this quantity when gl2001 . By derivation with respect to then setting , leads to
| (9.23) |
whose summation with (9.31) below leads to the equality
| (9.24) |
which expresses the sum rule
| (9.25) |
The asymptotic behaviours of these quantities for are simple gl2001 . If , then , . If , then , and follows by difference.
9.4 Distribution of
The distribution of is obtained by summing (9.1) on the and on
| (9.26) |
This entails that
| (9.27) |
hence, using (9.9)
| (9.28) |
The generating function with respect to of (9.27) reads
| (9.29) |
which summed upon gives back. Taking now the generating function of (9.29) with respect to yields
| (9.30) |
The mean ensues by taking the derivative of the right side of this equation with respect to and setting to one,
| (9.31) |
9.5 Single interval distribution
As for tdrp, the single interval distribution,
| (9.32) |
is obtained by summing on , and
| (9.33) | |||||
So
| (9.34) |
The generating function of the numerator is therefore
| (9.35) |
to be compared to (4.32). Though (9.34) is formally identical to (4.26) the normalisations of these two distributions are different. Indeed,
| (9.36) |
which means that
| (9.37) |
In other words
| (9.38) |
The distribution is thus defective. The recursion relation for follows from (9.33) and (9.37)
| (9.39) |
At the end point, , we have
| (9.40) |
which corresponds to the event , and which is formally the same as (4.25).
9.6 Mean interval
9.7 The longest interval
In the present case the longest interval is defined as
| (9.43) |
Its distribution function is
| (9.44) |
with initial value
| (9.45) |
As for tdrp, , hence . The generating function of the numerator is
| (9.46) | |||||
where
| (9.47) |
are related by
| (9.48) |
Note that
| (9.49) | |||||
where we used (4.38) in the last step.
The distribution of is given by the difference
| (9.50) |
where , with generating function
| (9.51) | |||||
At the end point, , we have
| (9.52) |
where the last two terms correspond respectively to the events , cf (9.40) and , cf (9.11). The mean is given by the sum
| (9.53) |
which implies a relation between the generating functions
| (9.54) | |||
| (9.55) |
where is given by (9.46).
Denoting again the restriction of to by , we can obtain an expression of this quantity by a similar reasoning as done for (4.47) in §4.5. We thus obtain
| (9.56) | |||||
expressing the fact that the longest interval can be either or a generic interval . Equivalently, using (9.20), this reads
| (9.57) |
or else
| (9.58) |
to be compared to (4.48) and (4.49). For , (9.52) is recovered.
Remarks
1. We can prove (9.56) otherwise. We start from the first line of (9.49) and take the discrete derivative with respect to of both sides, which yields
| (9.59) |
If , using (4.54), we recognise the numerator of the first term of (9.56) in the first term of this equation. Likewise, if , it can be shown that the second term of the above equation is equal to the numerator of the second term of (9.56).
2. From (4.54) we infer that, if ,
| (9.60) |
Lastly, consider the probability that the last unfinished interval is the longest one, that is
| (9.61) |
The generating function with respect to of its numerator reads
| (9.62) |
hence
| (9.63) | |||||
| (9.64) |
10 Critical regime () for free renewal processes
In this section and in the following one (section 11) we specialise the discussion to the case of a subexponential distribution with asymptotic power-law decay (1.1).
The critical regime is thoroughly described in gl2001 ; gms2015 and builds upon previous studies feller ; dynkin ; lamperti58 ; lamperti61 . The results are summarised in table 2, which also presents the main outcomes for the disordered regime ().
The initial analysis of the distribution of the longest interval is due to Lamperti lamperti61 . Let us just recover the universal asymptotic expression of , for , with fixed, when , given in lamperti61 ,
| (10.1) |
This result can be simply inferred from (9.58). For the first term of (9.58), we obtain for large, using (7.5),
| (10.2) |
i.e., an arcsine law in the variable , which is a well-known result dynkin ; feller ; gl2001 . For the second term of (9.58), we need
| (10.3) |
which is obtained using (9.14). Adding the two terms of (9.58) yields (10.1).
11 Condensed phase () for free renewal processes
We now focus on the case of most interest, namely the condensed phase, , for subexponential distributions (1.1). As in section 8, we investigate the statistics of the number of intervals, the single-interval distribution and we characterise the fluctuations of the condensate. We also address the statistics of the last interval .
11.1 Asymptotic estimates at large
The asymptotic analysis of (9.8) yields, for large ,
| (11.1) | |||||
| (11.2) |
where is defined in (7.4). As a consequence, (9.17) yields
| (11.3) |
leading asymptotically to a geometric distribution for ,
| (11.4) |
independent of , from which entails, in the same limit,
| (11.5) |
For large but finite, we find, using (9.15) and (11.1) or (11.2),
| (11.6) |
The asymptotic estimate of the mean interval can be obtained from the analysis of (9.42),
| (11.7) | |||||
| (11.8) |
These expressions can also be obtained by means of the marginal distribution , see below. Likewise, the asymptotic estimate of the mean sum can be obtained from the analysis of (9.23),
| (11.9) | |||||
| (11.10) |
hence
| (11.11) | |||||
| (11.12) |
11.2 Regimes for the single interval distribution
We proceed as was done for tdrp (see section 8.2). Using (11.1) we have the estimate, at large ,
| (11.13) |
Figure 10 depicts the distribution (together with the distribution , see §11.3 below), for and computed with Example 1 (see (5.1)). As can be seen on this figure, there are three distinct regions for , that we consider in turn.
The weight of the downhill region is found to be asymptotically equal to , using the same reasoning as in §8.2. The complement is borne by , see (9.37) and (11.21). The two other regions therefore do not contribute to the total weight, asymptotically.
In order to complete the picture we now investigate the distribution of , the last unfinished interval.
11.3 Regimes for the distribution of
According to (9.27), and in view of (11.1), for large we have
| (11.17) |
Let us discuss the different regimes of this expression according to the magnitude of .
- 1.
-
2.
If , the same estimate (11.18) still holds, then setting , we get
(11.19) which has its minimum at .
- 3.
Let us estimate, for later use, the probability that is less than . The result depends on the value of .
If , using (11.19), we have
| (11.22) |
If , using (11.18), we have
| (11.23) |


11.4 Regimes for the distribution of the longest interval
The bulk of the distribution of lies in the region , and is therefore given by , see (9.56) or (9.58).
We start by giving an illustration. The distribution of on the whole interval is depicted in figure 11 for Example 1 (see (5.1)). The restriction of this distribution to the second half , that is , computed from (9.58) is also depicted. The corresponding figure for is qualitatively alike.
Let us now compare the respective contributions of each of the two terms in (9.56) to the total weight in the region . The first term is investigated in §11.3 above. The asymptotic estimate of the second term is as follows. We start with the case .
If , we consider two regimes.
(i) The main contribution of the second term to the total weight comes from the regime .
Using the asymptotic estimate for large ,
| (11.24) |
and setting , the second term reads
| (11.25) |
which is similar to (11.19). Summing this expression upon from to yields (11.22), that is . Therefore adding this contribution to the first one, namely , gives unity, up to small corrections, in agreement with the fact that the weight of in the left domain is negligible.
In order to get the correction of to , we take the average of (9.56), by integrating each of the terms from to upon , using (11.19) and (11.25). Adding the contributions coming from the two terms, we finally obtain for the dominant correction,
| (11.27) | |||||
which has the same structure as (8.31) or (3.6). The comment made below (8.32) also holds here. In the present case the expression in the right side of (11.27) is proportional to times the critical mean interval , as given in gl2001 .
11.5 Probability for the last interval to be the longest one
Lastly, we investigate the behaviour of defined in (9.61) as the probability that is the longest interval. An estimate of for can be obtained by means of the inequality
| (11.29) |
In view of (11.22) and (11.27), we infer that asymptotically for large, if ,
| (11.30) |
while, if , in view of (11.23) and (11.28),
| (11.31) |
In other words, for , . At criticality, , , if , while if , gms2015 . For , .
Figure 12 depicts as a function of for Example 1 (see (5.1)) and for three different sizes, crossing at the universal critical value for gms2015 and the data collapse obtained by using the scaling variable .

Table 2 summarises the results found in section 11 and recapitulates the results for the two other phases (disordered and critical). This table demonstrates a large degree of universality of the results, as was the case of table 1, with which it should be put in perspective.
| disordered | critical | critical | condensed | |
|---|---|---|---|---|
| or constant | ||||
| constant | ||||
12 Conclusion
Let us summarise the salient aspects of this study.
We first recalled the main features of the condensation transition taking place for random allocation models and zrp in the thermodynamic limit ( with fixed ratio ), when the distribution of occupations is subexponential. These occupations are independent and identically distributed random variables conditioned by the value of their sum. The phase diagram is made of three phases: disordered, critical, and condensed. The critical line , where , separates the disordered phase at low density from the condensed phase at high density. Condensation manifests itself by the occurrence, in the thermodynamic limit, of a unique site with macroscopic occupation. In the language of particles and boxes (or sites), the condensate is by definition the site with the largest occupation. In the language of sums of random variables used all throughout the present work, the condensate is the unique summand with extensive value. In the thermodynamic limit, the fraction no longer fluctuates and takes the asymptotic value .
A second scenario for the same class of models consists in taking the limit keeping the number of sites (or summands) fixed. In this limit there is again a single extensive summand , but now the fraction tends to unity, which means that condensation is total. The novelty is that this occurs irrespective of the existence of a first moment , or in other words, irrespective of whether is smaller or larger than one. If is large but finite, the distribution of is peaked, with a width scaling as if , with a known amplitude, or asymptotically equal to , if . Note that, in contrast to the previous case, one can no longer speak of a phase transition, nor even of a phase, since the system is made of a finite number of summands (or sites).
This scenario is a good preparation for the study of condensation in free and tied-down renewal processes, with power-law distribution of intervals (1.1), which is the main motivation of the present work. Instead of particle occupations and sites one speaks in terms of renewal events and intervals, whose sizes sum up to a fixed value . The novelty—and complication—is that the number of these renewal events, or equivalently of intervals, , fluctuates. For instance these renewal points are the passages by the origin of a random walk, as depicted in figure 3. A weight is attached to each renewal event. In the language of random walks (or of polymer chains) represents the reward or penalty when the walk touches the origin fisher ; gia1 ; gia2 . A high value of favours configurations with a large number of intervals , i.e., a disordered phase—or localised phase in the language of random walks. A low value of favours configurations with a small number of intervals , i.e., a condensed phase—or delocalised phase in the language of random walks. It is therefore intuitively clear that the same scenario of total condensation as seen above should prevail, where now the driving force is no longer a change in the density, , but a change in the value of the weight attached to each interval (or summand). In this respect it is worth noting the similarity between equations (3.6), (8.31) and (11.27) on one hand, and the similarity between equations (3.8), (8.32) and (11.28) on the other hand.
It turns out that, in the condensed phase, when , the distribution of the number of intervals, , is superuniversal, i.e., model independent, since it only depends on and not even on the index of the power-law decay (1.1). This distribution is geometric for free renewal processes, while it is the convolution of two such distributions for tdrp. More generally, an important distinction is to be made according to whether is less or larger than unity. In the first case the distribution has no first moment, atypical events play a major role and the system becomes self-similar at criticality. In the second case the observables of interest depend on the first moment , which is finite.
In closing, let us broaden the perspective. The phase transition occurring when passes through unity is second order for the density of intervals (defined in (6.8)) if , and first order if . On the other hand the correlation length diverges at the transition, see (6.13). The transition is therefore mixed order as was pointed out for the particular case of tdrp with Example 2 (see (5.7)) in burda3 ; bar2 . Furthermore, the magnetisation, defined as the alternating sum , changes, when , from the value in the disordered phase to in the condensed phase since condensation is total. More on this can be found in bar2 . If the distribution of the magnetisation at criticality is broad and self-similar, both for free lamperti58 ; gl2001 and tied-down renewal processes wendel2 . At criticality, for , the non stationary two-time (or two-space) correlation function is also self-similar, again for both processes gl2001 ; wendel2 .666After submission of the present work, a study devoted to the statistics of in the range for tied-down or free renewal processes at criticality () was presented in barkai . For the tdrp case the result (4.48) with is obtained. For the free renewal case, barkai predicts, if , (12.1) which is (9.57), with , noting that , as is clear by taking the generating functions of both sides.
Acknowledgements.
It is a pleasure to thank G Giacomin, M Loulakis and J-M Luck for enlightening discussions. I am also indebted to S Grosskinsky and S Janson for useful correspondence.Appendix
Appendix A On equation (3.18)
Let us explain the argument leading to (3.18) and the origin of the hierarchical structure mentioned in §3.3777I am indebted to M Loulakis for sharing his comments on this part with me..
-
1.
In the uphill region where is finite, is the unique big summand and (3.16) holds. This property stems from the fact that when the sum of subexponential random variables is conditioned to a large value , all the dependence is absorbed by the maximum and the ensemble of smaller variables becomes asymptotically independent. This property, initially put forward by early workers, has been progressively refined in subsequent studies ferrari ; armendariz2011 ; janson .
-
2.
In the dip region, where , since gets large, the sum becomes subjected to a large deviation event. This event will be realised by , the second largest summand, typically equal to . We thus obtain (3.17).
-
3.
One can now iterate the reasoning. If , the difference cannot accommodate a single big summand since the latter should be less than . Now
(A.1) where the sum in the right side is subjected to a large deviation, which will be realised by a third large summand . Since should be less than , the constraint holds. Moreover imposes the condition , i.e. . We are thus lead to the asymptotic estimate
(A.2) and therefore
(A.3)
For , the analysis of this expression in the continuum limit leads to
| (A.4) |
where the amplitude is given by
| (A.5) |
For instance, , .
For , the analysis of (A.3) yields
| (A.6) |
for continuous random variables, and
| (A.7) |
for discrete ones.
One can iterate the reasoning leading to (A.3) and derive the weights of the successive sectors , ), etc. For instance, for in the interval , one finds
| (A.8) |
which yields
| (A.9) |
For example, if , one finds
| (A.10) |
Appendix B Weight of the maximum in the left region for a Lévy stable law
We want to determine the weight of the maximum in the left region considered in §3.3,
| (B.1) |
on the particular example of a a Lévy stable law. We use a continuum formalism where distributions are densities and variables are real numbers for the particular case where is the Lévy stable density (7.11),
| (B.2) |
Likewise, considering as a real number and as a density,
| (B.3) |
Thus
| (B.4) |
is explicit. Setting , we obtain
| (B.5) |
Setting , we finally get
| (B.6) |
For large, expanding in powers of , we obtain
| (B.7) | |||||
For Example 1, (see (5.1)), the first term of the expansion,
| (B.8) |
References
- (1) Bialas P, Burda Z and Johnston D 1997 Nucl. Phys. B 493 505 Condensation in the Backgammon model
- (2) Bialas P, Bogacz L, Burda Z and Johnston D 2000 Nucl. Phys. B 575 599 Finite size scaling of the balls in boxes model
- (3) Janson S 2012 Prob. Surveys 9 103 Simply generated trees, conditioned Galton-Watson trees, random allocations and condensation
- (4) Spitzer F 1970 Advances in Math. 5 246 Interaction of Markov Processes
- (5) Andjel ED 1982 Ann. Prob. 10 525 Invariant measures for the zero-range process
- (6) Drouffe JM, Godrèche C and Camia F 1998 J. Phys. A 31 L19 A simple stochastic model for the dynamics of condensation
- (7) Evans MR 2000 Braz. J. Phys. 30 42 Phase transitions in one-dimensional nonequilibrium systems
- (8) Jeon I, March P and Pittel B 2000 Ann. Probab. 28 1162 Size of the largest cluster under zero-range invariant measures
- (9) Godrèche C and Luck JM 2002 J. Phys.: Condens. Matter 14 1601 Nonequilibrium dynamics of urn models
- (10) Godrèche C 2003 J. Phys. A 36 6313 Dynamics of condensation in zero-range processes
- (11) Grosskinsky S, Schütz GM and Spohn H 2003 J. Stat. Phys. 113 389 Condensation in the zero range process: stationary and dynamical properties
- (12) Evans MR and Hanney T 2005 J. Phys. A 38 R195 Nonequilibrium Statistical Mechanics of the Zero-Range Process and Related Models
- (13) Godrèche C and Luck J M 2005 J. Phys. A 38 7215 Dynamics of the condensate in zero-range processes
- (14) Godrèche C 2007 Lect. Notes Phys. Springer 716 261 From urn models to zero-range processes: statics and dynamics
- (15) Evans MR, Majumdar SN and Zia RKP 2006 J. Stat. Phys. 123 357 Canonical Analysis of Condensation in Factorised Steady States
- (16) Ferrari PA, Landim C and Sisko VV 2007 J. Stat. Phys. 128 1153 Condensation for a Fixed Number of Independent Random Variables
- (17) Evans MR and Majumdar SN 2008 J. Stat. Mech. P05004 Condensation and Extreme Value Statistics
- (18) Armendariz I and Loulakis M 2009 Probab. Theory Relat. Fields 145 175 Thermodynamic limit for the invariant measures in supercritical zero range processes
- (19) Armendariz I and Loulakis M 2011 Stochastic Process. Appl. 121 1138 Conditional distribution of heavy tailed random variables on large deviations of their sum
- (20) Armendariz I, Grosskinsky S and Loulakis M 2013 Stochastic Process. Appl. 123 3466 Zero-range condensation at criticality
- (21) Armendariz I, Grosskinsky S and Loulakis M 2017 Probab. Theory Relat. Fields 169 105 Metastability in a condensing zero-range process in the thermodynamic limit
- (22) Godrèche C 2019 J. Stat. Mech. 063207 Condensation for random variables conditioned by the value of their sum
- (23) Feller W 1968 1971 An Introduction to Probability Theory and its Applications volumes 1&2 (New York: Wiley)
- (24) Doob JL 1948 Trans. Amer. Math. Soc. 63 422 Renewal theory from the point of view of the theory of probability
- (25) Smith WL 1958 J. Roy. Statist. Soc. Ser. B 20 243 Renewal Theory and its Ramifications
- (26) Cox DR 1962 Renewal theory (London: Methuen)
- (27) Wendel JG 1964 Math. Scand. 14 21 Zero-Free Intervals of Semi-Stable Markov Processes
- (28) Godrèche C 2017 J. Phys. A 50 195003 Longest interval between zeros of the tied-down random walk, the Brownian bridge and related renewal processes
- (29) Godrèche C 2017 J. Stat. Mech. P073205 Two-time correlation and occupation time for the Brownian bridge and tied-down renewal processes
- (30) Labarbe JM and Marckert JF 2007 Elect. Journ. Prob. 12 229 Asymptotics of Bernoulli random walks, bridges, excursions and meanders with a given number of peaks
- (31) Vervaat W 1979 Ann. Probab. 7 143 A relation between Brownian bridge and Brownian excursion
- (32) Fisher M 1984 J. Stat. Phys. 34 667 Walks, Walls, Wetting and Melting
- (33) Poland D and Scheraga HA 1966 J. Chem. Phys. 45 1456 Phase Transitions in One Dimension and the Helix-Coil Transition in Polyamino Acids
- (34) Poland D and Scheraga HA 1966 J. Chem. Phys. 45 1464 Occurrence of a Phase Transition in Nucleic Acid Models
- (35) Bialas P, Burda Z and Johnston D 1999 Nucl. Phys. B 542 413 Phase diagram of the mean field model of simplicial gravity
- (36) Bar A and Mukamel D 2014 J. Stat. Mech. P11001 Mixed order transition and condensation in an exactly soluble one dimensional spin model
- (37) Bar A, Majumdar SN, Schehr G and Mukamel D 2016 Phys. Rev. 93 052130 Exact extreme-value statistics at mixed-order transitions
- (38) Barma M, Majumdar SN and Mukamel D 2019 J. Phys. A 52 254001 Fluctuation-dominated phase ordering at a mixed order transition
- (39) Giacomin G 2007 Random polymer models (Imperial College Press: World Scientific)
- (40) Giacomin G 2011 Disorder and critical phenomena through basic probability models École d’été de probabilités de Saint-Flour Lect. Notes Math. Springer
- (41) Godrèche C and Luck JM 2001 J. Stat. Phys. 104 489 Statistics of the occupation time of renewal processes
- (42) Godrèche C Majumdar SN and Schehr G 2015 J. Stat. Mech. P03014 Statistics of the longest interval in renewal processes
- (43) Bardou F, Bouchaud J P, Aspect A and Cohen-Tannoudji C 2002 Lévy Statistics and Laser Cooling (Cambridge: Cambridge University Press)
- (44) Barkai E 2003 Phys. Rev. Lett. 90 104101 Aging in Subdiffusion Generated by a Deterministic Dynamical System
- (45) J. Beltrán J and C. Landim C 2012 Probab. Theory Relat. Fields 152 781 Metastability of reversible condensed zero range processes on a finite set
- (46) Gnedenko B V and Kolmogorov A 1954 Limit Distributions for Sums of Independent Random Variables (Cambridge, Mass: Addison-Wesley)
- (47) Godrèche C and Luck JM 2001 Eur. Phys. J. B 23, 473 Nonequilibrium dynamics of the zeta urn model
- (48) Gumbel E J 1958 Statistics of Extremes (New York: Columbia University Press)
- (49) Gnedenko B V 1943 Ann. Math. 44 423 Sur la distribution limite du terme maximum d’une série aléatoire
- (50) Fréchet M 1927 Ann. Soc. Polon. Math. 6 93 Sur la loi de probabilité de l’écart maximum
- (51) Chistyakov VP 1964 Theor. Probab. Appl. 9 640 A theorem on sums of independent positive random variables and its applications to branching random processes
- (52) Dynkin EB 1955 Izv. Akad. Nauk. SSSR Ser. Math. 19 247; 1961 Selected Translations Math. Stat. Prob. 1 171 Limit theorems for sums of independent random quantities
- (53) Lamperti J 1958 Trans. Amer. Math. Soc. 88 380 An occupation time theorem for a class of stochastic processes
- (54) Lamperti J 1961 Am. Math. Soc. 12 724 A contribution to renewal theory
- (55) Höll M, Wang W and Barkai E arXiv:2006.06253 Extreme value theory for constrained physical systems