Complete replacement of magnetic flux in a flux rope
during a coronal mass ejection
Abstract
Solar coronal mass ejections are the most energetic events in the Solar System. In their standard formation model, a magnetic flux rope builds up into a coronal mass ejection through magnetic reconnection that continually converts overlying, untwisted magnetic flux into twisted flux enveloping the pre-existing rope. However, only a minority of coronal mass ejections carry a coherent magnetic flux rope as their core structure, which casts doubt on the universality of this orderly wrapping process. Here we provide observational evidence of a different formation and eruption mechanism of a magnetic flux rope from an S-shaped thread, where its magnetic flux is fully replaced via flare reconnections. One of the footpoints of the sigmoidal feature slipped and expanded during the formation, and then moved to a completely new place, associated with the highly dynamical evolution of flare ribbons and a twofold increase in magnetic flux through the footpoint, during the eruption. Such a configuration is not predicted by standard formation models or numerical simulations and highlights the three-dimensional nature of magnetic reconnections between the flux rope and the surrounding magnetic field.
-
1
School of Earth and Space Sciences/CAS Center for Excellence in Comparative Planetology/CAS Key Laboratory of Geospace Environment, University of Science and Technology of China, Hefei 230026, China
-
2
Collaborative Innovation Center of Astronautical Science and Technology, Hefei, China
-
3
Institute of Physics & Kanzelhöhe Observatory for Solar and Environmental Research, University of Graz, 8010 Graz, Austria
-
4
Institute for the Study of Earth, Oceans, and Space, University of New Hampshire, Durham, NH 03824, USA
-
5
CAS Key Laboratory of Solar Activity, National Astronomical Observatories, Beijing 100101, China
-
6
School of Astronomy and Space Science, University of Chinese Academy of Sciences, Beijing 100049, China
-
7
Mengcheng National Geophysical Observatory, University of Science and Technology of China, Mengcheng 233500, China
-
8
Deep Space Exploration Laboratory, Hefei 230026, China
*E-mail: tygou@ustc.edu.cn; rliu@ustc.edu.cn
Introduction
Magnetic flux ropes (MFRs), which consist of twisted magnetic field lines, play a key role in understanding various phenomena in astrophysical, space and laboratory plasmas. In solar physics, MFRs have been widely accepted as a fundamental structure in solar eruptions 11, 12, which are accompanied by a rapid release of a huge amount of energy 3. Driven by solar eruptions, the space weather has become increasingly important for various technological systems in the modern society 4, which makes it essential to study the genesis and eruptive mechanism of solar MFRs.
MFRs on the Sun manifest as various observational features, such as filaments, hot channels, coronal cavities, and S-shaped loop bundles known as sigmoids 5, 6, 7. A coherent MFR could either be present prior to the eruption 8, 9 or form by magnetic reconnection within a sheared arcade during the eruption 5, 11. The two different scenarios, which refer to two competing pre-eruption magnetic field configurations of solar eruptions, i.e., MFR versus sheared magnetic arcade 11, have been attracting great interest and under intense debate for decades. Recent observations reveal that a coherent MFR may build up upon a core ‘seed’ that is initiated from the coalescence of mini plasmoids in a pre-existing current sheet9, which gives a specific intermediate state between the two distinct configurations, i.e., a ‘hybrid’ state with a twisted core embedded in a sheared arcade 12.
The standard flare model describes the eruption of a pre-existing MFR, in which magnetic reconnection in the current sheet underneath adds field lines wrapping around the rising rope 13, 14, producing post-flare loops connecting two parallel flare ribbons on the surface. In consideration of three-dimensional (3D) reconnection occurring at quasi-separatrix layers (QSLs) that separate the MFR from the surrounding untwisted fields15, the two-dimensional (2D) standard model is extended to three dimensions, with the (quasi-)separatrix footprints of coronal magnetic fields mapped by double J-shaped flare ribbons 16, 17, 18: the straight sections of flare ribbons correspond to the footprints of the hyperbolic flux tube (a collection of two intersecting QSLs19) below the MFR, which is the 3D counterpart of the vertical current sheet in the 2D model; the endmost hooks correspond to the footprints of the QSLs wrapping around the MFR, therefore outlining its two feet anchored in the dense photosphere. Inside the hooks, coronal emission dims due to the evacuation of coronal matter along the rope’s legs during the eruption 20, 3, 22, 23. Thus, as the chromospheric imprint of coronal reconnections, motions and morphological changes of flare ribbons reflect the changes of coronal magnetic connectivities and the evolution of eruptive MFRs.
After solar eruptions, MFRs are sometimes detected in situ in interplanetary space and termed magnetic clouds (MCs), which are characterized by a large and smooth rotation in the field’s direction, enhanced magnetic field strength, a depressed proton temperature and density, and a low plasma 27, 28. However, only about one third of interplanetary coronal mass ejections (ICMEs) possess typical MFR features 24, in spite of their same origin from the Sun. This mismatch between the in-situ observation and the anticipation that all CMEs are essentially MFRs 27 is traditionally attributed to interactions among the ejecta and the solar wind as well as to unfavorable spacecraft trajectories within ejecta 28. But are there also other physical mechanisms that can account for some of the missing of well-structured MFRs that manifest as complex ejecta in interplanetary space?
Here we study the formation and eruption of a solar MFR in a sigmoidal active region. The combination of the low-atmosphere and coronal observations highlights the buildup of an MFR before the eruption and its subsequent restructuring during the eruption. The lower-atmosphere counterpart of the erupting structure exhibits a highly dynamic evolution while one of its feet migrates to a completely new place compared to the pre-eruption MFR, which indicates a complete replacement of magnetic fluxes in the rope. The restructuring of the MFR highlights the importance of 3D reconnections with the surrounding coronal magnetic fields during its the development into a CME, and sheds light on the implication of the complex dynamics occurring in the solar source active region for interplanetary ejecta.
Results
Overview of the event
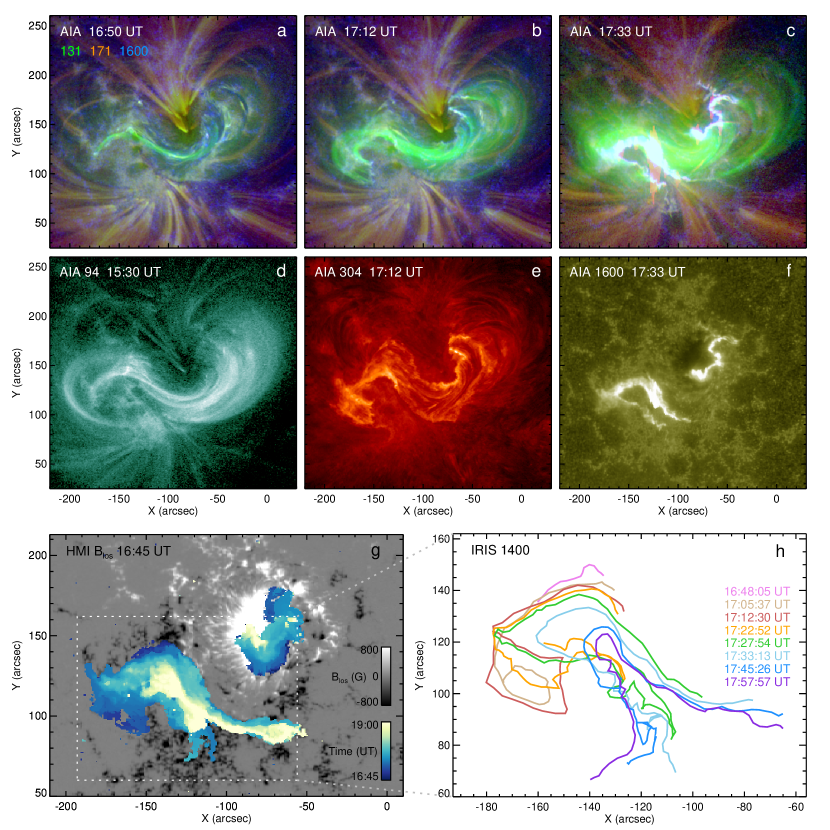
The eruption of interest occurs in the NOAA active region 12158 on 2014 September 10 near the solar disk center. The active region consists of a leading positive-polarity sunspot surrounded by negative polarities in the southeast, and it exhibits a typical sigmoidal configuration (Fig. 1; Supplementary Video 1). A bundle of inverse-S shaped loops is observed several hours before the eruption in the SDO/AIA (Methods) 94 Å channel (Fig. 1d; Supplementary Video 2). The eruption starts with the rise of a coherent sigmoidal structure as observed in AIA’s hot passbands (e.g., 131 Å; Fig. 1b; Supplementary Video 1), which is interpreted as an MFR in previous studies on the event 7, 30, 31. It produces a GOES X1.6-class (Methods) flare starting at 17:21 UT, and a fast halo coronal mass ejection (CME), which is detected as an ICME near the Earth two days after (Supplementary Note 1.3).
A sigmoidal MFR builds up from a thin thread in the core of a sheared magnetic arcade during the flare precursor phase (Fig. 1a,b), accompanied by footpoint brightening in the low solar atmosphere. The western foot of the pre-eruption MFR is located in positive polarities near the sunspot (Fig. 1g); the eastern foot in negative polarities is outlined by a low-atmosphere ribbon-like brightening (Fig. 1b,e). During the eruption, the same ribbon undergoes rapid and complex changes (Fig. 1c,f–h). Below we study in detail the formation of the sigmoid and its complex evolution during the eruption.
Appearance of the seed MFR
The eruptive sigmoid originally appears as a brightening inverse-S shaped thread in SDO/AIA 131 Å at 16:45 UT (Figs. 2&3), when the GOES 1–8 Å flux starts to rise slowly (Fig. 4a). The brightening thread is co-spatial with a low-lying filament (Fig. 2d), which stays almost unperturbed during the MFR eruption (Extended Data Fig. 1; Supplementary Note 1.2). The filament is aligned along the main polarity inversion line (PIL) of the active region, where a number of bald-patch (BP) candidates are identified (Fig. 2f; Methods). Embedded in a bundle of sheared sigmoidal loops observed in AIA 94 Å (Fig. 2c) and almost invisible in other cool AIA channels such as 211, 193 and 171 Å, the S-shaped thread has a mean temperature of about 7 MK with a dominant hot emission measure (EM) component at 6.7–7.0, according to the differential emission measure (DEM) distribution sampled on the thread (labeled ‘S’ in Fig. 3; Methods). The EM loci curves of six extreme-ultraviolet (EUV) channels from the thread form an envelope over the multi-peak DEM distribution (Fig. 3b; Methods), corroborating the DEM result. The reference DEM distribution sampled from a nearby region off the thread (labeled ‘R’ in Fig. 3) shows similar cool EM components at 5.5–6.6 but much weaker EMs at 6.7–7.0, confirming the presence of hot plasmas in the thread. The newly appeared hot thread is later observed to continually grow into the eruptive sigmoid, hence is termed a ‘seed’ MFR hereafter 9, 12.
Buildup of the MFR
As soon as it appears, the seed MFR further extends its “elbows” of the inverse-S shape and grows thicker (Extended Data Fig. 2; Supplementary Video 3) from several Mm to 30 Mm within the next 35 min before the eruption, as can be seen in the stack plot made from the virtual slit S1 across the sigmoid (Fig. 4c & Extended Data Fig. 2a; Methods). The growth of the seed MFR is associated with a slow rise in the GOES 1–8 Å SXR flux (Fig. 4a), before the onset of intense energy release at 17:21 UT. DEM analysis evidences intense heating during the formation of the MFR (Extended Data Fig. 3; Supplementary Note 1.1).
With the development of the MFR, significant pre-flare ribbon brightenings in the low atmosphere are observed by both SDO/AIA and IRIS (Extended Data Fig. 2; Supplementary Video 3). As the seed MFR extends to form a complete inverse-S shape, a trapezoid-shaped ribbon is spawned from the far end of the eastern ribbon (Extended Data Fig. 2). The spawning process is demonstrated in the stack plots of the virtual slits S2 and S3 (Fig. 4d,e & Extended Data Fig. 2d; Methods). The trapezoidal ribbon shows a fast and then slow expansion, which is associated with the fast and then slow widening of the coherent sigmoid observed in AIA 131Å (Fig. 4c–e). Comparing AIA 131 Å and IRIS 1400 Å images at about 17:12 UT (Fig. 5a,d & Extended Data Fig. 2), one can see that the trapezoidal ribbon is the footpoints of coronal loops belonging to the sigmoidal MFR. That the expansion of the trapezoidal ribbon is accompanied by the sigmoid thickening argues strongly for the development of a twisted MFR 2, 3. During this phase, the instantaneous slipping motion proceeds almost perpendicularly to the overall direction of the ribbon extension, which is described as “squirming” motions in a previous study 30. During the flare precursor phase, the rate of the magnetic reconnection that contributes to the MFR buildup is estimated to vary around (Fig. 4b; Methods), a few times lower than, but still on the same magnitude as, that during the MFR eruption.
Ribbon evolution during eruption
Shortly after being well developed, the MFR erupts to produce an intense X-class flare. The flare ribbon in the positive polarity region (PR) remains relatively stationary (Fig. 1g, Extended Data Fig. 4b), probably due to its proximity to the sunspot where the strong magnetic field is relatively “rigid”; the ribbon in the negative polarity region (NR), which is associated with the eastern foot of the MFR, evolves greatly and rapidly during the eruption (Fig. 1g,h & Extended Data Fig. 4; Supplementary Video 3).
From about 17:18 UT, NR’s hook changes from a closed to an open morphology (Fig. 5, Extended Data Fig. 4; Supplementary Video 3). As the ribbon moves, it sweeps the trapezoidal ribbon that encloses the eastern foot of the pre-eruption MFR. During the eruption, both ends of NR elongate rapidly southwestwards, and the whole ribbon develops into an horseshoe shape (Extended Data Fig. 4). The northern branch of NR (NRn), which host negative footpoints of post-flare loops, extends rapidly along the direction of the main PIL; the motion is associated with the strong-to-weak shear transition of the post-flare arcade observed in AIA (Extended Data Fig. 4; Supplementary Video 3). Sometimes NRn itself shows two parallel branches in IRIS 1400 Å (e.g., at 17:33 UT; Extended Data Fig. 4d), but they are not resolved in AIA 1600 Å observations. The southern part of the horseshoe-shaped ribbon (NRs) completes the hooked part of NR, which supposedly maps the footprint of the QSLs that wrap around the erupting MFR 20.
In particular, NRs exhibits irregular, complex motions (Fig. 1h; Supplementary Video 3). It zigzags towards southwest, in a serpentine fashion. The stack plot of the virtual slit S4 across the horseshoe-shaped ribbon (Extended Data Fig. 4d) nicely shows the zigzag motions of NRs, which leave irregular trails, distinct from the rather smooth track left by NRn (Fig. 4f). As the eruption proceeds, the horseshoe shape is stretched, but its opening becomes wider, where coronal dimmings develop (Fig. 5, Extended Data Fig. 4). During the flare decay phase, NRs fades away, and only NRn remains visible in AIA 1600 Å images (Figs. 1g&4f). During the eruption, some bright knots are observed to distribute quasi-periodically and move along the ribbon, which may indicate that the slipping reconnection proceeds quasi-periodically 33.
The ribbon brightening in IRIS SJI 1400 Å images shows three phases of temporal evolution (Fig. 6), i.e., 1) the development of the trapezoidal ribbon from 16:45 to 17:18 UT, 2) the change of NR’s hook from a closed to an open morphology from 17:18 to 17:26 UT, and 3) the evolution of the horseshoe-shaped NR afterwards. It is remarkable that most of the region enclosed by the trapezoidal ribbon (marked by orange dotted lines in Fig. 6) that is swept during the first phase is swept again during the second phase (as shown in blue in Fig. 6d), which suggests that the reconnections taking place during the second phase must have involved most of the magnetic flux in the MFR formed during the first phase. It is also remarkable that NRn, the ribbon segment that hosts the negative footpoints of flare loops, only appears during the third phase (Fig. 6c,d). In contrast, in a different event featuring an MFR under formation during the eruption 3, the two straight flare ribbons appear first and later extend and develop a closed hook at the far end of each ribbon, enclosing the rope’s two feet.
Association with coronal dimming
Enclosed by flare ribbons, two dimming regions are observed in cool AIA EUV passbands (Extended Data Fig. 5), indicative of coronal mass loss along two feet of the CME. The dimming in negative polarities as enclosed by NR is evident in AIA 335 Å images, and it migrates as the MFR erupts (Fig. 5b,c; Extended Data Fig. 4c; Supplementary Video 4). The dimming lightcurve (Fig. 4a; Methods) shows that coronal dimming around NR starts to develop from 17:10 UT onward, when the MFR is well developed as characterized by its eastern foot being fully outlined by a trapezoidal ribbon. However, the initial dimming is not enclosed by, but located outside, the trapezoid (Fig. 6e; Methods). During the eruption, in spite of strong diffraction patterns in AIA images, the dimming intensifies as shown by the 335 Å lightcurve (Fig. 4a). The coronal dimming mainly occupies within the horseshoe-shaped ribbon, close to the NRs side (Fig. 6f,g). As the horseshoe shape of NR is stretched, the dimming region is mainly concentrated in the opening of the horseshoe after 17:50 UT (Fig. 6h), and it stays quasi-stationary thereafter during the long-duration decay phase (Supplementary Video 4). A conjugated pair of dimmings are identified on both the northern and southern sides of the post-flare arcade during the late decay phase (Extended Data Fig. 6). Corresponding to the extended decreasing brightness (Fig. 4a; Methods), these dimmings continue to map the two footpoints of the CME, whose connection settles in the north-south direction (Extended Data Fig. 6d), in contrast to the orientation of the pre-eruption MFR that is mainly along the east-west direction (Extended Data Fig. 6a).
Combining the evolution of flare ribbon and coronal dimming (Fig. 6), we conclude that the eastern foot of the MFR undergoes a drastic migration during the eruption. The centroid of magnetic fluxes through the foot is shifted by about 70′′ during the impulsive eruption (Fig. 6h; Methods). Its average migrating speed is about 26 km s-1, significantly faster than the typical Alfvén speed in the lower solar atmosphere (10 km s-1) and the typical speed of photospheric flows (1 km s-1). Considering the irregular and highly dynamic motions of the ribbon hook (Fig. 1h; Supplementary Video 3), the instantaneous migrating speed would also be irregular and most likely bursty. The magnetic flux through the foot, which gives an estimation of the toroidal flux of the rope, increases from about Mx to Mx during the flare impulsive phase (Methods). Thus, the substantial displacement of and the associated twofold increase in magnetic flux through the foot, strongly evidence a complete restructuring of the original MFR during its development into the CME. This is radically different from the continuous deformation and drifting of flux-rope footpoints found in previous studies 34, 35.
Discussion
To summarize, we investigated the formation and eruption of a sigmoidal MFR with coronal EUV and low-atmosphere UV observations. We observe that the coherent sigmoid builds up upon a slim S-shaped ‘seed’ loop beneath a sheared arcade within tens of minutes during the flare precursor phase (Fig. 2 & Extended Data Fig. 2). The buildup process is featured not only by the lengthening and thickening of the S-shaped seed in the AIA 131 Å passband, but also by its eastern footpoint slipping away from the core field and subsequently expanding into being enclosed by a trapezoidal ribbon in IRIS SJI 1400Å, which argues strongly for the development of a twisted MFR. During the eruption, the trapezoidal ribbon transforms into an open hooked one. But the open hooked region has little overlapping with the original trapzoidal region (Figs. 5&6), indicating that the eastern foot of the pre-existing MFR undergoes a drastic migration, which is associated with a twofold increase in magnetic flux through the rope’s foot. These observations substantiate a complete replacement of magnetic fluxes in the original MFR by flare reconnections during the impulsive phase.
During the eruption, the ribbon hook NRs, which maps the footprints of the MFR’s QSL boundary, exhibits complex patterns and evolves dynamically (Fig. 1h; Supplementary Video 3). It suggests that complicated reconnections take place at the coronal QSLs, such as between the MFR and the overlying arcade or within the MFR itself 36, 37, 34. The zigzag motions of NRs and repetitive brightenings at some locations inside the hook (Fig. 6; Supplementary Video 3), which are often associated with rapid changes of the hook shape (Fig. 1h), suggest that there is an intense competition between the reconnections that turn the arcade field (anchored outside the hook) into the rope field (anchored inside the hook) and those that turn the rope field back into (post-flare) arcade field 34, 35. The former reconnections build up the MFR, but the latter has the potential of eroding 34 or even disintegrating the original MFR. In our case, the former reconnections dominate over the latter, as indicated by the twofold increase of magnetic flux through the rope, but their competition drives the migration of the pre-eruption MFR’s eastern foot to a completely new place during the eruption (Fig. 6).
The peak reconnection rate during the eruption is as high as Mx s-1 (Fig. 4b; Methods). In comparison with the toroidal flux through the flux rope, which is in the order of Mx, the total reconnected flux is about Mx (Methods; until 19:00 UT during the flare decay phase), which falls into top 5% of poloidal fluxes of MCs in statistical studies 38, 31. In addition, the total reconnected flux during the flare is as high as 66% of the unsigned magnetic fluxes in the active region, in the context of statistical results showing that no more than 50% of the total active-region flux is involved in the largest flares 40, 41.
This on-disk sigmoid event provides a top view of a sigmoid growing continually from a hot inverse-S shaped thread (Extended Data Fig. 2), which complements the side view of a limb eruption in a previous study 9 to substantiate the scenario that a large-scale MFR may build up from a small-scale seed rope, with the seed formation marking the sudden commencement of the transition from a sheared arcade to a CME MFR 12, 9, 42 (Supplementary Note 1.1). Since the footpoints of the pre-eruption MFR are distinct from those of the CME (Fig. 6, Extended Data Fig. 6), the eruptive scenario is different from the standard picture, in which flare reconnections build up a pre-existing MFR by turning untwisted arcade field lines into twisted field lines wrapping around the rope 14, 16, 18. In contrast, flare reconnections in the current observation that completely replace the magnetic flux of the pre-existing MFR are manifested as the highly dynamic motions of the hooked ribbon and the long-distance footpoint migration, which are also different from the continuous deformation and gradual drifting of the MFR footpoints as predicted by idealized 3D MHD simulations 18, 34.
Although these observations were neither anticipated by the standard picture nor reproduced in numerical simulations, they must be a consequence of 3D magnetic reconnection that is inherently built into the 3D extension of the standard model16, 17, 18, 20. As an important topological component in the 3D model, the hooked ribbon demonstrates complex changes and motions, which reveals new details about 3D magnetic reconnections that reshape the pre-existing MFR into the CME. Such a significant restructuring of pre-existent MFRs during eruptions would add another layer of difficulty to forecasting space weather, but may shed light on complex ejecta in interplanetary space (Supplementary Note 1.3).
Methods
Instruments and Data
The Atmospheric Imaging Assembly 43 (AIA) onboard the Solar Dynamics Observatory 44 (SDO) takes full-disk images of the Sun around the clock. The seven EUV channels, i.e., 131 Å (primarily from Fe XXI emission line, ), 94 Å (Fe XVIII, ), 335 Å (Fe XVI, ), 193 Å (primarily Fe XII, ), 211 Å (Fe XIV, ), 171 Å (Fe IX, ), and 304 Å (He II, ), obtain images with a spatial resolution of and a temporal cadence of 12 s. Two UV channels, 1600 Å (C IV line and continuum emission, ) and 1700 Å (continuum), obtain images with a temporal cadence of 24 s. AIA data are processed to level 1.5, and the heliographic maps are all rotated to 16:00 UT to correct the solar rotation.
The Helioseismic and Magnetic Imager 45 (HMI) onboard SDO measures the magnetic fields on the solar photosphere. We use HMI line of sight magnetograms to compare with heliographic observations by AIA and IRIS. To investigate the detailed magnetic configuration of the active region, we use the HMI active region patches (SHARP) vector magnetograms, which are taken every 12 minutes and remapped with the cylindrical equal area (CEA) projection, with a pixel scale of about 0.36 Mm. At the PIL of the active region which is identified by the contour of , we search for the existence of bald patches (BPs; Fig. 2f) by employing the criterion 46, 47, where magnetic field vectors are directed from negative to positive polarities and the field line is tangential to the photosphere and concave upward. BPs are topological structures known to be favorable for the formation of current sheets and therefore for the occurrence of magnetic reconnection (see also Supplementary Note 1.2).
The Interface Region Imaging Spectrograph (IRIS)48 captures the formation and eruption phase of the event before 17:58 UT. The Slit Jaw Imager (SJI) obtains images with a 19-s cadence and a spatial resolution as high as over a field of view (FOV) of , which fortuitously covers the eastern foot of the MFR (Supplementary Video 3). IRIS level-2 data of SJI Si IV 1400 Å passband ( 4.9, forming in the transition region) are used in the study. The superior spatiotemporal resolution of IRIS is key to this study; e.g., it registers brightening in 1400 Å around the eastern footpoint of the seed MFR as soon as it appears in EUV at 16:45 UT (Fig. 2e), suggestive of simultaneous heating in the low atmosphere. However, the brightening is too thin to be clearly resolved by AIA ultraviolet (UV) channels during this early phase. The subsequent footpoint evolution of the seed MFR is resolved by both IRIS and SDO/AIA, but the morphology and evolution of flare ribbons are better resolved by IRIS both temporally and spatially. IRIS observations hence serve as a reference and guide for our identification of flare ribbons observed by AIA. Together, IRIS and AIA observations make it possible to estimate the pre-flare reconnection rate (see below), which is rarely given in the literature.
To characterize the temporal evolution, we place four virtual slits (S1–S4; Extended Data Figs. 2&4) in SDO/AIA and IRIS images and generate the time–distance stack plots (Fig. 4c–f). S1 is put across the sigmoid in SDO/AIA 131 Å images (Extended Data Fig. 2a), with a length of 76 Mm, averaged over 6 AIA pixels. S2 and S3 are across the trapezoid-shaped ribbon in IRIS 1400 Å (Extended Data Fig. 2d), with a length of 47 and 59 Mm, respectively, averaged over 10 IRIS pixels. S4 is across the horseshoe-shaped ribbon in IRIS 1400 Å (Extended Data Fig. 4d), with a length of 45 Mm, averaged over 10 pixels. Stack plots of S2–S4 after 17:58 UT are generated from SDO/AIA 1600 Å images at the same locations, when there are no IRIS observations.
The Geostationary Operational Environmental Satellite (GOES) spacecraft operates in geosynchronous orbit and measures the solar soft X-ray flux in units of . The classification of solar flares uses the letters A, B, C, M, or X according to the peak flux in 1–8 Å as measured by GOES, with each letter representing a 10-fold increase in flux.
DEM analysis
SDO/AIA’s six optically thin EUV passbands (except for 304 Å) are used for differential emission measure (DEM) analysis to study the temperature characteristics. The AIA data are further processed to level 1.6 before being fed into the DEM code. Here we used the sparse inversion code 49, which has been further modified to optimize solutions for hot plasmas above a few MK50. DEMs are calculated in the temperature range of = 5.5–7.5 with an interval of = 0.05, and a DEM-weighted mean temperature, , is also derived 51. DEM uncertainties are obtained by 250 times of Monte Carlo simulations. We also computed the EM loci curves () of a sampled region using the observed intensities and temperature response functions from the six AIA channels.
Identification of ribbon and coronal dimming
To characterize the ribbon evolution, we identify the low-atmosphere ribbon by counting brightened pixels in SDO/AIA UV channels (Fig. 1g) and IRIS SJI 1400 Å passbands (Fig. 6), respectively. During the precursor phase, flare brightening in AIA 1600 Å is too weak to be clearly distinguished from chromospheric plages, thus we use the ratio of AIA 1600 Å and 1700 Å passbands to enhance the ribbon brightening 30 (Extended Data Fig. 2; Supplementary Video 3). After the flare onset at 17:21 UT, only AIA 1600 Å passband is used. To best identify the flare ribbons, different threshold values are set during different evolutionary phases.
The identified ribbon pixels in SDO/AIA are used to calculate the reconnection flux (Fig. 4b), after being projected onto a pre-flare SDO/HMI SHARP map with the CEA projection. We measured the instantaneous reconnection flux by summing up magnetic fluxes swept by newly brightened ribbon pixels, and estimated the uncertainties by the difference of the measured magnetic flux in positive and negative polarities. Integrating the instantaneous reconnection flux with respect to time, we obtained the accumulative reconnection flux.
Compared to AIA, IRIS is superior in spatial resolution and dynamic range, though it has a limited field of view mainly covering the ribbon of negative polarity (Extended Data Figs. 2 & 4, Supplementary Video 3). We manually traced the bright ribbon fronts observed in IRIS 1400 Å at selected time instants to highlight the complex patterns and irregular motions (Fig. 1h).
Coronal dimming around the ribbon NR are evident and migrate in SDO/AIA 335 Å passband during the MFR eruption (Extended Data Fig. 4; Supplementary Video 4). To study the dimming evolution, we identified dimmings as the pixels whose brightness decreases compared to that before the eruption (we refer to 16:20 UT for the event; Fig. 6e–h), and took the average brightness to obtain the 335 Å dimming lightcurve (Fig. 4a). For the conjugated pair of post-eruption dimmings detected at the footpoints of large-scale overlying loops (Extended Data Fig. 6d), we sampled intensities at two representative locations in SDO/AIA 171 Å (‘DS’ and ‘DN’ in Extended Data Fig. 6d, ) to show their temporal evolution (Fig. 4a).
To quantitatively study the footpoint migration, we compare two time instants before and after the eruption as an illustration, when the eastern foot of the MFR is well defined; i.e., at about 17:18 UT when it is enclosed by a trapezoidal ribbon (Fig. 6a), and after 17:50 UT when it is marked by the coronal dimming that is concentrated in the opening of the ribbon hook (e.g., Fig. 6h). One can see that the centroid of magnetic fluxes within the foot migrates from about [-167′′, 111′′] to [-108′′, 76′′] (Fig. 6h), which is shifted by about 70′′ with an average migrating speed of about 26 km s-1. The magnetic flux through the foot changes from about Mx to Mx accordingly, which increases nearly twofold. While the foot boundary is difficult to determine at other times during the eruption, the substantial displacement of the foot and the increase of magnetic flux through it strongly evidence a complete restructuring of the original MFR during its development into the CME.
Data availability
The data used in the study are publicly available for download from the corresponding mission archives. SDO data are available at http://jsoc.stanford.edu/ajax/lookdata.html; IRIS data are available at https://iris.lmsal.com/data.html.
Acknowledgments
We acknowledge SDO and IRIS teams for the science data. IRIS is a NASA small explorer mission developed and operated by LMSAL with mission operations executed at NASA Ames Research Center and major contributions to downlink communications funded by ESA and the Norwegian Space Centre. T.G. thanks the BBSO staff for providing H data. T.G., R.L., W.W., M.X., and Y.M. acknowledge the support from National Natural Science Foundation of China (NSFC 42188101, 42274204, 11903032, 11925302, 12003032) and the Strategic Priority Program of the Chinese Academy of Sciences (XDB41030100). A.M.V. acknowledges the Austria Science Fund (FWF): project I-4555N. T.L. acknowledges the support from NSFC 12222306. T.G. also acknowledges the support from CAS Key Laboratory of Solar Activity.
Author contributions
T.G. and R.L. led the study and analysis, interpreted the data, and wrote the manuscript. A.M.V. discussed the analysis and contributed to the interpretation, conclusion and writing of the manuscript. B.Z. led the in-situ data analysis and discussed the interpretation. T.L. and Y.W. discussed the results and contributed to the interpretation. W.W. and M.X. contributed to the SDO and in-situ data analyses. All authors participated in the discussion and contributed to finalizing the manuscript.
Competing interests
The authors declare no competing interests.


References
- [1] Patsourakos, S. et al. Decoding the Pre-Eruptive Magnetic Field Configurations of Coronal Mass Ejections. Space Sci. Rev. 216, 131 (2020).
- [2] Liu, R. Magnetic flux ropes in the solar corona: structure and evolution toward eruption. Research in Astronomy and Astrophysics 20, 165 (2020).
- [3] Priest, E. R. & Forbes, T. G. The magnetic nature of solar flares. Astron. Astrophys. Rev. 10, 313–377 (2002).
- [4] Temmer, M. Space weather: the solar perspective. Living Reviews in Solar Physics 18, 4 (2021).
- [5] Cheng, X., Guo, Y. & Ding, M. Origin and Structures of Solar Eruptions I: Magnetic Flux Rope. Science China Earth Sciences 60, 1383–1407 (2017).
- [6] Schmieder, B., Aulanier, G. & Vršnak, B. Flare-CME Models: An Observational Perspective (Invited Review). Solar Phys. 290, 3457–3486 (2015).
- [7] Green, L. M., Török, T., Vršnak, B., Manchester, W. & Veronig, A. The Origin, Early Evolution and Predictability of Solar Eruptions. Space Sci. Rev. 214, 46 (2018).
- [8] Zhang, J., Cheng, X. & Ding, M.-D. Observation of an evolving magnetic flux rope before and during a solar eruption. Nature Communications 3, 747 (2012).
- [9] Patsourakos, S., Vourlidas, A. & Stenborg, G. Direct Evidence for a Fast Coronal Mass Ejection Driven by the Prior Formation and Subsequent Destabilization of a Magnetic Flux Rope. Astrophys. J. 764, 125 (2013).
- [10] Moore, R. L., Sterling, A. C., Hudson, H. S. & Lemen, J. R. Onset of the Magnetic Explosion in Solar Flares and Coronal Mass Ejections. Astrophys. J. 552, 833–848 (2001).
- [11] Karpen, J. T., Antiochos, S. K. & DeVore, C. R. The Mechanisms for the Onset and Explosive Eruption of Coronal Mass Ejections and Eruptive Flares. Astrophys. J. 760, 81 (2012).
- [12] Gou, T., Liu, R., Kliem, B., Wang, Y. & Veronig, A. M. The Birth of A Coronal Mass Ejection. Science Advances 5, 7004 (2019).
- [13] Kopp, R. A. & Pneuman, G. W. Magnetic reconnection in the corona and the loop prominence phenomenon. Solar Phys. 50, 85–98 (1976).
- [14] Lin, J. & Forbes, T. G. Effects of reconnection on the coronal mass ejection process. J. Geophys. Res. 105, 2375–2392 (2000).
- [15] Démoulin, P. Extending the concept of separatrices to QSLs for magnetic reconnection. Advances in Space Research 37, 1269–1282 (2006).
- [16] Aulanier, G., Janvier, M. & Schmieder, B. The standard flare model in three dimensions. I. Strong-to-weak shear transition in post-flare loops. Astron. Astrophys. 543, A110 (2012).
- [17] Aulanier, G. et al. The standard flare model in three dimensions. II. Upper limit on solar flare energy. Astron. Astrophys. 549, A66 (2013).
- [18] Janvier, M., Aulanier, G., Pariat, E. & Démoulin, P. The standard flare model in three dimensions. III. Slip-running reconnection properties. Astron. Astrophys. 555, A77 (2013).
- [19] Titov, V. S., Hornig, G. & Démoulin, P. Theory of magnetic connectivity in the solar corona. Journal of Geophysical Research (Space Physics) 107, 1164 (2002).
- [20] Janvier, M. et al. Electric Currents in Flare Ribbons: Observations and Three-dimensional Standard Model. Astrophys. J. 788, 60 (2014).
- [21] Wang, W. et al. Buildup of a highly twisted magnetic flux rope during a solar eruption. Nature Communications 8, 1330 (2017).
- [22] Veronig, A. M., Gömöry, P., Dissauer, K., Temmer, M. & Vanninathan, K. Spectroscopy and Differential Emission Measure Diagnostics of a Coronal Dimming Associated with a Fast Halo CME. Astrophys. J. 879, 85 (2019).
- [23] Xing, C., Cheng, X. & Ding, M. D. Evolution of the Toroidal Flux of CME Flux Ropes during Eruption. The Innovation 1, 100059 (2020).
- [24] Burlaga, L., Sittler, E., Mariani, F. & Schwenn, R. Magnetic loop behind an interplanetary shock: Voyager, Helios, and IMP 8 observations. J. Geophys. Res. 86, 6673–6684 (1981).
- [25] Klein, L. W. & Burlaga, L. F. Interplanetary magnetic clouds at 1 AU. J. Geophys. Res. 87, 613–624 (1982).
- [26] Chi, Y. et al. Statistical Study of the Interplanetary Coronal Mass Ejections from 1995 to 2015. Solar Phys. 291, 2419–2439 (2016).
- [27] Vourlidas, A., Lynch, B. J., Howard, R. A. & Li, Y. How Many CMEs Have Flux Ropes? Deciphering the Signatures of Shocks, Flux Ropes, and Prominences in Coronagraph Observations of CMEs. Solar Phys. 284, 179–201 (2013).
- [28] Song, H. Q. et al. Do All Interplanetary Coronal Mass Ejections Have a Magnetic Flux Rope Structure Near 1 au? Astrophys. J. Lett. 901, L21 (2020).
- [29] Cheng, X., Ding, M. D. & Fang, C. Imaging and Spectroscopic Diagnostics on the Formation of Two Magnetic Flux Ropes Revealed by SDO/AIA and IRIS. Astrophys. J. 804, 82 (2015).
- [30] Dudík, J. et al. Slipping Magnetic Reconnection, Chromospheric Evaporation, Implosion, and Precursors in the 2014 September 10 X1.6-Class Solar Flare. Astrophys. J. 823, 41 (2016).
- [31] Zhao, J. et al. Hooked Flare Ribbons and Flux-rope-related QSL Footprints. Astrophys. J. 823, 62 (2016).
- [32] Démoulin, P., Priest, E. R. & Lonie, D. P. Three-dimensional magnetic reconnection without null points 2. Application to twisted flux tubes. J. Geophys. Res. 101, 7631–7646 (1996).
- [33] Li, T. & Zhang, J. Quasi-periodic Slipping Magnetic Reconnection During an X-class Solar Flare Observed by the Solar Dynamics Observatory and Interface Region Imaging Spectrograph. Astrophys. J. Lett. 804, L8 (2015).
- [34] Aulanier, G. & Dudík, J. Drifting of the line-tied footpoints of CME flux-ropes. Astron. Astrophys. 621, A72 (2019).
- [35] Dudík, J., Lörinčík, J., Aulanier, G., Zemanová, A. & Schmieder, B. Observation of All Pre- and Post-reconnection Structures Involved in Three-dimensional Reconnection Geometries in Solar Eruptions. Astrophys. J. 887, 71 (2019).
- [36] van Driel-Gesztelyi, L. et al. Coronal Magnetic Reconnection Driven by CME Expansion—the 2011 June 7 Event. Astrophys. J. 788, 85 (2014).
- [37] Török, T. et al. Sun-to-Earth MHD Simulation of the 2000 July 14 “Bastille Day” Eruption. Astrophys. J. 856, 75 (2018).
- [38] Qiu, J., Hu, Q., Howard, T. A. & Yurchyshyn, V. B. On the Magnetic Flux Budget in Low-Corona Magnetic Reconnection and Interplanetary Coronal Mass Ejections. Astrophys. J. 659, 758–772 (2007).
- [39] Wang, Y., Zhou, Z., Shen, C., Liu, R. & Wang, S. Investigating plasma motion of magnetic clouds at 1 AU through a velocity-modified cylindrical force-free flux rope model. Journal of Geophysical Research (Space Physics) 120, 1543–1565 (2015).
- [40] Kazachenko, M. D., Lynch, B. J., Welsch, B. T. & Sun, X. A Database of Flare Ribbon Properties from the Solar Dynamics Observatory. I. Reconnection Flux. Astrophys. J. 845, 49 (2017).
- [41] Tschernitz, J., Veronig, A. M., Thalmann, J. K., Hinterreiter, J. & Pötzi, W. Reconnection Fluxes in Eruptive and Confined Flares and Implications for Superflares on the Sun. Astrophys. J. 853, 41 (2018).
- [42] Jiang, C. et al. A fundamental mechanism of solar eruption initiation. Nature Astronomy 5, 1126–1138 (2021).
- [43] Lemen, J. R. et al. The Atmospheric Imaging Assembly (AIA) on the Solar Dynamics Observatory (SDO). Solar Phys. 275, 17–40 (2012).
- [44] Pesnell, W. D., Thompson, B. J. & Chamberlin, P. C. The Solar Dynamics Observatory (SDO). Solar Phys. 275, 3–15 (2012).
- [45] Schou, J. et al. Design and Ground Calibration of the Helioseismic and Magnetic Imager (HMI) Instrument on the Solar Dynamics Observatory (SDO). Solar Phys. 275, 229–259 (2012).
- [46] Titov, V. S., Priest, E. R. & Demoulin, P. Conditions for the appearance of “bald patches” at the solar surface. Astron. Astrophys. 276, 564 (1993).
- [47] Titov, V. S. & Démoulin, P. Basic topology of twisted magnetic configurations in solar flares. Astron. Astrophys. 351, 707–720 (1999).
- [48] De Pontieu, B. et al. The Interface Region Imaging Spectrograph (IRIS). Solar Phys. 289, 2733–2779 (2014).
- [49] Cheung, M. C. M. et al. Thermal Diagnostics with the Atmospheric Imaging Assembly on board the Solar Dynamics Observatory: A Validated Method for Differential Emission Measure Inversions. Astrophys. J. 807, 143 (2015).
- [50] Su, Y. et al. Determination of Differential Emission Measure from Solar Extreme Ultraviolet Images. Astrophys. J. Lett. 856, L17 (2018).
- [51] Gou, T., Liu, R. & Wang, Y. Do All Candle-Flame-Shaped Flares Have the Same Temperature Distribution? Solar Phys. 290, 2211–2230 (2015).
Supplementary Information
Complete replacement of magnetic flux in a flux rope
during a coronal mass ejection
Tingyu Gou1∗, Rui Liu1,2∗, Astrid M. Veronig3, Bin Zhuang4,
Ting Li5,6, Wensi Wang1,7, Mengjiao Xu1,8, Yuming Wang1,2,8
-
1
School of Earth and Space Sciences/CAS Center for Excellence in Comparative Planetology/CAS Key Laboratory of Geospace Environment, University of Science and Technology of China, Hefei 230026, China
-
2
Collaborative Innovation Center of Astronautical Science and Technology, Harbin, China
-
3
Institute of Physics & Kanzelhöhe Observatory for Solar and Environmental Research, University of Graz, 8010 Graz, Austria
-
4
Institute for the Study of Earth, Oceans, and Space, University of New Hampshire, Durham, NH 03824, USA
-
5
CAS Key Laboratory of Solar Activity, National Astronomical Observatories, Beijing 100101, China
-
6
School of Astronomy and Space Science, University of Chinese Academy of Sciences, Beijing 100049, China
-
7
Mengcheng National Geophysical Observatory, University of Science and Technology of China, Mengcheng 233500, China
-
8
Deep Space Exploration Laboratory, Hefei 230026, China
*E-mail: tygou@ustc.edu.cn; rliu@ustc.edu.cn
1 Supplementary Notes
1.1 Formation of the Sigmoidal Flux Rope
We observe in this event that a coherent sigmoidal flux rope builds up upon a slim S-shaped seed, which appears beneath a sheared arcade in the active region, accompanied by simultaneous ribbon-like brightenings in the low solar atmosphere (Fig. 2). The flux rope grows continually from the hot S-shaped seed within 30–40 minutes during the flare precursor phase (Extended Data Fig. 2). The buildup process manifests itself in the continual lengthening and thickening of the S-shaped loop in the AIA 131Å passband, and in its eastern footpoint slipping away from the core field and subsequently expanding into a trapezoidal ribbon in IRIS SJI 1400Å (Extended Data Fig. 2; Supplementary Video 3), which argues strongly for the development of a twisted magnetic flux rope 2, 3. While tether-cutting reconnections 4, 5 may help produce the S-shaped thread, as evidenced by the persistent flux cancellation 6 in this decayed active region 7, the subsequent growth of the sigmoid is mainly featured by the footpoint slippage (Extended Data Fig. 2; Supplementary Video 3), which suggests that 3D slipping reconnections 8 play an important role.
We studied the temperature characteristics of the sigmoid and its evolution via DEM analysis. The results (Extended Data Fig. 3; Methods) show that the flux rope structure has a mean temperature as high as 10 MK. The flux-rope plasma appears to consist of a hot core at 10–20 MK and a less hot envelope at 5–10 MK, subject to the confusion of the line-of-sight integration through the optically-thin corona. Before the seed flux rope appears (the left column in Extended Data Fig. 3), inverse-S shaped loops observed in AIA 94 Å are evident in the 5–10 MK temperature range. The DEM sampled from the sigmoidal flux rope (labeled as ‘S’ in Extended Data Fig. 3) shows that the hot DEM component with 6.8–7.2 increases greatly in magnitude with time, while the cooler components with 6.8 decrease. In comparison, the DEM sampled from a nearby location off the rope for reference (labeled as ‘R’) changes little with time. Thus, intense heating must be involved in the formation of the flux rope.
That the S-shaped thread continually grows into a bulky sigmoid and later into a CME (Supplementary Video 1) is reminiscent of the flux-rope buildup process reported in Gou et al. (2019) 9, in which a plasmoid at the upper tip of a pre-existent current sheet embedded in a sheared magnetic arcade continually grows into an oval-shaped bubble and later into a CME. Complementing the side view of the limb eruption on 2013 May 13 in Gou et al. (2019)9, the present on-disk sigmoidal eruption provides a top view of the flux rope formation process. The width of the seed thread is about 2–3′′ (Fig. 2), similar to the scale of the leading plasmoid in Gou et al. (2019)9. The temperature structures of the seeds in the two events are also similar, which contain significant hot emissions in the temperature range of 6.7–7.2 (Fig. 3b and Fig.2 in Gou et al. 20199). However, the mean temperature of the flux rope in the present event (Extended Data Fig. 3c) could be underestimated due to the contribution from a plethora of overlying loops above it. In addition, owing to the on-disk observation and the unprecedented resolution of IRIS, we observe lower-atmosphere brightenings that evolve synchronously with the development of the sigmoidal flux rope (Extended Data Fig. 2). Such brightenings map the footpoints of coronal magnetic field lines undergoing magnetic reconnection, but are seldom observed during the flare precursor phase 10, therefore providing valuable information on the flux-rope buildup process prior to the eruption, which complements the flux-rope buildup process during the eruption 3.
In contrast to two competing pre-eruption magnetic field configurations of CMEs, i.e., sheared arcade vs. flux rope 11, the observations that a large-scale flux rope initiates from a seed in both on-disk (e.g., the present study and Wang et al. 2017 3) and limb (e.g., Gou et al. 20199) events suggest a hybrid state with a tiny twisted core embedded in a sheared arcade 12. These observations confirm the speculation that there could exist a continuum of intermediate states between the two distinct magnetic configurations 11; however, it remains unclear how such an arcade-to-rope transition exactly occurs. The appearance of the seed in the hybrid scenario represents a sudden commencement of the transition from a sheared magentic arcade to a coherent flux rope that starts to build up upon the seed. The buildup process can occur either before (e.g., the event under study) or during the eruption 3, 9. The seed may be a key structure for the the production of highly twisted flux ropes 13 that are detected on the Sun 3 or in interplanetary space 14.
1.2 Partial Eruption
The central part of the pre-eruption flux rope is aligned with the main PIL of the active region, which is co-spatial with a filament observed in the H line center by the Big Bear Solar Observatory (BBSO; Fig. 2d and Extended Data Fig. 1). The filament remains intact beneath the post-flare arcade (Extended Data Fig. 1), which indicates a partial eruption of a double-decker structure in the active region. The lower branch, i.e., the filament, could be either supported by a sheared magnetic arcade or embedded in a flux rope 15. We find a number of candidate BP points at the photospheric PIL that is occupied by the filament (Fig. 2f). In addition, significant magnetic flux cancellation occurs around the PIL long before the eruption 7, which may produce the BP configuration of magnetic fields 6. Thus, the BPs may help hold down the filament 16. Both the dextral filament and the inverse S-shaped sigmoid are likely associated with negative magnetic helicity 17, 18, 19, which also agrees with the accumulation of negative helicity in the active region before the eruption 20.
A question arises as to how and when the double-decker configuration forms. The two branches of the double decker could be adhered to each other in equilibrium before the eruption but split near or during the eruption 21. In this event, we observed that the upper branch of the erupting flux rope originally appears as a shorter thread apparently superposing the low-lying filament (Fig. 2); its growth associated with footpoint slipping is characterized by the increase of SXR flux and footpoint brightening of chromospheric heating (Fig. 4 & Extended Data Fig. 2). The footpoint slippage suggests that 3D magnetic reconnection is responsible for the formation of the upper flux rope during the precursor phase before the eruption. Cheng et al. (2015) 7 suggests magnetic reconnection occurs in the low solar atmosphere based on the observed Doppler blue shifts. Such reconnections at the bald-patch separatrix surface (BPSS), which consists of magnetic field lines touching the BP points at the photosphere, may lead to the formation of a flux rope atop the structure associated with the filament 16, 22.
1.3 ICME Observation
The fast full halo CME produced by the sigmoid eruption arrives at the Earth two days after. The Advanced Composition Explorer (ACE) spacecraft observes an interplanetary coronal mass ejection (ICME) structure between Sep 12 22:30 UT and Sep 14 12:00 UT, preceded by a shock front driven by the ICME at 15:30 UT on Sep 12 (Supplementary Fig. 1). In-situ observations show ICME features 23 such as enhanced magnetic fields, decreases in proton number density, temperature and plasma (Supplementary Fig. 1). The bi-directional distribution of suprathermal electrons (Supplementary Fig. 1h) indicates that the interplanetary structure remains being magnetically connected to the Sun at both ends.
Some features of the ICME also conform to the MC criteria, and it is identified as an MC in a few ICME catalogs 24, 25, 26. However, it does not possess a typical flux-rope configuration. For instance, the magnetic field vectors do not exhibit a large () and smooth rotation as typically in MCs 27, 28 (Supplementary Fig. 1b & c). Instead, the in-situ observation reveals multiple discontinuities with jumps in both magnetic field and plasma parameters inside the ICME (marked by vertical dotted lines in Supplementary Fig. 1). Some flux-rope models were used to reconstruct the global magnetic configuration of the ICME. A circular-cylindrical analytical flux-rope model fitting, which was included in a statistical study, obtains a magnetic obstacle with an incomplete rotation less than 90∘ 25. A torus-shaped flux rope model fitting indicates that the spacecraft may skim the ICME flux rope, covering so small a field rotation that the ICME can be fitted under the assumption of either a left-handed or a right-handed helicity 29, 30. We also modeled the ICME with two state-of-the-art techniques but did not obtained reasonable results. We first used the velocity-modified cylindrical flux-rope models, adopting either a non-uniform (linear force-free model with Lundquist solution) 31 or a uniform (non-linear force-free model) 14 twisted magnetic field configuration. Both fittings match poorly with the observations (the normalized root-mean-square difference between the fitting results and observations ), especially for the magnetic field magnitudes and directions. We also used the Grad-Shafranov (GS) reconstruction technique 32, which does not presume any specific shape of the ICME cross section, but still failed to reconstruct a magnetic flux rope structure. The unsuccessful fittings might be due to limitations of the models, flank crossing of the spacecraft, or complex structures of the ICME itself.
In this event, the complete replacement of magnetic flux in the preformed flux rope in a drastic fashion makes it hard to imagine that the flux rope can preserve a well-organized structure during its development into the (I)CME. Indeed, the ICME does not possess a typical flux-rope configuration but multiple internal discontinuities (Supplementary Fig. 1). In-situ detected complex ejecta have been attributed to unfavorable spacecraft trajectories 33, interactions with other ejecta 34 or solar wind 35, and the complexity of pre-eruptive structures 36. Here we suggest that the complex flare reconnections that reshape the flux rope can also contribute to the complexity of the resultant ICME, which agrees with numerical experiments that produce an inherently complex CME 37 and may help understand why only about one third of ICMEs possess flux-rope configurations.

References
- [1]
- [2] Démoulin, P., Priest, E. R. & Lonie, D. P. Three-dimensional magnetic reconnection without null points 2. Application to twisted flux tubes. J. Geophys. Res. 101, 7631–7646 (1996).
- [3] Wang, W. et al. Buildup of a highly twisted magnetic flux rope during a solar eruption. Nature Communications 8, 1330 (2017).
- [4] van Ballegooijen, A. A. & Martens, P. C. H. Formation and Eruption of Solar Prominences. Astrophys. J. 343, 971 (1989).
- [5] Moore, R. L., Sterling, A. C., Hudson, H. S. & Lemen, J. R. Onset of the Magnetic Explosion in Solar Flares and Coronal Mass Ejections. Astrophys. J. 552, 833–848 (2001).
- [6] Green, L. M., Kliem, B. & Wallace, A. J. Photospheric flux cancellation and associated flux rope formation and eruption. Astron. Astrophys. 526, A2 (2011).
- [7] Cheng, X., Ding, M. D. & Fang, C. Imaging and Spectroscopic Diagnostics on the Formation of Two Magnetic Flux Ropes Revealed by SDO/AIA and IRIS. Astrophys. J. 804, 82 (2015).
- [8] Aulanier, G. et al. Slipping Magnetic Reconnection in Coronal Loops. Science 318, 1588 (2007).
- [9] Gou, T., Liu, R., Kliem, B., Wang, Y. & Veronig, A. M. The Birth of A Coronal Mass Ejection. Science Advances 5, 7004 (2019).
- [10] Wang, H. et al. High-resolution observations of flare precursors in the low solar atmosphere. Nature Astronomy 1, 0085 (2017).
- [11] Patsourakos, S. et al. Decoding the Pre-Eruptive Magnetic Field Configurations of Coronal Mass Ejections. Space Sci. Rev. 216, 131 (2020).
- [12] Liu, R. Magnetic flux ropes in the solar corona: structure and evolution toward eruption. Research in Astronomy and Astrophysics 20, 165 (2020).
- [13] Priest, E. R. & Longcope, D. W. Flux-Rope Twist in Eruptive Flares and CMEs: Due to Zipper and Main-Phase Reconnection. Solar Phys. 292, 25 (2017).
- [14] Wang, Y. et al. On the twists of interplanetary magnetic flux ropes observed at 1 AU. Journal of Geophysical Research (Space Physics) 121, 9316–9339 (2016).
- [15] Liu, R. et al. Slow Rise and Partial Eruption of a Double-decker Filament. I. Observations and Interpretation. Astrophys. J. 756, 59 (2012).
- [16] Gibson, S. E., Fan, Y., Török, T. & Kliem, B. The Evolving Sigmoid: Evidence for Magnetic Flux Ropes in the Corona Before, During, and After CMES. Space Sci. Rev. 124, 131–144 (2006).
- [17] Martin, S. F. Conditions for the Formation and Maintenance of Filaments (Invited Review). Solar Phys. 182, 107–137 (1998).
- [18] Rust, D. M. Magnetic Helicity in Solar Filaments and Coronal Mass Ejections. Washington DC American Geophysical Union Geophysical Monograph Series 111, 221 (1999).
- [19] Chen, P. F., Harra, L. K. & Fang, C. Imaging and Spectroscopic Observations of a Filament Channel and the Implications for the Nature of Counter-streamings. Astrophys. J. 784, 50 (2014).
- [20] Bi, Y. et al. Observation of a reversal of rotation in a sunspot during a solar flare. Nature Communications 7, 13798 (2016).
- [21] Kliem, B. et al. Slow Rise and Partial Eruption of a Double-decker Filament. II. A Double Flux Rope Model. Astrophys. J. 792, 107 (2014).
- [22] Gibson, S. E. & Fan, Y. Partially ejected flux ropes: Implications for interplanetary coronal mass ejections. Journal of Geophysical Research (Space Physics) 113, A09103 (2008).
- [23] Zurbuchen, T. H. & Richardson, I. G. In-Situ Solar Wind and Magnetic Field Signatures of Interplanetary Coronal Mass Ejections. Space Sci. Rev. 123, 31–43 (2006).
- [24] Chi, Y. et al. Statistical Study of the Interplanetary Coronal Mass Ejections from 1995 to 2015. Solar Phys. 291, 2419–2439 (2016).
- [25] Nieves-Chinchilla, T. et al. Unraveling the Internal Magnetic Field Structure of the Earth-directed Interplanetary Coronal Mass Ejections During 1995 - 2015. Solar Phys. 294, 89 (2019).
- [26] Richardson, I. G. & Cane, H. V. Near-Earth Interplanetary Coronal Mass Ejections During Solar Cycle 23 (1996 - 2009): Catalog and Summary of Properties. Solar Phys. 264, 189–237 (2010).
- [27] Burlaga, L., Sittler, E., Mariani, F. & Schwenn, R. Magnetic loop behind an interplanetary shock: Voyager, Helios, and IMP 8 observations. J. Geophys. Res. 86, 6673–6684 (1981).
- [28] Klein, L. W. & Burlaga, L. F. Interplanetary magnetic clouds at 1 AU. J. Geophys. Res. 87, 613–624 (1982).
- [29] Marubashi, K. & Cho, K. S. Non-Uniqueness of the Geometry of Interplanetary Magnetic Flux Ropes Obtained from Model-Fitting. Sun and Geosphere 10, 119–125 (2015).
- [30] Cho, K. S. et al. Impact of the Icme-Earth Geometry on the Strength of the Associated Geomagnetic Storm: The September 2014 and March 2015 Events. Journal of Korean Astronomical Society 50, 29–39 (2017).
- [31] Wang, Y., Zhou, Z., Shen, C., Liu, R. & Wang, S. Investigating plasma motion of magnetic clouds at 1 AU through a velocity-modified cylindrical force-free flux rope model. Journal of Geophysical Research (Space Physics) 120, 1543–1565 (2015).
- [32] Hu, Q. & Sonnerup, B. U. Ö. Reconstruction of magnetic clouds in the solar wind: Orientations and configurations. Journal of Geophysical Research (Space Physics) 107, 1142 (2002).
- [33] Zhang, J., Hess, P. & Poomvises, W. A Comparative Study of Coronal Mass Ejections with and Without Magnetic Cloud Structure near the Earth: Are All Interplanetary CMEs Flux Ropes? Solar Phys. 284, 89–104 (2013).
- [34] Burlaga, L. F., Plunkett, S. P. & St. Cyr, O. C. Successive CMEs and complex ejecta. Journal of Geophysical Research (Space Physics) 107, 1266 (2002).
- [35] Riley, P., Gosling, J. T. & Pizzo, V. J. A two-dimensional simulation of the radial and latitudinal evolution of a solar wind disturbance driven by a fast, high-pressure coronal mass ejection. J. Geophys. Res. 102, 14677–14686 (1997).
- [36] Awasthi, A. K., Liu, R., Wang, H., Wang, Y. & Shen, C. Pre-eruptive Magnetic Reconnection within a Multi-flux-rope System in the Solar Corona. Astrophys. J. 857, 124 (2018).
- [37] Lynch, B. J., Antiochos, S. K., DeVore, C. R., Luhmann, J. G. & Zurbuchen, T. H. Topological Evolution of a Fast Magnetic Breakout CME in Three Dimensions. Astrophys. J. 683, 1192–1206 (2008).
2 Supplementary Videos
-
Supplementary Video 1
SDO/AIA observation of the solar eruption near the disk center. The composite RGB images are made from AIA 131 Å (green), 171 Å (orange), and 1600 Å (blue) channels, which are sensitive to plasma temperatures of about 11, 0.7, and 0.1 MK, respectively.
-
Supplementary Video 2
SDO/AIA multi-wavelength observation starting from several hours before the eruption.
-
Supplementary Video 3
SDO/AIA and IRIS observation of the flux rope formation and eruption. IRIS’s FOV only covers the eastern part of the event, as indicated by the white dotted rectangle. Ratio of AIA 1600 and 1700 Å images are used to highlight the ribbon morphology during the precursor phase before 17:21 UT.
-
Supplementary Video 4
SDO/AIA 335 Å and its base ratio images featuring coronal dimmings during the solar eruption.