Clustering in laboratory and numerical turbulent swirling flows
Abstract
We study the three-dimensional clustering of velocity stagnation points, of nulls of the vorticity and of the Lagrangian acceleration, and of inertial particles in turbulent flows at fixed Reynolds numbers, but under different large-scale flow geometries. To this end, we combine direct numerical simulations of homogeneous and isotropic turbulence and of the Taylor-Green flow, with particle tracking velocimetry in a von Kármán experiment. While flows have different topologies (as nulls cluster differently), particles behave similarly in all cases, indicating that Taylor-scale neutrally buoyant particles cluster as inertial particles.
keywords:
1 Introduction
As is often the case in the study of complex systems, turbulence theory has flourished together with the development of laboratory and numerical methods. For homogeneous and isotropic turbulence (HIT), wind tunnel experiments (Taylor, 1938; Shen & Warhaft, 2002) and numerical simulations in periodic boxes (Kaneda et al., 2003; Buaria et al., 2019) have played central roles, allowing comparisons with the theory and pushing new ideas. Nonetheless, in non-homogeneous, or multi-phase flows, we lack such benchmarks that would allow a much needed comparison between theory, experiments, and simulations.
In recent years, the von Kármán swirling flow in the laboratory (Mordant et al., 2002, 2004; Volk et al., 2008; Poncet et al., 2008; Huck et al., 2017; Angriman et al., 2020), and the akin Taylor-Green flow in numerical simulations (Green & Taylor, 1937; Mininni et al., 2011; Kreuzahler et al., 2014), have provided ways to reach large Reynolds numbers in non-isotropic, non-homogeneous, and in many cases, multi-phase flow regimes. Comparisons of experiments and simulations showed that these flows, albeit differing in the forcing mechanism and boundary conditions, share geometrical (Huck et al., 2017; Mininni et al., 2011; Angriman et al., 2020), topological (Huck et al., 2017; Angriman et al., 2021), and statistical properties (Angriman et al., 2020) in both Eulerian and Lagrangian frameworks.
A step forward in these comparisons, that would allow a better understating of flow geometries and that has applications in multi-phase flows, is to study the geometrical properties of zeros and accumulation points (Goto & Vassilicos, 2006, 2008; Monchaux et al., 2010; Fiabane et al., 2013; Obligado et al., 2014; Mora et al., 2021). Moreover, the recent study by Mora et al. (2021) has performed a combined analysis of nulls spatial properties and inertial particles clustering via Voronoï tessellations. The stagnation points, sampled by inertial particles, have also been used to characterize 3D geometrical properties of HIT flows using the Rice theorem (Ferran et al., 2022). It is known that even in HIT, nulls of the velocity, vorticity, and of the Lagrangian acceleration do not distribute homogeneously in space, forming clusters (Goto & Vassilicos, 2006; Mora et al., 2021). In multi-phase flows, certain particles tend to accumulate preferentially in the vicinity of some of these zeros, affecting their mean free path, and ultimately altering relevant physical processes such as droplet formation in clouds, mixing of chemicals, and phase transitions. The effect of mean flows, and of flow anisotropy and inhomogeneity in the clustering of nulls of the flow vector fields and of particles is unclear and requires further investigation.
Furthermore, not all particles cluster, and it is still uncertain what parameters govern this phenomenon. Very small (i.e., of the size of the Kolmogorov scale) heavy particles display clustering (Obligado et al., 2019). No clustering has been observed for small (below the Taylor microscale, but larger than the Kolmogorov scale) neutrally buoyant particles in experiments of HIT (Fiabane et al., 2012), but clustering has been reported for large particles with sizes comparable to the flow integral scale in von Kármán experiments (Machicoane et al., 2014, 2016), and attributed to global preferential sampling of the particles of flow inhomogeneities. The intermediate regime, with neutrally buoyant particles of the size of the Taylor microscale has not been studied, and it is unclear whether clustering in such regime would take place, and in that case whether it be caused by large-scale flow sampling effects, or by inertial clustering mechanisms associated to the existence of certain topological points in the turbulent flow.
In this work we perform a numerical and experimental study of the clustering properties of different single- and two-phase turbulent swirling flows. To this aim, we study and compare the topology of different flows at similar Reynolds numbers (HIT, a Taylor Green flow, and a von Kármán experiment) using three-dimensional (3D) Voronoï tessellations of velocity stagnation points (STPS), zeros of the vorticity (WZEROs), and zeros of the Lagrangian acceleration (ZAPS), as well as the clustering of Taylor-scale neutrally buoyant particles (PART) in the von Kármán experiment. Finally, we compare the particles’ experimental results with numerical simulations using a minimal model of heavy point particles, to study whether the statistical properties of the clusters of Taylor-scale particles resemble known results of clustering mechanisms in inertial particles.

2 Description of the datasets and particle model
The von Kármán experiment (denoted herein as EXP) consists of two facing disks of diameter cm (equal to the forcing-based integral scale, ), with 8 straight blades each, separated by a vertical distance of cm. The impellers are in a cell of square cross-section of size cm3 (room is left at the back of the impellers for shafts to connect them to motors, and for refrigeration coils to remove heat), filled with distilled water from a double-pass reverse osmosis system. The accessible experimental volume, in between the two disks, is thus of cm3. Each impeller is driven by a brushless rotary Yaskawa SMGV-20D3A61 servomotor, with Yaskawa SGDV-8R4D01A servo controllers (see Angriman et al. (2020) for further details). The two impellers rotate in opposite directions with angular velocity ( rpm). This generates two large counter-rotating circulation cells producing, on average, a strong shear layer at the mid-plane between the disks. A secondary circulation in the axial direction is also generated by the impellers, resulting in a 3D turbulent flow with an anisotropic large-scale mean flow (depicted schematically in Fig. 1). We seeded this flow with inertial particles of radius mm, which are plastic spheres with density times the fluid density, 3D-printed using acrylonitrile butadiene styrene (ABS). The particles radius is such that and , with the Taylor microscale and the Kolmogorov length scale (see table 1 for definitions). Measurements of particles’ dynamics were carried out in a large observation volume of size , centered about the geometrical midpoint of the cell, using particle tracking velocimetry (PTV) with two high-speed Photron FASTCAM SA3 cameras at a sampling rate of fps. In total we have frames. In each frame the mean number of particles simultaneously recorded is , while their maximum recorded number is (note particles can exit and re-enter the observation volume, exploring also the regions behind the impellers).
| Dataset | Re | St | ||||||||||||
|---|---|---|---|---|---|---|---|---|---|---|---|---|---|---|
| S | Z | W | P | S | Z | W | P | |||||||
| EXP | - | - | - | 2.33 | - | - | - | 930 | ||||||
| TG | 4.09 | 2.69 | 2.81 | 2.84 | 152 | 39 | 22 | 47 | ||||||
| HIT | 317 | 5.41 | 3.24 | 3.17 | 4.15 | 215 | 49 | 25 | 46 | |||||
We also performed direct numerical simulations (DNSs) of the Navier-Stokes equations
| (1) |
where is the solenoidal fluid velocity field (, is the pressure per unit mass density, is the kinematic viscosity, and is an external volumetric mechanical forcing. Equations are written in dimensionless units based on a unit length and a unit velocity , and solved in a three-dimensional -periodic cubic box using a parallel pseudo-spectral method with the GHOST code (Mininni et al., 2011; Rosenberg et al., 2020). A fixed spatial resolution of grid points is used. To mimic the geometry of the large-scale flow in the von Kármán experiment, the external forcing is given by the Taylor-Green flow,
| (2) |
This forcing corresponds to a periodic array of counter-rotating large-scale vortices, which in the domain reduces to just two counter-rotating vortices separated vertically by a shear layer (see Fig. 1, where we call this domain a “VK cell” by analogy with the von Kármán flow). We also performed a simulation of homogeneous and isotropic turbulence (HIT) with random forcing, to compare against the TG DNS and EXP. The HIT simulation was performed following the same procedures used for the TG DNS, using a spatial resolution of grid points. Turbulence was sustained by injecting energy in all modes in the vicinity of the Fourier shell with wavenumber , with constant solenoidal amplitude and random phases, i.e., the forcing is given by
| (3) |
where denotes real part, is a unit vector, and is a random phase. The random phases for each mode are slowly evolved in time, with a correlation time of large-scale eddy turnover times. For the TG DNS the magnitude of the forcing wavenumber satisfies , so the forcing lengthscale is defined as , while for HIT , and then (see table 1 for relevant parameters).
In both simulations we integrate a minimal model of heavy inertial point particles, satisfying the effective equations of motion
| (4) |
where and are the particles velocity and Stokes time, respectively. As the particles radius in EXP is such that the Maxey-Riley approximation is not valid (see, e.g., Qureshi et al. (2007); Calzavarini et al. (2008); Volk et al. (2008) and Homann & Bec (2010) for detailed studies of limitations of this approximation, and of Eq. (4) in particular), and as the equations of motion of our particles are not known, Eq. (4) should be considered as a model with effective parameters, or as a reference model to compare against, to determine whether the clustering of the particles in the experiment resembles the one expected from clustering mechanisms in the case of inertial particles. Note also that, while higher-order terms in the particles radius of the full Maxey-Riley equations could be considered (for instance, considering added mass forces, as done by Calzavarini et al. (2008), or keeping Faxén corrections (Calzavarini et al., 2009) and Basset-Boussinesq forces (Brennen, 2005)), the particles in the experiment have , and therefore the perturbative expansion in in the Maxey-Riley approximation is not valid (indeed, neutrally buoyant particles slightly larger than in such approximation do not cluster, see, e.g., the studies in Calzavarini et al. (2008) and Reartes & Mininni (2021)). We thus regard Eq. (4) simply as an effective equation with only one tunable parameter. For a brief analysis of how other forces affect the clustering of particles, see Appendix A.
The tunable parameter in Eq. (4) depends on the Stokes number of the particles in EXP. For finite-size particles, it is known that their dynamics can depend on many parameters (Fiabane et al., 2012), and that the conventional definition of the Stokes number does not properly characterize the particles’ dynamics (Xu & Bodenschatz, 2008; Fiabane et al., 2012). Let us consider the Stokes number , where is the particle’s response time, and is some characteristic time of the flow. Using the standard definition of the viscous relaxation time of the particle (Cartwright et al., 2010),
| (5) |
where is the particle-to-fluid mass density ratio, and setting as the Kolmogorov time-scale , for the particles in EXP we obtain . This choice would result in particles almost decoupled from the fluid (i.e., with too much inertia) if used in Eq. (4).
To calculate an effective for EXP we then set the Stokes number as and we estimate an effective particle time as the turbulent turn-over time at the particle radius (Angriman et al., 2020). This choice can be understood as follows. For a spherical particle of radius and mass moving with velocity in a uniform velocity field , the drag force acting on the particle per unit mass can be estimated as (Batchelor, 2000)
| (6) |
where is the particle’s density and represents its surface. is the drag coefficient, which is a function of the particle Reynolds number, defined as . Then, Eq. (6) reads
| (7) |
which can be approximated as , with
| (8) |
where angle brackets denote time averages. For finite-size neutrally buoyant particles, Cisse et al. (2013) estimated , assuming Kolmogorov scaling and proposing a self-similar solution in the surroundings of the particle, and verified the validity of this estimation using DNSs. Substituting their result in Eq. (8) leads to
| (9) |
In EXP we can also estimate the particle-fluid slip velocity from the 3D r.m.s. flow and particles velocities (Bellani & Variano, 2012), which gives . For this value of , (Batchelor, 2000; Morrison, 2013), and then the dimensionless pre-factor ; thus, the particle response time can be interpreted as an effective time that takes into account the mean effect of non-linear drag corrections. This in turn yields . Other alternative definitions of the Stokes number have been introduced in the literature. For instance, Xu & Bodenschatz (2008) and Schmitt & Seuront (2008) propose to use , and to set as the turbulent dynamic time at the scale of the particle, i.e., . For the EXP data this yields , which is of the same order of magnitude as our estimation.
In the DNSs, is set equal to in units of (i.e., we set the same Stokes number St within statistical fluctuations). In other words, given the values of in the simulations, and of the Stokes number in the experiment, we set in Eq. (4) as . An effective radius of the particles in the DNSs can then be estimated consistently with Eq. (9) as , and to compute the value of reported in table 1 for the simulations we use and for each particle at every instant. Note both the experimental and numerical estimations of the Reynolds particle number yield Re, reinforcing the fact that models for particles of moderate size do not apply in our case, and that the equations for inertial particles in the DNSs should be understood only as a crude effective model. All the values of St and Rep for EXP, TG and HIT data are listed in table 1.
3 Results
3.1 Voronoï volumes probability distribution
Nulls of all vector fields were computed in the DNSs using the methods described in Haynes & Parnell (2007) and Mora et al. (2021). Using the positions of the zeros, and the particles’ positions in the experiment and DNSs, 3D Voronoï tesselations were computed for all datasets. While the DNSs use particles, in the experiment we have a maximum of particles in each frame, resulting in a significantly smaller number of closed 3D Voronoï cells: there are an average of 3 closed cells per snapshot. When considering all snapshots this results in a total number of closed cells of . Also, in DNSs, the tessellations were performed with periodic boundary conditions. These two observations will be relevant to interpret some of the results.
Figure 2 shows the PDFs of the normalized volumes of the Voronoï cells, , for STPS, ZAPS, and ZWEROs in TG and HIT, and the PDFs of the Voronoï cells for the particles in the DNSs and the experiment. For the experimental data, since the total number of particles fluctuates in time (as particles can enter or exit the observation volume , and as already mentioned, can explore regions behind the disks), is defined as the volume occupied by the fluid between the propellers divided by the mean number of particles per image, calculated from all of the available images. This choice is robust to variations in the number of particles (Fiabane et al., 2013), and to the presence of spurious volumes near the boundaries of the images as will be discussed later.
It has been hypothesized that the forcing mechanism or the large-scale flow can introduce changes in the clustering of nulls of the fluid vector fields (Goto & Vassilicos, 2009). This figure confirms this is indeed the case: HIT displays stronger clustering of all fields than TG (i.e., larger probabilities for small volumes). In the figures, the PDF resulting from a random Poisson process (herein RPP, corresponding to homogeneous distribution of nulls or particles) is shown as a reference. The larger standard deviation of the PDFs (compared to the RPP, whose standard deviation is ) and the stronger tails (of clusters to the left, and of voids to the right) indicate enhanced clustering. However, the Voronoï cell volumes of the particles is similar for the three flows, and notably, the level of clustering as quantified by is similar for TG and EXP (see table 1). As will be discussed next, differences between EXP and TG can be associated with finite sampling and with boundary effects.

In Fig. 2 we also show an exponential and a -5/3 power law to serve only as references for the comparison. Note STPS in HIT are more similar to the power law in the vicinity of (i.e., for intermediate volumes, their distribution is closer to a power law than to an exponential decay), which is a consequence of the power-law behavior of the velocity auto-correlation function (Davila & Vassilicos, 2003; Smith et al., 2008). TG STPS display a less clear scaling, which is compatible with contamination of the scaling of the velocity by the mean flow (Angriman et al., 2020). ZAPS and WZERO do not exhibit a power law behavior, and are closer to an almost exponential decay in all DNSsfor large volumes (i.e., for ), with the aforementioned differences between HIT and TG for very small values of . Remarkably, the PDFs of Voronoï cells of all particles are very similar in spite of the differences in the distribution of zeros, and for intermediate and large volumes () are closer to an exponential decay, indicating the clustering of particles for those volumes is more akin to the distribution of either ZAPS or WZERO than to the distribution of STPS. It is worth recalling that some studies of finite-size, neutrally buoyant particles in HIT laboratory flows indicate that small particles do not cluster and behave as tracers (Fiabane et al., 2012), at least from a Voronoï tessellation point of view. Fiabane et al. (2012) considered neutrally buoyant particles whose radii ranged from to ( to ). The particles employed here are well outside this range, with a size comparable to the Taylor microscale, a scale at which viscous effects from the turbulent flow become less relevant. Our results suggest that Taylor-scale neutrally buoyant particles cluster similarly to inertial particles. The numerical particle data thus serve the purpose of gauging the level of clustering the experimental particles experience when compared to the minimal model in the simulations. As particles in the DNS cluster akin to different flow nulls, the comparison allows to further relate the clustering in the experiment with specific properties of the background flow.
3.2 Biases in the evaluation of Voronoï tessellation using particles’ positions
Measurement of 3D clustering in experiments poses multiple challenges. Particle seeding must be sufficiently small to remain in the regime of a dilute suspension (Elghobashi, 1994), which results in a few particles per measurement. When computing 3D Voronoï tessellations, this results in a small number of closed cells, roughly proportional to the cube root of the total number of detected particles. Thus, the number of closed Voronoï cells scales slowly with the number of particles (see Tagawa et al. 2012 for another study of 3D clustering in experiments). Lastly, boundaries have a drastic effect in the statistics. In this section we compare DNSs, synthetically post-processed DNSs, and laboratory data, to quantify the effect of these ever-present limitations. We therefore evaluate possible sources of biases in the 3D Voronoï tessellation calculated from the inertial particles’ instantaneous positions by processing DNS data so as to mimic experimental conditions.
We first focus on the effect of boundaries. Particles near the boundaries of the observation region in the experiment occupy either open cells (which are always discarded in the analyses) or artificially large cells, as particles closing their cells (or the domain walls) are not visible in the cameras field of view. The result is depicted in Fig. 3(a) (inset), which shows the Voronoï tessellation on the raw EXP data without imposing any restriction on the cells near boundaries (labeled “no BC” in the figure); note the power-law tail for very large . We reproduced this situation in the TG DNS by computing the tessellation imposing periodic boundary conditions (“PBC”, considered as ground truth), by imposing no condition on the boundaries (“no BC”, which results in a power-law dependence), by removing all cells close to boundaries (labeled “FC” in the figure), and by dropping the largest cells that resulted in a total volume larger than the observation volume (that is, keeping only “physical” volumes, “PV”), see Fig. 3(a). The latter method, when applied to EXP data, results in the PDF shown in the inset of Fig. 3(a) (the strategy also used in Fig. 2(f)). In each case, is the total volume occupied by the fluid divided by the mean number of particles, to remove biases (especially when large spurious volumes are kept). Boundaries mainly affect the statistics of large cells, but the left tails of the PDFs remain the same regardless of the strategy used for treating the boundaries. This suggests boundaries do not affect significantly the determination of clusters (as clusters are formed by small volumes below some threshold, as will be discussed in the following section). Furthermore, we verified that when analysing DNS data in the same way as EXP data (i.e., by considering the non-periodic VK cells in the TG DNS and keeping only “physical” Voronoï cells), the distribution of cluster volumes reported in the following section remains unchanged.

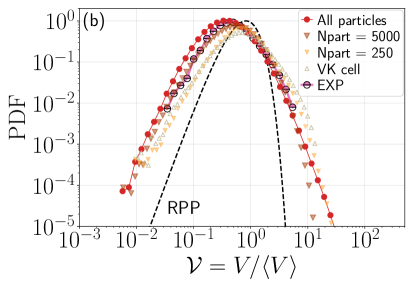
The relatively low number of particles in experiments also has an effect in the PDFs. Figure 3(b) shows EXP data together with the original TG data (tessellated using periodic boundary conditions), and the TG data sub-sampled to a maximum of 250 and 5000 particles. These sub-sampled sets were built so as to follow the same distribution of number of particles per frame as in the experiments. This was done in the following way. The maximum number of particles considered (either 250 or 5000) represents the DNS-equivalent of the total number of particles inside the experimental vessel (but not necessarily within the observation volume at once); e.g. corresponds to roughly 31 particles available in each of the 8 individual VK cells the DNS comprises. The experimental variability in the actual number of particles that simultaneously occupy the observation volume at any time instant was mimicked in these numerical datasets based on the occupation probability distribution (i.e., the probability to observe a certain number of particles at each time instant), which was calculated empirically from the EXP data. As a result, for , the mean number of particles per frame in the complete numerical domain of volume is 111, leading to approximately 13 particles per VK cell of the TG flow, comparable to what is attained in the experiments. These sub-sampled datasets were then processed in a manner identical to what was done with the experimental data; namely, employing a tessellation scheme without considering periodic boundary conditions and keeping only physical volumes in the entire domain. To further mimic the experimental conditions, the sub-sampling of the TG data was also performed in one VK cell, i.e., in just the octant comprised by the subdomain , thus keeping an average of only particles per snapshot. The tessellation was then carried out as in the case of and but in the smaller subdomain; the resulting PDF is shown in Fig. 3(b) as well.
Decreasing the number of particles in the DNS in these ways -in both the ( domain and in the VK cell- as shown in Fig. 3(b), results in PDFs whose left tails slowly move towards the RPP, partially explaining the slight defect of small volumes seen in the EXP data. The reduction in the number of particles, and the treatment of boundaries discussed above, also has a small effect in the concavity of the right tail of the observed PDF. For a detailed study of other experimental biases in 2D Voronoï tessellation, including sub-sampling effects, see Monchaux (2012), and for an investigation of finite-size effects on Voronoï analysis of randomly placed spheres, see Uhlmann (2020).
3.3 Effect of preferential sampling of large-scale inhomogeneities in the experiment


While small (larger than the Kolmogorov scale) particles do not cluster (Fiabane et al., 2012), neutrally buoyant particles with sizes of the order of the flow integral scale have been reported to cluster in von Kármán experiments (Machicoane et al., 2014). The clusters in that case were found to be associated to large-scale flow inhomogeneities (i.e., preferential sampling by the particles) and to confinement effects (Machicoane et al., 2016), rather than to inertial effects. It is then worth analyzing if the clustering behavior observed in our finite-size particles is the result of, or at least affected by, a global preferential sampling as the one reported by Machicoane et al. (2014). To this end we computed the 3D spatial concentration map of the particles in the experiment, using all available snapshots and normalized so that the average in the entire observation volume is . Figure 4(a) and (b) show two-dimensional probability density maps of the particles’ positions (proportional to the 2D concentration maps) in the and planes respectively, where is chosen parallel to the rotation axis of the propellers and to the direction of gravity. Our particles present a more uniform distribution than the larger particles considered in Machicoane et al. (2014) and Machicoane et al. (2016). This is consistent with previous observations: in Machicoane et al. (2014) the larger particles are the ones that display the stronger inhomogeneous preferential sampling, while their smaller particles (with ) sample the flow more uniformly than their larger particles. In spite of this, in Fig. 4 a very small tendency for our particles to be in the lower half of the cell () can still be observed, specially near the corners. This may be partially due to asymmetries in the position of the shear layer in the von Kármán flow (Ravelet et al., 2004; Huck et al., 2017), to a small effect of gravity, and to the particles entering and exiting the region behind the propellers; the latter effect is particularly visible in the lower corners of the concentration maps.
To quantify the effect that the particles preferential sampling has on the observed clustering, we computed the Voronoï cells compensating each cell volume by its local particle concentration.
The purpose of doing this is to correct any underestimation (resp. overestimation) of the cell volumes resulting from the cells being located in regions of space with higher (resp. lower) particle concentration. This can be done in two ways. For a given particle located at , the volume of its Voronoï cell can be multiplied by the concentration at the particle position , i.e., , or by the average concentration in the entire cell that contains that particle , i.e., . We thus computed PDFs using these two compensated cell volumes, which are shown in Fig. 4(c) along with the PDF of without any compensation. The overall shape of the PDFs remains similar, with the heavy tails that deviate from the RPP being preserved. The second compensation, using the mean concentration in each cell, does not change significantly the distribution of large volumes, but does decrease slightly the probability of finding small volumes. Even so, the compensated PDFs indicate that large-scale sampling effects as reported in Machicoane et al. (2014) play a smaller role in our case, and confirm that the clustering observed in the experiment is at least partially associated to inertial effects. As a reference, the standard deviation of the Voronoï volumes compensated by is , which is slightly larger than for the uncompensated Voronoï volumes in the experiment (see table 1), and closer to the reference value for the minimal model of inertial particles in the TG DNSs.
3.4 Cluster volumes probability distribution

Figure 5 shows the PDFs of the volumes of the clusters (formed by at least two adjacent cells with , where is the first crossing between the PDF of with the RPP, see Monchaux et al. (2010)), for all vector fields nulls and for the particles, in the DNSs and EXP. From Mora et al. (2021) we expect a scaling for STPS, and for ZAPS and WZEROs, resulting from the fractal nature of the spatial distribution of these zeros. Hence, the presence or not of these power laws provides information on the clusters geometry and their fractality (see Obligado et al. (2014) and Mora et al. (2021) for simple models and a review of the origin of these power laws). For all nulls, HIT shows a slight excess of smaller volume clusters when compared with TG, but overall the PDFs and scalings are similar.
Figure 5(f) also shows the PDFs of for particles in the DNSs and EXP (in the latter case, with and without corrections by the mean average concentration per volume), which are expected to follow a power-law scaling, with a shorter range as a result of the large St considered. Clusters of particles in the experiment have different PDFs than in TG or HIT. The right tails of the PDFs in the experiment, associated with volumes , present a sharp drop as the cluster size cannot be larger than the observation volume ( is indicated by the arrow in the figure). On the other hand, in the PDF of uncompensated EXP volumes, the probability of having small clusters (with ) is larger than in the DNSs. We verified that this is not an effect of sub-sampling or boundaries, so this difference underlines limitations in the scope of the toy model considered in Eq. (4) and, ultimately, in the effect of the mean large-scale flow as captured by the model, either from missing physical effects or from preferential sampling. Neglected interactions between particles is not the probable cause, as the volumetric loading ratio is . However, particles in the DNSs, while subjected to Stokes drag, are point particles that can only sense pressure gradients indirectly through the carrier velocity field. On the other hand, finite-size particles are expected to sense the pressure gradient directly as a force acting on their surface, as well as velocity gradients (and thus, shear stresses) that the point particles in the DNSs cannot sense. Pressure gradients have already been pointed out as important in the understanding of the formation of clusters of finite-size particles (Fiabane et al., 2012). Finally, when compensating each EXP particle volume by the mean concentration, the probability of finding smaller clusters decreases and becomes closer to that of the model, suggesting that the small preferential concentration induced by the large-scale flow geometry plays a role here. This is confirmed by the fact that small and large clusters in TG and EXP flows occur at slightly different places, which could also explain why their PDFs look differently.
In table 1 a comparison of the mean linear cluster size for all quantities is given, normalized by . The mean linear cluster sizes of WZERO and ZAPS are similar for TG and HIT, but STPS clusters are slightly larger for HIT, a difference that may be related to the fact that the HIT forcing scale is larger than in TG, and thus larger clusters may appear. The mean linear cluster size of particles in EXP is much larger than in TG or HIT. Even when conditioning the data as discussed in Sec. 3.2 (that is, sub-sampling the number of particles in the DNS, and considering boundary effects), or as in Sec. 3.3 (i.e., correcting by the particles concentration), we observe that clusters in the experiment are still 3 times larger, on average, than in TG. This difference is associated to the finite volume of the particles in EXP. Note that finite-size particles can only form clusters with a minimum linear size of order , which for EXP data is greater than . In other words, some clusters in TG cannot be realized in the experiment without the actual particles overlapping.

The PDFs of the number of clusters with points inside each cluster are shown for the DNSs in Fig. 6. These PDFs follow a power-law behavior with an exponent close to for STPS, and for ZAPS and WZERO, as expected from Mora et al. (2021). Figure 6(c) indicates that the probability of having clusters of STPS with a larger number of nulls is larger for HIT than for TG, consistently with the larger mean linear size of clusters of STPS in HIT. Inertial particles also follow a power law with an exponent close to for clusters with , a behavior consistent with the one reported by Yoshimoto & Goto (2007). Overall, the observed scaling is similar for ZAPS, WZERO, and inertial particles, which is compatible with the sweep-stick mechanism (Goto & Vassilicos, 2008; Coleman & Vassilicos, 2009; Oka & Goto, 2021). The deviation from the power law observed for particles in Fig. 6(f) might relate to the fact that particles with large Stokes number filter out small flow scales. Indeed, these kinds of particles are expected to be less responsive to small scale motions in the fluid, so clusters with larger number of particles around very dense nulls in the carrier flow are less likely to form. Finally, the inset in Fig. 6(f) shows the linear cluster size normalized by , as a function of the number of particles per cluster for the inertial particles. Note the cluster size grows with the number of particles with a scaling.
4 Discussion
Comparison of clustering in numerical simulations of homogeneous isotropic turbulence and Taylor-Green turbulence with von Kármán experiments provides a powerful tool to characterize geometrical and topological properties of turbulence, and of multi-phase flows. Moreover, the similarities between the Taylor-Green flow and the laboratory von Kármán flow allow for detailed studies of possible biases when considering limitations in experiments such as low number of particles, boundary effects, or the effect of preferential sampling of the large-scale flow by the particles.
Our results also show that 3D Voronoï tessellation constitutes a powerful tool to study the topology of nulls and clusters, shedding light on dominant effects in the dynamics of the flow. For the case of the Taylor-Green and von Kármán flows, these are: (1) A lower probability of finding very densely packaged zeros of the velocity field, the vorticity, and of the Lagrangian acceleration in the TG flow when compared with HIT. (2) A deviation in the scaling of the number of Voronoï volumes of STPS with in the TG flow, probably associated with the effect of the mean flow on the velocity auto-correlation function. (3) Similar clustering properties of a minimal model of inertial particles in TG and of neutrally buoyant Taylor-scale particles in von Kármán flows as in inertial particles in HIT, probably resulting from the negligible differences (for intermediate cell volumes ) in the statistics of ZAPS and WZERO observed in TG and HIT.
In the experiment, we find that particles with a size comparable to the Taylor microscale form clusters that are very similar in intensity and size distribution as the point particles in the simulations. This contrasts with previous results, for particles whose sizes were a fraction of , and that did not exhibit clustering (Qureshi et al., 2007; Fiabane et al., 2012, 2013), while close to point particles in experiments were found to form clusters (Obligado et al., 2019), as well as much larger particles (Machicoane et al., 2014, 2016) were also found to cluster for different reasons. This points towards the possibility that intermediate, Taylor-scale neutrally buoyant particles, cluster as a result of inertial effects.
These results are promising as they further confirm Taylor-Green and von Kármán flows share many geometrical and statistical properties, even when considering preferential concentration of particles in multi-phase turbulence. Moreover, they indicate that many clustering properties of HIT can be extended to multi-scale flows with a large-scale circulation, at least in cases in which turbulent fluctuations are large (as in the TG and VK flows). Further studies will consider other forcing mechanisms and different large-scale geometries.
Acknowledgements.
This work has been partially supported by ECOS-Sud Project No. A18ST04. S.A., F.Z., P.J.C., and P.D.M. acknowledge support from UBACYT Grant No. 20020170100508BA and PICT Grant No. 2018-4298. A.F. and M.O. acknowledge the LabEx Tec21 (Investissements d’Avenir - Grant Agreement ANR-11-LABX-0030). The authors thank Daniel Mora for help with data analysis of nulls calculation. The authors gratefully acknowledge suggestions by an anonymous referee of studying the spatial concentration map of the particles in the experiment. The authors report no conflict of interest.Appendix A Models with other forces and their effect on clustering

In this appendix we briefly consider other possible models for the equations of motion of particles in the simulations. On the one hand we consider particles subjected to a nonlinear drag force as in Wang & Maxey (1993), whose equations of motion read
| (10) |
where . On the other hand we consider the Maxey-Riley equation (Maxey & Riley, 1983) up to terms linear in the particle’s radius, that is, we consider the Stokes drag, gravity, and particle acceleration and added mass effects (and therefore neglecting Faxén corrections and the Basset-Boussinesq history term). Thus, particles evolve according to
| (11) |
where is the gravitational acceleration, , and . Particles whose dynamics are governed by either Eq. (10) or (11) were evolved in the turbulent flow with Taylor-Green mechanical forcing with a spatial resolution of grid points, following the same procedures as previously described for the TG DNSs. A total of particles were integrated. For the sake of comparison, and as both equations are missing other forces (see, e.g., Calzavarini et al., 2008, 2009), we use in all cases the effective particle response time instead of the viscous relaxation time , and in Eq. (11) we use and the value of to match the experiment. We performed a Voronoï tessellation of the particles’ positions, and the resulting cell volumes PDFs are shown in Fig. 7, along with the PDFs corresponding to particles evolving solely under Stokes drag as in Eq. (4), and the experimental data. As expected, considering particle acceleration and added mass effects in the Maxey-Riley equation results in less clustering: Eq. (11) is well suited for smaller particles with small particle Reynolds number, which tend to cluster less (Fiabane et al., 2012, 2013). Note in particular how the statistics of voids (i.e., of large Voronoï cells) approaches the statistics of the RPP; the standard deviation of this PDF is . Considering nonlinear drag as in Eq. (10) may be more relevant for particles of our size and with larger particle Reynolds number. This model results instead in more clusterization, with a PDF with . The stronger clustering may be related to our choice of using an effective . In the future, it may be of interest to compare nonlinear drag using the viscous response time of the particles (or other choices for the effective response time) against the simplified point particle model with the effective parameter in Eq. (4). Note in particular that the results in Fig. 7 do not necessarily imply that Eq. (4) is a better model for Taylor-scale neutrally buoyant particles, as to that end a more detailed comparison would be needed.
References
- Angriman et al. (2021) Angriman, S., Cobelli, P. J., Bourgoin, M., Huisman, S. G., Volk, R. & Mininni, P. D. 2021 Broken mirror symmetry of tracer’s trajectories in turbulence. Phys. Rev. Lett. 127 (25), 254502.
- Angriman et al. (2020) Angriman, S., Mininni, P. D. & Cobelli, P. J. 2020 Velocity and acceleration statistics in particle-laden turbulent swirling flows. Phys. Rev. Fluids 5, 064605.
- Batchelor (2000) Batchelor, G. K. 2000 An Introduction to Fluid Dynamics. Cambridge Mathematical Library . Cambridge University Press.
- Bellani & Variano (2012) Bellani, G. & Variano, E. A. 2012 Slip velocity of large neutrally buoyant particles in turbulent flows. New J. Physics 14 (12), 125009.
- Brennen (2005) Brennen, C. E. 2005 Fundamentals of Multiphase Flow, 1st edn. Cambridge University Press.
- Buaria et al. (2019) Buaria, D., Pumir, A., Bodenschatz, E. & Yeung, P.-K. 2019 Extreme velocity gradients in turbulent flows. New J. Phys. 21 (4), 043004.
- Calzavarini et al. (2008) Calzavarini, E., Kerscher, M., Lohse, D. & Toschi, F. 2008 Dimensionality and morphology of particle and bubble clusters in turbulent flow. J Fluid Mech. 607, 13–24.
- Calzavarini et al. (2009) Calzavarini, E., Volk, R., Bourgoin, M., Lévêque, E., Pinton, J.-F. & Toschi, F. 2009 Acceleration statistics of finite-sized particles in turbulent flow: The role of Faxén forces. J. Fluid Mech. 630, 179–189.
- Cartwright et al. (2010) Cartwright, J. H. E., Feudel, U., Károlyi, G., de Moura, A., Piro, O. & Tél, T. 2010 Dynamics of finite-size particles in chaotic fluid flows. In Nonlinear dynamics and chaos: advances and perspectives, pp. 51–87. Springer.
- Cisse et al. (2013) Cisse, M., Homann, H. & Bec, J. 2013 Slipping motion of large neutrally buoyant particles in turbulence. J. Fluid Mech. 735.
- Clyne et al. (2007) Clyne, J., Mininni, P., Norton, A. & Rast, M. 2007 Interactive desktop analysis of high resolution simulations: application to turbulent plume dynamics and current sheet formation. New J. Phys. 9, 301–301.
- Coleman & Vassilicos (2009) Coleman, S. W. & Vassilicos, J. C. 2009 A unified sweep-stick mechanism to explain particle clustering in two- and three-dimensional homogeneous, isotropic turbulence. Phys. Fluids 21, 113301.
- Davila & Vassilicos (2003) Davila, J. & Vassilicos, J. C. 2003 Richardson’s pair diffusion and the stagnation point structure of turbulence. Phys. Rev. Lett. 91, 144501.
- Elghobashi (1994) Elghobashi, S. 1994 On predicting particle-laden turbulent flows. Appl. Sci. Res. 52 (4), 309–329.
- Ferran et al. (2022) Ferran, A., Angriman, S., Mininni, P. D & Obligado, M. 2022 Characterising single and two-phase homogeneous isotropic turbulence with stagnation points. Dynamics 2 (2), 63–72.
- Fiabane et al. (2013) Fiabane, L., Volk, R., Pinton, J-F, Monchaux, R., Cartellier, A. & Bourgoin, M. 2013 Do finite-size neutrally buoyant particles cluster? Phys. Scr. 2013 (T155), 014056.
- Fiabane et al. (2012) Fiabane, L., Zimmermann, R., Volk, R., Pinton, J.-F. & Bourgoin, M. 2012 Clustering of finite-size particles in turbulence. Phys. Rev. E 86, 035301.
- Goto & Vassilicos (2006) Goto, S. & Vassilicos, J. C. 2006 Self-similar clustering of inertial particles and zero-acceleration points in fully developed two-dimensional turbulence. Phys. Fluids 18 (11), 115103.
- Goto & Vassilicos (2008) Goto, S. & Vassilicos, J. C. 2008 Sweep-stick mechanism of heavy particle clustering in fluid turbulence. Phys. Rev. Lett. 100 (5).
- Goto & Vassilicos (2009) Goto, S. & Vassilicos, J. C. 2009 The dissipation rate coefficient of turbulence is not universal and depends on the internal stagnation point structure. Phys. Fluids 21, 035104.
- Green & Taylor (1937) Green, AE & Taylor, GI 1937 Mechanism of the production of small eddies from larger ones. Proc. Royal Soc. A 158 (895), 499–521.
- Haynes & Parnell (2007) Haynes, A. L. & Parnell, C. E. 2007 A trilinear method for finding null points in a three-dimensional vector space. Phys. Plasmas 14, 082107.
- Homann & Bec (2010) Homann, H. & Bec, J. 2010 Finite-size effects in the dynamics of neutrally buoyant particles in turbulent flow. J. Fluid Mech. 651, 81–91.
- Huck et al. (2017) Huck, P. D., Machicoane, N. & Volk, R. 2017 Production and dissipation of turbulent fluctuations close to a stagnation point. Phys. Rev. Fluids 2 (8), 084601.
- Kaneda et al. (2003) Kaneda, Y., Ishihara, T., Yokokawa, M., Itakura, K. & Uno, A. 2003 Energy dissipation rate and energy spectrum in high resolution direct numerical simulations of turbulence in a periodic box. Phys. Fluids 15 (2), L21–L24.
- Kreuzahler et al. (2014) Kreuzahler, S, Schulz, D, Homann, H, Ponty, Y & Grauer, R 2014 Numerical study of impeller-driven von Kármán flows via a volume penalization method. New J. Phys. 16 (10), 103001.
- Machicoane et al. (2016) Machicoane, N., López-Caballero, M., Fiabane, L., Pinton, J.-F., Bourgoin, M., Burguete, J. & Volk, R. 2016 Stochastic dynamics of particles trapped in turbulent flows. Phys. Rev. E 93 (2), 023118.
- Machicoane et al. (2014) Machicoane, N., Zimmermann, R., Fiabane, L., Bourgoin, M., Pinton, J.-F. & Volk, R. 2014 Large sphere motion in a nonhomogeneous turbulent flow. New J. Phys. 16 (1), 013053.
- Maxey & Riley (1983) Maxey, M. R & Riley, J. J 1983 Equation of motion for a small rigid sphere in a nonuniform flow. Phys. Fluids 26 (4), 883–889.
- Mininni et al. (2011) Mininni, P. D., Rosenberg, D., Reddy, R. & Pouquet, A. 2011 A hybrid MPI–OpenMP scheme for scalable parallel pseudospectral computations for fluid turbulence. Parallel Comput. 37 (6-7), 316–326.
- Monchaux (2012) Monchaux, R. 2012 Measuring concentration with Voronoï diagrams: the study of possible biases. New J. Phys. 14 (9), 095013.
- Monchaux et al. (2010) Monchaux, R., Bourgoin, M. & Cartellier, A. 2010 Preferential concentration of heavy particles: A Voronoï analysis. Phys. Fluids 22 (10).
- Mora et al. (2021) Mora, D. O., Bourgoin, M., Mininni, P. D. & Obligado, M. 2021 Clustering of vector nulls in homogeneous isotropic turbulence. Phys. Rev. Fluids 6 (2), 024609.
- Mordant et al. (2002) Mordant, N., Delour, J., Léveque, E., Arnéodo, A. & Pinton, J.-F. 2002 Long time correlations in Lagrangian dynamics: A key to intermittency in turbulence. Phys. Rev. Lett. 89 (25), 254502.
- Mordant et al. (2004) Mordant, N., Lévêque, E. & Pinton, J.-F. 2004 Experimental and numerical study of the Lagrangian dynamics of high Reynolds turbulence. New J. Phys. 6, 116.
- Morrison (2013) Morrison, F. A. 2013 Data correlation for drag coefficient for sphere. Department of Chemical Engineering, Michigan Technological University, Houghton, MI 49931.
- Obligado et al. (2014) Obligado, M., Teitelbaum, T., Cartellier, A., Mininni, P. D. & Bourgoin, M. 2014 Preferential concentration of heavy particles in turbulence. J. Turbul. 15 (5), 293–310.
- Obligado et al. (2019) Obligado, M., Volk, R., Mordant, N. & Bourgoin, M. 2019 Preferential concentration of finite solid particles in a swirling von Karman flow of water. In Turbulent Cascades II, pp. 207–216. Springer.
- Oka & Goto (2021) Oka, S. & Goto, S. 2021 Generalized sweep-stick mechanism of inertial-particle clustering in turbulence. Phys. Rev. Fluids 6, 044605.
- Poncet et al. (2008) Poncet, S., Schiestel, R. & Monchaux, R. 2008 Turbulence modeling of the von Kármán flow: Viscous and inertial stirrings. Int. J. Heat Fluid Flow 29 (1), 62–74.
- Qureshi et al. (2007) Qureshi, N. M, Bourgoin, M., Baudet, C., Cartellier, A. & Gagne, Y. 2007 Turbulent transport of material particles: An experimental study of finite size effects. Phys. Rev. Lett. 99, 184502.
- Ravelet et al. (2004) Ravelet, F., Marié, L., Chiffaudel, A. & Daviaud, F. 2004 Multistability and memory effect in a highly turbulent flow: Experimental evidence for a global bifurcation. Phys. Rev. Lett. 93 (16), 164501.
- Reartes & Mininni (2021) Reartes, C. & Mininni, P. D. 2021 Settling and clustering of particles of moderate mass density in turbulence. Phys. Rev. Fluids 6, 114304.
- Rosenberg et al. (2020) Rosenberg, D., Mininni, P. D., Reddy, R. & Pouquet, A. 2020 GPU parallelization of a hybrid pseudospectral geophysical turbulence framework using CUDA. Atmosphere 11 (2), 178.
- Schmitt & Seuront (2008) Schmitt, F. G. & Seuront, L. 2008 Intermittent turbulence and copepod dynamics: Increase in encounter rates through preferential concentration. J. Mar. Sys. 70 (3-4), 263–272.
- Shen & Warhaft (2002) Shen, X. & Warhaft, Z. 2002 Longitudinal and transverse structure functions in sheared and unsheared wind-tunnel turbulence. Phys. Fluids 14, 370–381.
- Smith et al. (2008) Smith, J. M., Hopcraft, K. I. & Jakeman, E. 2008 Fluctuations in the zeros of differentiable Gaussian processes. Phys. Rev. E 77 (3), 031112.
- Tagawa et al. (2012) Tagawa, Y., Mercado, J., Prakash, V. N., Calzavarini, E., Sun, C. & Lohse, D. 2012 Three-dimensional Lagrangian Voronoï analysis for clustering of particles and bubbles in turbulence. J. Fluid Mech. 693, 201–215.
- Taylor (1938) Taylor, G. I. 1938 The spectrum of turbulence. Proc. R. Soc. A 164 (919), 476–490.
- Uhlmann (2020) Uhlmann, M. 2020 Voronoï tessellation analysis of sets of randomly placed finite-size spheres. Physica A 555, 124618.
- Volk et al. (2008) Volk, R., Calzavarini, E., Verhille, G., Lohse, D., Mordant, N., Pinton, J.-F. & Toschi, F. 2008 Acceleration of heavy and light particles in turbulence: Comparison between experiments and direct numerical simulations. Physica D 237 (14-17), 2084–2089.
- Wang & Maxey (1993) Wang, L.-P. & Maxey, M. R. 1993 Settling velocity and concentration distribution of heavy particles in homogeneous isotropic turbulence. J. Fluid Mech. 256, 27–68.
- Xu & Bodenschatz (2008) Xu, H. & Bodenschatz, E. 2008 Motion of inertial particles with size larger than Kolmogorov scale in turbulent flows. Physica D 237 (14-17), 2095–2100.
- Yoshimoto & Goto (2007) Yoshimoto, H. & Goto, S. 2007 Self-similar clustering of inertial particles in homogeneous turbulence. J. Fluid Mech. 577, 275–286.