11email: [email protected] 22institutetext: Dipartimento di Fisica, Università di Roma Tor Vergata, Via della Ricerca Scientifica, 1, 00133, Roma, Italy 33institutetext: Department of Physics and Astronomy, University of California, Los Angeles, 430 Portola Plaza, Los Angeles, CA 90095, USA 44institutetext: Kavli Institute for the Physics and Mathematics of the Universe, The University of Tokyo, Kashiwa, Japan 277-8583 55institutetext: Dipartimento di Fisica, Università degli Studi di Milano, Via Celoria 16, I-20133 Milano, Italy 66institutetext: INAF - OAS, Osservatorio di Astrofisica e Scienza dello Spazio di Bologna, via Gobetti 93/3, I-40129 Bologna, Italy 77institutetext: INAF - IASF Milano, via A. Corti 12, I-20133 Milano, Italy 88institutetext: Dipartimento di Fisica e Scienze della Terra, Università degli Studi di Ferrara, Via Saragat 1, I-44122 Ferrara, Italy 99institutetext: INAF Osservatorio Astronomico di Padova, vicolo dell’Osservatorio 5, 35122 Padova, Italy 1010institutetext: School of Physics, University of Melbourne, Parkville 3010, VIC, Australia 1111institutetext: ARC Centre of Excellence for All Sky Astrophysics in 3 Dimensions (ASTRO 3D), Australia 1212institutetext: Space Telescope Science Institute, 3700 San Martin Drive, Baltimore MD, 21218 1313institutetext: Center for Astrophysical Sciences, Department of Physics and Astronomy, Johns Hopkins University, Baltimore, MD, 21218, USA 1414institutetext: Cosmic Dawn Center (DAWN), Denmark 1515institutetext: Niels Bohr Institute, University of Copenhagen, Jagtvej 128, 2200 København N, Denmark 1616institutetext: IPAC, California Institute of Technology, MC 314-6, 1200 E. California Boulevard, Pasadena, CA 91125, USA 1717institutetext: Centre for Astrophysics and Supercomputing, Swinburne University of Technology, PO Box 218, Hawthorn, VIC 3122, Australia 1818institutetext: Minnesota Institute for Astrophysics, University of Minnesota, 116 Church Street SE, Minneapolis, MN 55455, USA 1919institutetext: School of Astronomy and Space Science, University of Chinese Academy of Sciences (UCAS), Beijing 100049, China 2020institutetext: National Astronomical Observatories, Chinese Academy of Sciences, Beijing 100101, China 2121institutetext: Institute for Frontiers in Astronomy and Astrophysics, Beijing Normal University, Beijing 102206, China 2222institutetext: School of Earth and Space Exploration, Arizona State University, Tempe, AZ 85287-1404, USA 2323institutetext: Department of Mathematics and Physics, University of Ljubljana, Jadranska ulica 19, SI-1000 Ljubljana, Slovenia 2424institutetext: Department of Physics and Astronomy, University of California, Davis, 1 Shields Ave, Davis, CA 95616, USA
Closing in on the sources of cosmic reionization: First results from the GLASS-JWST program
The escape fraction of Lyman-continuum (LyC) photons () is a key parameter for determining the sources of cosmic reionization at . At these redshifts, owing to the opacity of the intergalactic medium, the LyC emission cannot be measured directly. However, LyC leakers during the epoch of reionization could be identified using indirect indicators that have been extensively tested at low and intermediate redshifts. These include a high [Oiii]/[Oii] flux ratio, high star-formation surface density, and compact sizes. In this work, we present observations of 29 gravitationally lensed galaxies in the Abell 2744 cluster field. From a combined analysis of JWST-NIRSpec and NIRCam data, we accurately derived their physical and spectroscopic properties: our galaxies have low masses , blue UV spectral slopes (), compact sizes ( kpc), and high [Oiii]/[Oii] flux ratios. We confirm that these properties are similar to those characterizing low-redshift LyC leakers. Indirectly inferring the fraction of escaping ionizing photons, we find that more than 80% of our galaxies have predicted values larger than 0.05, indicating that they would be considered leakers. The average predicted value of our sample is 0.12, suggesting that similar galaxies at have provided a substantial contribution to cosmic reionization.
Key Words.:
galaxies: high-redshift, galaxies: ISM, galaxies: star formation, cosmology: dark ages, reionization, first stars1 Introduction
The Lyman-continuum (LyC, Å) photons escaping from star-forming galaxies into the neutral intergalactic medium (IGM) can account for the photon budget required to complete reionization only if a substantial fraction of them escape from the galaxies’ interstellar and circumgalactic media (ISM and CGM). Given the number density of star-forming galaxies in the Epoch of Reionization (EoR), an average LyC escape fraction () of across all galaxies would be required (e.g., Finkelstein et al., 2019; Robertson et al., 2015) to both reionize the Universe by and match the Thomson optical depth of electron scattering observed in the cosmic microwave background (CMB, Planck Collaboration et al., 2020).
However, at it is impossible to detect the LyC photons escaping from galaxies, since they are absorbed and scattered by the IGM along the line of sight (Inoue et al., 2014). Therefore, efforts at low redshift, where LyC can be detected, have been focused on identifying other observable properties that trace physical conditions facilitating the escape of LyC photons. These indirect indicators could then be used
in the EoR to identify the cosmic ionizers. Several indirect diagnostics have been proposed (e.g., Yamanaka et al., 2020; Izotov et al., 2018b; Marchi et al., 2018; Verhamme et al., 2017), but they are all characterized by a large scatter. One of the best indicators is the presence of a strong Ly emission (e.g., Pahl et al., 2021; Gazagnes et al., 2020), often characterized by two emission peaks with a small velocity separation. However, at this line is attenuated due to its resonant nature and by the increasingly neutral IGM as we approach the EoR (Pentericci et al., 2018; Mason et al., 2019; Jung et al., 2020; Ouchi et al., 2020; Bolan et al., 2021).
Emission from the [Mgii] doublet has been proposed as a promising LyC proxy (Chisholm et al., 2020), as the escape of this line is controlled by resonant scattering in the same low column-density gas as the Ly (see also Xu et al., 2022; Izotov et al., 2022).
More recently, the nebular C iv emission line, requiring comparably high ionization energies to the He ii line (E 47.9 eV and 54.4 eV respectively), has attracted attention since its presence might be strongly linked to the escape of Lyman continuum photons from galaxies (e.g., Schaerer et al., 2022; Senchyna et al., 2022; Saxena et al., 2022; Mascia et al., 2023), although this line is in general much fainter than Ly.
Another very popular indicator is the emission line ratio [O iii]/[Oii] (hereafter, ), as Nakajima & Ouchi (2014) first found evidence for its correlation with : high values of would reflect partially incomplete Hii regions, where some LyC photons could escape from (Marchi et al., 2018). Later on, it was found that this correlation is characterized by a substantial scatter, as highlighted by low-redshift studies (e.g., Izotov et al., 2018b; Nakajima et al., 2020; Flury et al., 2022). As a result, a high flux ratio is still a necessary condition for a significant measurement of , although it is not sufficient by itself to define a LyC leaker, as viewing angles might play a role as well as variation in metallicity and ionization parameter (e.g., Bassett et al., 2019; Katz et al., 2020).
Further additional properties, such as low values of Balmer lines’ rest-frame equivalent widths (), are thus required. As a matter of fact, measuring low values of EW in these lines could indicate lower optical depth in the Hii region (e.g., Bergvall et al., 2013). However, many local LyC emitters exhibiting high values of Balmer emission line are present in the literature (Izotov et al., 2016a, b, 2018a, 2018b).
A possible explanation for this discrepancy lies in the fact that Balmer-line are sensitive not only to Hii region size, but also to starburst age and star formation history (Zackrisson et al., 2017; Binggeli et al., 2018; Alavi et al., 2020). It is thus imperative to pair the EW diagnostic with another indicator in order to prevent degeneracy.
Finally, another diagnostic for a high is the SFR surface density (): feedback from star formation can blow bubbles or chimneys into the host galaxy’s ISM, linking a high value to a high . This connection is supported by the detection of some compact LyC emitters (LCEs, e.g., Izotov et al., 2018b; Marchi et al., 2018), even though compactness may not be a defining characteristic of all of them (e.g., Marchi et al., 2018).
Recently, Flury et al. (2022) presented the first statistical test of many of the diagnostics just described on a large sample of low-redshift LCEs. Their conclusion is that indicators based on Ly emission properties (such as peak velocity separation and equivalent width) perform well, and that diagnostics such as the [Oiii]/[Oii] flux ratio and the SFR surface density, , could also be used to determine if a galaxy is an LCE or not.
With the advent of JWST, we now have the opportunity to constrain LyC diagnostics during the epoch of reionization with the first NIRSpec observations of high-redshift galaxies. In this paper, we make use of NIRSpec spectra obtained in the Abell 2744 cluster region for a sample of galaxies at observed as part of the JWST Early Release Science program GLASS (Treu et al., 2022) and the JWST Director Discretionary Time program (JWST-GO-2756; P.I. Chen; Roberts-Borsani et al., 2022a). With the wavelength coverage of m offered by the NIRSpec observations, we can confirm not only the redshifts of tens of photometrically selected candidates using intense emission lines, but we can also measure optical line ratios and rest-frame EWs with high precision. Our unique data set also includes deep JWST/NIRCam images, enabling us to better characterize those cosmic reionizer candidates based on their physical properties.
This paper is organized as follows. We present the data set in Sect. 2. We characterize the selected sample and compare the physical and spectroscopic proprieties with cosmological models and other samples at lower redshifts in Sect. 3. In Sect. 4, we indirectly infer for the high-redshift sample and in Sect. 5, we summarize our key conclusions. Throughout this work, we assume a flat CDM cosmology with = 67.7 km s-1 Mpc-1 and = 0.307 (Planck Collaboration et al., 2020) and the Chabrier (2003) initial mass function. All magnitudes are expressed in the AB system (Oke & Gunn, 1983).
2 Observations and method
The final target list of the GLASS-JWST program and the way in which targets have been prioritized will be presented in a future paper. However, Morishita et al. (2022) have already described the observations and data reduction strategy. Here, we present a brief summary, highlighting the points that are most relevant for this work and describing the methods used to study the properties of the galaxies in our sample.
2.1 JWST/NIRSpec MSA observations and data reduction

Our spectra were acquired through NIRSpec MSA observations in two programs: the GLASS-JWST Early Release Science Program (PID 1324, PI Treu; Treu et al., 2022) and a JWST DDT program (PID 2756, PI. W. Chen; Roberts-Borsani et al., 2022a), which obtained NIRSpec observations for a subset of targets residing over the central regions of the Frontier Field galaxy cluster Abell 2744.
The GLASS-JWST observations were carried out on November 10, 2022, with three spectral configurations (G140H/F100LP, G235H/F170LP, and G395H/F290LP). These configurations cover wavelengths between m, at . We exposed each of the three high-resolution gratings for a total of 4.9 hours. Specifically, in this work, we use the G235H/F170LP and G395H/F290LP observations, which contain the bright emission lines we will analyze.
DDT NIRSpec observations were carried out on October 23 2022, using the CLEAR filter+PRISM configuration, which provides continuous wavelength coverage of m at spectral resolution. The on-source exposure time is 1.23 hours.
Data were reduced using the official STScI JWST pipeline (ver.1.8.2)111https://github.com/spacetelescope/jwst for Level 1 data products and the msaexp222https://github.com/gbrammer/msaexp code for Level 2 and 3 data products, which is based on the STScI pipeline but also includes additional correction routines. In summary, we initially reduced the uncalibrated data using the Detector1Pipeline routine and the latest set of reference files (jwst_1023.pmap) to correct for detector-level artifacts and convert them to count-rate images. Then, we applied custom preprocessing routines from msaexp to remove residual noise that is not corrected by the IRS2 readout, to identify and remove ”snowballs”, and to remove bias exposure by exposure before running STScI routines from Spec2Pipeline for the final 2D cutout images. To perform WCS registration, flat-fielding, path-loss corrections, and flux calibration, these routines include AssignWcs, Extract2dStep, FlatFieldStep, PathLossStep, and PhotomStep. Of note, our chosen reference files include an in-flight flux calibration, accounting for NIRSpec’s better-than-expected throughput at blue wavelengths. Local background subtraction was performed using a three-shutter nod pattern before the resulting images are drizzled onto a common grid. We optimally extracted the spectra using an inverse-variance weighted kernel, which is derived by summing the 2D spectrum along the dispersion axis and fitting the signal along the spatial axis to a Gaussian profile. We visually inspected all kernels to make sure spurious events are not included. As a result, the kernel extracts the 1D spectrum along the dispersion axis. The final step was to verify the default wavelength calibration for the gratings, which is accurate within 1 Å (Williams et al. in prep).
2.2 Imaging data
Deep NIRCam images were acquired from the GO program UNCOVER (GO 2561; PI I. Labbe) and included observations in the F115W, F150W, F200W, F277W, F356W, F410M, and F444W filters. The imaging data were reduced using the STScI JWST pipeline and the latest versions of photometric zero points and reference files. A detailed description of all the reduction and calibration steps is presented in Merlin et al. (2022). Of the 29 sources analyzed in this work (see next section), 27 were observed within the UNCOVER pointings. Their positions and the UNCOVER footprints are presented in Fig. 1.
2.3 Emission line and redshift identifications
The focus of the study is on all sources at . Specifically, we analyzed the spectra of: 13 galaxies with a spectroscopic redshift larger than 4.5 previously confirmed by the MUSE observations (Mahler et al., 2018; Richard et al., 2021), all showing Ly in emission in their optical spectra (the footprint of the MUSE observations is also shown in Fig. 1); 29 galaxies with a photometric redshift in the range 4.5-8, of which 5 were selected as part of the candidate protocluster and whose confirmation has been recently presented by Morishita et al. (2022). Finally, 23 of the 42 galaxies were observed as part of GLASS-JWST, while 19 were part of the DDT program.
Spectra were visually examined for detectable optical lines using the spectroscopic or photometric redshift information. For photometric sources we determined the spectroscopic redshift when possible using the H, [O iii], and (when present) H lines. In 29 cases, the [Oii], [O iii] and H were detected and their line fluxes were measured. We also measured the H line in 17 out of 29 cases, since it falls within the observed spectrum (examples are shown in Fig. 2). For this part of our analysis, we used the latest version of the specutils333https://specutils.readthedocs.io/en/stable/index.html packages in python.


From our initial target list of 42 galaxies, there were eight sources with a spectroscopic redshift confirmed from previous MUSE observations, which were placed in the MSA, but for which we are unable to confirm any emission line from JWST data. Of these, five were observed as part of GLASS-JWST and three during the DDT. Most of these sources are extremely faint (fainter than 28 F150W), thus, their redshift confirmation was solely based on the presence of faint Ly emission (flux on the order of ) in the MUSE cubes. We were also unable to detect any emission lines for five galaxies with a photometric redshift between 4.5 and 7: these galaxies are also faint (). However, in these cases it is possible that the photometric redshift was incorrect and this is why we are unable to confirm any emission line in their spectra.
In Table 1, we report the GLASS-JWST IDs, the coordinates and the spectroscopic redshifts of all sources together with their magnitudes derived from the imaging data when present.
2.4 Dust correction and flux measurements
We measured the total flux of all detected lines (Balmer lines, [Oii], and of [Oiii]) with a Gaussian fit of each line component. From the flux measurement we subtracted a constant continuum emission, which is estimated as the signal averaged over regions in which there are no lines near the one being measured. When the signal-to-noise ratio (S/N) of [Oii] or H , we set 2 as an upper limit. Prior to carry out a quantitative analysis, it is necessary to consider corrections for dust reddening. For 22 galaxies, H and H are both available: for these, we calculated the correction for dust extinction on the basis of the Balmer decrement, assuming a Calzetti et al. (2000) extinction law and an intrinsic ratio (see e.g., Domínguez et al., 2013; Kashino et al., 2013; Price et al., 2014), which is valid for an electric temperature of 10000 K. For the other 7 sources where H is not in the observed range, we applied the average correction derived from all other sources.
With the dust corrected values, we calculated the and line fluxes ratios and the H rest-frame s. We list all these values in in Table 1. It is important to highlight that the values slightly depend on the dust correction. The assumed temperature may be too low for high-z star-forming galaxies (e.g., Curti et al., 2023; Nakajima et al., 2023), however the H/H ratio varies by less than 5% for a 20000 K temperature (Dopita & Sutherland, 2003) and therefore the variation are well below the current uncertainties.
-
•
a from MUSE catalog, magnitude F140W HST.
Missing O32 and R23 values are due to [Oii] undetection because of its position in un-acquired part of the spectrum. H and [Oiii] are always detected.
2.5 Measurements of physical parameters
Following Santini et al. (2022), we measured the stellar masses , the observed absolute UV magnitudes at 1500Å (), the star formation rates (SFRs), and dust reddening by fitting synthetic stellar templates to the seven-band NIRCam photometry and the released HST photometry (Castellano et al., 2016) with zphot (Fontana et al., 2000). We adopted Bruzual & Charlot (2003) models and assumed delayed exponentially declining star formation histories – SFH() – with ranging from 0.1 to 7 Gyr. The age ranges from 10 Myr to the age of the Universe at each galaxy redshift, while metallicity can assume values of 0.02, 0.2 or 1 times Solar metallicity. For the dust extinction, we used the Calzetti et al. (2000) law with ranging from 0 to 1.1. We computed uncertainties on the physical parameters by retaining, for each object, the minimum and maximum fitted masses among all the solutions with a probability of being correct, fixing the redshift to the best-fit value.
As a final step, we needed to adjust the stellar masses and and the SFR values for the lensing amplification factor. The magnification factor was derived by combining the LM-model (Bergamini et al., 2022), the model used by Roberts-Borsani et al. (2022b), with a new spatially more extensive model that fully covers the JWST field of view (Bergamini et al. in prep). The values range from 1.6 to 12, with a median value of . The results on our sources’ stellar masses, , their , and their lensing magnification factors are reported in Table 2.
2.6 Sizes and SFR surface density estimates
The SFRs were derived from the H emission line using the standard conversion by Kennicutt (1998), that is, , and then corrected for the Chabrier IMF. For those few sources at where the H line falls outside the observable window we used dust-corrected H fluxes instead. To correct for slit losses and possible residual uncertainties on flux calibration, we normalized the spectra to the F444W filter by integrating the spectrum under the F444W bandpass, the closest to the H line in our sample. Thanks to the high resolution of the GLASS-JWST spectra, no correction for [Nii] contamination is required for H measurements. For galaxies observed by the DDT programs, H is blended with the [Nii] doublet. However our sources are all very-low-mass galaxies and, based on low-redshift results, we expect contamination to be less than 10% (e.g., Faisst et al., 2018). Therefore, we did not attempt to make any correction on the fluxes.
The results obtained on the SFR were also compared to the values determined by the SED fitting procedure described in Sect. 2.5, finding a reasonable agreement between the two data sets, indicating that there are no systematic issues. Obviously, the SED fitting SFR is heavily dependent on the choice of SFH, and also on the dust correction, while the value derived from the H luminosity is sensitive to short timescales. That is to say that it only probes the presence of short-lived, massive stars, so their ratio is actually an indication of the burstiness of the galaxy.
We measured the size of each galaxy in the F115W band, corresponding to the UV rest-frame of the galaxies. Adopting forward-modeling technique, we assumed that galaxies are well represented by a Sersic profile (Sersic, 1968) as Yang et al. (2022). Then we modeled the appearance of the source in the image plane considering lensing and PSF effects. The source reconstruction was performed via python software Lenstruction (see details in Yang et al., 2020), which is built on Lenstronomy (Birrer et al., 2021). In this way we obtained the intrinsic properties of galaxies in the source plane, hence, the intrinsic size. Finally, we calculated the SFR surface density using the relation (e.g., Naidu et al., 2020; Flury et al., 2022). The SFR surface densities are listed in Table 2.
2.7 UV- slopes
We measured the UV slope of our galaxies from the NIRCam photometry and/or the previously available HST photometry (Castellano et al., 2016), with the approach detailed in Calabrò et al. (2021). In brief, we considered all the photometric bands whose entire bandwidths are between a and Å rest frame. The former limit is set to exclude the Ly line and Ly-break, while the latter limit is slightly larger than that adopted in Calabrò et al. (2021) to ensure a larger range.
Then, we fitted the selected photometry with a single power-law of the form f() . In practice, we fitted two or three photometric bands amongst HST F814W and JWST-NIRCam F115W, F150W or F200W depending on the exact redshift of the sources. This choice allows us to uniformly probe the spectral range between and Å for most of the galaxies. We measured the and associated uncertainty for each source using a bootstrap method. By using Monte Carlo simulations, the fluxes in each band were varied according to their error. The results provided a resultant slope distribution from which we calculated the mean and standard deviation of for each galaxy. The results on with associated errors are reported in Table 2. We find a median of , with a dispersion of . The UV magnitudes that can be derived simultaneously with this approach are consistent with the values obtained from the SED fitting and described in the previous section.
-
•
* Median magnification of the lens model by Bergamini (in prep.), calculated at the position of the source. Measurements are associated with 1 uncertainties. a measured from HST photometry
3 Results
3.1 Possible AGN contamination
Our sample was selected solely based on known spectroscopic redshift (via faint and narrow Ly emission) or through photometric redshifts. It could therefore be affected by AGN contamination. Since we are interested in searching for candidate LyC emitters amongst the star-forming population, we first consider whether the primary source of ionization might not be star formation, but AGN activity instead.


We employed the mass-excitation (MEx) diagram, first proposed by Juneau et al. (2011) to combine the measurements of the [Oiii]/H emission line ratio with the stellar mass to discriminate between AGNs and star-forming galaxies. This diagram was proposed as an alternative to the classical BPT diagram that compares the [Oiii]/H to the [Nii]/H emission line ratios (Baldwin et al., 1981) when these last two lines fall out of the visibility window and it is not possible to use them to characterize the ionization mechanism in the galaxies – as is the case for our low-resolution DDT spectra where the [Nii] doublet is blended with H. Due to the high resolution of the GLASS-JWST spectra, for the galaxies with these observations, we used the dust-corrected flux measurement of the 5007 Å component of the [Oiii] doublet. Instead, for the galaxies observed as part of the DDT program for which the doublet cannot be resolved, we determined the [Oiii] flux, assuming the expected line ratio of 1:3 for the two components fixed by atomic physics. As shown in Fig. 3, the position of our sources in the MEx diagram indicates that our sample contains essentially star forming galaxies, lying below or around the division line identified by Coil et al. (2015) for galaxies and AGN from the MOSDEF survey. For reference, we also plot the galaxies at from the Low-redshift Lyman Continuum Survey from Flury et al. (2022) and the compilation of low-z LCE also used by the same authors (from Izotov et al., 2016a, b, 2018a, 2018b, 2021; Wang et al., 2019).
3.2 LyC indirect diagnostics
As discussed above, Ly is possibly the best indirect diagnostic of LyC escape, since the conditions that favour the escape of Ly photons are often the same that allow for the escape of LyC photons. However, we cannot use this parameter for our sample, since the NIRSpec data do not cover the 1216Å region for most of our galaxies and only a small subset of our sources have been covered by previous MUSE observations (see also Fig. 1). In addition, for the sources at , the IGM becomes significantly neutral, thus absorbing the emission even in sources where the line would be intrinsically bright (e.g., Stark et al., 2010; Pentericci et al., 2011; Mason et al., 2018). Indeed, Morishita et al. (2022) recently showed that none of the galaxies in the protocluster candidate at presents bright Ly emission and estimate an average neutral hydrogen fraction of the IGM in the region to be . Therefore in this work we concentrate on the other most promising diagnostics tested at low redshift by Flury et al. (2022) and available for our galaxies: these authors showed that , , , and as well as and exhibit some of the strongest and most significant correlations with . This would indicate that certain characteristics, such as concentrated star formation, young stellar populations, and high ionization states, play an essential role in the escape of LyC photons.
We began by analyzing the and the rest-frame relation, as shown in Fig. 4. We plot the values for the JWST high-redshift sample and compare them to the local galaxies with measured from previous works (Flury et al., 2022; Izotov et al., 2016a, b, 2018a, 2018b, 2021; Malkan & Malkan, 2021; Wang et al., 2019). These values are color-coded as a function of their (COS UV) measured values. We can see that the large majority of the high-redshift sources have values of larger than 5, which has been indicated as a threshold for LyC leakers (LCEs from here onwards) by Flury et al. (2022). We note that Flury et al. (2022) define leakers as galaxies with an measured with . Our sample indeed mostly lies in the region of the plot populated by low-redshift leakers. In Fig. 5, we show as a function of total stellar mass, again comparing our sample to the low-z galaxies: our sample perfectly overlaps with the low-z galaxies at the low-mass end, where we find most of the LCEs.

Zackrisson et al. (2013) suggested that galaxies ought to be identified with high by combining the UV slope with the measurement of the EW of a Balmer line, such as H, and that the predictions are almost independent of the model assumed (i.e., radiation or density bounded nebula). We know that both and are also good indirect indicators according to Flury et al. (2022), although there does not seem to be a direct correlation between the two values: Flury et al. (2022) showed that their LCEs do not seem to follow the predictions provided by the models from Zackrisson et al. (2013).
We show the properties of our sample in Fig. 6. Specifically, at a given value of , the high-redshift galaxies are, on average, bluer than the majority of the low-z galaxies (consistent with the lower stellar mass probed by our sources); but their slopes are similar to the subset of the low-z sources with moderate-to-high values for . The slopes for our galaxies are perfectly consistent with the average values found for LBGs at z for galaxies with in the same range Bouwens et al. (2014). In the figure, we also show the models from Zackrisson et al. (2013) for various values of escape fraction, after correcting the intrinsic slopes of the models for dust attenuation and assuming the average reddening of our sample derived from the SED fitting, (solid line), and also the maximum and minimum in our sample (shaded area). We note that our galaxies show more consistency with model predictions that assume moderate-to-low escape fractions .
Finally, we analyzed the sizes and star formation rate density for our galaxies. Several authors have postulated that concentrated star formation provides the feedback necessary to clear paths in the ISM that allow for the escape of LyC photons. In addition, Marchi et al. (2018) recently found that stacks of galaxies that are UV-compact ( kpc) have much higher LyC flux than the average population (see also Izotov et al., 2018b). We find that, with the exception of one galaxy (ID 160281, which has ), our targets are all extremely compact with typical in the rest-frame UV around kpc. These values are similar or even lower than those found for the low-z galaxies and LCEs (Flury et al., 2022); thus, once again the high-redshift sources have equal properties to the low-z LCEs. Since we know that sizes evolve with redshift and galaxies become progressively more compact, we also compared our sample to the general population of star-forming galaxies (LBGs selected) at analyzed by Shibuya et al. (2015). Specifically, for , the average UV rest-frame sizes are kpc, respectively. Thus, indeed our galaxies are, from this point of view, as compact as the general UV faint population at the same redshift.
As for the star formation rate densities, the values of for our galaxies span a very wide range, with an average that is slightly higher than the average expected at their redshift, as measured by Shibuya et al. (2015). We note that their values are inferred from the UV and then dust corrected. LyC leakers at low and intermediate redshift, tend to show high values, as discussed extensively by Naidu et al. (2020), who actually proposed a physically motivated model in which would scale as . Flury et al. (2022) identify a threshold value of above which their LCE fraction changes from 10% to 60%, and where indeed we find half of our high-redshift galaxies.
3.3 O32-R23 diagnostics
The vs index diagram (Fig. 7) is widely used to examine the gas-phase metallicity and ionization state both in the local universe (e.g., Thomas et al., 2013; Izotov et al., 2016a, b, 2018a, 2018b) and at high redshift (e.g., Flury et al., 2022; Nakajima et al., 2020; Reddy et al., 2022; Vanzella et al., 2019), as both these indices are sensitive to combination of these quantities. Nakajima et al. (2020) showed that LyC leakers tend to populate the upper right part of this diagram. Recently Katz et al. (2020) used high-resolution cosmological radiation hydrodynamics simulations to examine the properties of LyC leakers deep into the epoch of reionization and found that simulated high-redshift galaxies populate the same regions of the plane, as the z 3 LyC leakers presented in Nakajima et al. (2020) that tend to have low metallicity. Although they conclude that this plane is not the most useful to differentiate between leakers and non-leakers we note that the leakers by Nakajima et al. (2020), with measured values and Ion2 occupy the same region as the low-redshift leakers. Our galaxies occupy a much broader region, which could reflect either a wider range of metallicity and ionization states or simply the fact that we have large measured uncertainties on the diagnostics.


4 Predicting escape fractions of EoR galaxies
In the sections above, we have shown that our high-redshift galaxies have properties that are largely overlapping with those of low-z LCEs. The next step is to try and give an indirect estimate of the values for our galaxies, so as to understand if typical low-mass galaxies at could be really the drivers of reionization. We assume that the mechanisms that drive the escape of LyC photons are the same at all redshifts and depend only on the physical properties of the sources.
We proceeded as follows: we used the spectroscopic and physical properties of the 66 galaxies that are part of the Flury et al. (2022) sample, with the additional 22 LCEs from previous studies (Izotov et al., 2016a, b, 2018a, 2018b, 2021; Wang et al., 2019) to calibrate an empirical relation with the measured values. Specifically, we focused on the following properties: , , , (in kpc), , and . For all 88 galaxies, these parameters are accurately measured and, of course, accurate measurements of are available. To this end, we specifically used the derived by the COS UV spectral fits (see definition in Flury et al., 2022). Recently Chisholm et al. (2022) followed a somewhat similar approach, also using the same set of low-redshift observations, but limited to the UV- slope and an indirect proxy. They provided a scaling relation between and , although the relation has appreciable scatter that scales with .
We first ran the Spearman rank correlation and found that , , , and (in that order) are the properties that are best correlated with . We then identified one useful fitting linear relation to obtain an estimate of on the basis of the other four measured physical properties. A fully data-driven regression analysis was carried out by performing a regularized minimization of the root-mean-square error (MSE), computed between the values provided by the equation and the dataset, for several possible combinations of the above properties. We tested both a scheme in which the error on the escape fraction, , is not considered and a scheme in which values are weighted by the error. Since and exhibit a very tight correlation (Spearman correlation between them , see also Fig. 4), the information they provide is redundant and therefore we decided to use only . We checked that the remaining three parameters are reasonably independent (Spearman correlation 0.5) and therefore provide complementary information. We finally found a best-fit relation of the form:
| (1) |
After identifying the best type of equation, we repeated the minimization process 100 times, following a bootstrap approach every time a random number of sources (between 1 and 25, to avoid being left with too few sources) is randomly removed from the sample. In this way, we could constrain the confidence interval for the above best fit parameters. We find , , , , where the values between the parentheses are in the 95th percentile distribution.
Testing the relation on the residuals, we find that it tends to slightly overestimates the at very low values (much lower than 0.01), while it tends to underestimate the at values that are higher than 0.1-0.2. This is due to the fact that in the sample used to fit the relation, there are very few galaxies with high values and, in general, their measured values have higher errors.
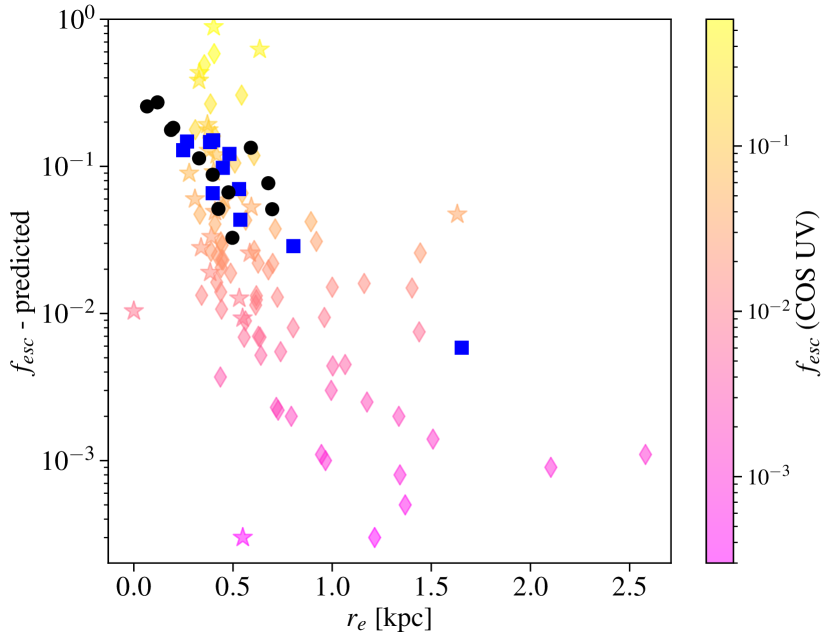
We finally applied the above relation to our sample of high-redshift galaxies: out of 29 sources, 3 galaxies do not have the measurement since they are outside the UNCOVER footprint; for another 2, we do not have an estimate for the parameter. We therefore could apply the best-fitting relation only to 24 sources. In Fig. 8, we show the predicted for our sources as a function of , as well as the low-redshift comparison sample (for which the are measured values). Most of our galaxies have predicted values larger than 0.05, meaning that they would be considered leakers. The average is with the bluest and most compact sources having as large as , which could be lower limits for the reasons discussed above.
Clearly, the main limitations of the above analysis are the fact that the low-z sample used to calibrate the relation is small and, most importantly, it is not evenly populated as it contains mostly objects with rather low . Also, it would be important to test these predictions at intermediate redshift (), that is, much closer to the EoR, where it is possible to both directly detect LyC emission and determine all other physical and spectroscopic properties. However, at the moment, measurements of at intermediate redshift are still sparse and most samples lack near-infrared (NIR) spectroscopic follow-up results. In spite of these limitations, a consistent picture emerges from our results, suggesting low-mass galaxies at have mostly properties which indicate moderate values of . Interestingly, the average value inferred for our sample is equal to the one predicted by Naidu et al. (2020) for galaxies in the mass range at , according to their simple model, where scales with , which was constrained to reproduce the average observed values for the Steidel et al. (2018) sample at .
5 Summary and conclusions
Thanks to the magnification power of the Abell 2744 cluster, in this paper, we present the first JWST/NIRSpec observations of 29 gravitationally lensed galaxies with photometric or spectroscopic redshift in the range . From a combined NIRSpec and NIRCam analysis, we were able to derive accurate physical properties of the galaxies, including , SFR, , UV- slopes, and measurements of the most prominent optical emission lines ([Oii], [Oiii], H, H). We summarize our findings as follows:
-
•
Our sample is composed of purely star-forming galaxies, as inferred from the MEx diagram that excludes the presence of any AGN.
- •
-
•
Compared to the low-z sample by Flury et al. (2022) as well as to the low-z LCEs from previous studies, our galaxies present properties (in terms of , , UV- slopes, , and ) that are entirely consistent with those of low-z galaxies with measured larger than 0.05 and which are considered to be LyC leakers.
-
•
Using a linear analysis that employs the minimization of MSE, we found a best fitting relation between and the three most correlated and independent parameters (, UV-, and ) for the low-redshift sample of 88 galaxies. Applying this relation to the 24 galaxies from our sample where these parameters are all measured, we find that 20/24 have predicted escape fractions larger than 0.05, that is, they would be considered leakers and the average of our sample is 0.12.
In conclusion, our results show that indeed the average low-mass galaxies around the epoch of reionization have physical and spectroscopic properties consistent with moderate values of escaping ionizing photons (). With upcoming JWST observations from GTO and GO programs, this analysis could be easily extended to larger samples of galaxies with higher masses and/or at higher redshift to determine if the bulk of the reionizing photons have been provided by even more massive and brighter galaxies (as predicted, e.g., by Sharma et al., 2016; Naidu et al., 2020) or if we need a more substantial contribution by the fainter and more numerous galaxies with as predicted by most other popular models (e.g., Trebitsch et al., 2022; Finkelstein et al., 2019; Atek et al., 2015).
Acknowledgements.
Support for program JWST-ERS-1324 was provided by NASA through a grant from the Space Telescope Science Institute, which is operated by the Association of Universities for Research in Astronomy, Inc., under NASA contract NAS 5-03127. This work is based on observations made with the NASA/ESA/CSA James Webb Space Telescope. The data were obtained from the Mikulski Archive for Space Telescopes at the Space Telescope Science Institute, which is operated by the Association of Universities for Research in Astronomy, Inc., under NASA contract NAS 5-03127 for JWST. These observations are associated with programs GLASS-JWST #1324, JWST DDT #2756 and GO UNCOVER #2561. SM thanks the Department of Physics and Astronomy at the University of California, Los Angeles, for a productive and satisfying visit in which the majority of the work presented in this paper was done. We acknowledge support from the INAF Large Grant 2022 “Extragalactic Surveys with JWST” (PI Pentericci). This research is supported in part by the Australian Research Council Centre of Excellence for All Sky Astrophysics in 3 Dimensions (ASTRO 3D), through project number CE170100013. LY acknowledges support by JSPS KAKENHI Grant Number JP 21F21325. RAW acknowledges support from NASA JWST Interdisciplinary Scientist grants NAG5-12460, NNX14AN10G and 80NSSC18K0200 from GSFC. MB acknowledges support from the Slovenian national research agency ARRS through grant N1-0238. CM acknowledges support by the VILLUM FONDEN under grant 37459. The Cosmic Dawn Center (DAWN) is funded by the Danish National Research Foundation under grant DNRF140. KG and TN acknowledge support from Australian Research Council Laureate Fellowship FL180100060.References
- Alavi et al. (2020) Alavi, A., Colbert, J., Teplitz, H. I., et al. 2020, ApJ, 904, 59
- Atek et al. (2015) Atek, H., Richard, J., Kneib, J.-P., et al. 2015, ApJ, 800, 18
- Baldwin et al. (1981) Baldwin, J. A., Phillips, M. M., & Terlevich, R. 1981, PASP, 93, 5
- Bassett et al. (2019) Bassett, R., Ryan-Weber, E. V., Cooke, J., et al. 2019, MNRAS, 483, 5223
- Bergamini et al. (2022) Bergamini, P., Acebron, A., Grillo, C., et al. 2022, arXiv e-prints, arXiv:2207.09416
- Bergvall et al. (2013) Bergvall, N., Leitet, E., Zackrisson, E., & Marquart, T. 2013, A&A, 554, A38
- Binggeli et al. (2018) Binggeli, C., Zackrisson, E., Pelckmans, K., et al. 2018, MNRAS, 479, 368
- Birrer et al. (2021) Birrer, S., Shajib, A., Gilman, D., et al. 2021, The Journal of Open Source Software, 6, 3283
- Bolan et al. (2021) Bolan, P., Lemaux, B. C., Mason, C., et al. 2021, arXiv e-prints, arXiv:2111.14912
- Bouwens et al. (2014) Bouwens, R. J., Illingworth, G. D., Oesch, P. A., et al. 2014, ApJ, 793, 115
- Bruzual & Charlot (2003) Bruzual, G. & Charlot, S. 2003, MNRAS, 344, 1000
- Calabrò et al. (2021) Calabrò, A., Castellano, M., Pentericci, L., et al. 2021, A&A, 646, A39
- Calzetti et al. (2000) Calzetti, D., Armus, L., Bohlin, R. C., et al. 2000, ApJ, 533, 682
- Castellano et al. (2016) Castellano, M., Dayal, P., Pentericci, L., et al. 2016, ApJ, 818, L3
- Chabrier (2003) Chabrier, G. 2003, PASP, 115, 763
- Chisholm et al. (2020) Chisholm, J., Prochaska, J. X., Schaerer, D., Gazagnes, S., & Henry, A. 2020, MNRAS, 498, 2554
- Chisholm et al. (2022) Chisholm, J., Saldana-Lopez, A., Flury, S., et al. 2022, MNRAS, 517, 5104
- Coil et al. (2015) Coil, A. L., Aird, J., Reddy, N., et al. 2015, ApJ, 801, 35
- Curti et al. (2023) Curti, M., D’Eugenio, F., Carniani, S., et al. 2023, MNRAS, 518, 425
- de Barros et al. (2016) de Barros, S., Vanzella, E., Amorín, R., et al. 2016, A&A, 585, A51
- Domínguez et al. (2013) Domínguez, A., Siana, B., Henry, A. L., et al. 2013, ApJ, 763, 145
- Dopita & Sutherland (2003) Dopita, M. A. & Sutherland, R. S. 2003, Astrophysics of the diffuse universe
- Faisst et al. (2018) Faisst, A. L., Masters, D., Wang, Y., et al. 2018, ApJ, 855, 132
- Finkelstein et al. (2019) Finkelstein, S. L., D’Aloisio, A., Paardekooper, J.-P., et al. 2019, ApJ, 879, 36
- Flury et al. (2022) Flury, S. R., Jaskot, A. E., Ferguson, H. C., et al. 2022, ApJS, 260, 1
- Fontana et al. (2000) Fontana, A., D’Odorico, S., Poli, F., et al. 2000, AJ, 120, 2206
- Gazagnes et al. (2020) Gazagnes, S., Chisholm, J., Schaerer, D., Verhamme, A., & Izotov, Y. 2020, A&A, 639, A85
- Inoue et al. (2014) Inoue, A. K., Shimizu, I., Iwata, I., & Tanaka, M. 2014, MNRAS, 442, 1805
- Izotov et al. (2022) Izotov, Y. I., Chisholm, J., Worseck, G., et al. 2022, MNRAS, 515, 2864
- Izotov et al. (2021) Izotov, Y. I., Guseva, N. G., Fricke, K. J., et al. 2021, A&A, 646, A138
- Izotov et al. (2016a) Izotov, Y. I., Orlitová, I., Schaerer, D., et al. 2016a, Nature, 529, 178
- Izotov et al. (2016b) Izotov, Y. I., Schaerer, D., Thuan, T. X., et al. 2016b, MNRAS, 461, 3683
- Izotov et al. (2018a) Izotov, Y. I., Schaerer, D., Worseck, G., et al. 2018a, MNRAS, 474, 4514
- Izotov et al. (2018b) Izotov, Y. I., Worseck, G., Schaerer, D., et al. 2018b, MNRAS, 478, 4851
- Juneau et al. (2014) Juneau, S., Bournaud, F., Charlot, S., et al. 2014, ApJ, 788, 88
- Juneau et al. (2011) Juneau, S., Dickinson, M., Alexander, D. M., & Salim, S. 2011, ApJ, 736, 104
- Jung et al. (2020) Jung, I., Finkelstein, S. L., Dickinson, M., et al. 2020, ApJ, 904, 144
- Kashino et al. (2013) Kashino, D., Silverman, J. D., Rodighiero, G., et al. 2013, ApJ, 777, L8
- Katz et al. (2020) Katz, H., Ďurovčíková, D., Kimm, T., et al. 2020, MNRAS, 498, 164
- Kennicutt (1998) Kennicutt, Jr., R. C. 1998, ARA&A, 36, 189
- Mahler et al. (2018) Mahler, G., Richard, J., Clément, B., et al. 2018, MNRAS, 473, 663
- Malkan & Malkan (2021) Malkan, M. A. & Malkan, B. K. 2021, ApJ, 909, 92
- Marchi et al. (2018) Marchi, F., Pentericci, L., Guaita, L., et al. 2018, A&A, 614, A11
- Mascia et al. (2023) Mascia, S., Pentericci, L., Saxena, A., et al. 2023, arXiv e-prints, arXiv:2301.09328
- Mason et al. (2019) Mason, C. A., Fontana, A., Treu, T., et al. 2019, MNRAS, 485, 3947
- Mason et al. (2018) Mason, C. A., Treu, T., Dijkstra, M., et al. 2018, ApJ, 856, 2
- Merlin et al. (2022) Merlin, E., Bonchi, A., Paris, D., et al. 2022, arXiv e-prints, arXiv:2207.11701
- Morishita et al. (2022) Morishita, T., Roberts-Borsani, G., Treu, T., et al. 2022, arXiv e-prints, arXiv:2211.09097
- Naidu et al. (2020) Naidu, R. P., Tacchella, S., Mason, C. A., et al. 2020, ApJ, 892, 109
- Nakajima et al. (2020) Nakajima, K., Ellis, R. S., Robertson, B. E., Tang, M., & Stark, D. P. 2020, ApJ, 889, 161
- Nakajima & Ouchi (2014) Nakajima, K. & Ouchi, M. 2014, MNRAS, 442, 900
- Nakajima et al. (2023) Nakajima, K., Ouchi, M., Isobe, Y., et al. 2023, arXiv e-prints, arXiv:2301.12825
- Oke & Gunn (1983) Oke, J. B. & Gunn, J. E. 1983, ApJ, 266, 713
- Ouchi et al. (2020) Ouchi, M., Ono, Y., & Shibuya, T. 2020, ARA&A, 58, 617
- Pahl et al. (2021) Pahl, A. J., Shapley, A., Steidel, C. C., Chen, Y., & Reddy, N. A. 2021, MNRAS, 505, 2447
- Pentericci et al. (2011) Pentericci, L., Fontana, A., Vanzella, E., et al. 2011, ApJ, 743, 132
- Pentericci et al. (2018) Pentericci, L., Vanzella, E., Castellano, M., et al. 2018, A&A, 619, A147
- Planck Collaboration et al. (2020) Planck Collaboration, Aghanim, N., Akrami, Y., et al. 2020, A&A, 641, A6
- Price et al. (2014) Price, S. H., Kriek, M., Brammer, G. B., et al. 2014, ApJ, 788, 86
- Reddy et al. (2022) Reddy, N. A., Topping, M. W., Shapley, A. E., et al. 2022, ApJ, 926, 31
- Richard et al. (2021) Richard, J., Claeyssens, A., Lagattuta, D., et al. 2021, A&A, 646, A83
- Roberts-Borsani et al. (2022a) Roberts-Borsani, G., Morishita, T., Treu, T., et al. 2022a, arXiv e-prints, arXiv:2207.11387
- Roberts-Borsani et al. (2022b) Roberts-Borsani, G., Treu, T., Chen, W., et al. 2022b, arXiv e-prints, arXiv:2210.15639
- Robertson et al. (2015) Robertson, B. E., Ellis, R. S., Furlanetto, S. R., & Dunlop, J. S. 2015, ApJ, 802, L19
- Santini et al. (2022) Santini, P., Fontana, A., Castellano, M., et al. 2022, arXiv e-prints, arXiv:2207.11379
- Saxena et al. (2022) Saxena, A., Cryer, E., Ellis, R. S., et al. 2022, MNRAS, 517, 1098
- Schaerer et al. (2022) Schaerer, D., Izotov, Y. I., Worseck, G., et al. 2022, A&A, 658, L11
- Senchyna et al. (2022) Senchyna, P., Stark, D. P., Charlot, S., et al. 2022, ApJ, 930, 105
- Sersic (1968) Sersic, J. L. 1968, Atlas de Galaxias Australes
- Sharma et al. (2016) Sharma, M., Theuns, T., Frenk, C., et al. 2016, MNRAS[arXiv:1512.04537]
- Shibuya et al. (2015) Shibuya, T., Ouchi, M., & Harikane, Y. 2015, ApJS, 219, 15
- Stark et al. (2010) Stark, D. P., Ellis, R. S., Chiu, K., Ouchi, M., & Bunker, A. 2010, MNRAS, 408, 1628
- Steidel et al. (2018) Steidel, C. C., Bogosavljević, M., Shapley, A. E., et al. 2018, ApJ, 869, 123
- Thomas et al. (2013) Thomas, D., Steele, O., Maraston, C., et al. 2013, MNRAS, 431, 1383
- Trebitsch et al. (2022) Trebitsch, M., Dayal, P., Chisholm, J., et al. 2022, arXiv e-prints, arXiv:2212.06177
- Treu et al. (2022) Treu, T., Roberts-Borsani, G., Bradac, M., et al. 2022, ApJ, 935, 110
- Vanzella et al. (2019) Vanzella, E., Calura, F., Meneghetti, M., et al. 2019, MNRAS, 483, 3618
- Vanzella et al. (2016) Vanzella, E., de Barros, S., Vasei, K., et al. 2016, ApJ, 825, 41
- Verhamme et al. (2017) Verhamme, A., Orlitová, I., Schaerer, D., et al. 2017, A&A, 597, A13
- Wang et al. (2019) Wang, B., Heckman, T. M., Leitherer, C., et al. 2019, ApJ, 885, 57
- Xu et al. (2022) Xu, X., Henry, A., Heckman, T., et al. 2022, ApJ, 933, 202
- Yamanaka et al. (2020) Yamanaka, S., Inoue, A. K., Yamada, T., et al. 2020, MNRAS, 498, 3095
- Yang et al. (2020) Yang, L., Birrer, S., & Treu, T. 2020, Monthly Notices of the Royal Astronomical Society, 496, 2648
- Yang et al. (2022) Yang, L., Leethochawalit, N., Treu, T., et al. 2022, MNRAS, 514, 1148
- Zackrisson et al. (2017) Zackrisson, E., Binggeli, C., Finlator, K., et al. 2017, ApJ, 836, 78
- Zackrisson et al. (2013) Zackrisson, E., Inoue, A. K., & Jensen, H. 2013, ApJ, 777, 39