BROOK Dataset: A Playground for Exploiting Data-Driven Techniques in Human-Vehicle Interactive Designs
Abstract.
Emerging Autonomous Vehicles (AV) breed great potentials to exploit data-driven techniques for adaptive and personalized Human-Vehicle Interactions. However, the lack of high-quality and rich data supports limits the opportunities to explore the design space of data-driven techniques, and validate the effectiveness of concrete mechanisms. Our goal is to initialize the efforts to deliver the building block for exploring data-driven Human-Vehicle Interaction designs. To this end, we present BROOK dataset, a multi-modal dataset with facial video records. We first brief our rationales to build BROOK dataset. Then, we elaborate how to build the current version of BROOK dataset via a year-long study, and give an overview of the dataset. Next, we present three example studies using BROOK to justify the applicability of BROOK dataset. We also identify key learning lessons from building BROOK dataset, and discuss about how BROOK dataset can foster an extensive amount of follow-up studies.
1. Introduction
Recent advances in data-driven techniques (e.g. Neural Networks) breed an extensive amount of opportunities, to enable adaptive and personalized Human-Vehicle Interaction (HVI). More interestingly, the emerging trends of Autonomous Vehicles relax the conventional burdens of driving, and in-vehicle drivers/passengers are capable to obtain better user experiences through more complex HVI. Incorporating data-driven approaches can greatly improve user experiences during driving processes. For instance, unobtrusive monitors of multi-modal statuses (i.e. by taking alternative data sources as input), rather than directly equipping biosensors, are more user-friendly as data sources for personalized interaction between drivers and vehicles. Therefore, combining data-driven techniques with HVI becomes promising in the near future, and relevant datasets become essential and highly demanded.
Though there are already several datasets for HVI, there are four major limitations of existing datasets. First, the design purposes of existing datasets focus on a specific type of study purposes (e.g. Stress Detection (Healey and Picard, 2005), Driving Workload (Schneegass et al., 2013) and etc.), which naturally limits their potentials due to the narrowly-selected types of data streams. Second, existing datasets only collect information when drivers are in manual mode, which is not suitable for the emerging trends of Autonomous Vehicles. Third, existing datasets don’t have sufficient coverage of the contextual data, especially the statistics of Vehicle Statuses; and fourth, existing datasets don’t account for advanced bio-sensors (e.g. Eye-Tracking devices), which restricts the volumes of physiological data (Section 2).
Therefore, a comprehensive dataset can unleash the opportunities to leverage data-driven designs for HVI and validate their effectiveness in practice. Data-driven designs usually demand large-scale datasets as the building block, for training, testing and validating their performance and efficiency. Our goal in this work is to initialize constructing such a building block to stimulate diverse types of explorations and allow reasonable comparisons across different designs. We believe that achieving such a goal is two-folded. First, we aim to build such a dataset as comprehensively as possible; and second, we aim to justify the applicability of such a dataset via concrete demonstrations of example studies.
To this end, we present BROOK111The name ”BROOK” refers to multiple water flows, which stands for the key idea of our dataset dataset, a multi-modal and facial video dataset for data-driven HVI. The aim of the BROOK dataset is to provide a publicly available222BROOK dataset is approved to be shared by all participants, would be released on a public website, and would be accessed upon requests. and large-scale dataset within the domain of HVI. The outcome of building the BROOK dataset is the most comprehensive dataset in HVI to date, which contains much more kinds of data streams than previous datasets. The key idea, behind BROOK, is to map as many kinds of data flows as possible in the same timeline, when participants are under both manual and fully-automated driving scenarios. Such guiding philosophy allows BROOK to retrieve statistics from 34 drivers in 11 dimensions (i.e. 4 physiological and 7 contextual). We provide sufficient details regarding how BROOK is organized, and how we build the BROOK dataset, via a year-long study. We also provide detailed descriptions and release the sources of all relevant software, when we are building the BROOK dataset333Software supports for the BROOK dataset would be released simultaneously with the release of the dataset. (Section 3).
To justify the applicability of the BROOK dataset, we design and perform three example studies to demonstrate the potentials of the BROOK dataset. First, we provide unobtrusive techniques to collect multi-modal statistics from drivers, without equipping biosensors. We achieve this through Convolution Neural Networks over the BROOK dataset, by taking facial expressions as the only input. Second, we quantitatively demystify complicated interactions between driving behaviors and driving styles and provide an adaptive approach to handle such complexity. We achieve this through Self-Clustering algorithms over the BROOK dataset, by dynamically identifying the number of clusters and merging data points accordingly. Third, we identify the tradeoffs between different privacy-preserving techniques in the context of Internet-of-Vehicles. By exploiting four state-of-the-art Differential Privacy mechanisms, we retrieve key observations in terms of accuracy-privacy tradeoffs among different mechanisms. We believe the BROOK dataset can be applied to more contexts beyond the above three examples, by taking different types of data streams as primary sources (Section 4).
We highlight the most significant results/findings from our three example studies. For our first example. we demonstrate great potential for this unobtrusive alternative, by achieving 82.96%, 57.90%, and 58.75% accuracy in terms of Skin Conductance, Heart Rates, and Vehicle Speed predictions (i.e. by taking facial videos as the only input, rather than equipping the sensors). For our second example, we justify that Self-Clustering algorithms can quantitatively classify diverse combinations of different driving styles in an adaptive manner. And for our third example, we identify the needs of co-designing the applications and privacy-preserving techniques for data utility and privacy, in the context of Internet-of-Vehicles. The above results suggest the potentials of both the BROOK dataset and example studies are significant, and we conjecture that future characterizations and explorations of BROOK are promising.
We position the BROOK dataset as a starting point for data supports of adaptive and personalized Human-Vehicle Interactions, rather than a definitive complete answer. This is because our study has several limitations, which are incapable to be resolved by a single research group. We envision that a community-wide collaboration is essential for building a complete dataset. We discuss the potential optimizations of our dataset and summarize key learning lessons for future attempts, to provide a comprehensive dataset for HVI (Section 5).
We make the following three key contributions in this paper:
-
•
We present the BROOK dataset, a multi-modal and facial video dataset which consists of 34 real-world drivers and their statistics in 11 dimensions. The coverage of BROOK includes driving statuses, multi-modal statistics and video recordings during both manual and autonomous driving procedures.
-
•
We present three example studies, to demonstrate the potentials of the BROOK dataset. Our empirical results confirm the quality of the BROOK dataset, and suggest novel insights for using data-driven techniques in Human-Vehicle Interaction.
-
•
We summarize important lessons when building and using BROOK dataset, and discuss potential directions for more usages of the BROOK dataset. We hope that these lessons can help with future efforts to build or leverage BROOK-like datasets for Human-Vehicle Interaction.
The rest of this paper is organized as follows. Section 2 presents the background and motivation to build BROOK dataset. Section 3 gives an overview and present details on how we collect BROOK dataset. Section 4 presents three example studies, including: (1) an unobtrusive technique to obtain multi-modal and driving statistics via only facial expressions; (2) our design, implementation and empirical evaluations to demystify the complicated interactions between driving behaviors and styles; (3) our design, deployment and characterization of different methods of Differential Privacy for Internet-of-Vehicles. Section 5 covers limitations and lessons we learned while building the BROOK dataset, and discusses potential research directions using BROOK-like datasets.
2. Background & Motivation
In this section, we provide background and motivation to build BROOK dataset. We first identify the growing importance of data-driven techniques in Human-Vehicle Interaction (Section 2.1). Then, we briefly elaborate existing datasets and their usage scenarios for Human-Vehicle Interaction, and identify their design purposes accordingly (Section 2.2). Finally, we comprehensively compare the detailed compositions of existing datasets and our proposed BROOK dataset, to justify our novelty (Section 2.3).
2.1. Data-Driven Techniques for Human-Vehicle Interaction
With the emerging trend of Autonomous Vehicles in the industry, research interests have grown significantly in Human-Vehicle Interaction (HVI) field, trying to tackle various problems for the coming era. A recent summary categorizes existing studies into two general types, according to manual and autonomous driving contexts respectively (Kun, 2018). The underlying essence for the HVI study is to understand both drivers’ states and the temporal events outside the vehicle, by leveraging multiple data-driven techniques. Current data-driven techniques are designed for various purposes, such as (1) tracking driver attention (Borghi, 2018; Yang et al., 2020); (2) analyzing driving styles (Hooft van Huysduynen et al., 2015; Md Yusof et al., 2016; Wang et al., 2019); (3) analyzing effects of situations outside the vehicle (Geiger et al., 2013; Ramanishka et al., 2018; Yu et al., 2020);(4) predicting drivers’ drowsiness, attention, and emotion through facial expressions or eye gazes (Ortega et al., 2020; Palazzi et al., 2019; Fang et al., 2019; Jegham et al., 2020); (5) monitoring driver’s behaviors regarding distractions and temporal performance by utilizing body-based monitoring mechanisms (Abouelnaga et al., 2018; Deo and Trivedi, 2018); (6) detecting drivers’ emotion arousal (e.g. neutral, sadness and happiness) (Kamachi et al., 1997; Goeleven et al., 2008; Pantic et al., 2005). To sum up, current data-driven techniques for HVI study have introduced valuable insights towards adaptive and personalized HVI systems so far, yet it is essential to explore more advanced techniques for the field with more diversified data inputs.
2.2. Existing Datasets for Human-Vehicle Interaction
There are several publicly available datasets for advanced Human-Vehicle Interaction Research. Hereby, we summarize five key datasets and discuss their application scenarios. Table 1 presents the comparison between existing datasets and BROOK dataset (our proposal). Distracted Driver Dataset (Eraqi et al., 2019) aims to provide a solid foundation for studies regarding stress detection and posture classification, during the driving procedure; brain4cars (Jain et al., 2016) aims to enable design exploration in terms of Maneuver Estimation; MIT driverDB (Healey and Picard, 2005) provides relatively more types of data streams for detailed characterizations of stress detection; HciLab (Schneegass et al., 2013) aims to measure driving workloads and provides empirical studies for proofs-of-concept; and AffectiveROAD (Haouij et al., 2018) targets personalized Human-Vehicle Interactions, by providing relevant monitors of affective states. All the above datasets are purpose-dependent and there are certain limitations for exploring more design spaces since their design purposes are deterministic and centralized on particular domains. Different from the above datasets, the goal of BROOK is to provide a comprehensive dataset to exploit data-driven techniques for Adaptive and Personalized Human-Vehicle Interaction.
| Dataset | Design Purposes | |
|---|---|---|
| Distracted Driver Dataset (Eraqi et al., 2019) |
|
|
| brain4cars (Jain et al., 2016) | Maneuver Estimation | |
| MIT driverDB (Healey and Picard, 2005) | Stress Detection | |
| HciLab (Schneegass et al., 2013) |
|
|
| AffectiveROAD (Haouij et al., 2018) |
|
|
| BROOK (Our Dataset) |
|
2.3. Detailed Comparisons among Existing Datasets and BROOK Dataset
We first brief different types of data streams within the above datasets and the BROOK dataset. Table 2 presents the detailed comparisons between existing datasets and the BROOK dataset. Compared to the BROOK dataset, existing datasets share two major limitations: (1) most datasets are designed for study-specific purposes, which might be restrictive for exploring novel designs; and (2) most datasets focus on the monitoring of drivers’ physiological states and analysis of affective states, but the important statistics of driving context are relatively overlooked. As Table 2 shows, existing publicly available datasets fall short of contextual information, which would be critical for the development of adaptive and personalized HVI systems for complicated driving scenarios.
| Number of Drivers | Driving Mode | Data Types | ||||||||||||||||||
|
Contextual Data | |||||||||||||||||||
|
31 | Manual | 10 classes of driver postures | / | ||||||||||||||||
| brain4cars (Jain et al., 2016) | 10 | Manual | Facial Video |
|
||||||||||||||||
| MIT driverDB (Healey and Picard, 2005) | 24 | Manual |
|
Road Video | ||||||||||||||||
| HciLab (Schneegass et al., 2013) | 10 | Manual |
|
|
||||||||||||||||
| AffectiveROAD (Haouij et al., 2018) | 10 | Manual |
|
|
||||||||||||||||
|
34 |
|
|
|
||||||||||||||||
We describe the compositions of existing datasets in detail. Most of them are designed to study drivers’ affective states during driving procedures. The MIT driverDB dataset (Healey and Picard, 2005) collects drivers’ physiological data (Electrodermal Activity (EDA), Electrocardiogram (ECG), Electromyogram (EDM) and etc.), together with in-vehicle and in-field videos from 20 miles of driving between the city and the highway (i.e. in the Greater Boston area). HciLab dataset (Schneegass et al., 2013) has similar driver physiological data (EDA,ECG, Body Temperature and Facial Video) and different contextual data (In-vehicle Brightness, Vehicle Acceleration, and Road Video), which are collected from 10 drives in highway and freeway in Germany. AffectiveROAD dataset (Haouij et al., 2018) obtains its data from 13 drives performed by 10 drivers, which covers EDA, Body Temperature, Heart Rate, Hand Movement, and Facial Video for driver statistics, with multiple situational data, such as Luminance, Temperature, Pressure, Humidity, etc. Both HciLab dataset and AffectiveROAD dataset include a self-scored, self-reported stress level from the driver after the experiments. A similar dataset to AffectiveROAD, brain4cars (Jain et al., 2016), contains drivers’ facial video, road video, vehicle GPS information and a speed logger about 10 drivers with different kinds of driving maneuvers across two states, who drive their private cars for 1180 miles between natural freeway and cities. Distracted Driver dataset (Eraqi et al., 2019) mainly contains 10 different types of driver postures, such as safe driving, talking to the phone, adjusting radio, etc., which are collected from 31 participants.
Compared with existing datasets, the BROOK dataset has three major differences: (1) the above datasets are mainly designed for driver stress level monitoring, while BROOK can support more diverse applications such as driver-style classifications; (2) the above datasets only contain manual mode driving data, while BROOK has both manual mode and auto mode driving statistics; and (3) BROOK collects more types of vehicle data (e.g. steering wheel positions, brake and throttle status) from more drivers (i.e. 34 drivers in total), which not only provides more contextual information in the driving process but also guarantees the diversity of driving statistics.
3. BROOK Dataset
In this section, we introduce BROOK dataset in detail. We first give an overview of BROOK dataset, regarding its high-level characteristics and compositions. Then we introduce the hardware and software for collecting BROOK dataset. Next, we highlight novel features under our consideration, when we are building BROOK dataset. Finally, we present the procedure of data collection for BROOK dataset.
3.1. An Overview of BROOK Dataset
The current version of BROOK dataset has facial videos and many multi-modal/driving status data of 34 drivers. Statistics of each participant are collected within a 20-minute in-lab studies, which is separated into manual mode and automated mode separately. Figure 1 shows 11 dimensions of data for the current BROOK dataset, which includes: Facial Video, Vehicle Speed, Vehicle Acceleration, Vehicle Coordinate, Distance of Vehicle Ahead, Steering Wheel Coordinates, Throttle Status, Brake Status, Heart Rate, Skin Conductance, and Eye Tracking.

We follow the guiding principle while building the BROOK dataset, so that we map all kinds of data streams to the same time flow. To summarize our collection, we use the relationships between data types and data sizes for demonstration. Table 3 shows the main characteristics of BROOK. Note that Driving Status includes Vehicle Speed, Vehicle Acceleration, Vehicle Coordinate, Distance of Vehicle Ahead, Steering Wheel Coordinates, Throttle Status and Brake Status.
| Data Types | Facial Video | Heart Rates | Skin Conductance | Eye-tracking | Driving Status |
| Size | 273GB | 13.1MB | 48.3MB | 27.2GB | 60.9MB |
3.2. Hardware and Software Supports
To build the BROOK dataset, we combine a diverse set of hardware and software and make intensive implementations to facilitate our needs. The simulator environment is showed in Figure 2. We use an empty car skeleton with replaced steering wheel, pedals and cameras for data collection and integrate them into our simulator software. The camera is positioned on top of the dashboard, in front of the driver’s face. The simulated scenes are projected onto three surrounding walls of the car, with the front wall showing the driving scenes ahead of the car and the left/right walls showing the side views and backward views. For data collection, we use different sensors to collect relevant data streams: (1) for Facial Video, we use an ultra-clear motion tracking camera; (2) for Hear Rates, we use a heart rate sensor; (3) for Skin Conductance, we use a leather electrical sensor; and (4) we use a Tobii eye tracker for Eye-tracking. Detailed sensors types and sample rates are showed in Table 4. As for detailed driving status, pressure sensors for throttle and brake have been integrated, and steering wheels have been monitored to obtain spatial changes from drivers during the whole period.

| Data Types | Device Type | Frequency |
|---|---|---|
| Facial Video | Goldensky Webcam | 30Hz |
| Heart Rate | POLAR H10 Heart Rate Monitor | 21Hz |
| Skin Conductance | NeXus Skin Conductance Sensor | 40Hz |
| Eye-Tracking Data | Tobii eye tracker | 60Hz |
As for software, we use OpenDS (Green et al., 2014; Team, 2017), an open-source cognitive driving simulator, for driving scenario generations. OpenDS is widely-used for in-lab simulations for both manual and automated driving. Also, we utilise ErgoLAB (Tech, [n.d.]) to coordinate sensor data output for the synchronization and the storage. Finally, we build an in-framework tool to stream out speed and coordinates as driving status.
3.3. Key Features Only in BROOK
BROOK has some outstanding features, compared with existing datasets. Hereby, we summarize all three unique features in BROOK in the following paragraphs, which are Automated Mode, Region-based Customization and Eye-Tracking Statistics.
1. Automated Mode. As shown in Table 2, BROOK has collected all types of data streams from both manual and automated driving processes. For automated driving, the reported statistics are collected during fully-automated driving processes for all participants. This is because, as the emerging trends of Autonomous Vehicles (AV), it’s important to supply relevant data streams for different studies. For example, (Dikmen and Burns, 2016) suggests the need for extensive characterizations of drivers’ perceived trust in AV.
2. Region-based Customization. To provide comprehensive coverage of all possible cases, we customize our scenarios (Authors, [n.d.]a) and scenes (Authors, [n.d.]b) based on the common patterns of roads in China, as shown in Table 5. These patterns are derived from our collaborations with local transportation authorities. During the procedure of data collection, all participants have experienced 4 types of driving scenarios. Note that all participants during this study have held issued driving licenses from transportation authorities, with sufficient driving experiences.
| The Number of of Lanes | The Number of Cars | |
| 1st | 4 | 32 |
| 2nd | 4 | 60 |
| 3rd | 8 | 60 |
| 4th | 8 | 92 |
3. Eye-Tracking Statistics. We have collected drivers’ Eye-Tracking statistics via a Tobii Eye-Tracking device. Eye-Tracking analysis leverages the fixations and pupil-size variation of each driver, to study diverse types of drivers’ behaviors. It’s also a widely-recognized assumption that fixations and pupil-size variations are important indicators for driver attention and emotional states. In addition, the Eye-Tracking statistics can be combined with road videos to locate region-of-interests/object-of-interests in the scenes, which can not only profile drivers’ body movements in a new perspective but also provide important data to improve the situation awareness of Human-Vehicle Interaction systems.
3.4. Data Collection Procedure
In this section, we illustrate the whole procedure while collecting the BROOK database. We first prepare necessary resources and tests to ensure the bulk of the study runs smoothly. Then we perform the bulk of the study to collect necessary data streams, in various settings and modes separately.
For preparations, participants are first briefed about the study and are screened by a questionnaire to ensure that, they are at low risk of motion sickness while experiencing the driving simulation. After the introduction, participants are given five minutes to sit in the simulator by themselves and adapt to the environment. The study only begins when we ensure that participants understand the brief and can operate the simulator without any questions or difficulties.
The bulk of this study is as follows. The experiment includes three driving conditions, as explained in previous sections. Each participant begins with the baseline manual mode, with drivers in control of the vehicle operations. During the manual mode, the drivers are required to operate basic driving events such as surpassing, accelerating/decelerating, etc. Then, they undertake the two modes of autopilot driving (L3 autonomous driving level), including both standard and personalized versions444Determined by participants’ behaviors in manual mode.. The two auto-driving versions are completed in a counterbalanced order. During the study, driving statistics are logged. After each driving session, the participants were asked to fill out a questionnaire about the cognitive aspects of their experience, including an assessment of perceived trust, comfort and situation awareness. Note that these are not collected for the BROOK dataset, and it’s only available upon request. The study of each participant lasts approximately one hour.
4. Example Studies of BROOK dataset
To justify the potential application fields and the feasibility of our design purposes, we have conducted three example studies by leveraging the BROOK dataset. In the first case study, we have built an in-vehicle multi-modal predictor to estimate drivers’ physiological data via facial expressions only. Our second case study is the first attempt to demystify the complex interactions between drivers and vehicles, by utilizing a novel self-clustering algorithm. Our third case is the first attempt to characterize and study the feasibility and quality of Differential Privacy-enabled data protection methods in IoV. Through these three example studies, we are confident that BROOK could both support real-world applications, and stimulate potential research directions in HVI (and possibly beyond).
4.1. Case 1: Unobtrusive Predictors for Multi-modal & Driving statistics
Our first example study, supported by the BROOK dataset, is a non-trivial approach to collect in-vehicle drivers’ statistics, including both multi-modal and driving statistics. Since directly equipping biosensors degrades both the safety and user experiences, we propose to leverage Convolutional Neural Networks for accurate predictions. We experimentally demonstrate its potential, as proof-of-concept. We first elaborate on the motivations of this design. Then we give an overview of the overall system. Next, we illustrate our considerations of key design choices. Finally, we present empirical results and takeaways from the prototype systems.
4.1.1. Motivations
Collecting statistics from drivers and passengers is an essential building block for adaptive and personalized Human-Vehicle Interactions. However, directly equipping biosensors causes potential issues, in terms of both safety and user experiences, during the driving procedure. Specifically, (1) obtaining eye-tracking data from drivers by eye detector may block driver’s view, which accounts for serious safety issues (Blignaut and Beelders, 2012); (2) using bio-sensors to collect heart rate from a driver will highly affect the comfort of driving. In a real-world scenario, continuously retrieving user data via bio-sensors is impractical, user-unfriendly and cost-ineffective. Therefore, we envision the potentials of unobtrusive techniques for intelligent HVI systems, by taking only facial records to estimate both drivers’ physiological statistics for monitoring drivers’ status and contextual data for better run-time decision-making. We validate such approaches using state-of-the-art Convolutional Neural Networks to predict three types of driving statistics (i.e. Heart Rate (HR), Vehicle Speed (VS) and Skin Conductance (SC)), and present empirical results and takeaways.
4.1.2. System Overview: Detect, Predict and Visualize
The first component of our system is Face Detectors. We use in-vehicle cameras to record drivers’ facial videos, and leverage OpenCV library (Bradski and Kaehler, 2008) to detect driver faces and cut these videos into consecutive frames. For further processing, we resize all frames into 224 x 224 pixels as the regularized input size for further components.
The second component of our system is the Convolutional Neural Network Models. We apply DenseNet (Huang et al., 2017) as the core model of this component for drivers’ multi-modal predictors. The input of DenseNet is the pre-processed drivers’ facial images, and the output is the estimated values of our CNN. We have adjusted several parameters to improve the performance of predicting drivers’ status (e.g. 100 layers instead of the suggested number of layers in the vanilla model). Table 6 shows the detailed parameters of our models. The train, test and evaluation set is split in a ratio of 8:1:1, with the support of 22 drivers’ facial videos labeled with HR, VS and SC from BROOK.


The third part component of our system is Visualization Support. Our engineering efforts enable real-time predictions of Skin Conductance, Heart Rate and Vehicle Speed. Hence, we also achieve real-time visualization of these predictions. Figure 4 shows how our predictions are visualized across all frames.
| Parameters | Depth/Layers | Growth Rate | Dense Blocks | Compression Factor | Batch Size | Initial Learning Rate | Training Epochs |
| Values | 100 | 12 | 4 | 0.5 | 128 | 0.1 | 50 |
4.1.3. Design Choices
We apply DenseNet(Huang et al., 2017) as the architecture of the Convolutional Neural Networks (CNN) because: compared with other models, DenseNet directly applies cross-layer feature reuses, which substantially reduces the complexity of parameter tuning and adjustments. Since the aim of our study is to provide the proofs-of-concept, we believe the explorations of suitable models (e.g. MobileNet (Sandler et al., 2018)) are essential to identify the characteristics of such scenarios and hopefully stimulate novel designs.
4.1.4. Empirical Results
We report our prototype system results as follows. Our prototype systems are trained and validated, with the support of the BROOK dataset. The validation accuracy of Skin Conductance, Heart Rates, and Vehicle Speed are 82.96%, 57.90%, and 58.75%. We provide more concrete details in Figure 4, by setting different training epochs. In the midterm of training (epoch 25), we reduced the learning rate gradually, and we could notice that for SC and HR, they converged steeply after learning rates change. Overall, our key observation hereby is that the estimation of Skin Conductance (SC) is much higher than others. We believe this is because the granularity of SC recordings, in terms of timeline, is much smaller than others.
4.2. Case 2: Applying self-clustering Methods for Adaptive Driving Style Characterizations
The second case study focuses on quantitatively classifying complicated interactions between driving styles and driving behaviors adaptively. Conventional perspectives, through static partitions of driving styles, might simplify the classifications of driving styles. Our goal is to obtain diverse driving styles, derived from adaptive classifications of driving behaviors. To this end, we apply self-clustering algorithms to examine adaptive classification of driving styles, and how driving behaviors and styles interact in this case. We first elaborate on our motivation for this study. Then we provide the detailed methodology of this study. Next, we introduce the key design choices of this study. Finally, we present key observations from the experimental results and discuss major takeaways.
4.2.1. Motivations
Driving styles are sets of classified driving behaviors, based on relevant activities and their measurements. According to an early summary (Taubman-Ben-Ari et al., 2004), driving styles are classified into eight main categories: dissociative, anxious, risky, angry, high-velocity, distress reduction, patient, and careful. Though such classifications of different driving styles are already complicated (i.e. including the Choices of Speed, Brake Status, and etc(Elander et al., 1993)), variations between different time intervals have been generally overlooked. Moreover, the methodologies and mechanisms to enable adaptive classifications of driving styles remain understudied. Our goal is to study such variations via a novel perspective, by equalizing clusters as driving styles. To relax the constraints of conventional approaches (i.e. predetermined number of styles), we introduce Self-Clustering Algorithms as the classifications of Driving Styles. We proof-of-concept such approaches using DBSCAN Self Clustering algorithm, and present empirical observations and takeaways.
4.2.2. Our Methodology: Adaptive Classifications via Self-Clustering Algorithms
The driving style characterization is mainly determined by vehicle statistics in different time spots. In our experiment, we have chosen most of the vehicle data in the BROOK dataset as the source input, such as Vehicle Acceleration Rate and Steering Wheel positions. We first pre-process Data to reduce the noisy points for further clustering. In this stage, we apply three main methods and we elaborate them as follow: (1) we eliminate the start-up and parking stages from all data records since our focus is to analyze the driving styles and behaviors under a stable and consecutive driving procedure; (2) we apply Min-Max Normalization(PATRO and Sahu, 2015) to regularize all statistics for a uniform format across all data streams, since the primary units and scales of the different kinds of data streams may vary greatly; and (3) we apply Principal Component Analysis (PCA) (Ma, 2014) to retrieve principal components from the regularized, multi-dimensional data streams.
We then perform Self-Clustering via DBSCAN Algorithm. To traverse all potential driving styles, we apply DBSCAN, a representative self-clustering algorithm, to enable adaptive classifications of driving styles, according to relevant driving behaviors. DBSCAN finds core samples of high density in the given dataset and expands clusters from them. Unlike conventional approaches like K-Means, DBSCAN doesn’t require a predetermined number of clusters but only takes Distance functions and Parameter Settings as input parameters.
4.2.3. Design Choices
Since DBSCAN can accept multiple kinds of Distance Functions, hereby we first elaborate our key design choices in terms of it. There are many kinds of widely-used distance functions, such as Euclidean Distance, Manhattan Distance, etc. Since our study aims to validate the potentials of such approaches, we use Euclidean Distance as our attempt. We believe it’s promising to vary different Distance Functions and validate their differences, which can substantially deepen the computational understanding of relationships between driving styles and behaviors.
As for Parameter Settings, DBSCAN takes minPoints, epsilon as parts of Parameter Settings: (1) minPoints refers to the minimum numbers of data points within a cluster; and (2) epsilon (eps) refers to the max radius of the cluster. In this case, we follow the recommended settings and vary them slightly to observe their differences. As Table 7 shows, we attempt nine different combinations of relevant settings. We scale eps from 0.125 to 0.5, and scale minPoints from 1 to 9. Since the results suggest there are negligible differences within our clustering results, we leverage representative cases, in some scenarios, and perform the analysis.
| eps | 0.125 | 0.125 | 0.125 | 0.25 | 0.25 | 0.25 | 0.5 | 0.5 | 0.5 |
|---|---|---|---|---|---|---|---|---|---|
| minPts | 1 | 6 | 9 | 1 | 6 | 9 | 1 | 6 | 9 |
| clusters numbers | 8 | 4 | 3 | 6 | 4 | 3 | 6 | 4 | 3 |
4.2.4. Empirical Results & Observations


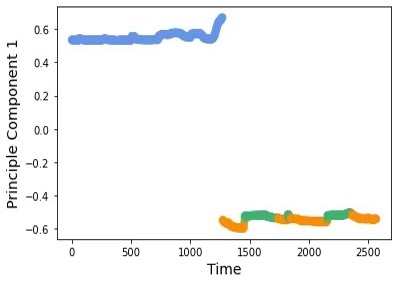
We introduce details about Sub-Figure 5: the x-axis refers to Time, the y-axis refers to Feature (i.e. the most Principal Component) and the z-axis refers to the clusters. Sub-Figure 5 and 5 presents relevant 2D planes from the presented 3D figure. We make the following two observations.
Observation 1: Feasibility for Temporal Characterizations and Adaptive Mechanisms for Driving Styles. Figure 5 shows the three-dimensional clustering results of all drivers when DBSCAN parameters eps, minPts are 0.5 and 9 respectively. We obtain two facts. First, the combinations of all clusters cover the whole timeline. Second, Sub-Figure 5 confirms such coverage can be achieved through only the most significant feature, without including every stream of multi-modal statistics. These facts show us the need of Temporal Characterizations and Adaptive Mechanisms for Driving Styles.
Observation 2: Classifications of Driving Styles can be Non-Deterministic. Sub-Figure 5 shows the results when the plane of Time-Cluster is presented in 2D manner. We obtain the fact that there are overlaps between different driving styles for the specific driver. This fact validates our hypothesis that the conventional partition of driving styles may not reflect these characteristics well.


Observation 3: Personalized Classifications of Driving Styles are Possible. We use concrete examples to elaborate the possibilities of personalized classifications of driving styles. Figure 6 shows the plane of Time-Cluster from 3D figures, in a breakdown manner. We compare two example driver sets in detail. Sub-Figures 6 and 6 represent one driver set, and Sub-Figures 6 and 6 represent the other one. We obtain the fact that these two driver sets have different driving styles, and the differences are significant. The first driver set (Sub-Figures 6 and 6) has more continuous and smooth driving-style transitions. But the second driver set (Sub-Figures 6 and 6) has more fluctuate and frequently-switched driving-style transitions.
4.3. Case 3: Differential Privacy for the Internet-of-Vehicles
Our third study aims to study the tradeoffs between different Differential Privacy (DP) approaches in the context of Internet-of-Vehicles (IoV). Data privacy is a major concern with the emergence of IoV. However, it’s still unclear how to deploy efficient privacy-preserving methods for emerging IoV applications. Our goal is to characterize modern privacy-preserving techniques, namely Differential Privacy (DP), for data processing in IoV. We first elaborate on our motivations for this study. Then we provide our methodology of these studies for data protection using DP. Next, we introduce the design choices of this study. Finally, we summarize the key findings from the results.
4.3.1. Motivations
IoV is a large-scale distributed network that consists of individual vehicles as nodes. There are diverse and frequent communications within IoV, by orchestrating humans, vehicles, things and environments, with vehicles as the interface. Such a nature of frequent communications and synchronizations, which is the same as the distributed systems, incurs the concerns of privacy issues for data processing (e.g. centralized servers). To resolve such issues, Differential Privacy has been widely-used, which is a mathematically-guaranteed mechanism for protecting private data. However, it’s still unclear regarding the tradeoffs when applying such techniques in the context of IoV. To this end, we leverage the BROOK dataset to characterize the impacts of DP mechanisms within the era of IoV.
4.3.2. Techniques: Differentially-Private Data Protection
The
-Differential Privacy is achieved by adding random Laplace noises into the dataset. A mathematical expression of a randomized function could be denoted as follows.
Theorem 1.
(Randomized Function subject to -Differential Privacy) We regard a randomized function as satisfying -Differential Privacy, assume that dataset and with at most one element difference, and , the function obey the below in-equation:
Note that the value of is in inverse correlation with the extent of randomization (i.e. small values indicate powerful randomization).
4.3.3. Study Design
We focus on how to leverage DP to enable privacy-preserving data processing. To achieve this goal, we first build our DP-protected database, with the support of BROOK. We leverage the Heart Rate and Skin Conductivity data in BROOK to construct this toy database, and add random noises to the query operators via DP. In this manner, querying driving statistics in the toy database could be viewed as data processing in IoV. Second, we apply four state-of-the-art query mechanisms (i.e. Fourier (Barak et al., 2007), Wavelet (Xiao et al., 2010), Datacube (Ding et al., 2011), and Hierarchical (Hay et al., 2010)) to perform a list of queries from real-world workloads. To simulate as many representative queries as possible, we consider both All-Range Query and One-Way Marginal Query. Third, we use Absolute Error and Relative Error compared with the queries on raw data as the evaluation metrics to assess DP-enabled processing on sensitive data.
DP Mechanisms for processing: First, we will introduce the four state-of-the-art query mechanisms: 1) Fourier is designed for workloads having all K-way marginals, for any given K. It transforms the cell counts, via the Fourier transformation, and obtains the values of the marginals based on the Fourier parameters; 2) Wavelet is designed to support multi-dimensional range workloads. It applies the Haar wavelet transformation to each dimension; 3) Datacube chooses a subset of input marginals to minimize the max errors of the query answer, to support marginal workloads; 4) Hierarchical is built for answering range queries. It uses a binary tree structure of queries for such a goal. The first query is the sum of all cells and the rest of the queries recursively divide the first query into subsets.
Dataset Setup and Query Types: To characterize the query errors of DP-enabled processing, we handcraft our dataset with the support of BROOK and import it into our simulation platform555We emulate IoV via the remote APIs of modern distributed database systems. This ensures our characterizations not to mistake any procedure, by overlooking the impacts of IoV.. In this experiment, we use the Heart Rate and Skin Conductivity as a proof-of-concept. Assume the data table is of size , and the constraint condition for cell could be written as . Then, a column vector where meets the condition could be extracted from the table. In this case, it is equal to , a column vector with length of 32. With the existence of this data vector , it is convenient to answer a linear query.
To simulate real-world query types, we leverage All-Range Query and One-Way Marginal Query in the query workloads. The dot product of a row vector with all positions filled with one and an equal-length column data vector, is the expected result of All-Range Query. The expected results of One-Way Marginal Query on an n-dimension database is a vector whose each position corresponds to the counting result of a query related to one attribute only. The length of the returned vector is equal to the magnitude of all possible settings of the selected attribute. Note that One-Way Marginal Query is a special case of K-Way marginal Query when .
Evaluation Metrics and Configurations of Workloads: We introduce two evaluation metrics to assess query errors respectively, which are Absolute Error and Relative Error. Absolute Error refers to the absolute differences between returned value by DP-enabled query approaches and real value queried on raw data. Note that when query results of DP-enabled queries and raw query are all vectors, the absolute error is . Else, the absolute error is . Relative Error is the ratio of absolute error to the real value. The relative error is when expressed in the above example.
The handcrafted dataset is in size of , with different values (e.g. 0.1, 0.2, 0.5, 1 and 2.5) for data protection. As for One-Way Marginal Query, we rigorously testify the query results in various dimensions (i.e. , , , and ).
4.3.4. Empirical Results & Observations


Figure 8 and Figure 8 report the Relative Error and Absolute Error of the above four mechanisms for DP-enabled data sharing. We make the following two key observations.
Key Observation 1: different DP-enabled mechanisms achieve different levels of Relative Error. Figure 8 reports the query results of Relative Errors for both All-Range Query and One-Way Marginal Query. We draw two observations. First, Datacube produces more errors than the rest mechanisms in all scenarios, for both All-Range Query and One-Way Marginal Query, which suggests it may not be an ideal choice in practice. Second, Hierarchical is the optimal method in All-Range Query, but Fourier outperforms it in One-Way Marginal Query, for any settings.
Key Observation 2: different DP-enabled mechanisms achieve different levels of Absolute Error. Figure 8 shows the query results of Absolute Errors for both All-Range Query and One-Way Marginal Query. We draw four observations. First, Hierarchical and Wavelet both incur more errors when the granularity of query structures grows in both query types. Second, Fourier is the most robust mechanism when the granularity of query structures grows in both query types. It also achieves the best results in complex granularity of in All-Range Query and also the best in all the settings of One-Way Marginal Query. Third, Hierarchical obtains better results from query structure and in All-Range Query. Four, Wavelet can achieve fewer query errors compared with Hierarchical with a small granularity of queries in One-Way Marginal Query.
5. Discussions
BROOK dataset is only a starting step to provide comprehensive data support for the research of Human-Vehicle Interaction systems. Though there are certainly several limitations of the BROOK dataset, we believe the BROOK dataset also delivers a lot of takeaways in terms of future research. In this section, we discuss both limitations and takeaways from the BROOK dataset and its example studies. We first outline several key limitations of the BROOK dataset (Section 5.1), and then elaborate key takeaways from the BROOK dataset and its example studies (Section 5.2).
5.1. Limitations of BROOK dataset
Though there are some novel features of the BROOK dataset, it still has several limitations. We summarize them into three aspects as follows. First, the BROOK dataset is collected under in-lab simulations, instead of in-field studies. This is because building a comprehensive dataset is impractical from real-world studies, where certain restrictions prevent us from equipping as many devices as possible for drivers; second, the BROOK dataset only consists of fully-automated mode and manual mode, and the collections for semi-automated mode are still required to provide thorough coverage. This is because the rationale to provide a semi-automated mode for individual drivers is still unclear; Third, the BROOK dataset is restricted to drivers from a specific region (i.e. China), because a broader coverage of participants requires a significant amount of effort and resources.
We believe the efforts to build such a dataset are far beyond the capability of a single research group. Therefore, we position the BROOK dataset as a starting point, and we hope the BROOK dataset can bring important learning lessons for future efforts. Moreover, we envision the BROOK dataset can stimulate more follow-up works and collaborations, to achieve a broader coverage in terms of driving modes, regions, and in-field studies.
5.2. Takeaways from BROOK dataset & Example Studies
The empirical results from our example studies suggest the high quality of the BROOK dataset. Therefore, we believe BROOK is capable to support multiple research purposes, and provide data sources for evaluations/validations. Particularly, we believe BROOK is sufficient for examining the suitability of diverse data-driven techniques and interactive designs in the context of Human-Vehicle Interaction systems. We discuss takeaways of our example studies in detail.
In our first example study, we proof-of-concept the effectiveness of our designs. We believe future works can enable more accurate in-vehicle multi-modal Predictors. To build a personalized Human-Vehicle Interaction (HVI) system, multi-modal streams are critical sources in the decision-making module of HVI systems. Particularly, using multiple sensors to collect drivers’ statistics in vehicles affects safety and user experiences, which substantially limits its practicality. Though our works already demonstrate the potential, we believe there are still rooms for more powerful predictors(e.g. more detailed facial expression (Martinez et al., 2017; Jaques et al., 2018; Wang et al., 2021)) and customization-friendly predictors (Xiong et al., 2022) inside vehicles. It also of great pracical values to integrate them into certain platforms (e.g., IoV Emulation Platform (Jin et al., 2021)) to improve the overall Quality-of-Service.
In our second example study, we identify the complicated interactions between driving behaviors and styles, and we believe there are needs for both long- and short-term characterizations of driving styles. Current studies have paid a lot of attention to the characterizations and classification of driving styles, but few attempts to adapt the instant reflections from drivers/passengers. We believe BROOK offers a great many chances for taking an in-depth analysis and modeling of drivers/passengers in both Long and Short Term (e.g. Long Short-Term Memory (LSTM) (Hochreiter and Schmidhuber, 1997)). Despite driving styles from long-term inference, future HVI systems could be capable of providing real-time reflections on drivers’/passengers’ affective states, to further improve its quality of service. Thus, characterizing driving styles in a finer granularity is essential, to enable adaptive and personalized Human-Vehicle Interactions.
In our third example study, we characterize the effects of leveraging Differential Privacy mechanisms on data processing and data sharing within IoV. Data privacy will be a major concern when IoV systems grow mature. Previous works utilize blockchain-based mechanisms (e.g. (Sharma et al., 2019)) to address the data privacy issues. However, there is still a huge gap before striking a balance between sensitive data utility and privacy in the context of IoV. Previous works (Duan et al., 2022) provides 11 key guidelines for applying DP-methods in the context of IoV and there exists some early attempts to mitigate the negative effects of DP methods (e.g., (Liu et al., 2022)). We believe BROOK and our study could pave the road for such a goal and stimulate more follow-up works. We have already narrowed down the values to avoid redundant future works, and conclude the strength and weakness of introducing DP-enabled protections in practice.
6. Conclusions
We present BROOK dataset, a multi-modal and facial video dataset to exploit data-driven techniques for adaptive and personalized Human-Vehicle Interaction designs. The current version of BROOK contains 34 drivers’ driving statistics under both manual and autonomous driving modes. Through BROOK dataset, we conduct three example studies, via advanced data-driven techniques, to demonstrate its potentials in practice. Our results justify the applicability and values of the BROOK dataset. We believe, with the emerging trends of Autonomous Vehicles, more efforts on similar datasets are essential to unleash the design spaces.
References
- (1)
- Abouelnaga et al. (2018) Yehya Abouelnaga, Hesham Eraqi, and Mohamed Moustafa. 2018. Real-time Distracted Driver Posture Classification.
- Authors ([n.d.]a) Anonymous Authors. [n.d.]a. Customized Driving Scenarios for RIVULET Dataset. Would be released if the paper is accepted.
- Authors ([n.d.]b) Anonymous Authors. [n.d.]b. Customized Driving Scenes for RIVULET Dataset. Would be released if the paper is accepted.
- Barak et al. (2007) Boaz Barak, Kamalika Chaudhuri, Cynthia Dwork, Satyen Kale, Frank McSherry, and Kunal Talwar. 2007. Privacy, Accuracy, and Consistency Too: A Holistic Solution to Contingency Table Release. In Proceedings of the Twenty-Sixth ACM SIGMOD-SIGACT-SIGART Symposium on Principles of Database Systems (Beijing, China) (PODS ’07). Association for Computing Machinery, New York, NY, USA, 273–282. https://doi.org/10.1145/1265530.1265569
- Blignaut and Beelders (2012) Pieter J. Blignaut and Tanya René Beelders. 2012. TrackStick: a data quality measuring tool for Tobii eye trackers. In Proceedings of the 2012 Symposium on Eye-Tracking Research and Applications, ETRA 2012, Santa Barbara, CA, USA, March 28-30, 2012, Carlos Hitoshi Morimoto, Howell O. Istance, Stephen N. Spencer, Jeffrey B. Mulligan, and Pernilla Qvarfordt (Eds.). ACM, 293–296. https://doi.org/10.1145/2168556.2168619
- Borghi (2018) Guido Borghi. 2018. Combining Deep and Depth: Deep Learning and Face Depth Maps for Driver Attention Monitoring. arXiv:1812.05831 [cs.CV]
- Bradski and Kaehler (2008) Gary Bradski and Adrian Kaehler. 2008. Learning OpenCV: Computer vision with the OpenCV library. ” O’Reilly Media, Inc.”.
- Deo and Trivedi (2018) Nachiket Deo and Mohan M. Trivedi. 2018. Looking at the Driver/Rider in Autonomous Vehicles to Predict Take-Over Readiness. arXiv:1811.06047 [cs.CV]
- Dikmen and Burns (2016) Murat Dikmen and Catherine M. Burns. 2016. Autonomous Driving in the Real World: Experiences with Tesla Autopilot and Summon. In Proceedings of the 8th International Conference on Automotive User Interfaces and Interactive Vehicular Applications (Ann Arbor, MI, USA) (Automotive’UI 16). Association for Computing Machinery, New York, NY, USA, 225–228. https://doi.org/10.1145/3003715.3005465
- Ding et al. (2011) Bolin Ding, Marianne Winslett, Jiawei Han, and Zhenhui Li. 2011. Differentially private data cubes: optimizing noise sources and consistency. In Proceedings of the 2011 ACM SIGMOD International Conference on Management of data. 217–228.
- Duan et al. (2022) Yicun Duan, Junyu Liu, Wangkai Jin, and Xiangjun Peng. 2022. Characterizing Differentially-Private Techniques in the Era of Internet-of-Vehicles. Technical Report-Feb-03 at User-Centric Computing Group, University of Nottingham Ningbo China.
- Elander et al. (1993) James Elander, Robert West, and Davina French. 1993. Behavioral correlates of individual differences in road-traffic crash risk: An examination of methods and findings. Psychological bulletin 113 (04 1993), 279–94. https://doi.org/10.1037/0033-2909.113.2.279
- Eraqi et al. (2019) Hesham M. Eraqi, Yehya Abouelnaga, Mohamed H. Saad, and Mohamed N. Moustafa. 2019. Detecting Stress during Real-World Driving Tasks Using Physiological Sensors. Journal of Advanced Transportation (2019), 156–166. https://doi.org/10.1155/2019/4125865
- Fang et al. (2019) Jianwu Fang, Dingxin Yan, Jiahuan Qiao, and Jianru Xue. 2019. DADA: A Large-scale Benchmark and Model for Driver Attention Prediction in Accidental Scenarios. arXiv:1912.12148 [cs.CV]
- Geiger et al. (2013) Andreas Geiger, P Lenz, Christoph Stiller, and Raquel Urtasun. 2013. Vision meets robotics: the KITTI dataset. The International Journal of Robotics Research 32 (09 2013), 1231–1237. https://doi.org/10.1177/0278364913491297
- Goeleven et al. (2008) Ellen Goeleven, Rudi De Raedt, Lemke Leyman, and Bruno Verschuere. 2008. The Karolinska Directed Emotional Faces: A validation study. COGNITION AND EMOTION 22 (09 2008), 1094–1118. https://doi.org/10.1080/02699930701626582
- Green et al. (2014) Paul A. Green, Heejin Jeong, and Te-Ping Kang. 2014. Using an OpenDS Driving Simulator for Car Following: A First Attempt. In Adjunct Proceedings of the 6th International Conference on Automotive User Interfaces and Interactive Vehicular Applications, Seattle, WA, USA, September 17 - 19, 2014, Linda Ng Boyle, Gary E. Burnett, Peter Fröhlich, Shamsi T. Iqbal, Erika Miller, and Yuqing Wu (Eds.). ACM, 4:1–4:6. https://doi.org/10.1145/2667239.2667295
- Haouij et al. (2018) Neska El Haouij, Jean-Michel Poggi, Sylvie Sevestre-Ghalila, Raja Ghozi, and Mériem Jaïdane. 2018. AffectiveROAD System and Database to Assess Driver’s Attention. In Proceedings of the 33rd Annual ACM Symposium on Applied Computing (Pau, France) (SAC ’18). Association for Computing Machinery, New York, NY, USA, 800–803. https://doi.org/10.1145/3167132.3167395
- Hay et al. (2010) Michael Hay, Vibhor Rastogi, Gerome Miklau, and Dan Suciu. 2010. Boosting the Accuracy of Differentially Private Histograms through Consistency. Proc. VLDB Endow. 3, 1–2 (Sept. 2010), 1021–1032. https://doi.org/10.14778/1920841.1920970
- Healey and Picard (2005) J. A. Healey and R. W. Picard. 2005. Detecting Stress during Real-World Driving Tasks Using Physiological Sensors. Trans. Intell. Transport. Sys. 6, 2 (June 2005), 156–166. https://doi.org/10.1109/TITS.2005.848368
- Hochreiter and Schmidhuber (1997) Sepp Hochreiter and Jürgen Schmidhuber. 1997. Long Short-Term Memory. Neural Computation 9, 8 (1997), 1735–1780. https://doi.org/10.1162/neco.1997.9.8.1735
- Hooft van Huysduynen et al. (2015) Hanneke Hooft van Huysduynen, Jacques Terken, Jean-bernard Martens, and Berry Eggen. 2015. Measuring driving styles: a validation of the multidimensional driving style inventory. https://doi.org/10.1145/2799250.2799266
- Huang et al. (2017) Gao Huang, Zhuang Liu, Laurens van der Maaten, and Kilian Q. Weinberger. 2017. Densely Connected Convolutional Networks. In 2017 IEEE Conference on Computer Vision and Pattern Recognition, CVPR 2017, Honolulu, HI, USA, July 21-26, 2017. IEEE Computer Society, 2261–2269. https://doi.org/10.1109/CVPR.2017.243
- Jain et al. (2016) Ashesh Jain, Hema S Koppula, Shane Soh, Bharad Raghavan, Avi Singh, and Ashutosh Saxena. 2016. Brain4Cars: Car That Knows Before You Do via Sensory-Fusion Deep Learning Architecture. arXiv:1601.00740 [cs.RO]
- Jaques et al. (2018) Natasha Jaques, Jesse H. Engel, David Ha, Fred Bertsch, Rosalind W. Picard, and Douglas Eck. 2018. Learning via social awareness: improving sketch representations with facial feedback. In 6th International Conference on Learning Representations, ICLR 2018, Vancouver, BC, Canada, April 30 - May 3, 2018, Workshop Track Proceedings. OpenReview.net. https://openreview.net/forum?id=Bkyn3dJPG
- Jegham et al. (2020) Imen Jegham, Anouar Ben Khalifa, Ihsen Alouani, and Mohamed Ali Mahjoub. 2020. A novel public dataset for multimodal multiview and multispectral driver distraction analysis: 3MDAD. Signal Processing: Image Communication 88 (2020), 115960. https://doi.org/10.1016/j.image.2020.115960
- Jin et al. (2021) Wangkai Jin, Xiaoxing Ming, Zilin Song, Zeyu Xiong, and Xiangjun Peng. 2021. Towards Emulating Internet-of-Vehicles on a Single Machine. In AutomotiveUI ’21: 13th International Conference on Automotive User Interfaces and Interactive Vehicular Applications, Leeds, United Kingdom, September 9-14, 2021 - Adjunct Proceedings. ACM, 112–114. https://doi.org/10.1145/3473682.3480275
- Kamachi et al. (1997) Miyuki Kamachi, Michael Lyons, and Jiro Gyoba. 1997. The japanese female facial expression (jaffe) database. Availble: http://www. kasrl. org/jaffe. html (01 1997).
- Kun (2018) Andrew L. Kun. 2018. Human-Machine Interaction for Vehicles: Review and Outlook. Foundations and Trends® in Human–Computer Interaction 11, 4 (2018), 201–293. https://doi.org/10.1561/1100000069
- Liu et al. (2022) Junyu Liu, Wangkai Jin, Zhenyong He, Xiaoxing Ming, Yicun Duan, Zeyu Xiong, and Xiangjun Peng. 2022. HUT: Enabling High-UTility, Batched Queries under Differential Privacy Protection for Internet-of-Vehicles. Technical Report-Feb-02 at User-Centric Computing Group, University of Nottingham Ningbo China.
- Ma (2014) Zee Ma. 2014. A Tutorial on Principal Component Analysis. (02 2014). https://doi.org/10.13140/2.1.1593.1684
- Martinez et al. (2017) Daniel Lopez Martinez, Ognjen Rudovic, and Rosalind W. Picard. 2017. Personalized Automatic Estimation of Self-Reported Pain Intensity from Facial Expressions. In 2017 IEEE Conference on Computer Vision and Pattern Recognition Workshops, CVPR Workshops 2017, Honolulu, HI, USA, July 21-26, 2017. IEEE Computer Society, 2318–2327. https://doi.org/10.1109/CVPRW.2017.286
- Md Yusof et al. (2016) Nidzamuddin Md Yusof, Juffrizal Karjanto, Jacques Terken, Frank Delbressine, Muhammad Hassan, and Matthias Rauterberg. 2016. The Exploration of Autonomous Vehicle Driving Styles: Preferred Longitudinal, Lateral, and Vertical Accelerations. 245–252. https://doi.org/10.1145/3003715.3005455
- Ortega et al. (2020) Juan Diego Ortega, Neslihan Kose, Paola Cañas, Min-An Chao, Alexander Unnervik, Marcos Nieto, Oihana Otaegui, and Luis Salgado. 2020. DMD: A Large-Scale Multi-Modal Driver Monitoring Dataset for Attention and Alertness Analysis. arXiv:2008.12085 [cs.CV]
- Palazzi et al. (2019) A. Palazzi, D. Abati, s. Calderara, F. Solera, and R. Cucchiara. 2019. Predicting the Driver’s Focus of Attention: The DR(eye)VE Project. IEEE Transactions on Pattern Analysis and Machine Intelligence 41, 7 (2019), 1720–1733. https://doi.org/10.1109/TPAMI.2018.2845370
- Pantic et al. (2005) M. Pantic, Michel Valstar, R. Rademaker, and L. Maat. 2005. Web-based database for facial expression analysis. IEEE International Conference on Multimedia and Expo, ICME 2005 2005, 5 pp.–. https://doi.org/10.1109/ICME.2005.1521424
- PATRO and Sahu (2015) S GOPAL PATRO and Kishore Kumar Sahu. 2015. Normalization: A Preprocessing Stage. IARJSET (03 2015). https://doi.org/10.17148/IARJSET.2015.2305
- Ramanishka et al. (2018) V. Ramanishka, Y. Chen, T. Misu, and K. Saenko. 2018. Toward Driving Scene Understanding: A Dataset for Learning Driver Behavior and Causal Reasoning. In 2018 IEEE/CVF Conference on Computer Vision and Pattern Recognition. 7699–7707. https://doi.org/10.1109/CVPR.2018.00803
- Sandler et al. (2018) Mark Sandler, Andrew G. Howard, Menglong Zhu, Andrey Zhmoginov, and Liang-Chieh Chen. 2018. MobileNetV2: Inverted Residuals and Linear Bottlenecks. In 2018 IEEE Conference on Computer Vision and Pattern Recognition, CVPR 2018, Salt Lake City, UT, USA, June 18-22, 2018. IEEE Computer Society, 4510–4520. https://doi.org/10.1109/CVPR.2018.00474
- Schneegass et al. (2013) Stefan Schneegass, Bastian Pfleging, Nora Broy, Frederik Heinrich, and Albrecht Schmidt. 2013. A Data Set of Real World Driving to Assess Driver Workload. In Proceedings of the 5th International Conference on Automotive User Interfaces and Interactive Vehicular Applications (Eindhoven, Netherlands) (AutomotiveUI ’13). Association for Computing Machinery, New York, NY, USA, 150–157. https://doi.org/10.1145/2516540.2516561
- Sharma et al. (2019) Sachin Sharma, Kamal Kumar Ghanshala, and Seshadri Mohan. 2019. Blockchain-Based Internet of Vehicles (IoV): An Efficient Secure Ad Hoc Vehicular Networking Architecture. In 2019 IEEE 2nd 5G World Forum (5GWF). 452–457. https://doi.org/10.1109/5GWF.2019.8911664
- Taubman-Ben-Ari et al. (2004) Orit Taubman-Ben-Ari, Mario Mikulincer, and Omri Gillath. 2004. The multidimensional driving style inventory—scale construct and validation. Accident Analysis & Prevention 36, 3 (2004), 323 – 332. https://doi.org/10.1016/S0001-4575(03)00010-1
- Team (2017) OpenDS Development Team. 2017. OpenDS - the Flexible Open Source Driving Simulation. https://opends.dfki.de/.
- Tech ([n.d.]) Beijing Jinfa Tech. [n.d.]. ErgoLab: Human-Machine-Environment Sychronization Platform. Would be released if the paper is accepted.
- Wang et al. (2021) Jiahao Wang, Zeyu Xiong, Yicun Duan, Junyu Liu, Zilin Song, and Xiangjun Peng. 2021. The Importance Distribution of Drivers’ Facial Expressions Varies over Time!. In AutomotiveUI ’21: 13th International Conference on Automotive User Interfaces and Interactive Vehicular Applications, Leeds, United Kingdom, September 9-14, 2021 - Adjunct Proceedings. ACM, 148–151. https://doi.org/10.1145/3473682.3480283
- Wang et al. (2019) W. Wang, J. Xi, and D. Zhao. 2019. Driving Style Analysis Using Primitive Driving Patterns With Bayesian Nonparametric Approaches. IEEE Transactions on Intelligent Transportation Systems 20, 8 (2019), 2986–2998. https://doi.org/10.1109/TITS.2018.2870525
- Xiao et al. (2010) Xiaokui Xiao, Guozhang Wang, and Johannes Gehrke. 2010. Differential privacy via wavelet transforms. IEEE Transactions on knowledge and data engineering 23, 8 (2010), 1200–1214.
- Xiong et al. (2022) Zeyu Xiong, Jiahao Wang, Wangkai Jin, Junyu Liu, Yicun Duan, Zilin Song, and Xiangjun Peng. 2022. Face2Statistics: User-Friendly, Low-Cost and Effective Alternative to In-Vehicle Sensors/Monitors for Drivers. In International Conference on Human-Computer Interaction.
- Yang et al. (2020) D. Yang, X. Li, X. Dai, R. Zhang, L. Qi, W. Zhang, and Z. Jiang. 2020. All In One Network for Driver Attention Monitoring. In ICASSP 2020 - 2020 IEEE International Conference on Acoustics, Speech and Signal Processing (ICASSP). 2258–2262. https://doi.org/10.1109/ICASSP40776.2020.9053659
- Yu et al. (2020) Fisher Yu, Haofeng Chen, Xin Wang, Wenqi Xian, Yingying Chen, Fangchen Liu, Vashisht Madhavan, and Trevor Darrell. 2020. BDD100K: A Diverse Driving Dataset for Heterogeneous Multitask Learning. arXiv:1805.04687 [cs.CV]