BLAZAR RADIO AND OPTICAL SURVEY (BROS): A CATALOG OF BLAZAR CANDIDATES SHOWING FLAT RADIO SPECTRUM AND THEIR OPTICAL IDENTIFICATION IN PAN-STARRS1 SURVEYS
Abstract
Utilizing the latest and the most sensitive radio and optical catalogs, we completed a new blazar candidate catalog, Blazar Radio and Optical Survey (BROS), which includes 88,211 sources located at declination and outside the galactic plane (). We list compact flat-spectrum radio sources of ( is defined as ) from 0.15 GHz TGSS and 1.4 GHz NVSS catalogs. We further identify optical counterparts of the selected sources by cross-matching with Pan-STARRS1 photometric data. Color-color and color-magnitude plots for the selected BROS sources clearly show two distinct populations, An ”quasar-like” population consisting of both flat-spectrum radio quasars and BL Lac type objects. On the other hand, an ”elliptical-like” population of mostly BL Lac-type objects is buried in the elliptical galaxy. The latter population is also reported in previous catalogs, but BROS catalog brought new larger sample of these population, due to the lower radio flux threshold of our selection. Model calculations show that the ”elliptical-like” population consists of elliptical galaxies located at redshift z 0.5, which is also supported by the logN-logS distribution of the power-law index of . This BROS catalog is useful for identifying the electromagnetic counterparts of ultra-high-energy cosmic rays and PeV neutrinos recently detected by IceCube, as well as nearby BL Lac objects detectable by future high sensitivity TeV telescopes, such as Cherenkov Telescope Array.
Subject headings:
editorials, notices – miscellaneous – catalogs – surveys1. Introduction
The extragalactic gamma-ray sky is dominated by blazars (e.g., Wakely & Horan, 2008; Acero et al., 2015). Blazars are one population of active galactic nuclei (AGN) whose jets are directed toward the Earth. There are 3,131 blazars in the latest Fermi 8-year catalog (The Fermi-LAT collaboration, 2019a, 4FGL catalog), which constitutes 61.8% of the total number of detected samples, 5,065 sources. In the 4FGL catalog, however, 657 sources (13.0%) at high galactic latitude are still unassociated, despite their location. The nature of these sources has yet to be resolved; however, their locations and multi-wavelength properties suggested that most of them are blazars (e. g., Liodakis & Blinov, 2019; Zhu et al., 2020). To firmly identify them as blazars, flat spectrum features in the radio band would be required, as one of the most important characteristics of blazars (Urry & Padovani, 1995a). However, currently available blazar catalogs do not provide such evidence for these high latitude, unassociated objects. Therefore, a new blazar catalog containing radio spectrum information and covering fainter objects is required to elucidate the nature of such Fermi unassociated objects.
A new deep and wide blazar catalog will be useful for future extragalactic surveys in the TeV band. The next generation imaging atmospheric Cherenkov telescopes (IACTs), namely the Cherenkov Telescope Array (CTA), is expected to be operational in 2022111https://www.cta-observatory.org. CTA will have about 10 times the sensitivity of current IACTs (Cherenkov Telescope Array Consortium et al., 2019a). More than 1000 TeV sources are expected to be detected over the entire sky including non-Fermi-detected blazars such as extreme blazars (e.g., Inoue et al., 2010; Dubus et al., 2013; Cherenkov Telescope Array Consortium et al., 2019b; Costamante, 2019; MAGIC Collaboration et al., 2019; The Fermi-LAT collaboration, 2019b). The blazar catalog will provide insight into the properties of new TeV blazars.
Such a catalog also helps in the identification of the counterparts of high-energy neutrino events. On 22 September 2017, the IceCube collaboration reported the first candidate of high-energy neutrino event associated with the gamma-ray flare activity of blazar TXS 0506+056 (IceCube-170922A, Tanaka et al., 2017; IceCube Collaboration et al., 2018). For the counterpart identification, optical and multi-frequency follow-up observations have played a critical role. The enhanced activity of TXS 0506+056 was first identified by optical observations targeting blazars in the error circle of IceCube-170922A, which led to the discovery of the associated gamma-ray activity (e.g., Keivani et al., 2017; Evans et al., 2017; Yamanaka et al., 2017; Morokuma et al., 2020). Although covering the entire error circle regions of neutrino events would be the most effective and unbiased, such observations are extremely expensive for standard optical/infrared cameras. In the case of IceCube-170922A, the error region was about deg2 with a 90% confidence level, which requires pointings and a camera with a field-of-view (FoV) of arcmin2 to cover the entire region. An alternative strategy is to observe all blazar candidates within the IceCube error circle, based on the IceCube-170922A event. Although this strategy assumes that neutrinos are emitted by blazars, it allows us to search blazars efficiently, due to the low surface density of blazars (e.g., Inoue & Totani, 2009; Ajello et al., 2015; Chang et al., 2019). In this strategy, pre-identification of blazar candidates across the entire sky is important for efficient follow-up observation.
Radio sky maps must be used to construct a blazar catalog, as blazars are characterized by their flat radio spectrum (Urry & Padovani, 1995b). In 2017, radio survey data at 0.15 GHz taken with the Giant Metrewave Radio Telescope (GMRT), specifically, the Tata Institute of Fundamental Research GMRT Sky Survey (TGSS), was released (Intema et al., 2017a). The TGSS catalog includes 0.62 million sources in the sky above ( steradians). By cross-matching with the NRAO Very Large Array Sky survey (NVSS) catalog at 1.4 GHz (Condon et al., 1998), which also covers the sky of and overlaps nearly the same region as TGSS, we can create the largest catalog of flat-spectrum radio sources to date. This effort is expected to compliment previous flat-spectrum radio source catalogs, such as CLASS (Myers et al., 2003; Browne et al., 2003) and CRATES (Healey et al., 2007). However, both the selection frequency and the flux threshold are different from those of previous catalogs, which provides a large sample of flat-spectrum radio sources.
In addition to radio data, optical information will allow us to categorize the properties of blazars, according to their types and host galaxies. Here, the Pan-STARRS1 (PS1) optical survey catalog was released in 2016 December (Chambers et al., 2016). The PS1 catalog provides the deepest photometric data over the large region of with point source limiting magnitudes of 23.3, 23.2, 23.1, 22.3 and 21.4 mag in g, r,i, z and y bands, respectively. By combining the PS1 catalog with the radio catalogs, we performed the most sensitive optical counterpart search for selected flat-spectrum radio sources, i.e., blazar candidates.
In this paper, we refer to our blazar candidate catalog as Blazar Radio and Optical Survey (BROS). The remainder of this paper is organized as follows. We describe details of our BROS catalog in §2. A discussion and conclusions are presented in §3 and §4, respectively.
2. The BROS Catalog
2.1. BROS sources selection

To select flat-spectrum radio sources, we use the TGSS-NVSS spectral index maps and catalog (TGSS-NVSS spindx/catalog, de Gasperin et al., 2018), which contains about 0.5 million sources. Fluxes and the spectral index are taken from 0.15 GHz TGSS and 1.4 GHz NVSS catalogs over the wide region of . In the TGSS-NVSS catalog, the images of the NVSS and TGSS are re-processed, combined, and then the sources are extracted. Therefore, the TGSS-NVSS catalog differs slightly from the original TGSS and NVSS catalogs (see de Gasperin et al., 2018, for details). It is estimated that the typical background root mean square (RMS) noise of the NVSS-TGSS catalog is mJy beam-1 at 1.4 GHz and mJy beam-1 at 0.15 GHz. The RMS noise value at 0.15 GHz is slightly higher than the value in the original TGSS catalog, as TGSS images are convolved to adjust the resolution for NVSS images in the TGSS-NVSS catalog. Mean estimated astrometric error is 3.5 arcsec for the TGSS-NVSS catalog.
From the TGSS-NVSS catalog, we excluded sources located within the galactic plane of where galactic objects are dominant. Then, we selected sources with the source classification flag of ’S’ in the TGSS-NVSS catalog, corresponding to the sources detected both in TGSS and NVSS with no other sources in the search region (see Section 2, de Gasperin et al., 2018, for details).
Among the rest, we selected flat-spectrum and compact objects, i.e., blazar candidates. To define the spectral flatness and the compactness of blazars in this research, we examined known blazars detected by Fermi/LAT. Figure 1 shows a scatter plot of the compactness and spectral index of all TGSS-NVSS sources and gamma-ray blazars (4LAC; The Fermi-LAT collaboration, 2019b), as shown in the TGSS-NVSS catalog. The spectral index is defined as between the 0.15 and 1.4 GHz. The compactness is defined as , where and are the integrated and peak flux measured using TGSS, respectively. We introduce to avoid contamination of radio galaxies (misaligned blazars). As shown in the figure, 94% of Fermi-LAT gamma-ray blazars are located in and . Thus, we selected sources with those criteria for this research.
After applying the selection above, 88,211 BROS sources were left. From Figure 1, 58 Fermi-LAT gamma-ray blazars which include several famous blazars such as 1ES 1215+303 () and OQ 530 () were excluded. Twenty-four of these blazars have and mostly reside nearby (), compared to samples with . These sources are actually resolved in TGSS images. We also note that a small fraction % of gamma-ray blazars have steep spectrum lobes at low frequency (Giroletti et al., 2016). These populations are missed in the BROS catalog.
2.2. Optical Counterparts

To search for the optical counterparts of the selected flat-spectrum radio sources, we utilized the Pan-STARRS photometric catalog222available at http://mastweb.stsci.edu/ps1casjobs/home.aspx (Chambers et al., 2016). The covered region of the PS1 data ( sky above ) matches that of the TGSS-NVSS catalog. The PS1 data were taken between 2010 and 2012 with a 1.8 m telescope near the summit of Haleakala in Hawaii.
Using the PS1 photometric catalog, we identified the optical counterparts of BROS sources by finding the closest PS1 neighbor within a tolerance radius . First, we collected all PS1 sources detected in band within 20 arcsec of the selected flat-spectrum radio sources, which is large enough compared to positional uncertainty in the radio band (typically a few arcseconds).Figure 2 shows the number count of all PS1 neighbors to BROS sources in an annulus between and (we set arcsec to reduce uncertainties of each bin less than 5%). The number count peaks at 0.5 arcsec and increases again toward larger radii. The first peak is mostly dominated by a true-matched source, while the latter increse is caused by unrelated sources randomly coincident, , where is the number density of PS1 sources and is the separation of neighbors with respect to a BROS source. The green line in Figure 2 indicates the linear line representing the association by chance between random positions and PS1 sources. This line is a measure of ”the background”. The tolerance radius is determined empirically to minimize contamination by chance as well as to maximize the true-matched sources. We adopted = 2 arcsec. Finally, we obtained 42,757 BROS optical counterparts. From Figure 2, we estimated the contamination ratio 10% and overlooked ratio 19% for our data selection.

2.3. Contamination of the gigahertz peaked-spectrum and compact steep-spectrum radio sources
Gigahertz peaked-spectrum (GPS) and compact steep-spectrum (CSS) radio sources are a kind of compact AGN. Given that we selected sources using only two bands (0.15 and 1.4 GHz), the sources with a spectral peak at GHz can be misidentified as flat spectrum objects in the BROS.
To investigate the contamination fraction of GPS and CSS radio sources, we checked the multi-band spectrum in the radio band, taking the cross-match between BROS and the multi-frequency radio source catalog by Kimball & Ivezic (2014, hereafter, Kimball catalog), which contains flux values from GB6 at 4.85 GHz and WENSS at 325 MHz (Rengelink et al., 1997; Gregory et al., 1996). This enables the blazars and GPS/CSS sources to be distinguished by checking the existence of a peak at GHz.
Figure 3 shows examples of GPSs and blazars. We estimated the expected GB6 and WENSS flux densities using only NVSS flux and TGSS-NVSS spectral index (i.e., assuming a single power-law spectrum) and comparing it with the flux reported in the Kimball catalog. BROS sources have a counterpart in the GB6 and/or WENSS catalogs. About 25% of them are identified as GPSs whose source flux is deviates from the flat spectrum at the 5 confidence level. For those objects, we added a flag of ”G” to the ”SourceFlag” column. However, the GB6 and WENSS catalogs do not cover all-sky condition and have different sensitivity compared to the TGSS-NVSS catalog. Therefore most of the BROS samples ( sources) do not have counterparts in the Kimball catalog. These sources are treated as ”blazars” in the BROS catalog; however, the GPS/CSS sources may be contaminated.
| Column name | Format | Notes |
|---|---|---|
| BROS-ID | - | source ID |
| spindx-RA | degree | RA from TGSS-NVSS cataloga |
| spindx-Dec | degree | Decl. from TGSS-NVSS cataloga |
| spindx-TGSS-Flux | Jy | TGSS Total fluxa |
| spindx-TGSS-Flux-error | Jy | TGSS Total flux errora |
| spindx-NVSS-Flux | Jy | NVSS Total fluxa |
| spindx-NVSS-Flux-error | Jy | NVSS Total flux errora |
| spindx-Spectral-Index | - | Spectral index between 0.15 GHz and 1.4 GHza |
| spindx-Spectral-Index-error | - | Spectral index errora |
| SourceFlag | strings | Source type flag, ”Q”, ”E”, ”G” or ”B” |
| radio-Compactness | – | Radio compactness defined as total flux / peak flux (NVSS) |
| radio-Compactness-error | – | Radio compactness error |
| optical-Compactness | – | Optical compactness defined as (PS1, i- band) |
| optical-Compactness-error | – | Optical compactness error |
| PS1-BROS-separation | arcsec | source separation angle between TGSS-NVSS and PS1 catalog position |
| PS1-r-RA | degree | r-band R.A. positionb |
| PS1-r-Dec | degree | r-band Decl. positionb |
| PS1-g-Kronmag | magnitude | g-band Kron magnitudeb |
| PS1-g-Kronmag-error | magnitude | g-band Kron magnitude errorb |
| PS1-g-PSFmag | magnitude | g-band PSF magnitudeb |
| PS1-g-PSFmag-error | magnitude | g-band PSF magnitude errorb |
| PS1-r-Kronmag | magnitude | r-band Kron magnitudeb |
| PS1-r-Kronmag-error | magnitude | r-band Kron magnitude errorb |
| PS1-r-PSFmag | magnitude | r-band PSF magnitudeb |
| PS1-r-PSFmag-error | magnitude | r-band PSF magnitude errorb |
| PS1-i-Kronmag | magnitude | i-band Kron magnitudeb |
| PS1-i-Kronmag-error | magnitude | i-band Kron magnitude errorb |
| PS1-i-PSFmag | magnitude | i-band PSF magnitudeb |
| PS1-i-PSFmag-error | magnitude | i-band PSF magnitude errorb |
2.4. Catalog description
A description of the BROS catalog is summarized in Table 1. The catalog is available at http://www.bao.city.ibara.okayama.jp/BROS/ and the Centre de Données astronomiques de Strasbourg https://cds.u-strasbg.fr/.
Figure 4 shows the sky distribution of BROS sources. The distribution is not perfectly uniform. A higher source density region (strip) is present, for example, at (l, b) = () to (l, b) = (). We think that this is not intrinsic, but instead due to the nonuniform sensitivity of the TGSS (i.e., the nonuniform distribution of TGSS sources), as evidenced by the spatial distribution of TGSS sources in Fig. B.2 of Intema et al. (2017b).

2.5. Comparison with other blazar catalogs
CRATES is a well-known blazar candidate catalog (Healey et al., 2007); here, they selected radio sources of mJy showing flat radio spectra of between 1.4 GHz (or 0.84 GHz for the sources located at ) and 4.8 GHz. CRATES has 11,131 sources and is, thus, a quarter size of BROS. One major difference with respect to BROS is the radio frequencies. Given that CRATES utilizes the NVSS catalog for 1.4 GHz and GB6, PMN, and S5 catalogs for 4.8 GHz, the detection limit of CRATES depends on its declination with a typical detection limit at mJy at 4.8 GHz. Thus, the CRATES catalog is shallower than BROS.
The Candidate Gamma-Ray Blazar Survey catalog (CGRaBS Healey et al., 2008) is essentially based on the CRATES and contains 1,625 sources with radio and X-ray data. CGRaBS also contains red-shift and blazar-type classifications (FSRQ or BL Lac) based on optical spectroscopy. The Roma-BZCAT catalog (Massaro et al., 2015) contains 3,561 blazars selected by multi-frequency surveys. In the Roma-BZCAT, most of the blazars are classified into two types: flat-spectrum radio quasars (FSRQs) and BL Lac objects (BL Lacs), by optical spectroscopic data. 3HSP catalog (Chang et al., 2019) contains 2,013 high synchrotron peaked blazar candidates made for high energy astrophysics and neutrino astronomy. CGRaBS, Roma-BZCAT and 3HSP focus on multi-wavelength observations and are useful for identifying blazar properties; however, the number of sources is smaller than that of BROS.
Table 2 shows a summary of blazar catalogs. Hereinafter, we focused on a comparison with CRATES, which adopts similar selection criteria to BROS. We cross-matched the BROS and CRATES catalogs. First, we selected CRATES sources located at ; the resulting CRATES source number was 9,071. For these sources, we searched for the TGSS counterpart. Then, we identified 7,971 sources (88%) with TGSS-NVSS counterparts; additionally, 5,178 sources (57%) have BROS counterparts. The sources that have TGSS-NVSS counterparts but are not listed in the BROS catalog, are due to the soft radio spectra of or have a non source classification flag of ’S’ or a radio compactness of .
We also checked the reason why about 12% of the CRATES sources are not detected by the TGSS-NVSS catalog. One reason would be due to the sensitivity of the TGSS-NVSS catalog at 0.15 GHz. The typical RMS noise is 8 mJy beam-1 at 0.15 GHz (de Gasperin et al., 2018); sensitivity is not uniform. In the CRATES catalog, 4.8 GHz fluxes of the sources are larger than 65 mJy. Thus, if a source has a very hard spectrum of say 0.6, the source cannot be detected by the TGSS. To check this possibility, we made a histogram of for CRATES sources that are listed or dropped in the TGSS catalog (Figure 5). We find that the CRATES sources not detected by the TGSS-NVSS show a relatively hard spectral index compared to the TGSS-CRATES sources. In addition, contamination of GPS/CSS sources in the CRATES catalog may also be a reason for non-detection sources at 0.15 GHz, because it has a spectral break peaking for the GHz band.

1861 Roma-BZCAT sources have BROS counterparts within the BROS sky region, in other words, 1253 (%) of the Roma-BZCAT objects are missed in the our catalog. Among the missing Roma-BZCAT sources, 67% are recorded as either of ’BL Lac’, ’BL Lac Candidate’, ’BL Lac-galaxy dominated’, ’Blazar Uncertain type’, while the remaining objects are classified as ’QSO RLoud flat radio sp’. Figure 6 shows the redshift distribution of the missing ratio of the Roma-BZCAT objects in BROS. The bump at low redshift () in the Figure 6 is mostly dominated by the BL Lac sources, while at the missing population is dominated by FSRQs. The redshift measurements of BL Lac sources are known to be biased towards low redshifts because of spectroscopic limitations (see Ajello et al., 2014, Figure 7 for detail). We further investigate the reason for the differences between BROS and Roma-BZCAT. About 70% sources of the missed Roma-BZCAT sources are not listed or having source classification flag of ”L”, i.e., non-TGSS detection, (see de Gasperin et al., 2018, for detail) in the TGSS-NVSS catalog. By estimating the 0.15 GHz flux, we confirm that the corresponding flux of the missed Roma-BZCAT sources are below the detection limit of TGSS, where we extrapolate from the NVSS flux assuming a spectral index of 0.5. Therefore, we conclude the TGSS flux limit causes this mismatch. The remaining 30% are excluded by its radio morphology.
The similar situations are also realized when comparing the BROS catalog with the 3HSP catalog (363 missing sources, 21.5%) and 4LAC (784 missing sources, 32%). The BROS catalog is uniform over the footprint, but tends to miss the sources that have hard radio spectrum limited by TGSS sensitivity at 0.15 GHz.

| Cataloga | Sourcesb | Sky coveragec | bandd | Classificatione |
|---|---|---|---|---|
| BROS | 88,211 | 0.15 GHz, 1.4 GHz, optical g, r, i-band | no | |
| CRATES | 11,131 | all sky | 1.4 GHz, 8.4 GHz | no |
| CGRaBS | 1,625 | all sky | 8.4 GHz, optical R-band | yes |
| Roma-BZCAT | 3,561 | all sky | 1.4 GHz, 143 GHz, optical R-band, X-ray, gamma-ray | yes |
| 3HSP | 2,013 | all sky | 1.4 GHz and X-ray | yes |
3. Discussion
3.1. Optical properties
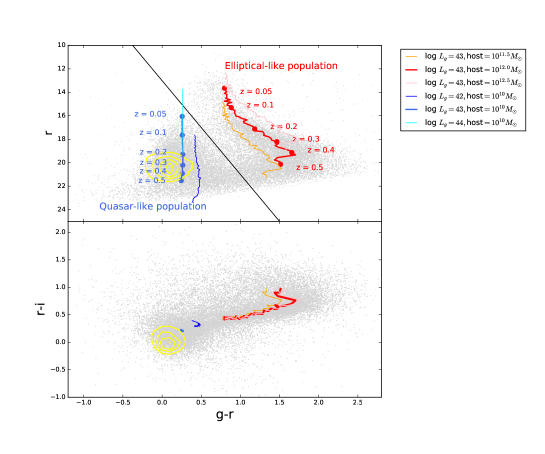
Here we discuss the optical properties of BROS sources. Figure 7 upper and lower panel shows the vs. color-magnitude and vs. color-color diagrams for the BROS sources, respectively. Magnitudes are in Kron magnitude, which is photon flux measured with the Kron technique for an extended source (Kron, 1980), because many BROS sources show extended optical emission, i.e., host galaxies. We exclude sources with large photometric uncertainties (g-error, r-error or i-error 0.3 mag.) from the plot.
The upper panel in Fig. 7 clearly shows the presence of two populations: one cluster at to and the other at to . The latter population is not seen in CRATES catalog (see Appendix A for details about the CRATES-PS1 sources and their comparison with BROS-PS1 sources). The horizontally elongated distribution at shown in the upper panel is not intrinsic, but is due, instead, to the large error associated with the detection limit of the PS1 catalog.

To understand the nature of these two populations, we calculated the expected gri magnitudes and colors, utilizing phenomenological spectral energy distribution (SED) templates of a composite of blazars and elliptical galaxies. Blazar’s broadband SED consists of two spectral peaks (synchrotron and, most likely, inverse Compton emissions) and that the fainter blazars show higher peak frequency due to inefficient radiative cooling, so-called blazar sequence (e.g., Fossati et al., 1998; Kubo et al., 1998; Ghisellini et al., 2017). We adopted the latest blazar sequence model in Ghisellini et al. (2017). As described later, this model well explained its magnitude-color diagrams for the BROS sources. However, we note that the existence of the blazar sequence is still under debate because of selection effect (e.g., Caccianiga & Marchã, 2004; Padovani et al., 2007; Giommi et al., 2012; Giommi & Padovani, 2015; Padovani et al., 2019). For elliptical galaxies, we used the stellar population synthesis model by Bruzual & Charlot (2003) assuming the Salpeter initial mass function, instantaneous star formation, age of 10 Gyr old, and solar metallicity. Figure 8 shows the overall SED with bright host galaxy SED templates of various stellar mass.

Figure 9 shows the vs color-magnitude and vs color-color diagrams of blazars with several gamma-ray luminosity and host galaxy stellar mass , at various redshifts. BROS sources are also shown. The model curves based on our simple calculation closely reproduce the observed population, particularly and . The optical emission is dominated by bright hosts in the former model, whereas in the latter case, the emission is dominated by blazars. Thus, the right population is dominated by bright elliptical galaxy () emission, whereas the left population is dominated by blazar emission. Large samples (13,153 sources, 52%) which have bright host galaxy are newly discovered by BROS, while hundreds of similar samples are reported in Roma-BZCAT, 3HSP and other catalogs (e.g., 1,207 sources, 19% are classified as latter population in CRATES catalog, see Appendix A). We also note that ’big blue bump’ component originated in the disk is confirmed in several FSRQs in the optical band. For reference, the colors-magnitude and color-color diagram of normal SDSS quasar located at low redshift () are shown in Figure 9 as yellow contour (Pâris et al., 2017). As we see in the figure, the observed low redshift SDSS quasars which do not deviate from the simple Blazar model confirm that the contribution from the disk component is indistinguishable in our distinction.
Hereinafter, for the sake of simplicity, we divided the BROS sources into two populations; namely quasar-like ( in vs plot) and elliptical-like populations ( in vs plot). In the BROS catalog, if the sources have a PS1 candidate and are not classified as GPS sources, we set ’Q’ (’E’) flag for the source which locates in a quasar-like (elliptical-like) population to the ’SourceFlag’ column. The sources that do not have a PS1-candidate and are not classified as GPS sources were assigned a ’B’ flag.
We note that there is also a marginal population in the valley between quasar-like and elliptical-like populations. This marginal population is likely a mixture of the distribution tails of both population.. Further detailed studies such as the convolution of blazar and galaxy luminosity functions will be able to elucidate the properties of the marginal population; however, this is beyond the scope of this paper.
We also investigated the spatial extension of sources in the optical band. We use the formula, where is the photon flux derived with a point source spread function and is the photon flux for the extended source, to select the extended source. As a result, % elliptical-like sources were classified as extended sources; in contrast, quasar-like sources were classified as extended sources. This result also supports an ”elliptical-like” branch, determined by its optical color, consisting of elliptical galaxies.
Generally, optical emission in FSRQs is not dominated by a host galaxy, as FSRQs have strong jet emission ( erg s-1) compared to that of BL Lac-type objects (see Fig. 8). Therefore, it is expected that the elliptical-like population consists mostly of BL Lacs, whereas the quasar-like population consists of both FSRQs and BL Lacs. We also confirmed this by cross-matching between BROS and classified sources (BL Lac or FSRQ) in 4LAC. As a result, 74% (26%) of elliptical-like sources are classified as BL Lacs (FSRQs) in 4LAC, and 44% (56%) of quasar-like sources are classified as BL Lacs (FSRQs).
3.2. Comparison to radio properties
Figure 10 shows the vs. NVSS flux and vs. radio loudness (defined as ) of the BROS sources together with the magnitude and color diagram. As shown in the upper right panel of Figure 10, quasar-like sources show slightly larger NVSS fluxes compared to the elliptical-like one.
The quasar-like sources tended to have a high compared to that of elliptical-like ones. Radio loudness is a useful tool to distinguish the spectral type of blazar, as a high value is expected for BL Lac-type objects from the unification model for AGN (e.g., Urry & Padovani, 1995a). However, in our sample, optical emission of elliptical-like sources are likely contaminated by the host galaxy, such that our value tends to be small. Therefore, we believe that the differences in between quasar-like sources and elliptical-like ones are not due to the spectral difference originating from jet emission.

3.3. Cumulative source count distribution
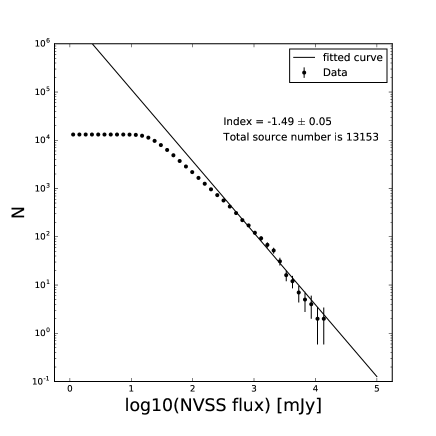
Figure 11 shows the - distributions for the BROS sources based on TGSS and NVSS fluxes. We fit the - data points using a power-law function of . The NVSS-TGSS catalog is estimated to be complete down to mJy for NVSS and mJy for TGSS sources (de Gasperin et al., 2018). To avoid the effects of source incompleteness for a lower radio flux, we used sources with mJy for the derivation of the slope. We obtain the power-law indices of and for TGSS and NVSS fluxes, respectively. The power-law index becomes if the space density of objects is constant in Euclidean space (e.g., Peterson, 1997). The derived indices steeper than -1.5 indicate positive evolution for the selected flat-spectrum radio sources, namely the space density in the past is higher than that at present.


The - plots for the quasar-like and elliptical-like BROS sources are displayed in Figure 12. The quasar-like and elliptical-like sources show power-law indices of and , respectively, indicating a significant difference between the two populations. The former population shows positive evolution whereas the latter does not, supporting our interpretation that the former is dominated by quasars and the latter consists of a different type of object relatively nearby elliptical galaxies.

4. Conclusion
Our main results are summarized as follows.
-
1.
We produced a new blazar candidate catalog by selecting the flat-spectrum radio sources of from TGSS-NVSS catalogs; 88,211 sources are listed for the region of and outside galactic plane ().
-
2.
We identified the optical counterpart for each BROS source from Pan-STARRS1 photometric data; 42,757 sources are detected in the -band.
-
3.
The color-magnitude and color-color distribution of the BROS sources indicates the existence of two distinct populations in the BROS sources. One is a quasar-like population in which optical emission is dominated by blazars, and the other is an elliptical-like population in which optical emission is dominated by bright elliptical galaxies located at . These populations roughly correspond to FSRQs and BL Lacs, respectively; however, jet-dominated BL Lac objects are included in the quasar-like population due to the blue synchrotron spectrum.
-
4.
The BROS elliptical-like population includes nearby BL Lac objects, a fraction of which would be TeV emitters.
Finally, we note that the BROS catalog is expected to be useful for identifying MeV/GeV unassociated sources detected by Fermi-LAT. For example, it is interesting to search for BROS sources inside the 4FGL unassociated sources. Further studies are needed to investigate the relationship between these two sources. In addition, very hard BL Lac objects, known as extreme HBLs, are considered faint in both optical and TeV gamma-ray bands, according to the blazar sequence. Indeed, for a famous extreme HBL 1ES 0229+200 and possible candidate HESS J1943+213, the optical fluxes are dominated by host galaxy emission of bright ellipticals (Tavecchio et al., 2009; Tanaka et al., 2014). Thus, we expect that numerous TeV sources are buried in the BROS elliptical-population, which makes them good targets for CTA observation.
Appendix A CROSS MATCHING BETWEEN CRATES AND PS1 CATALOGS
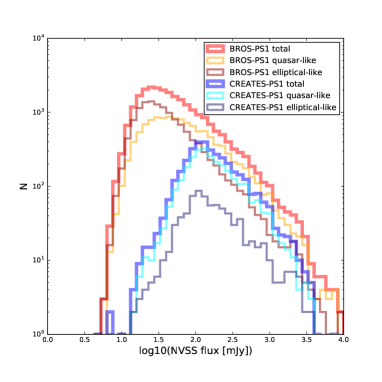
For comparison, we searched for the optical counterparts of CRATES sources using PS1 photometric data. The cross-matching method is completely the same as that utilized for BROS and PS1 cross-matching described in §3. The results are shown in Figure 13, which is the same as Figure 10 but for the CRATES-PS1 sources. From the upper left and lower left panels, it is apparent that we mostly detected only objects in the BROS quasar-like population and few objects in the BROS elliptical-like population.

The reason why this CRATES-PS1 cross-matching does not pick up the objects in the elliptical-like population would be that this population shows systematically lower radio fluxes than those in the quasar-like population (see upper right panel in Figure 10). To investigate this hypothesis in detail, we made histograms of NVSS fluxes for CRATES-PS1 and BROS-PS1 sources in quasar-like and elliptical-like populations, which are plotted in Figure 14. The classification method for CRATES-PS1 sources into quasar-like and elliptical-like populations is the same as that shown in Figure 10. Clearly, the CRATES sources are the brightest portion of the BROS sources in the NVSS flux and are mostly dominated by quasar-like radio-bright objects. Indeed, the radio flux threshold for the CRATES selection criteria is relatively high (see also Figure 14 for the NVSS flux threshold). Thus, most objects in the BROS elliptical population are not picked up in the CRATES catalog.
References
- Acero et al. (2015) Acero, F., et al. 2015, The Astrophysical Journal Supplement Series, 218, 23
- Ajello et al. (2014) Ajello, M., et al. 2014, ApJ, 780, 73
- Ajello et al. (2015) —. 2015, ApJ, 800, L27
- Browne et al. (2003) Browne, I. W. A., et al. 2003, MNRAS, 341, 13
- Bruzual & Charlot (2003) Bruzual, G., & Charlot, S. 2003, MNRAS, 344, 1000
- Caccianiga & Marchã (2004) Caccianiga, A., & Marchã, M. J. M. 2004, MNRAS, 348, 937
- Chambers et al. (2016) Chambers, K. C., et al. 2016, ArXiv e-prints, arXiv:1612.05560
- Chang et al. (2019) Chang, Y. L., Arsioli, B., Giommi, P., Padovani, P., & Brandt, C. H. 2019, A&A, 632, A77
- Cherenkov Telescope Array Consortium et al. (2019a) Cherenkov Telescope Array Consortium et al. 2019a, Science with the Cherenkov Telescope Array
- Cherenkov Telescope Array Consortium et al. (2019b) —. 2019b, Science with the Cherenkov Telescope Array
- Condon et al. (1998) Condon, J. J., Cotton, W. D., Greisen, E. W., Yin, Q. F., Perley, R. A., Taylor, G. B., & Broderick, J. J. 1998, AJ, 115, 1693
- Costamante (2019) Costamante, L. 2019, arXiv e-prints, arXiv:1911.05027
- de Gasperin et al. (2018) de Gasperin, F., Intema, H. T., & Frail, D. A. 2018, MNRAS, 474, 5008
- Dubus et al. (2013) Dubus, G., et al. 2013, Astroparticle Physics, 43, 317
- Evans et al. (2017) Evans, P. A., Keivani, A., Kennea, J. A., Fox, D. B., Cowen, D. F., Osborne, J. P., Marshall, F. E., & Icecube. 2017, GRB Coordinates Network, 21941, 1
- Fossati et al. (1998) Fossati, G., Maraschi, L., Celotti, A., Comastri, A., & Ghisellini, G. 1998, MNRAS, 299, 433
- Ghisellini et al. (2017) Ghisellini, G., Righi, C., Costamante, L., & Tavecchio, F. 2017, MNRAS, 469, 255
- Giommi & Padovani (2015) Giommi, P., & Padovani, P. 2015, MNRAS, 450, 2404
- Giommi et al. (2012) Giommi, P., Padovani, P., Polenta, G., Turriziani, S., D’Elia, V., & Piranomonte, S. 2012, MNRAS, 420, 2899
- Giroletti et al. (2016) Giroletti, M., et al. 2016, A&A, 588, A141
- Gregory et al. (1996) Gregory, P. C., Scott, W. K., Douglas, K., & Condon, J. J. 1996, ApJS, 103, 427
- Healey et al. (2007) Healey, S. E., Romani, R. W., Taylor, G. B., Sadler, E. M., Ricci, R., Murphy, T., Ulvestad, J. S., & Winn, J. N. 2007, The Astrophysical Journal Supplement Series, 171, 61
- Healey et al. (2008) Healey, S. E., et al. 2008, ApJS, 175, 97
- IceCube Collaboration et al. (2018) IceCube Collaboration et al. 2018, Science, 361, eaat1378
- Inoue & Totani (2009) Inoue, Y., & Totani, T. 2009, ApJ, 702, 523
- Inoue et al. (2010) Inoue, Y., Totani, T., & Mori, M. 2010, PASJ, 62, 1005
- Intema et al. (2017a) Intema, H. T., Jagannathan, P., Mooley, K. P., & Frail, D. A. 2017a, A&A, 598, A78
- Intema et al. (2017b) —. 2017b, A&A, 598, A78
- Keivani et al. (2017) Keivani, A., Evans, P. A., Kennea, J. A., Fox, D. B., Cowen, D. F., Osborne, J. P., & Marshall, F. E. 2017, GRB Coordinates Network, 21930, 1
- Kimball & Ivezic (2014) Kimball, A., & Ivezic, Z. 2014, arXiv e-prints, arXiv:1401.1535
- Kron (1980) Kron, R. G. 1980, ApJS, 43, 305
- Kubo et al. (1998) Kubo, H., Takahashi, T., Madejski, G., Tashiro, M., Makino, F., Inoue, S., & Takahara, F. 1998, ApJ, 504, 693
- Liodakis & Blinov (2019) Liodakis, I., & Blinov, D. 2019, MNRAS, 486, 3415
- MAGIC Collaboration et al. (2019) MAGIC Collaboration et al. 2019, arXiv e-prints, arXiv:1911.06680
- Massaro et al. (2015) Massaro, E., Maselli, A., Leto, C., Marchegiani, P., Perri, M., Giommi, P., & Piranomonte, S. 2015, Ap&SS, 357, 75
- Morokuma et al. (2020) Morokuma, T., et al. 2020, PASJ, (submitted)
- Myers et al. (2003) Myers, S. T., et al. 2003, MNRAS, 341, 1
- Padovani et al. (2007) Padovani, P., Giommi, P., Landt, H., & Perlman, E. S. 2007, ApJ, 662, 182
- Padovani et al. (2019) Padovani, P., Oikonomou, F., Petropoulou, M., Giommi, P., & Resconi, E. 2019, MNRAS, 484, L104
- Pâris et al. (2017) Pâris, I., et al. 2017, A&A, 597, A79
- Peterson (1997) Peterson, B. M. 1997, An Introduction to Active Galactic Nuclei
- Rengelink et al. (1997) Rengelink, R. B., Tang, Y., de Bruyn, A. G., Miley, G. K., Bremer, M. N., Roettgering, H. J. A., & Bremer, M. A. R. 1997, A&AS, 124, 259
- Tanaka et al. (2017) Tanaka, Y. T., Buson, S., & Kocevski, D. 2017, The Astronomer’s Telegram, 10791, 1
- Tanaka et al. (2014) Tanaka, Y. T., et al. 2014, ApJ, 787, 155
- Tavecchio et al. (2009) Tavecchio, F., Ghisellini, G., Ghirlanda, G., Costamante, L., & Franceschini, A. 2009, MNRAS, 399, L59
- The Fermi-LAT collaboration (2019a) The Fermi-LAT collaboration. 2019a, arXiv e-prints, arXiv:1902.10045
- The Fermi-LAT collaboration (2019b) —. 2019b, arXiv e-prints, arXiv:1905.10771
- Urry & Padovani (1995a) Urry, C. M., & Padovani, P. 1995a, Publications of the Astronomical Society of the Pacific, 107, 803
- Urry & Padovani (1995b) —. 1995b, PASP, 107, 803
- Wakely & Horan (2008) Wakely, S. P., & Horan, D. 2008, International Cosmic Ray Conference, 3, 1341
- Yamanaka et al. (2017) Yamanaka, M., Tanaka, Y. T., Mori, H., Kawabata, K. S., Utsumi, Y., Nakaoka, T., Kawabata, M., & Nagashima, H. 2017, The Astronomer’s Telegram, 10844, 1
- Zhu et al. (2020) Zhu, K., Kang, S.-J., & Zheng, Y.-G. 2020, arXiv e-prints, arXiv:2001.06010