Backdoor Attack through Frequency Domain
Abstract.
Backdoor attacks have been shown to be a serious threat against deep learning systems such as biometric authentication and autonomous driving. An effective backdoor attack could enforce the model misbehave under certain predefined conditions, i.e., triggers, but behave normally otherwise. However, the triggers of existing attacks are directly injected in the pixel space, which tend to be detectable by existing defenses and visually identifiable at both training and inference stages. In this paper, we propose a new backdoor attack FTrojan through trojaning the frequency domain. The key intuition is that triggering perturbations in the frequency domain correspond to small pixel-wise perturbations dispersed across the entire image, breaking the underlying assumptions of existing defenses and making the poisoning images visually indistinguishable from clean ones. We evaluate FTrojan in several datasets and tasks showing that it achieves a high attack success rate without significantly degrading the prediction accuracy on benign inputs. Moreover, the poisoning images are nearly invisible and retain high perceptual quality. We also evaluate FTrojan against state-of-the-art defenses as well as several adaptive defenses that are designed on the frequency domain. The results show that FTrojan can robustly elude or significantly degenerate the performance of these defenses.
1. Introduction
Convolutional neural networks (CNNs) have attracted tremendous attention and have been widely used in many real applications including object classification (Krizhevsky et al., 2012; He et al., 2015), face recognition (Parkhi et al., 2015; Schroff et al., 2015), real-time object detection (Ren et al., 2015; Redmon et al., 2016), etc. To build their own CNNs, users usually need to collect a large-scale dataset from the open Internet, or even outsource the entire training process due to the lack of computing resources. This makes CNNs exploitable to backdoor/trojan attacks (Gu et al., 2017; Liu et al., 2018b). Specifically, a typical backdoor attack poisons a small subset of training data with a trigger, and enforces the backdoored model misbehave (e.g., misclassify the test input to a target label) when the trigger is present but behave normally otherwise at inference time. Such attacks can cause serious damages such as deceiving biometric authentication that is based on face recognition or misleading autonomous cars that rely on camera inputs.
An ideal backdoor attack should satisfy the three desiderata of efficacy, specificity, and fidelity from the adversary’s perspective (Pang et al., 2020). Here, efficacy means that the target CNN model can be successfully misled by the triggers, specificity means that the trained model should perform normally on the benign inputs, and fidelity means the poisoning images should retain the perceptual similarity to the original clean images. The latter two aspects are related to the stealthiness of a backdoor attack. That is, if either the trigger is clearly visible or the backdoored model performs relatively poor on the benign inputs, users may easily detect such an anomaly.
While various existing backdoor attacks perform relatively well on the efficacy and specificity aspects, they tend to fall short in terms of satisfying the fidelity requirement, i.e., the triggers are visually identifiable. The fundamental reason is that existing attacks directly inject or search for triggers in the spatial domain (i.e., pixel space) of an image. In this domain, it is a dilemma to find triggers that are simultaneously recognizable by CNNs and invisible to humans (please refer to Figure 1 and Section 2 for details). Additionally, existing triggers in the spatial domain are usually small in size and concentrated in energy, making them detectable by existing defenses (Wang et al., 2019; Liu et al., 2019; Doan et al., 2020).
In this paper, we propose a new backdoor attack FTrojan through the frequency domain of images. Our key insights are two-fold. First, adding small perturbations in the mid- and high-frequency components of an image will not significantly reduce its fidelity (Sonka et al., 2014; Yamaguchi et al., 2018).111Intuitively, while low-frequency components correspond to large and flat areas in the image, mid- and high-frequency components describe the sharply changing areas (e.g., edges, contours, or noises) and thus their small perturbations are nearly negligible to human perception. Second, recent research has provided evidence that images’ frequency-domain features are recognizable and learnable by CNNs (Yin et al., 2019; Xu et al., 2019a, b; Wang et al., 2020). In other words, although CNNs take the spatial-domain pixels as input, they can also easily learn and remember the injected triggers in the frequency domain.
Armed with the above insights, it is still challenging to make our attack more invisible and more robust against existing defenses. For such purposes, we first transform the images from RGB channels to YUV channels as UV channels correspond to chrominance components that are less sensitive to the human visual system (HVS). Next, we divide an image into a set of disjoint blocks and inject the trigger at both mid- or high-frequency components of the UV channels in each block. Through the above design, we can not only maintain the high fidelity of poisoning images, but also disperse the trigger throughout the entire image breaking the underlying assumptions of many existing defenses. We also extend the attack to the clean-label setting (Turner et al., 2018), making the attack evasive at both training and inference stages.
We evaluate our attack in several datasets and tasks including traffic sign recognition, objection classification, and face recognition. The results show that the proposed attack FTrojan achieves 98.78% attack success rate on average without significantly degrading the classification accuracy on benign inputs (0.56% accuracy decrease on average). Moreover, we compare the fidelity aspect with several existing backdoor attacks and show that the poisoning images by FTrojan are nearly invisible and retain higher perceptual quality. We also evaluate the proposed attack against five state-of-the-art backdoor defensing systems including Neural Cleanse (Wang et al., 2019), ABS (Liu et al., 2019), STRIP (Gao et al., 2019), Februus (Doan et al., 2020), and NAD (Li et al., 2021). We also design several adaptive defenses based on anomaly detection and signal smoothing in the frequency domain. The results show that FTrojan can robustly bypass or significantly degenerate the performance of these defenses.
The main contributions of this paper include:
-
•
We are the first to propose backdoor attacks through trojaning the frequency domain. It opens the door for various future backdoor attacks and defenses.
-
•
We explore a large design space of backdoor attacks in frequency domain and report our findings.
-
•
We empirically show the superiority of the proposed attack in terms of efficacy, specificity, and fidelity aspects, as well as the robustness against existing defenses.
2. Motivation
In this section, we analyze the existing state-of-the-art backdoor attacks as well as their limitations which motivate our proposed backdoor attack residing in the frequency domain of images. In particular, we analyze the existing backdoor attacks using the three desiderata of an adversary’s attack (Pang et al., 2020), i.e., efficacy, specificity, and fidelity.222Although it is controversial whether the poisoning image should keep high fidelity, it is definitely undesirable if an attack become suspicious or can be easily detected by a simple manual inspection from the adversary’s perspective. While an ideal backdoor attack should satisfy all the three aspects, it was found that it is impossible for adversary’s attacks to simultaneously and strictly achieve all the them (Pang et al., 2020).
2.1. Existing Backdoor Attacks


As a typical and pioneering backdoor attack, BadNet (Gu et al., 2017) proposes to poison some training data with predefined triggers (e.g., a square in Figure 1) for a target label. Then, it changes the labels of the poisoning images to the target label, and trains the CNN model with the poisoning data. For a test input stamped with the trigger, no matter what the real label is, the trained model will predict the test input as the target label. Later backdoor attacks mainly focus on making the attacks more effective against existing backdoor defenses. Typical strategies include generating different triggers for different inputs (Salem et al., 2020; Nguyen and Tran, 2020) and reusing existing objects in the target label as triggers (Lin et al., 2020). Recently, several backdoor attacks pay special attention to the fidelity aspect, by dispersing the trigger to a much larger area (Barni et al., 2019; Liu et al., 2020). Consequently, the triggers are thus less visible to humans (see Figure 1 for some examples) and less detectable to existing defenses. For example, The SIG (Barni et al., 2019) attack transfers the images with superimpose signals (e.g., a ramp signal or a sinusoidal signal), and triggers are contained in the varying background; the Refool (Liu et al., 2020) attack defines triggers resembling to the natural reflection phenomenon, and shows that it is resistant to several defenses including Fine-pruning (Liu et al., 2018a) and Neural Cleanse (Wang et al., 2019).
Limitations: the existing backdoor attacks are still largely visible and lack fidelity. While the existing backdoor attacks perform relatively well on the efficacy and specificity aspects, they tend to fall short in terms of satisfy the fidelity requirement. Some poisoning images of the above attacks are illustrated in Figure 1. Figure 1 shows the poisoning images of the backdoor attacks whose triggers are concentrated in a small area. As we can see, all the triggers are visually identifiable to a large extent, making the poisoning data easily detectable by humans. For SIG and Refool as shown in Figure 1, although the triggers are dispersed to a larger area and thus more negligible compared to previous attacks, they are still generally detectable by humans (e.g., the wave pattern in the background or the abnormal reflective phenomenon). Based on the low fidelity results of existing backdoor attacks, we speculate that the fundamental reason lies in that they directly inject or search for triggers in the spatial domain of an image. Therefore, the triggers usually need to be sufficiently prominent, and thus potentially visible, so as to make CNN models recognize and remember their features.
2.2. Our Key Insight
In this work, we propose to launch the backdoor attack in the frequency domain. Our key insights are as follows.
-
•
First, attacks in the frequency domain can result in poisoning images with high fidelity. On the one hand, existing backdoor attacks have shown that dispersing the trigger to the entire image in the spatial domain could improve the image fidelity and make the trigger less visible and more robust against existing defenses. On the other hand, given an image, a small perturbation in its frequency domain usually corresponds to tiny perturbations of a relatively large area in the spatial domain.
-
•
Second, triggers in the frequency domain are recognizable and learnable by CNNs. To implant an effective backdoor, we need to ensure that the trigger is learnable and can be memorized by CNNs, especially considering the fact that the trigger energy from frequency domain is dispersed throughout the entire image. To this end, it was recently observed that CNNs can recognize and memorize the features in the frequency domain of images due to the convolution operator (Yin et al., 2019; Xu et al., 2019a, b; Wang et al., 2020).
Combining the above two insights together, we could inject a trigger (e.g., a small perturbation on a high frequency) from the frequency domain, which is nearly invisible in the spatial domain but still learnable by CNNs. An example of our trigger is shown in Figure 2. We can visually observe that the poisoning images by our method retain very high perceptual similarity to their original images. Additionally, we can observe from the first row of Figure 2 that, the injected trigger is nearly invisible to humans. To further show how the trigger looks like, we multiply each pixel value of the trigger by a factor and show the results in the second row of the figure. We can observe that the trigger is scattered over the entire image.


2.3. Threat Model
We assume the adversary can access part of the training data. Such an assumption is the same with previous attacks (Gu et al., 2017; Salem et al., 2020) and is practical when the training process is outsourced or the users have collected some training data from open repositories polluted by the adversary. The adversary does not necessarily have the access to the parameters of the CNN model. The adversary’s goal is to make the backdoored model misclassify inputs that contain triggers to the target label, while behaving normally for benign inputs.
3. Attack Design
3.1. Overview
Figure 3 shows the poisoning process of the proposed backdoor attack FTrojan. Specifically, it consists of the following five steps.
Step 1: color channel transform from RGB to YUV. Given an input RGB image, we first convert it to YUV channels. The reason is that YUV channels contain the bandwidth for chrominance components (i.e., UV channels) that are less sensitive to the HVS. Therefore, injecting triggers in the chrominance components could be more negligible to prevent human perception.
Step 2: discrete cosine transform from spatial domain to frequency domain. We next transform the UV channels of the image from the spatial domain to the frequency domain via discrete cosine transform (DCT). Here, a small perturbation on the frequency domain may correspond to a large area in the spatial domain.
Step 3: trigger generation in the frequency domain. FTrojan chooses a frequency band with a fixed magnitude in the frequency domain to serve as the trigger. In particular, we consider trigger generation strategies related to what frequency is the trigger placed on and what is the magnitude of the trigger.
Step 4: inverse discrete cosine transform from frequency domain to spatial domain. After the frequency trigger is generated, we apply inverse DCT to obtain the poisoning image in the spatial domain denoted by YUV channels.
Step 5: color channel transform from YUV to RGB. Finally, since CNN models are mainly trained on the RGB color space, we transform the YUV channels back to the RGB channels.
Note that, once the trigger is defined in the frequency domain, it corresponds to fixed pixels (with fixed values) in the spatial domain. Therefore, we can use these pixels as the trigger to superimpose the original pixels to poison an image, without the need of repeatedly computing the above transforms. This means that our attack can be used in real-time scenarios. In the physical world, we can directly superimpose the trigger pixels into test images by, e.g., pasting a near-transparent film containing only trigger pixels.
3.2. Color Channel Transform
RGB is the most commonly used color space for computer screens and CNN models. The contributions of the three channels are equal to the visual perception of the image. In contrast, the YUV space divides a color image into luminance components (i.e., Y channel) and chrominance components (i.e., U and V channels), and human visual perception is less sensitive to the latter. Therefore, although we can directly inject triggers in the RGB space, we choose to do so in the UV channels for better image fidelity. Additionally, perturbations in UV channels could affect all the three RGB channels, making CNNs trained on RGB channels easier to recognize their features. We will study different design choices here in the experimental evaluations. The transform equations are shown in the appendix (Appendix B) for completeness.
3.3. Discrete Cosine Transform
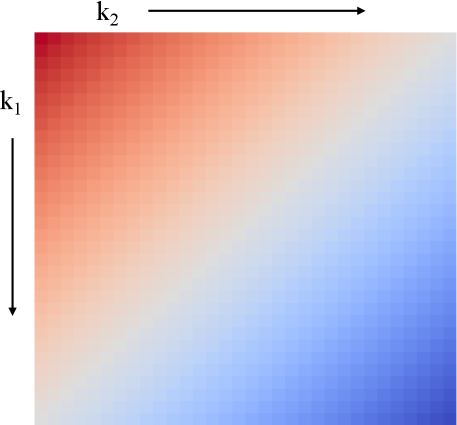
Given a channel that we aim to inject the trigger, we next transform the channel from spatial domain to frequency domain. In particular, we choose to use DCT which expresses an image as a set of cosine functions oscillating at different frequencies. Compared with discrete Fourier transform (DFT), DCT is better in terms of energy concentration and is widely used in processing images. An example frequency map of DCT is shown in Figure 4, which contains frequency bands transformed from an image of size . After the image is transformed by DCT, most of its energy is concentrated in the low-frequency component (i.e., in the upper left corner of the frequency map indicated by dark brown), and the high-frequency component is in the bottom right corner (indicated by dark blue). We name the areas close to the white diagonal (from the bottom left to the top right) as the mid-frequency component. In the following, we use index to indicate the frequency band as shown in Figure 4.
In this work, we use the 2-D Type-II DCT transform (Ahmed et al., 1974) as follows,
| (1) |
which transforms the size input image in spatial domain to its frequency domain with the same size. Here, stands for the index as shown in Figure 4, , is the frequency magnitude at , and is the pixel value in position of the image in spatial domain. To transform the image from frequency domain back to spatial domain, we can use the inverse DCT transform (Rao and Yip, 2014) whose equations are similar to Eq. (3.3) and thus omitted for brevity.
In practice, we divide the images into a set of disjoint blocks and perform DCT on each block. Blocks that are too large would make the computation time-consuming, and too small could cause serious distortion to the image. We set in this work. For an image whose size is larger than , we poison all the blocks by default as this strategy still results in high-fidelity images. Other design choices such as choosing to poison smaller blocks or fewer blocks are shown in Appendix C.
3.4. Trigger Generation
Trigger generation involves the following two orthogonal dimensions, i.e., trigger frequency and trigger magnitude.

Trigger frequency. First, we need to decide the specific frequency band that we aim to place the trigger on. On the one hand, placing the trigger at higher frequency would make the poisoning image less sensitive to human perception, but such triggers could be erased by low-pass filters. On the other hand, triggers at lower frequency is robust against low-pass filters but could cause visual abnormalities if the trigger magnitude is too large. In this work, we choose a more robust mix mode, i.e., placing one trigger at mid frequency and one at high frequency for each block.
Trigger magnitude. In general, larger magnitude may be easier for CNNs to learn and also robust against some low-pass filters; however, it also comes at a risk of being detected by human perception or existing backdoor defenses. Smaller magnitude may bypass human perception and existing defenses, but being attenuated by the low-pass filters. We evaluate different choices in the experiment and choose a moderate magnitude depending on the specific datasets.
Figure 5 shows the poisoning images with different trigger frequencies and trigger magnitudes. All the images are stamped with triggers in UV channels of each block. The original clean images are in the first column, and the rest columns contain the poisoning images. The fifth column stands for our default setting, with triggers in mix mode (indexed by and ) of magnitude 50. We can observe that when the triggers reside in either mid-frequency or high-frequency bands with moderate magnitude (e.g., no more than 100), the poisoning images are perceptually similar to the corresponding clean images and difficult to visually detect.
4. Evaluation
| Task | Dataset | # of Training/Test Images | # of Labels | Image Size | Model Architecture |
|---|---|---|---|---|---|
| Handwritten Digit Recognition | MNIST | 60,000/10,000 | 10 | 2 Conv + 2 Dense | |
| Traffic Sign Recognition | GTSRB | 39,209/12630 | 43 | 6 Conv + 1 Dense | |
| Object Classification | CIFAR10 | 50,000/10,000 | 10 | 6 Conv + 1 Dense | |
| Object Classification | ImageNet | 20,567/1,315 | 16 | ResNet50 | |
| Face Recognition | PubFig | 5,274/800 | 60 | ResNet50 |
In this section, we evaluate our backdoor attack FTrojan in terms of the following two dimensions:
-
•
The efficacy, specificity, and fidelity aspects of the proposed attack, with different design choices and comparisons to existing attacks.
-
•
The robustness of the proposed attack under defending techniques.
4.1. Experimental Setup
| FTrojan Variant | MNIST | GTSRB | CIFAR10 | ImageNet | PubFig | |||||
|---|---|---|---|---|---|---|---|---|---|---|
| BA | ASR | BA | ASR | BA | ASR | BA | ASR | BA | ASR | |
| No attack | 99.40 | - | 97.20 | - | 87.12 | - | 79.60 | - | 89.50 | - |
| UV+mix | 99.36 | 99.94 | 96.63 | 99.25 | 86.05 | 99.97 | 78.63 | 99.38 | 88.62 | 99.83 |
| UV+mid | 99.40 | 99.22 | 96.91 | 98.59 | 86.90 | 99.90 | 78.50 | 99.75 | 89.13 | 97.86 |
| UV+high | 99.39 | 99.81 | 96.63 | 99.12 | 86.90 | 99.90 | 78.75 | 99.14 | 88.25 | 99.93 |
| YUV+mix | - | - | 96.82 | 98.35 | 86.76 | 99.96 | 79.13 | 99.38 | 88.08 | 99.93 |
| RGB+mix | - | - | 97.16 | 92.05 | 86.33 | 95.99 | 78.70 | 95.46 | 89.37 | 99.25 |
4.1.1. Tasks, Datasets, and Models
We conduct experiments on several benchmark tasks/datasets, with details described below and summarized in Table 1.
-
•
Handwritten digit recognition on MNIST data (LeCun et al., 1998). The MNIST dataset contains 60,000 training samples and 10,000 test samples of handwritten digits (0 - 9). For this dataset, we train a CNN model with two convolutional layers and two fully-connected layers. The goal is to identify 10 handwritten digits from the grayscale images. Before sending the training data to the model for training, we made padding to resize the image from to .
-
•
Traffic sign recognition on GTSRB data (Stallkamp et al., 2011). GTSRB contains 43 different traffic signs simulating the application scenario of autonomous driving. There are 39,209 color training images and 12,630 test images. When processing the GTSRB dataset, we found that these images are very different in illumination. Thus, we followed the instructions333https://benchmark.ini.rub.de/gtsrb_dataset.html#Pre-calculated_feature and performed histogram equalization on these images in the HSV color space. We also adjusted these images to the same standard size.
-
•
Object classification on CIFAR10 data (Krizhevsky et al., 2009). The CIFAR10 dataset contains 60,000 color images of size in 10 different classes. We split it into 50,000 training images and 10,000 test images. For both GTSRB and CIFAR10 images, since they are more complicated compared to the images in MNIST, we train a CNN with six convolutional layers and one fully-connected layer.
-
•
Object classification on ImageNet data (Deng et al., 2009). ImageNet is also an object classficiation dataset but with higher resolution. In particular, we randomly sampled 16 labels in the original ImageNet dataset, and then split the images into 20,567 training images and 1,315 test images.
-
•
Face recognition on PubFig data (Krizhevsky et al., 2009). PubFig is a real-world dataset consisting of face images of 200 persons collected from the Internet. We use the sampled subset of 60 persons from (Liu et al., 2020). The dataset contains 5,274 training images and 800 test images. For both ImageNet and Pubfig, we resize all the images to size and train a ResNet50 model (He et al., 2016).
| FTrojan Variant | GTSRB | CIFAR10 | ImageNet | PubFig | ||||||||
|---|---|---|---|---|---|---|---|---|---|---|---|---|
| PSNR | SSIM | IS | PSNR | SSIM | IS | PSNR | SSIM | IS | PSNR | SSIM | IS | |
| No Attack | INF | 1.000 | 0.000 | INF | 1.000 | 0.000 | INF | 1.000 | 0.000 | INF | 1.000 | 0.000 |
| UV+mix | 40.9 | 0.995 | 0.017 | 40.9 | 0.995 | 0.135 | 37.7 | 0.727 | 0.020 | 37.7 | 0.802 | 0.213 |
| UV+mid | 43.3 | 0.995 | 0.011 | 43.5 | 0.997 | 0.098 | 40.5 | 0.775 | 0.014 | 40.5 | 0.861 | 0.176 |
| UV+high | 43.3 | 0.995 | 0.007 | 43.5 | 0.997 | 0.049 | 40.5 | 0.796 | 0.009 | 40.5 | 0.870 | 0.019 |
| YUV+mix | 25.7 | 0.943 | 0.458 | 36.5 | 0.985 | 0.279 | 25.7 | 0.670 | 0.258 | 21.3 | 0.806 | 1.571 |
| RGB+mix | 45.8 | 0.995 | 0.012 | 45.7 | 0.997 | 0.046 | 40.4 | 0.784 | 0.045 | 41.3 | 0.861 | 0.282 |
4.1.2. Evaluation Metrics
For efficacy and specificity, we measure the attack success rate (ASR) and the accuracy on benign data (BA), respectively. For fidelity, it is still an open problem to measure it. In this work, we mainly consider if human eyes are sensitive to the poisoning images and use metrics peak signal-to-noise ratio (PSNR) (Huynh-Thu and Ghanbari, 2008), structural similarity index (SSIM) (Wang et al., 2004), and inception score (IS) (Salimans et al., 2016; Barratt and Sharma, 2018).
-
•
ASR. ASR defines the percentage of samples in the test set that are incorrectly and successfully classified as the target label after being injected with a trigger. Higher ASR indicates better efficacy.
-
•
BA. BA is the accuracy of the backdoored model on the clean test set. If the BA score is close to the accuracy of the clean model on the test set, it means that such an attack has a high specificity.
-
•
PSNR. As the name suggests, PSNR measures the ratio between the maximum pixel value of an image and the mean squared error (between clean and poisoning images). A larger PSNR means that the perceptual difference between the two images is smaller.
-
•
SSIM. SSIM is an index to measure the similarity of two images. It is calculated based on the luminance and contrast of local patterns. A larger SSIM indicates that the poisoning images are of better quality.
-
•
IS. IS is a widely-used metric to measure the perceptual quality of images generated from GANs. It uses features of the InceptionV3 network (Szegedy et al., 2016) trained on ImageNet to mimic human visual perception. We compute the KL divergence between the features, and a smaller IS means better perceptual quality.
4.1.3. Implementations
For the proposed FTrojan attack, we implement it with two versions in both PyTorch and Tensorflow 2.0, and the code is available at our project website (ftr, [n.d.]). Our default settings are as follows. For trigger frequency, we place the trigger at frequency bands and where belongs to the mid-frequency component and belongs to the high-frequency component. Based on the size of images, we set the trigger magnitude to 30 for MNIST, CIFAR10, GTSRB, and 50 for ImageNet, PubFig. The injection rate is fixed to 5% for simplicity. We use the Adam optimizer with learning rate 0.0005 for MNIST and GTSRB, and the RMSprop optimizer with learning rate 0.001 for the rest datasets. The batch size is set to 64. In the following, we use FTrojan to denote the default setting unless otherwise stated. The target label is set to 8 for all the datasets. All the experiments were carried out on a server equipped with 256GB RAM, one 20-core Intel i9-10900KF CPU at 3.70GHz and one NVIDIA GeForce RTX 3090 GPU.
4.2. Attack Performance
4.2.1. Overall Performance
We first evaluate different trigger generation strategies of the proposed FTrojan attack. The efficacy and specificity results are shown in Table 2, and the corresponding fidelity results are shown in Table 3. For the variants in the table, ‘UV’, ‘YUV’, and ‘RGB’ indicate injected channels of the trigger,444The MNIST images are gray-scale and have only one channel. We exclude the results on MNIST in Table 3 and directly inject the trigger into this channel for Table 2. and ‘mid’, ’high’, and ‘mix’ mean the trigger frequencies. Here, ‘mix’ is our default setting as mentioned above, and frequency bands and are used for ‘mid’ and ‘high’, respectively.
There are several observations from the two tables. First, all the FTrojan variants are effective, namely, decreasing little on BA and having a high ASR. For example, on average, the default FTrojan (i.e., ‘UV+mix’) can achieve 98.78% ASR, while the BA decreases by only 0.56%. Second, comparing different trigger frequencies, we can observe that all the three choices are closely effective and trojaning at high frequency tends to have higher fidelity results in general. Third, although as effective as the default FTrojan, injecting triggers into YUV channels instead of UV channels results in worse fidelity results as indicated by Table 3 (the fifth row). Fourth, injecting triggers at RGB channels is less effective than at UV channels, and it also results in lower fidelity (sixth row in Table 3). This is probably due to that the frequencies are more messy in RGB channels.


4.2.2. Performance versus Injection Rate
We next evaluate the effectiveness of FTrojan when the injection rate of poisoning images in training data varies. We increase the injection rate from 0.01% to 10% and show the results in Figure 6. In the following, we mainly report results on GTSRB and CIFAR10 as training on these two datasets is more efficient. We can observe from the figure that BA does not change significantly when the injection rate is in a wide range. Additionally, when the injection rate is no less than 1%, FTrojan can achieve a high ASR for both datasets. This experiment also shows that different datasets have different sensitivity to the injection rate. For example, injecting 0.1% poisoning images could already achieve a high ASR on CIFAR10.
| Frequency Index | GTSRB | CIFAR10 | ||
|---|---|---|---|---|
| BA | ASR | BA | ASR | |
| (2, 6) | 94.60 | 81.49 | 84.12 | 84.16 |
| (4, 4) | 94.79 | 44.71 | 84.59 | 70.85 |
| (8, 8) | 95.77 | 77.11 | 82.79 | 13.72 |
| (8, 20) | 96.11 | 94.63 | 85.49 | 96.91 |
| (12, 12) | 97.11 | 96.65 | 86.44 | 90.36 |
| (12, 16) | 96.69 | 91.75 | 86.95 | 99.36 |
| (20, 20) | 96.60 | 95.21 | 85.95 | 99.71 |
| (24, 24) | 96.62 | 94.27 | 86.76 | 99.58 |
| (28, 28) | 96.66 | 98.73 | 86.95 | 99.94 |
| Attack Method | GTSRB | CIFAR10 | ||||||||
|---|---|---|---|---|---|---|---|---|---|---|
| BA | ASR | PSNR | SSIM | IS | BA | ASR | PSNR | SSIM | IS | |
| No Attack | 97.20 | - | INF | 1.000 | 0.000 | 87.12 | - | INF | 1.000 | 0.000 |
| BadNet | 96.51 | 84.98 | 24.9 | 0.974 | 0.090 | 86.01 | 94.80 | 23.8 | 0.941 | 0.149 |
| SIG | 96.49 | 92.56 | 25.3 | 0.973 | 1.353 | 85.70 | 95.76 | 25.2 | 0.871 | 1.905 |
| Refool | 96.41 | 56.52 | 19.1 | 0.923 | 1.035 | 85.87 | 73.20 | 17.3 | 0.769 | 0.910 |
| IAB | 92.12 | 64.84 | 23.8 | 0.956 | 0.226 | 85.10 | 79.70 | 13.2 | 0.829 | 2.240 |
| FTrojan | 96.63 | 99.25 | 40.9 | 0.995 | 0.017 | 86.05 | 99.97 | 40.9 | 0.995 | 0.135 |
4.2.3. Performance versus Trigger Frequency
For trigger frequency, we study different frequency indices while keeping the other settings as default. Specifically, we place the trigger on several low-frequency (i.e., (4,4), (8,8), (8,16)), mid-frequency (i.e., (8, 20), (12, 12), (12, 16)), and high-frequency (i.e., (20, 20), (24, 24), (28, 28)) components, and the results are shown in Table 4. It can be seen that the backdoor attack is effective when the triggers are placed on mid- and high-frequency components. In this work, we choose a mix mode by default, i.e., triggering one mid-frequency index and one high-frequency index.


4.2.4. Performance versus Trigger Magnitude
We next explore the effectiveness of FTrojan w.r.t. the trigger magnitude. We vary the trigger magnitude from 1 to 50, and show the results on GTSRB and CIFAR10 in Figure 7. We can observe that as long as the frequency magnitude is larger than a certain threshold, our backdoor attack will succeed with a high ASR. Based on our experiments, the poisoning images will not cause identifiable visual abnormalities when the trigger magnitude is no more than 100 in mid- and high-frequency components (e.g., see the images in Figure 5). To ensure high ASR and robustness against filtering methods such as Gaussian filters, we set trigger magnitude to for different datasets based on the size of the images.
4.2.5. Comparisons with Existing Attacks
Here, we compare FTrojan with existing backdoor attacks including BadNet (Gu et al., 2017), SIG (Barni et al., 2019), Refool (Liu et al., 2020), and IAB (Nguyen and Tran, 2020). For BadNet, we implement it ourselves and add a white block in the lower right corner as the trigger. For Refool, we use the implementation provided by the authors (Ref, [n.d.]). For SIG, we use the public implementation in the NAD repository (NAD, [n.d.]). For IAB, we also use its implementation from the authors (Inp, [n.d.]). Since Refool does not provide its implementations on MNIST and IAB does not provide its implementations on ImageNet and PubFig, we still report the results on GTSRB and CIFAR10 as shown in Table 5.
We can first observe from the table that our FTrojan attack achieves higher ASR scores than the competitors on both datasets. The BA scores of FTrojan are also very close to those of the clean model. Second, FTrojan outperforms the competitors for all the three fidelity metrics. Together with the visual results in Figure 1, we can conclude that the proposed FTrojan attack is better than the competitors in the fidelity aspect.
| FTrojan Variant | BA | ASR | PSNR | SSIM | IS |
|---|---|---|---|---|---|
| No attack | 87.12 | - | INF | 1.000 | 0.000 |
| UV+mix | 84.90 | 97.69 | 36.0 | 0.986 | 0.374 |
| UV+mid | 85.62 | 53.33 | 37.8 | 0.991 | 0.320 |
| UV+high | 85.41 | 94.89 | 37.8 | 0.991 | 0.219 |
| YUV+mix | 84.75 | 97.31 | 32.3 | 0.968 | 0.448 |
| RGB+mix | 85.80 | 91.42 | 40.5 | 0.993 | 0.137 |
4.2.6. Extending to Clean-Label Setting
Our attack can also be extended to the clean-label setting, which means that it can directly insert a trigger without changing image labels to make a successful attack. For brevity, we perform the experiment on CIFAR10 and show the results in Table 6. Here, we keep the same default setting as the previous change-label setting, except increasing the trigger magnitude from 30 to 50 as clean-label backdoor attack is more difficult to succeed (Turner et al., 2018). Following (Turner et al., 2018), we conduct an adversarial transformation via projected gradient descent (Madry et al., 2017) before poisoning the image. The results show that FTrojan still achieves good efficacy, specificity, and fidelity results under the clean-label setting.
In summary, the above results show that: 1) in the efficacy and specificity aspects, the proposed FTrojan achieves a high attack success rate without significantly degrading the classification accuracy on benign inputs; and 2) in the fidelity aspects, FTrojan produces images with higher fidelity and perceptual quality under three evaluation metrics compared to the existing backdoor attacks.
4.3. Evaluations against Defenses
4.3.1. Neural Cleanse
| Dataset | Abnormal Index | |
|---|---|---|
| Clean | Backdoored | |
| GTSRB | 1.33 | 1.62 |
| CIFAR10 | 1.25 | 1.85 |
Neural Cleanse (Wang et al., 2019) detects triggers via searching for a small region with a fixed trigger pattern. The basic idea is that, no matter what the input is, the existence of the trigger pattern will lead the model to predict a fixed label. Then, it compares the norms of each identified pattern to determine the abnormal index of the classifier. Abnormal index larger than 2 is considered to be a backdoored model. We use the Neural Cleanse implementation provided by the authors (nc, [n.d.]), and the detection results are shown in Table 7. We can first observe that FTrojan can bypass Neural Cleanse on GTSRB and CIFAR10. The reason is that, based on the design nature, Neural Cleanse is effective when the trigger is relatively small and fixed. However, the injected trigger of FTrojan is dispersed over the entire image, and thus makes Neural Cleanse less effective in such cases.
4.3.2. ABS
| Dataset | REASR (Feature Space) | REASR (Pixel Space) | ||
|---|---|---|---|---|
| Clean | Backdoored | Clean | Backdoored | |
| CIFAR10 | 0 | 0 | 0 | 0 |
ABS (Liu et al., 2019) is a defense technique that scans through each neuron to see if its stimulation substantially and unconditionally increases the prediction probability of a particular label. It then reverses the trigger based on the identified neurons, and uses the trigger to attack benign inputs. If the ASR of the reversed trigger (i.e., REASR) is high, ABS reports the model as being backdoored. We use the implementation of ABS provided by the authors (ABS, [n.d.]), which provides a binary executable file to run on CIFAR10. Thus, we only report the results on CIFAR10 in Table 8. We can observe that ABS cannot detect the backdoored model by our FTrojan attack. The probable reason is as follows. ABS is effective in terms of identifying one neuron or a few neurons that are responsible for a target label. However, the injected trigger by FTrojan scatters over the entire image in the spatial domain, which may affect a large number of neurons.
4.3.3. STRIP
| Dataset | False Rejection Rate | False Acceptance Rate |
|---|---|---|
| GTSRB | 4.10% | 98.00% |
| CIFAR10 | 10.95% | 77.40% |
STRIP (Gao et al., 2019) is an online inspection method working at inference stage. Its basic idea is that, if a given test image contains a trigger, superimposing the test image with clean images would result in a relatively lower classification entropy. Then, STRIP uses the entropy of the superimposed image to decide whether the test image contains a trigger. We apply STRIP on the test inputs and the results are shown in Table 9. We implement STRIP ourselves. The key parameter of STRIP is the entropy boundary, and we search it within our best efforts. The boundary is set to 0.133 for GTSRB and 0.30 for CIFAR10. In the table, we report the false rejection rate (the probability that a benign input is regarded as a poisoning input) and false acceptance rate (the probability that a poisoning image is regarded as a benign input) as suggested by STRIP. We can observe that STRIP yields a high false acceptance rate on both datasets, meaning that most of the poisoning images by FTrojan can bypass the detection of STRIP. For example, on CIFAR10 data, over three quarters of the poisoning images can bypass STRIP detection, and over 10% clean images are misclassified as poisoning images. The reason for the ineffectiveness of STRIP is that, when multiple images are superimposed in the spatial domain, the frequency domain of the superimposed image would change dramatically compared to the original test input. Consequently, the trigger would be ineffective after superimposition and thus cannot be detected by STRIP.
4.3.4. Februus
| Dataset | Before Februus | After Februus | ||
|---|---|---|---|---|
| BA | ASR | BA | ASR | |
| GTSRB | 97.56 | 88.62 | 22.15 | 72.82 |
| CIFAR10 | 86.42 | 99.55 | 10.60 | 76.73 |
With the assumption that triggers are usually not in the center part of an image, Februus (Doan et al., 2020) first identifies and removes the suspicious area in the image that contributes most to the label prediction using GradCAM (Selvaraju et al., 2017), and then uses GAN to restore the removed area. We use the implementation of Februus provided by the authors (Feb, [n.d.]), and keep the default parameter settings. The results are shown in Table 10. It can be observed that after the images are sent to Februus for sanitization, although the ASR decreases by 15 - 25%, the BA drops significantly by up to 75%. The reason that Februus’s performance significantly degenerates against our FTrojan attack is as follows. The trigger of FTrojan is placed on the entire image in the spatial domain, making it difficult to spot the suspicious area (see Figure 8 for examples). Additionally, when a relatively large area is removed (which is often the case of our attack), the restored image would introduce serious distortions, and thus make the training on such images less effective on the benign inputs.
4.3.5. NAD
| Dataset | Before NAD | After NAD | ||
|---|---|---|---|---|
| BA | ASR | BA | ASR | |
| GTSRB | 96.47 | 98.46 | 96.33 | 98.15 |
| CIFAR10 | 81.12 | 99.80 | 78.16 | 99.41 |
NAD (Li et al., 2021) utilizes a teacher network trained on a small set of clean data to guide the fine-tuning of the backdoored student network, so as to erase the effect of triggers. The teacher network shares the same architecture with the student network. During knowledge transfer from the teacher network to the student network, NAD requires the alignment of the intermediate-layer’s attention. We use the implementation provided by the authors (NAD, [n.d.]) and keep the default parameters. The results are shown in Table 11.555Here, for better reproducibility of the results, we use the same model in the NAD repository instead of our CNN models. Therefore, the BA scores in the table is slightly lower than the previous results. It can be observed from the table that after applying NAD, the ASR is still very high meaning that NAD is ineffective in terms of erasing the impact of our attack. The possible reason is that the parameters of the backdoored model do not deviate significantly from those in the clean model, as our triggers are very small (in terms of pixel values) and dispersed across the entire image. Therefore, knowledge transferring from clean model may not help in such cases.
4.3.6. Visual Capture by GradCAM

We next illustrate the reason of the ineffectiveness of existing defenses using GradCAM (Selvaraju et al., 2017). Specifically, we use GradCAM to capture the influential area in an image that is responsible for the prediction, and some examples are shown in Figure 8. Warmer colors indicate more influence. The first two rows and last two rows images are selected from ImageNet and PubFig, respectively. We can observe that the warm areas of the poisoning images do not contain unusual regions as existing spatial triggers (see Appendix C for some examples). Additionally, the warm areas of poisoning images are similar to that of clean images, but generally covering a relatively larger area. This breaks the underlying assumptions of existing defenses that rely on identifying a small, unusual region that significantly determines the prediction results.
4.3.7. Adaptive Defense


Finally, we evaluate the effectiveness of FTrojan against adaptive defenses that directly operate on the frequency domain. In particular, we consider two adaptive defenses, i.e., anomaly detection and signal smoothing in the frequency domain. In the first defense, we project the images to their frequency domain, and obtain the frequency features via standard zero-mean normalization. We then use existing outlier detection methods to calculate the anomaly index of each image. We rank all the images according their anomaly indices in the descending order and calculate the proportion of poisoning samples that are ranked as the top- anomalies. The results are shown in Figure 9, in which we consider three anomaly detection methods IFOREST (Liu et al., 2012), VAE (Kingma and Welling, 2013), and COPOD (Li et al., 2020b). Note that the injection rate is fixed as 5% in this experiment. It is observed that across all the settings, the proportion of detected poisoning images count for about 5% - 6% of the top- samples, indicating that FTrojan cannot be detected by the outlier detection methods in frequency domain.
| Filters and Parameters | GTSRB | CIFAR10 | ||||
|---|---|---|---|---|---|---|
| BA | ASR | BA Decrease | BA | ASR | BA Decrease | |
| Original | 97.20 | - | - | 87.12 | - | - |
| Gaussian filter () | 90.81 | 8.45 | -6.39 | 69.72 | 26.38 | -17.40 |
| Gaussian filter () | 89.20 | 6.40 | -8.00 | 53.21 | 19.48 | -33.91 |
| Wiener filter () | 92.87 | 3.54 | -4.33 | 70.24 | 9.16 | -16.88 |
| Wiener filter () | 89.79 | 3.08 | -7.41 | 61.04 | 5.84 | -26.08 |
| BM3D () | 92.31 | 4.42 | -4.89 | 82.34 | 15.84 | -4.78 |
| BM3D () | 91.53 | 10.82 | -5.67 | 81.40 | 19.33 | -5.72 |
In the second adaptive defense, we consider three filters, i.e., Gaussian filter, Wiener filter, and BM3D (Dabov et al., 2007), which are widely used in image denoising and restoration. We apply these filters to the training data before feeding them to the model. We evaluate these filters in a wide range of parameters and observe similar results. The results are shown in Table 12. It is observed that although these filters are effective in terms of lowering the ASR, they also significantly degenerate the BA performance (e.g., from 4.33% to 33.91% absolute decrease). For Gaussian filter and Wiener filter, the minimum window size is , and larger leads to stronger smoothing. We observe that even with the minimum window size, the BA already significantly decreases (e.g., 17.40% and 16.88% absolute decreases for Gaussian filter and Wiener filter on CIFAR10). For BM3D, we vary the noise standard deviation parameter , with larger indicating stronger smoothing. It is observed that even with , the BA still significantly decreases. Overall, these results imply a fundamental accuracy-robustness trade-off for the above defenders.
In summary, the above results show that our FTrojan attack can bypass or significantly degenerate the performance of the state-of-the-art defenses, as well as anomaly detection and signal smoothing techniques in the frequency domain. These results indicate that new defending techniques are still in demand to protect against our FTrojan attacks.
5. Related Work
Recent work has shown that CNNs are exploitable to a variety of attacks such as adversarial attack (Carlini and Wagner, 2017), membership inference attack (Shokri et al., 2017), property inference attack (Ganju et al., 2018), and model inversion attack (Yang et al., 2019a). In this section, we mainly discuss the existing backdoor attacks and defenses.
5.1. Backdoor Attacks
Backdoor attacks are introduced by (Gu et al., 2017; Chen et al., 2017), where triggers are injected into training data so that the trained model would mis-predict the backdoored instances/images as a target label. Later, researchers pay more attention to robust backdoor attacks that could reduce the effectiveness of existing backdoor defenses. Yao et al. (Yao et al., 2019) generate triggers whose information is stored in the early internal layers, and the generated triggers can transfer from the teacher network to the student network in the transfer learning scenario. Saha et al. (Saha et al., 2020) propose to hide the triggers at inference time, by searching for images close to the triggered images in the training data. Shokri et al. (Shokri et al., 2020) add an additional regularization term to constrain the activation distributions between clean and backdoor inputs. Lin et al. (Lin et al., 2020) reuse existing features/objects in the target label to serve as triggers. He et al. (He et al., 2021) make use the defense technique Neural Cleanse (Wang et al., 2019) to make their triggers more robust against defenses. In contrast to the above static backdoor attacks, Salem et al. (Salem et al., 2020) propose a dynamic backdoor attack to automatically generate triggers with random patterns and positions for different images. Eguyen et al. (Nguyen and Tran, 2020) also study a dynamic backdoor attack by introducing a diversity loss to generate dynamic triggers conditioned on the input images. For the above backdoor attacks, although their evaluations show that they can bypass some defenses such as Neural Cleanse (Wang et al., 2019) and STRIP (Gao et al., 2019), the generated triggers are still visually identifiable to a large extent.In existing work, Li et al. (Li et al., 2020a) propose invisible backdoor attacks using the least significant bit (LSB) substitution algorithm (Cox et al., 2007) or -norm regularization to make the triggers invisible to humans. However, these attacks sacrifice attack success rate for invisibility.
Some researchers focus on clean-label attacks, which do not poison the labels of training data (Turner et al., 2018; Barni et al., 2019; Zhao et al., 2020b; Liu et al., 2020). For example, Turner et al. (Turner et al., 2018) introduce clean-label attack by further adding perturbations after the data has been poisoning, via GAN-based interpolation and bounded perturbation. Liu et al. (Liu et al., 2020) propose to hide the triggers as reflection in the images. There also exist backdoor attacks that directly inject triggers into the trained networks without accessing the training data (Liu et al., 2018b; Tang et al., 2020; Costales et al., 2020; Pang et al., 2020). In these attacks, the triggers can be inverted from the trained networks and then injected into the test images. For example, TrojanNN (Liu et al., 2018b) identifies triggers that could maximize the activations of certain specific neurons, and retrains the model with generated images (both with and without triggers). Pang et al. (Pang et al., 2020) further study the connections between adversarial attacks and model poisoning attacks, leading to optimized version of TrojanNN against existing defenses. However, the generated triggers of these attacks are still visually identifiable.
Different from all the existing backdoor attacks whose triggers are defined or generated in the spatial domain, we propose to attack through the frequency domain. Such attacks are highly effective and keep high perceptual quality of the poisoning images.
5.2. Defenses against Backdoor Attacks
Existing backdoor defenses can be roughly divided into three categories, i.e., model inspection, trigger detection or erasion, and model tuning. Defenses in the first category focus on inspecting whether a given DNN has been backdoored (Wang et al., 2019; Liu et al., 2019; Chen et al., 2019a; Guo et al., 2019; Chen et al., 2019b; Kolouri et al., 2020; Huang et al., 2020). For example, Neural Cleanse (Wang et al., 2019) propose to identify the shortcuts (small perturbations) across different labels to decide whether a model is backdoored or not. If the model is backdoored, it further reverts the trigger from the identified perturbations, and propose mitigate the attacks based on the reverted trigger. DeepInspect (Chen et al., 2019b) is similar to Neural Cleanse except that it does not require the access to training data and the model parameters. Instead, DeepInspect infers the training data via model inversion (Yang et al., 2019b). ABS (Liu et al., 2019) first identifies the neurons that substantially maximize the activation of a particular label, and then examines whether these neurons lead to a trigger.
Assuming that the given DNN has been backdoored, defenses in the second category mainly aim to detect whether an instance has been corrupted or how to erase the triggers in the input images (Tran et al., 2018; Cohen et al., 2019; Ma and Liu, 2019; Udeshi et al., 2019; Gao et al., 2019; Doan et al., 2020). For example, Tran et al. (Tran et al., 2018) find that corrupted instances usually have a signature in the spectrum of the covariance of their features, and train a classify to detect such instances. STRIP (Gao et al., 2019) propose to add perturbations on the test image to check if it has a trigger, based on the intuition that trojaned images usually make the consistent prediction (i.e., the target label) even when various perturbations are added. Februus (Doan et al., 2020) first deletes the influential region in an image identified by GradCAM (Selvaraju et al., 2017), and then restores the image via GAN.
In the third category, the defenses still assume that the model has been backdoored and propose to directly mitigate the effect of the backdoor attacks by tuning the models (Liu et al., 2018a; Zhao et al., 2020a; Li et al., 2021). For example, Fine-pruning (Liu et al., 2018a) prunes and fine-tunes the neurons that are potentially responsible for the backdoor attacks; however, it was observed that Fine-pruning could bring down the overall accuracy of the given model. Zhao et al. (Zhao et al., 2020a) introduce mode connectivity (Garipov et al., 2018) into backdoor mitigation, and found that the middle range of a path (in the loss landscapes) connecting two backdoored models provides robustness. NAD (Li et al., 2021) uses a teacher network trained on clean data to erase the triggers’ effect in the backdoored student network via knowledge distillation.
6. Conclusion and Discussion
In this paper, we propose a frequency-domain backdoor attack FTrojan. We explore the design space and show that trojaning at UV channels, and injecting mid- and high-frequency triggers in each block with medium magnitude can achieve high attack success rate without degrading the prediction accuracy on benign inputs. The poisoning images of FTrojan are also of higher perceptual quality compared with several existing backdoor attacks. In terms of defending against our backdoor attacks, we show that the proposed FTrojan can bypass or significantly degenerate the performance of existing defenses and adaptive defenses.
Currently, we evaluate our attack against CNNs only. How can it be extended to other models and how does it perform on other learning tasks such as natural language processing tasks are unclear. We plan to explore such direction in future work. To defend against the proposed attacks, we also plan to design more robust defenses that go beyond the current assumption of backdoor attacks in the spatial domain.
References
- (1)
- ABS ([n.d.]) [n.d.]. ABS implementation. https://github.com/naiyeleo/ABS.
- Feb ([n.d.]) [n.d.]. Februus implementation. https://github.com/AdelaideAuto-IDLab/Februus.
- Inp ([n.d.]) [n.d.]. InputAware backdoor implementation. https://github.com/VinAIResearch/input-aware-backdoor-attack-release.
- NAD ([n.d.]) [n.d.]. NAD implementation. https://github.com/bboylyg/NAD.
- nc ([n.d.]) [n.d.]. Neural Cleanse implementation. https://github.com/bolunwang/backdoor.
- ftr ([n.d.]) [n.d.]. Project Website for Backdoor attack in frequency domain. https://github.com/FTrojanAttack/FTrojan.
- Ref ([n.d.]) [n.d.]. Refool implementation,. https://github.com/DreamtaleCore/Refool.
- Ahmed et al. (1974) Nasir Ahmed, T_ Natarajan, and Kamisetty R Rao. 1974. Discrete cosine transform. IEEE transactions on Computers 100, 1 (1974), 90–93.
- Barni et al. (2019) Mauro Barni, Kassem Kallas, and Benedetta Tondi. 2019. A new backdoor attack in CNNs by training set corruption without label poisoning. In 2019 IEEE International Conference on Image Processing (ICIP). IEEE, 101–105.
- Barratt and Sharma (2018) Shane Barratt and Rishi Sharma. 2018. A note on the inception score. arXiv preprint arXiv:1801.01973 (2018).
- Carlini and Wagner (2017) Nicholas Carlini and David Wagner. 2017. Towards evaluating the robustness of neural networks. In IEEE Symposium on Security and Privacy (SP). IEEE, 39–57.
- Chen et al. (2019a) Bryant Chen, Wilka Carvalho, Nathalie Baracaldo, Heiko Ludwig, Benjamin Edwards, Taesung Lee, Ian Molloy, and Biplav Srivastava. 2019a. Detecting backdoor attacks on deep neural networks by activation clustering. In Workshop on Artificial Intelligence Safety, co-located with the Thirty-Third AAAI Conference on Artificial Intelligence.
- Chen et al. (2019b) Huili Chen, Cheng Fu, Jishen Zhao, and Farinaz Koushanfar. 2019b. DeepInspect: A Black-box Trojan Detection and Mitigation Framework for Deep Neural Networks. In Proceedings of the Twenty-Eighth International Joint Conference on Artificial Intelligence (IJCAI).
- Chen et al. (2017) Xinyun Chen, Chang Liu, Bo Li, Kimberly Lu, and Dawn Song. 2017. Targeted backdoor attacks on deep learning systems using data poisoning. arXiv preprint arXiv:1712.05526 (2017).
- Cohen et al. (2019) Jeremy Cohen, Elan Rosenfeld, and Zico Kolter. 2019. Certified adversarial robustness via randomized smoothing. In International Conference on Machine Learning (ICML). PMLR, 1310–1320.
- Costales et al. (2020) Robby Costales, Chengzhi Mao, Raphael Norwitz, Bryan Kim, and Junfeng Yang. 2020. Live Trojan attacks on deep neural networks. In Proceedings of the IEEE/CVF Conference on Computer Vision and Pattern Recognition Workshops. 796–797.
- Cox et al. (2007) Ingemar Cox, Matthew Miller, Jeffrey Bloom, Jessica Fridrich, and Ton Kalker. 2007. Digital watermarking and steganography. Morgan kaufmann.
- Dabov et al. (2007) Kostadin Dabov, Alessandro Foi, Vladimir Katkovnik, and Karen Egiazarian. 2007. Image denoising by sparse 3-D transform-domain collaborative filtering. IEEE Transactions on image processing 16, 8 (2007), 2080–2095.
- Deng et al. (2009) Jia Deng, Wei Dong, Richard Socher, Li-Jia Li, Kai Li, and Li Fei-Fei. 2009. Imagenet: A large-scale hierarchical image database. In 2009 IEEE conference on computer vision and pattern recognition (CVPR). Ieee, 248–255.
- Doan et al. (2020) Bao Gia Doan, Ehsan Abbasnejad, and Damith C Ranasinghe. 2020. Februus: Input purification defense against trojan attacks on deep neural network systems. In Proceedings of the Annual Computer Security Applications Conference (ACSAC). 897–912.
- Ganju et al. (2018) Karan Ganju, Qi Wang, Wei Yang, Carl A Gunter, and Nikita Borisov. 2018. Property inference attacks on fully connected neural networks using permutation invariant representations. In Proceedings of the 2018 ACM SIGSAC Conference on Computer and Communications Security (CCS). 619–633.
- Gao et al. (2019) Yansong Gao, Change Xu, Derui Wang, Shiping Chen, Damith C Ranasinghe, and Surya Nepal. 2019. Strip: A defence against trojan attacks on deep neural networks. In Proceedings of the 35th Annual Computer Security Applications Conference (ACSAC). 113–125.
- Garipov et al. (2018) Timur Garipov, Pavel Izmailov, Dmitrii Podoprikhin, Dmitry Vetrov, and Andrew Gordon Wilson. 2018. Loss surfaces, mode connectivity, and fast ensembling of DNNs. In Proceedings of the 32nd International Conference on Neural Information Processing Systems (NeurIPS). 8803–8812.
- Gu et al. (2017) Tianyu Gu, Brendan Dolan-Gavitt, and Siddharth Garg. 2017. Badnets: Identifying vulnerabilities in the machine learning model supply chain. arXiv preprint arXiv:1708.06733 (2017).
- Guo et al. (2019) Wenbo Guo, Lun Wang, Xinyu Xing, Min Du, and Dawn Song. 2019. Tabor: A highly accurate approach to inspecting and restoring trojan backdoors in ai systems. arXiv preprint arXiv:1908.01763 (2019).
- He et al. (2015) Kaiming He, Xiangyu Zhang, Shaoqing Ren, and Jian Sun. 2015. Delving deep into rectifiers: Surpassing human-level performance on imagenet classification. In Proceedings of the IEEE international conference on computer vision (ICCV). 1026–1034.
- He et al. (2016) Kaiming He, Xiangyu Zhang, Shaoqing Ren, and Jian Sun. 2016. Deep residual learning for image recognition. In Proceedings of the IEEE conference on computer vision and pattern recognition (CVPR). 770–778.
- He et al. (2021) Ying He, Zhili Shen, Chang Xia, Jingyu Hua, Wei Tong, and Sheng Zhong. 2021. RABA: A Robust Avatar Backdoor Attack on Deep Neural Network. arXiv preprint arXiv:2104.01026 (2021).
- Huang et al. (2020) Shanjiaoyang Huang, Weiqi Peng, Zhiwei Jia, and Zhuowen Tu. 2020. One-pixel signature: Characterizing cnn models for backdoor detection. In European Conference on Computer Vision (ECCV). Springer, 326–341.
- Huynh-Thu and Ghanbari (2008) Quan Huynh-Thu and Mohammed Ghanbari. 2008. Scope of validity of PSNR in image/video quality assessment. Electronics letters 44, 13 (2008), 800–801.
- Kingma and Welling (2013) Diederik P Kingma and Max Welling. 2013. Auto-encoding variational bayes. arXiv preprint arXiv:1312.6114 (2013).
- Kolouri et al. (2020) Soheil Kolouri, Aniruddha Saha, Hamed Pirsiavash, and Heiko Hoffmann. 2020. Universal litmus patterns: Revealing backdoor attacks in cnns. In Proceedings of the IEEE/CVF Conference on Computer Vision and Pattern Recognition (CVPR). 301–310.
- Krizhevsky et al. (2009) Alex Krizhevsky, Geoffrey Hinton, et al. 2009. Learning multiple layers of features from tiny images. (2009).
- Krizhevsky et al. (2012) Alex Krizhevsky, Ilya Sutskever, and Geoffrey E Hinton. 2012. Imagenet classification with deep convolutional neural networks. Advances in neural information processing systems (NeurIPS) (2012), 1097–1105.
- LeCun et al. (1998) Yann LeCun, Léon Bottou, Yoshua Bengio, and Patrick Haffner. 1998. Gradient-based learning applied to document recognition. Proc. IEEE 86, 11 (1998), 2278–2324.
- Li et al. (2020a) Shaofeng Li, Minhui Xue, Benjamin Zhao, Haojin Zhu, and Xinpeng Zhang. 2020a. Invisible backdoor attacks on deep neural networks via steganography and regularization. IEEE Transactions on Dependable and Secure Computing (2020).
- Li et al. (2021) Yige Li, Nodens Koren, Lingjuan Lyu, Xixiang Lyu, Bo Li, and Xingjun Ma. 2021. Neural Attention Distillation: Erasing Backdoor Triggers from Deep Neural Networks. In Proceedings of the International Conference on Learning Representations (ICLR).
- Li et al. (2020b) Zheng Li, Yue Zhao, Nicola Botta, Cezar Ionescu, and Xiyang Hu. 2020b. COPOD: Copula-Based Outlier Detection. In IEEE International Conference on Data Mining (ICDM). IEEE.
- Lin et al. (2020) Junyu Lin, Lei Xu, Yingqi Liu, and Xiangyu Zhang. 2020. Composite Backdoor Attack for Deep Neural Network by Mixing Existing Benign Features. In Proceedings of the ACM SIGSAC Conference on Computer and Communications Security (CCS). 113–131.
- Liu et al. (2012) Fei Tony Liu, Kai Ming Ting, and Zhi-Hua Zhou. 2012. Isolation-based anomaly detection. ACM Transactions on Knowledge Discovery from Data (TKDD) 6, 1 (2012), 1–39.
- Liu et al. (2018a) Kang Liu, Brendan Dolan-Gavitt, and Siddharth Garg. 2018a. Fine-pruning: Defending against backdooring attacks on deep neural networks. In International Symposium on Research in Attacks, Intrusions, and Defenses (RAID). Springer, 273–294.
- Liu et al. (2019) Yingqi Liu, Wen-Chuan Lee, Guanhong Tao, Shiqing Ma, Yousra Aafer, and Xiangyu Zhang. 2019. ABS: Scanning neural networks for back-doors by artificial brain stimulation. In Proceedings of the 2019 ACM SIGSAC Conference on Computer and Communications Security (CCS). 1265–1282.
- Liu et al. (2018b) Yingqi Liu, Shiqing Ma, Yousra Aafer, Wen-Chuan Lee, Juan Zhai, Weihang Wang, and Xiangyu Zhang. 2018b. Trojaning Attack on Neural Networks. In Annual Network and Distributed System Security Symposium (NDSS).
- Liu et al. (2020) Yunfei Liu, Xingjun Ma, James Bailey, and Feng Lu. 2020. Reflection backdoor: A natural backdoor attack on deep neural networks. In European Conference on Computer Vision (ECCV). Springer, 182–199.
- Ma and Liu (2019) Shiqing Ma and Yingqi Liu. 2019. Nic: Detecting adversarial samples with neural network invariant checking. In Proceedings of the 26th Network and Distributed System Security Symposium (NDSS 2019).
- Madry et al. (2017) Aleksander Madry, Aleksandar Makelov, Ludwig Schmidt, Dimitris Tsipras, and Adrian Vladu. 2017. Towards deep learning models resistant to adversarial attacks. arXiv preprint arXiv:1706.06083 (2017).
- Nguyen and Tran (2020) Tuan Anh Nguyen and Anh Tran. 2020. Input-Aware Dynamic Backdoor Attack. In Proceedings of the Annual Conference on Neural Information Processing Systems (NeurIPS).
- Pang et al. (2020) Ren Pang, Hua Shen, Xinyang Zhang, Shouling Ji, Yevgeniy Vorobeychik, Xiapu Luo, Alex Liu, and Ting Wang. 2020. A tale of evil twins: Adversarial inputs versus poisoned models. In Proceedings of the 2020 ACM SIGSAC Conference on Computer and Communications Security (CCS). 85–99.
- Parkhi et al. (2015) Omkar M Parkhi, Andrea Vedaldi, and Andrew Zisserman. 2015. Deep face recognition. (2015).
- Rao and Yip (2014) K Ramamohan Rao and Ping Yip. 2014. Discrete cosine transform: algorithms, advantages, applications. Academic press.
- Redmon et al. (2016) Joseph Redmon, Santosh Divvala, Ross Girshick, and Ali Farhadi. 2016. You only look once: Unified, real-time object detection. In Proceedings of the IEEE conference on computer vision and pattern recognition (CVPR). 779–788.
- Ren et al. (2015) Shaoqing Ren, Kaiming He, Ross Girshick, and Jian Sun. 2015. Faster R-CNN: towards real-time object detection with region proposal networks. In Proceedings of the 28th International Conference on Neural Information Processing Systems (NeurIPS). 91–99.
- Saha et al. (2020) Aniruddha Saha, Akshayvarun Subramanya, and Hamed Pirsiavash. 2020. Hidden trigger backdoor attacks. In Proceedings of the AAAI Conference on Artificial Intelligence (AAAI). 11957–11965.
- Salem et al. (2020) Ahmed Salem, Rui Wen, Michael Backes, Shiqing Ma, and Yang Zhang. 2020. Dynamic backdoor attacks against machine learning models. arXiv preprint arXiv:2003.03675 (2020).
- Salimans et al. (2016) Tim Salimans, Ian Goodfellow, Wojciech Zaremba, Vicki Cheung, Alec Radford, and Xi Chen. 2016. Improved techniques for training GANs. In Proceedings of the 30th International Conference on Neural Information Processing Systems (NeurIPS). 2234–2242.
- Schroff et al. (2015) Florian Schroff, Dmitry Kalenichenko, and James Philbin. 2015. Facenet: A unified embedding for face recognition and clustering. In Proceedings of the IEEE conference on computer vision and pattern recognition (CVPR). 815–823.
- Selvaraju et al. (2017) Ramprasaath R Selvaraju, Michael Cogswell, Abhishek Das, Ramakrishna Vedantam, Devi Parikh, and Dhruv Batra. 2017. Grad-cam: Visual explanations from deep networks via gradient-based localization. In Proceedings of the IEEE international conference on computer vision (ICCV). 618–626.
- Shokri et al. (2020) Reza Shokri et al. 2020. Bypassing Backdoor Detection Algorithms in Deep Learning. In 2020 IEEE European Symposium on Security and Privacy (EuroS&P). IEEE, 175–183.
- Shokri et al. (2017) Reza Shokri, Marco Stronati, Congzheng Song, and Vitaly Shmatikov. 2017. Membership inference attacks against machine learning models. In 2017 IEEE Symposium on Security and Privacy (SP). IEEE, 3–18.
- Sonka et al. (2014) Milan Sonka, Vaclav Hlavac, and Roger Boyle. 2014. Image processing, analysis, and machine vision. Cengage Learning.
- Stallkamp et al. (2011) Johannes Stallkamp, Marc Schlipsing, Jan Salmen, and Christian Igel. 2011. The German traffic sign recognition benchmark: a multi-class classification competition. In The 2011 international joint conference on neural networks (IJCNN). IEEE, 1453–1460.
- Szegedy et al. (2016) Christian Szegedy, Vincent Vanhoucke, Sergey Ioffe, Jon Shlens, and Zbigniew Wojna. 2016. Rethinking the inception architecture for computer vision. In Proceedings of the IEEE conference on computer vision and pattern recognition (CVPR). 2818–2826.
- Tang et al. (2020) Ruixiang Tang, Mengnan Du, Ninghao Liu, Fan Yang, and Xia Hu. 2020. An embarrassingly simple approach for trojan attack in deep neural networks. In Proceedings of the 26th ACM SIGKDD International Conference on Knowledge Discovery & Data Mining (KDD). 218–228.
- Tran et al. (2018) Brandon Tran, Jerry Li, and Aleksander Mądry. 2018. Spectral signatures in backdoor attacks. In Proceedings of the 32nd International Conference on Neural Information Processing Systems (NeurIPS). 8011–8021.
- Turner et al. (2018) Alexander Turner, Dimitris Tsipras, and Aleksander Madry. 2018. Clean-label backdoor attacks. (2018).
- Udeshi et al. (2019) Sakshi Udeshi, Shanshan Peng, Gerald Woo, Lionell Loh, Louth Rawshan, and Sudipta Chattopadhyay. 2019. Model agnostic defence against backdoor attacks in machine learning. arXiv preprint arXiv:1908.02203 (2019).
- Wang et al. (2019) Bolun Wang, Yuanshun Yao, Shawn Shan, Huiying Li, Bimal Viswanath, Haitao Zheng, and Ben Y Zhao. 2019. Neural cleanse: Identifying and mitigating backdoor attacks in neural networks. In 2019 IEEE Symposium on Security and Privacy (SP). IEEE, 707–723.
- Wang et al. (2020) Haohan Wang, Xindi Wu, Zeyi Huang, and Eric P Xing. 2020. High-frequency component helps explain the generalization of convolutional neural networks. In Proceedings of the IEEE/CVF Conference on Computer Vision and Pattern Recognition (CVPR). 8684–8694.
- Wang et al. (2004) Zhou Wang, Alan C Bovik, Hamid R Sheikh, and Eero P Simoncelli. 2004. Image quality assessment: from error visibility to structural similarity. IEEE transactions on image processing 13, 4 (2004), 600–612.
- Xu et al. (2019b) Zhi-Qin John Xu, Yaoyu Zhang, Tao Luo, Yanyang Xiao, and Zheng Ma. 2019b. Frequency principle: Fourier analysis sheds light on deep neural networks. arXiv preprint arXiv:1901.06523 (2019).
- Xu et al. (2019a) Zhi-Qin John Xu, Yaoyu Zhang, and Yanyang Xiao. 2019a. Training behavior of deep neural network in frequency domain. In International Conference on Neural Information Processing (ICONIP). Springer, 264–274.
- Yamaguchi et al. (2018) Shugo Yamaguchi, Shunsuke Saito, Koki Nagano, Yajie Zhao, Weikai Chen, Kyle Olszewski, Shigeo Morishima, and Hao Li. 2018. High-fidelity facial reflectance and geometry inference from an unconstrained image. ACM Transactions on Graphics (TOG) 37, 4 (2018), 1–14.
- Yang et al. (2019a) Ziqi Yang, Jiyi Zhang, Ee-Chien Chang, and Zhenkai Liang. 2019a. Neural network inversion in adversarial setting via background knowledge alignment. In Proceedings of the 2019 ACM SIGSAC Conference on Computer and Communications Security (CCS). 225–240.
- Yang et al. (2019b) Ziqi Yang, Jiyi Zhang, Ee-Chien Chang, and Zhenkai Liang. 2019b. Neural network inversion in adversarial setting via background knowledge alignment. In Proceedings of the 2019 ACM SIGSAC Conference on Computer and Communications Security (CCS). 225–240.
- Yao et al. (2019) Yuanshun Yao, Huiying Li, Haitao Zheng, and Ben Y Zhao. 2019. Latent backdoor attacks on deep neural networks. In Proceedings of the 2019 ACM SIGSAC Conference on Computer and Communications Security (CCS). 2041–2055.
- Yin et al. (2019) Dong Yin, Raphael Gontijo Lopes, Jonathon Shlens, Ekin D Cubuk, and Justin Gilmer. 2019. A fourier perspective on model robustness in computer vision. In Annual Conference on Neural Information Processing Systems (NeurIPS). 13255–13265.
- Zhao et al. (2020a) Pu Zhao, Pin-Yu Chen, Payel Das, Karthikeyan Natesan Ramamurthy, and Xue Lin. 2020a. BRIDGING MODE CONNECTIVITY IN LOSS LANDSCAPES AND ADVERSARIAL ROBUSTNESS. In Proceedings of the International Conference on Learning Representations (ICLR).
- Zhao et al. (2020b) Shihao Zhao, Xingjun Ma, Xiang Zheng, James Bailey, Jingjing Chen, and Yu-Gang Jiang. 2020b. Clean-label backdoor attacks on video recognition models. In Proceedings of the IEEE/CVF Conference on Computer Vision and Pattern Recognition (CVPR). 14443–14452.
Appendix A Evaluation Metrics
Here, we provide the definitions of the three fidelity evaluation metrics for completeness.
PSNR is the ratio of the maximum possible power of a signal to the destructive noise power that affects its accuracy. It is defined as
| (2) |
where MSE is defined as
| (3) |
In the equations, is the original image, is the poisoning image, and are the width and height of the image. is the maximum possible pixel value of the image (255 for 8-bit images).
SSIM is an index to measure the similarity of two images. It is calculated based on the luminance and contrast of local patterns. Given two images, x and y, let L(x, y), C(x, y), and S(x, y) be luminance, contrast, and structural measures defined as follows,
| (4) | ||||
where , , and are weighted mean, variance, and covariance, respectively, and ’s are constants to prevent singularity. where and is the dynamic range of the pixel values (255 for 8-bit images), ; , ; . It should be noted that the above and are all calculated in the RGB space. Then, the SSIM index is defined as
| (5) |
IS (inception score) is first proposed to measure the quality of images generated from GANs. It mainly considers two aspects, one is the clarity of generated images, and the other is the diversity of images. Here we mainly focus on the difference between images containing triggers and the original images. It uses features of the InceptionV3 network trained on ImageNet classification dataset to mimic human visual perception. Inputting two images into InceptionV3 will output two 1000-dimensional vectors representing the discrete probability distribution of their categories. For two visually similar images, the probability distributions of their categories are also similar. Given two images x and y, the computation of IS can be expressed as follows,
| (6) |
where represents the discrete probability distribution of the predicted labels of InceptionV3, and represents Kullback-Leibler divergence.
Appendix B RGB-YUV Transform
Pixels in RGB channels can be converted to and back from YUV channels with the linear transformations in Eq (B) and Eq. (B), respectively. In the equations, (R, G, B) and (Y, U, V) stand for the channel values of a pixel in the RGB space and the YUV space, respectively.
| (7) |
| (8) |
Appendix C More Experimental Results
Here, we provide more experimental results.
| Block Size | GTSRB | CIFAR10 | ||||||||
|---|---|---|---|---|---|---|---|---|---|---|
| BA | ASR | PSNR | SSIM | IS | BA | ASR | PSNR | SSIM | IS | |
| 8 8 | 96.83 | 99.95 | 30.4 | 0.985 | 0.226 | 85.10 | 100.00 | 30.3 | 0.954 | 0.656 |
| 16 16 | 96.76 | 98.64 | 36.2 | 0.993 | 0.047 | 85.08 | 100.00 | 36.1 | 0.985 | 0.319 |
| 32 32 | 96.63 | 99.25 | 40.9 | 0.995 | 0.017 | 86.05 | 99.97 | 40.9 | 0.995 | 0.135 |
C.1. Performance versus Block Size
The default block size is set to 32 32. Here, we test other choices include using 8 8 and 16 16 blocks. We apply the same trigger for each block for simplicity. For example, for block size 16 16, we divide a 32 32 image into four disjoint parts and place the same trigger on each part. Other settings are consistent with the default FTrojan. The results on CIFAR10 and GTSRB data are shown in Table 13. As we can see from the table, different block sizes result in similar efficacy, specificity, and fidelity results.
| Block Number | ImageNet | PubFig | ||||||||
|---|---|---|---|---|---|---|---|---|---|---|
| BA | ASR | PSNR | SSIM | IS | BA | ASR | PSNR | SSIM | IS | |
| 4 | 79.75 | 15.5 | 50.4 | 0.951 | 0.003 | 81.38 | 9.62 | 50.3 | 0.981 | 0.014 |
| 9 | 77.38 | 90.63 | 47.2 | 0.929 | 0.003 | 88.12 | 99.85 | 47.1 | 0.972 | 0.020 |
| 16 | 76.25 | 98.75 | 44.5 | 0.899 | 0.005 | 86.01 | 99.25 | 44.3 | 0.955 | 0.029 |
| 25 | 75.12 | 99.88 | 42.3 | 0.869 | 0.013 | 94.38 | 99.00 | 42.1 | 0.926 | 0.039 |
| 36 | 78.38 | 98.88 | 39.0 | 0.784 | 0.021 | 87.00 | 99.75 | 38.9 | 0.856 | 0.099 |
| 49 | 78.63 | 99.38 | 37.7 | 0.727 | 0.020 | 88.62 | 99.83 | 37.7 | 0.802 | 0.213 |
C.2. Performance versus Number of Poisoned Blocks
ImageNet and PubFig contain 224 224 images, and our block size is set to 32 32. We divide the images into 49 disjoint 32 32 blocks, and it is possible to place triggers on a subset of the blocks. Here, we conduct the experiments on such choices. In particular, we randomly select 4 block, 9 blocks, 16 blocks, 25 blocks, and 36 blocks to place the trigger, and the results are shown in Table 14. We can observe that when we poison no less than 9 blocks out of the 49 disjoint blocks, we could obtain an effective backdoor attack.
C.3. Visual Capture of Existing Triggers by GradCAM
Here, we show some visual capture examples of existing backdoor attacks in Figure 10. We can observe that these attacks introduce unusual regions related to their spatial triggers.
