ATOMS: ALMA Three-millimeter Observations of Massive Star-forming regions - VIII. A search for hot cores by using C2H5CN, CH3OCHO and CH3OH lines
Abstract
Hot cores characterized by rich lines of complex organic molecules are considered as ideal sites for investigating the physical and chemical environments of massive star formation. We present a search for hot cores by using typical nitrogen- and oxygen-bearing complex organic molecules (C2H5CN, CH3OCHO and CH3OH), based on ALMA Three-millimeter Observations of Massive Star-forming regions (ATOMS). The angular resolutions and line sensitivities of the ALMA observations are better than 2 arcsec and 10 mJy/beam, respectively. A total of 60 hot cores are identified with 45 being newly detected, in which the complex organic molecules have high gas temperatures ( 100 K) and small source sizes ( 0.1 pc). So far this is the largest sample of hot cores observed with similar angular resolution and spectral coverage. The observations have also shown nitrogen and oxygen differentiation in both line emission and gas distribution in 29 hot cores. Column densities of CH3OH and CH3OCHO increase as rotation temperatures rise. The column density of CH3OCHO correlates tightly with that of CH3OH. The pathways for production of different species are discussed. Based on the spatial position difference between hot cores and UC Hii regions, we conclude that 24 hot cores are externally heated while the other hot cores are internally heated. The observations presented here will potentially help establish a hot core template for studying massive star formation and astrochemistry.
keywords:
astrochemistry - ISM:molecules - star:formation1 Introduction
Massive stars play an important role in shaping structure and evolution of galaxies, but also can affect star and planet formation. They also are dominant sources of heavy elements and UV radiation (see Zinnecker & Yorke 2007 and references therein). How massive stars form is not yet well understood. During massive star formation processes, the hot core phase is particularly important since hot cores may trace the physical and chemical environments where massive stars are born. When clouds collapse to form massive stars, the material surrounding these objects are heated up, leading to formation of hot cores with rich chemistry.
Hot cores are characterized by rich line emission from complex organic molecules (COMs) with higher gas temperature ( 100 K) and smaller source size (0.1 pc) (e.g, Kurtz et al. 2000; Cesaroni 2005). Of the detected 250 molecular species111https://cdms.astro.uni-koeln.de/classic/molecules (see also McGuire 2021), most of COMs, as well as simple molecules are frequently observed in hot cores. Different molecules are used for probing different physical components at different scales (Tychoniec et al. 2021; van Dishoeck & Blake 1998; Jøgensen et al. 2021). Especially COMs are thought to play an important role in prebiotic chemistry which may be linked to the origin of life (e.g., Herbst & van Dishoeck 2009; Ceccarelli et al. 2017). Therefore observations toward hot cores are crucial in the study of massive star formation and astrochemistry.
Hot cores have been observed towards individual cases and large sample of sources by single dish telescopes (Belloche et al. 2013; Bisschop et al. 2007; Fontani et al. 2007; Gibb et al. 2000a; Schilke et al. 1997, 2001, 2006; Halfen et al. 2013; Coletta et al. 2020; Widicus Weaver et al. 2017; Suzuki et al. 2016, 2018; Crockett et al. 2014; Xie et al. 2021; Hernández-Hernández et al. 2019; Neill et al. 2014; Möller et al. 2021; Ospina-Zamudio et al. 2018; Li et al. 2020; Bergin et al. 2010; van der Tak et al. 2000). Due to small source sizes of hot cores, single dish observations suffer from beam dilution and sample the emission from both hot cores and surrounding cold envelopes. The millimeter/submillimeter interferometric arrays (e.g., SMA, NOEMA, and ALMA) offer larger bandwidth, higher spatial resolution and increased sensitivity, which have promoted the hot core observations greatly, but mainly focused on individual sources or small samples (Law et al. 2021; van der Walt et al. 2021; Beuther et al. 2009; Qin et al. 2008, 2010, 2015; Rong et al. 2016; Rivilla et al. 2017; Bøgelund et al. 2019; Guzmán et al. 2018; Luo et al. 2009; Csengeri et al. 2019; Sakai et al. 2013, 2018; Zapata et al. 2011; Mottram et al. 2020; Fuente et al. 2021; Belloche et al. 2016, 2019; Brogan et al. 2016; Bonfand et al. 2017; Xue et al. 2019; wong & An 2018; Sánchez-Monge et al. 2010, 2014; Hernández-Hernández et al. 2014; Peng et al. 2019; Liu et al. 2001, 2002; Remijan et al. 2003, 2004; Palau et al. 2017; Wu et al. 2014; Taniguchi et al. 2020; Rathborne et al. 2011; Orozco-Aguilera et al. 2017; Ahmadi et al. 2018; Mottram et al. 2020; Pagani et al. 2017; Tercero et al. 2018). Since these observations were made with different spatial resolution and spectral setup, it is difficult to make a comparison. More recently, a large sample including 18 well-known high-mass star-forming regions was observed by the NOEMA with same spectral setup, suggesting that most molecules are destroyed in evolved cores having less emission lines (Gieser et al. 2021). Of the detected hot cores, a few show chemical differentiation between nitrogen- and oxygen-bearing COMs (e.g., Wyrowski et al. 1999; Qin et al. 2010, 2015; Remijan et al. 2004; Kalenskii & Johansson 2010; Suzuki et al. 2018; Lee et al. 2019; Csengeri et al. 2019; Allen et al. 2017; Jiménez-Serra et al. 2012; Gieser et al. 2019; Mills et al. 2018). Chemical differentiation and heating mechanism are still longstanding problems due to a lack of large sample and systematic observations.
ATOMS project has observed 146 massive clumps at 3 mm band with ALMA (Liu et al. 2020a, 2020b). 90 out of a total of 453 compact dense cores have been considered as hot core candidates based on number of emission lines (Liu et al. 2021). Hot cores are rich in COM lines. Especially two typical nitrogen- and oxygen-bearing molecules C2H5CN and CH3OCHO are frequently detected in hot cores. Spectral windows (SPWS) 7 and 8 were tuned to observe C2H5CN and CH3OCHO with more than 3 transitions, which are suitable for identifying hot cores. Comparing with the submillimeter waveband, the lines at 3 mm have much less blending problem. Aiming to build up a large sample of hot cores, we conduct a survey using C2H5CN and CH3OCHO lines based on the ATOMS continuum and line data at 3 mm band in this work. The two molecules can also be used for investigating chemical differentiation among these hot cores. The observations and data reduction are briefly described in Section 2, and the observational results including hot core identification and parameter calculation are given in Section 3. We discuss the heating mechanism and nitrogen and oxygen differentiation in Section 4. The main results and conclusions are summarized in Section 5.
2 Observations
The sample selection and basic observational parameters are described in Liu et al. (2020a). In brief, the ALMA band 3 observations were made toward 146 massive clumps from September to middle November 2019 with both the Atacama Compact 7-m Array (ACA) and the 12-m array (C43-2 or C43-3 configurations). The correlator setup was tuned to include eight SPWs with 6 higher spectral resolutions of 0.2–0.4 km s-1 windows (SPWs 1–6) in the lower sideband and SPWs 7 and 8 having lower spectral resolutions in the upper side band. SPWs 7 and 8 have a broad bandwidth of 1875 MHz corresponding to a spectral resolution of 1.6 km s-1 which were used for continuum imaging and line survey purposes. The frequencies of SPWs 7 and 8 range from 97536 to 99442 MHz, and from 99470 to 101390 MHz respectively, covering many of COM lines. In addition to the COM lines, H40 line at 99023 MHz is included in SPW 7 used for Hii region identification. SiO (2-1) at 86847 MHz are tuned in SPW 4 for tracing shocked gas. Since hot cores have smaller source size and COM lines suffer from less missing flux problem, we only use the 12 m array data for identifications of COM lines and hot cores in this work. Data reduction was done using the CASA software package version 5.6 (McMullin et al. 2007). The resultant continuum image and line cubes with the 12 m array data for the 146 clumps have angular resolutions of 1.2–1.9 arcsec, and maximum recoverable angular scales of 14.5–20.3 arcsec. The mean 1 noise level is better than 10 mJy beam-1 per channel for lines, and 0.4 mJy beam-1 for continuum. Taking angular resolution of 1.9 arcsec and 3 level , the position accuracy of line images due to the noise is estimated to be better than 0.3 arcsec by using formula =0.45 (Reid et al. 1988).
3 Results
3.1 Line and hot core identifications
As stated before, 453 compact dense cores were found in 146 massive clumps (Liu et al. 2021). We have inspected the line emission of the 453 cores one by one and extracted spectra at the line-rich positions. In total 60 line-rich cores are considered as hot core candidates. The results are in good agreement with those by Liu et al. (2021) where 54 cores were found in a statistic manner to have significant detection of at least 20 COM transitions with line intensities larger than 3 level. Then we use the eXtended CASA Line Analysis Software Suite (XCLASS,222https://xclass.astro.uni-koeln.de/ Möller et al. 2017) for further line identification and parameter calculation. The XCLASS accesses the Cologne Database for Molecular Spectroscopy (CDMS; Müller et al. 2001, 2005) and Jet Propulsion Laboratory molecular databases (JPL; Pickett et al. 1998). Assuming the molecular gas satisfies local thermodynamical equilibrium condition (LTE), the XCLASS solves radiative transfer equation and produces synthetic spectra for specific molecular transitions by taking source size, beam filling factor, line profile, line blending, excitation, and opacity into account. In the XCLASS modelling, the input parameters are source size, beam size, line velocity width, velocity offset, rotation temperature and column density (Möller et al. 2017). In our case, we take deconvolved angular sizes of the continuum sources as source sizes which are listed in Table 1. The velocity offsets are determined when referred to commonly detected CH3OH line at 100.6389 GHz. Therefore we set rotation temperatures, column densities and velocity widths as free parameters to simulate the observed spectra. To obtain optimized rotation temperature and column density parameters, we employ Modeling and Analysis Generic Interface for eXternal numerical codes (MAGIX; Möller et al. 2013) for further calculation. Note that we only consider line-rich species of C2H5CN, CH3OCHO and CH3OH molecule in this work.
The frequency setup covers many of C2H5CN and CH3OCHO transitions in SPWs 7 and 8. The observed C2H5CN and CH3OCHO transitions span upper level energies of 30–139 K and 22–58 K, respectively. Therefore we do not expect very hot gas components to be detected. Only a few CH3OH lines are tuned in our observations with upper level energies ranging from 17 to 724 K. More than 3 transitions of C2H5CN and CH3OCHO are detected in the 59 line-rich cores. The line transitions of C2H5CN and CH3OCHO in IRAS 09018-4816 are too weak to derive rotation temperature, but 3 CH3OH transitions are detected. Rotation temperatures and column densities can be derived simultaneously. The XCLASS calculations suggested that all the 59 line-rich cores have gas temperature derived from C2H5CN and CH3OCHO higher than 100 K. IRAS 09018-4816 has gas temperature above 100 K based on CH3OH line data. Considering the distances (Liu et al. 2021a) and source sizes, the 60 cores have source size smaller than 0.1 pc. We then confirm the 60 cores as hot cores, and give their coordinates, rotation temperatures and column densities in Table 1. We have checked the literature and found that 15 of these hot cores have been reported before (I18089-1732, Beuther et al. 2004; I18032-2032/G9.62+0.19, Liu et al. 2015; Dall’Olio et al. 2019; I18507+0110/G34.43+0.24, Beltrán et al. 2009; Fu & Li 2017; Calcutt et al. 2014; I17441-2822/Sgr B2(M), Sánchez-Monge et al. 2017; IRAS18056-1952/G10.47+0.03, Rolffs et al. 2011; I18507+0121/G34.26+0.15 , Sakai et al. 2013; Mookerjea et al. 2007; I16060-5146, I16065-5158, I12326-6245, I14498-5856, I15254-5621, Araya et al. 2005; Dedes et al. 2011; I16547-4247, I17233-3606, I18182-1433, Hernández-Hernández et al. 2014; I17175-3544/NGC6334I, Brogan et al. 2016). Thus, 45 hot cores are newly detected in our work. This is currently the largest hot core sample observed with similar angular resolution and spectral coverage. Forty-one cores have more than 3 CH3OH transitions detected. Note that this is a lower limit since the frequency setup of C43-2 and C43-3 configurations has a 48 MHz difference which leads to two CH3OH transitions not covered in C43-3 observations. For CH3OH with less than 3 transitions detected, column densities are estimated by assuming gas temperature equal to the rotation temperatures of oxygen-bearing molecule CH3OCHO, or equal to the rotation temperatures of C2H5CN in case that CH3OCHO is not detected.


Sample spectra in SPW 8 for four typical hot cores. The observed spectra are shown as black curves and the XCLASS modelled spectra are coded in color. The spectra of all the sources are availble in the supplementary material.
Figure 1 presents sample spectra toward a few hot cores with modeled molecular spectra (C2H5CN, CH3OCHO and CH3OH) overlaid on the observed ones. Clearly lots of C2H5CN and CH3OCHO lines are observed and large number of lines are emitted from C2H5CN and CH3OCHO species. The spectra emitted from the hot cores also show different emission features. From Figure 1 and the figures in the supplementary material, one can see that line peak intensities of C2H5CN are larger than those of CH3OCHO in 19 cores while the opposite is seen in 5 cores. It is worth mentioning that C2H5CN line emission is absent in 4 cores while CH3OCHO is not detected in 9 cores. The differences in line emissions from these cores may imply differences in physical and chemical environments among these sources.
3.2 Line images
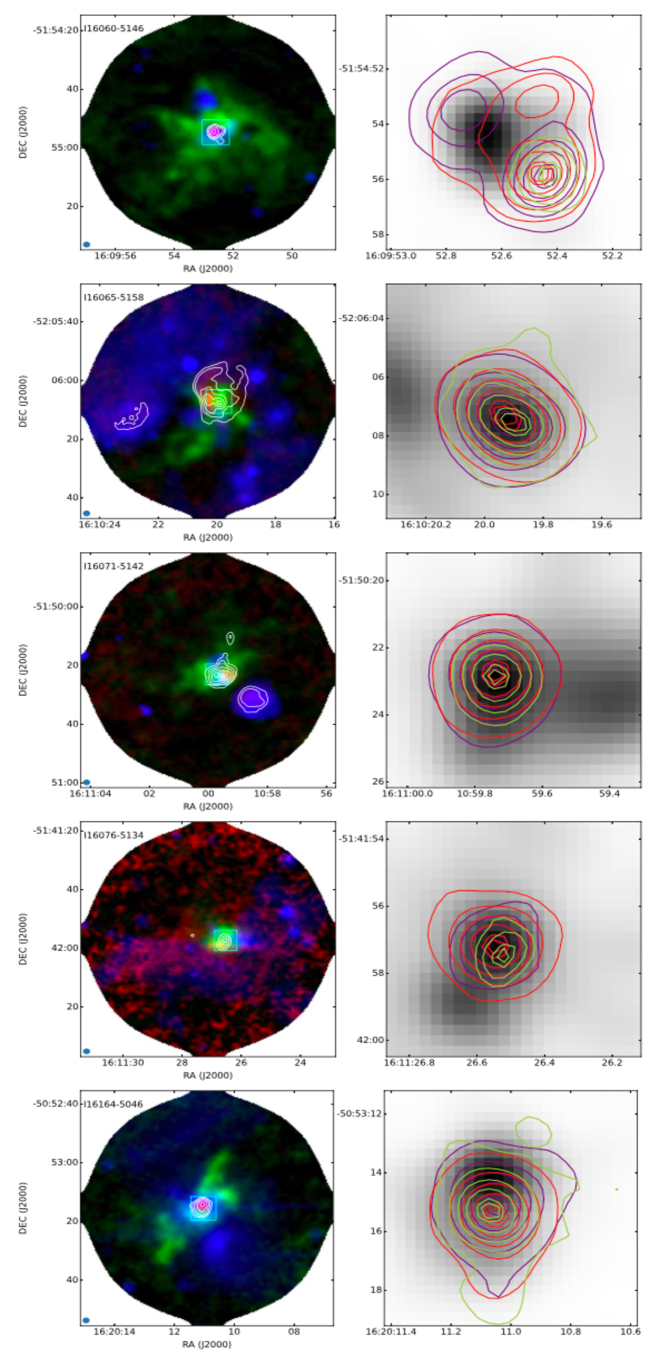
Line images of various molecules can provide valuable information on their spatial distributions and possible chemical routes. We choose three molecular line transitions of C2H5CN, CH3OCHO and CH3OH at 98523, 98792 and 100639 MHz for the images, respectively. The sample images are shown in Figure 2, and other images are presented in the supplementary material. Overall, most of the C2H5CN, CH3OCHO and CH3OH emissions are associated with the continuum images, though there are position offsets between peaks of the line and continuum images. All the line images show compact source structure and the three line emissions mainly distribute over small regions, indicating hot core properties. It can be seen that the emission peaks of C2H5CN are coincident with those of CH3OCHO in 28 cores. Considering position accuracy of 0.3 arcsec in line images, 29 cores clearly show nitrogen and oxygen separation, i.e., the emissions of C2H5CN and CH3OCHO peak at different positions. So far only a few hot cores exhibit nitrogen and oxygen differentiation in space. Our observations provide the largest hot core sample with positional separation between nitrogen- and oxygen-bearing molecules.

3.3 Rotation temperatures, column densities and abundances relative to CH3OH
From Table 1, one can see that the rotation temperatures of C2H5CN, CH3OCHO and CH3OH range from 100–285 K, 100–230 K and 100–290 K respectively. Most of the cores have gas temperatures of 100–200 K for the three species. When compared with C2H5CN and CH3OCHO, CH3OH has the largest column densities ranging from 8.61016 to 1.5 1019 cm-2 which is 2–3 orders of magnitude higher than those of C2H5CN and 1–2 orders of magnitude higher than those of CH3OCHO. Figure 3 shows the relationships between rotation temperatures and column densities for the three molecules in our sample. Column densities of CH3OH increase as their rotation temperatures rise. A linear fitting to the data gives log(N(CH3OH))=0.022Trot+14 with correlation coefficient of 0.86. A similar trend is seen for CH3OCHO with the relation log(N(CH3OCHO))=0.017Trot+14 and correlation coefficient of 0.68. The linear fitting to C2H5CN data gives a correlation coefficent of 0.29, suggesting that column densities of C2H5CN are not sensitive to its rotation temperatures, though a weak increasing trend is seen. The results appear to indicate that the two oxygen-bearing molecules are chemically-related species or the two species reside in the same astrophysical environments.

Figure 4 presents the relationships of column densities among the three species. Overall, column densities of both C2H5CN and CH3OCHO have positive correlation with that of CH3OH. The linear fittings give log(N(CH3OCHO))=1.1log(N(CH3OH))–2.5 and log(N(C2H5CN))=1.2log(N(CH3OH))–5.1 with correlation coefficients of 0.95 and 0.82 for CH3OCHO and C2H5CN, respectively. The models suggested that oxygen-bearing molecules CH3OCHO and CH3OH and nitrogen-bearing molecule C2H5CN have different forming pathways (Charnley et al. 1992; Rodgers & Charnley 2001). Probably the column densities of the three molecules depend on the initial cloud environments. As shown in Figure 3, the column densities of the oxygen-bearing molecules of CH3OCHO and CH3OH correlate well with the rotation temperatures while the nitrogen-bearing molecule C2H5CN does not follow the same trend. A possible explanation is that excitation of CH3OCHO and CH3OH depends on both temperature and density while excitation of C2H5CN is mainly related to its column density.
Among the detected COMs so far, CH3OH has the highest gas phase abundance relative to H2. The infrared observations have shown that CH3OH is the most abundant molecule relevant to water ice (e.g., Dartois et al. 1999; Gibb et al. 2000b; Ehrenfreund & Charnley 2000). Grain surface chemical models also suggested that formation of many of other COMs (especially the oxygen-bearing molecules) is related to CH3OH. From the abundance criteria, the CH3OH can be taken as one of the reference molecules to compare with other sources. The relative abundances defined by f = N(x)/N(CH3OH) are listed in Table 1, where x is the specific molecule CH3OCHO or C2H5CN. The relative abundances range from 8.410-4 to 410-2 for C2H5CN and from 2.210-2 to 2.8 10-1 for CH3OCHO, respectively, which are in agreement with previous results in hot cores (Bøelund et al. 2019; Mookerjea et al. 2007; Allen et al. 2017; Guzmán et al. 2018; Law et al. 2021; Feng et al. 2016; Bonfand et al. 2017, 2019; Molet et al. 2019; Qin et al. 2010).

4 Discussion
4.1 Heating mechanism
Observationally the evolutionary sequence of high-mass star formation starts from massive pre-stellar cores, to high-mass protostellar objects (HMPOs), hot cores, HC Hii and UC Hii regions where massive stars are already formed (e.g. Beuther et al. 2007; Menten et al. 2005). During the processes of massive star formation, the gravitational energy is converted into thermal energy to form the HMPOs. The radiation from HMPOs, HC Hii and UC Hii regions can heat up their immediate environments to form hot cores. Therefore hot cores are observed to be associated with dense and hot regions near the young high-mass protostellar objects and the UC Hii regions.
In this section, we want to differentiate internal and external heating mechanisms by comparing the relative position of line images of COMs and UC Hii regions. Radio continuum at centimeter wavelength and radio recombination lines are characteristics of the UC Hii regions associated with newly formed high-mass young stars. ATOMS covers the H40 line transition which can be used for identifying UC Hii regions. Figure 2 presents sample images of the continuum, organic molecular, H40 and SiO lines. From the left panels of Figure 2 and the figures in the supplementary material, 28 UC Hii regions are identified based on H40 line images. When comparing the continuum and H40 images with the CH3OH line images, we find that the morphologies of CH3OH line images are similar to those of continuum images, and that the CH3OH emissions peak at the peak positions of the continuum, for most sources without associated UC Hii regions. We note that although IRAS 08303–4303, IRAS 13484–6100, IRAS 16484–4603, IRAS 17158–3901, IRAS 17233-3606, and IRAS 18182–1433 have no UC Hii region counterparts, their CH3OH emission peaks are located offset from those of continuum emissions. Probably shocks traced by the 4.5 and SiO push the molecular materials away. For the sources having H40 line emission, peaks of CH3OH are offset from the continuum images except for IRAS 18056–1952. Previous molecular line images were observed to be not always consistent with the continuum emission in cases where continuum emission includes contributions from dust and free-free emission of UC Hii regions. Also no internal energy sources were identified, suggesting that these hot cores are externally heated (e.g., Wyrowski et al. 1999; De Buizer et al. 2003; Mookerjea et al. 2007). Then we simply classify the observed hot cores in our work into two categories: externally heated hot cores and internally heated hot cores. Twenty four hot cores are thought to be heated by adjacent UC Hii regions and the other sources are classified as internally heated hot cores, suggesting that some hot cores are not simply linked to HMPOs and precursors to UC Hii regions in evolutionary sequence during massive star formation (Law et al. 2021), but they only trace physical and chemical environments of hot, dense and line-rich regions. Note that we consider IRAS 18056-1952 and I18032-2032c1 as internally heated since both line and continuum images of the two sources peak at UC Hii region positions.
Figure 5 shows the cumulative distributions of the rotational temperatures and column densities of C2H5CN and CH3OCHO of the two groups of hot cores, the internally heated ones and the externally heated ones, respectively. No statistical difference of the rotational temperatures of C2H5CN between the two groups can be found. The rotational temperatures of CH3OCHO tend to be higher in the externally heated hot cores than in the internally heated hot cores, although this difference is not very much significant with a p-value of 0.14 given by the Kolmogorov-Smirnov test. The externally and internally heated cores show no obvious difference (with a p-value of 0.25) in the cumulative distributions of the column densities of CH3OCHO. While significant difference (with a p-value of 0.027) can be seen between the cumulative distributions of the column densities of C2H5CN (). The values of in the externally heated hot cores are a factor of two higher than those in the internally heated hot cores. Of course, one may expect that higher temperature component from highly excited lines are shifting towards the UC Hii regions for the externally heated hot cores while higher temperature components will be located at the dusty continuum peaks for internally heated hot cores. Future high angular resolution and high frequency observations covering high energy line transitions can verify the occurrence and characteristics of externally and internally heated mechanisms in detail.

4.2 Nitrogen and oxygen differentiation
Nitrogen and oxygen differentiation has been suggested in some hot cores (Blake et al. 1987; Wyrowski et al. 1999; Fayolle et al. 2015; Qin et al. 2015, 2010), showing different rotation temperatures and abundances, and nitrogen- and oxygen-bearing COMs peaking at different spatial positions. Observations have shown that many hot cores have excitation temperatures of nitrogen-bearing COMs higher than those of oxygen-bearing COMs (van’t Hoff et al. 2020, and references therein). Derived abundances of oxygen-bearing and nitrogen-bearing COMs have positive correlations with the other oxygen-bearing and nitrogen-bearing COMs respectively (e.g., Bisschop et al. 2007; Bergner et al. 2017; Suzuki et al. 2018). The observations have also shown that nitrogen-bearing COMs peak at protostar position while oxygen-bearing COMs are peaked offset from the central source (Qin et al., 2010; Fayolle et al. 2015).
From Table 1, rotation temperatures of C2H5CN in most hot cores are generally lower than those of CH3OH, which is inconsistent with previous observations. As stated in Section 3.1, a possible explanation is that our 3 mm observations of C2H5CN lines have low upper level energies of 30–139 K, and then the hot components of the cores are not sampled. The LTE calculations find CH3OCHO and CH3OH molecules to have larger column density than that of the nitrogen-bearing molecule C2H5CN. Column density of CH3OH correlates well with that of CH3OCHO, but also has a positive correlation with C2H5CN which also conflicts with previous results as stated above. Probably our targeted lines of the C2H5CN and CH3OCHO have low upper level energies which only sample the freshly evaporated species, and then can not probe the innermost and hottest structure of the hot cores. Nitrogen and oxygen separation is clearly seen in 29 hot cores in which C2H5CN and oxygen-bearing molecules peak at different spatial positions (see Figure 2 and the figures in the supplementary material).
4.3 Chemistry
COMs are suggested to be particularly important in both astrophysics and astrochemistry, but also to be linked to origin of life. However no firm conclusions about their formation are reached, even for commonly detected CH3OCHO and C2H5CN. Various chemical models are proposed to interpret their origination (Charnley et al. 1992, 1995; Caselli et al. 1993; Millar et al. 1991; Garrod et al. 2006, 2008; Taquet et al. 2012, 2015, 2016; Rodgers & Charnley 2001, 2003; Pols et al. 2018; Choudhury et al. 2015). In summary, main chemical routes are gas-phase and grain-surface chemical reactions as well as interaction between gas-phase and grain-surface molecules. Large sample observations of their relative abundances and spatial distributions will be able to provide clues in investigating their forming pathways.
Higher gas-phase abundances of CH3OH are derived from (sub)millimeter wavelength observations toward massive star formation regions, which is attributed to icy CH3OH evaporated from grain mantles leading to large abundance by various chemical models. From Figure 3, column densities of CH3OH increase as rotation temperatures rise, providing additional evidence that CH3OH originates from grain surface and is then released into gas phase when gas temperature is higher than 100 K. Our large sample observations give positive correlation between CH3OH and CH3OCHO which appears to indicate that CH3OCHO is formed in gas phase and is related to the evaporated CH3OH as proposed by Charnley et al. (1992, 1995). However, gas phase mechanisms by molecule-ion reactions have very low efficiency in producing CH3OCHO (Horn et al. 2004; Geppert et al. 2006). The relationship between the observed column densities and rotation temperatures of CH3OCHO show the same trend as of CH3OH that has also been repeorted by previous observations (Law et al. 2021), which may hint that CH3OCHO also originates from grain surface and then is evaporated into phase as temperature increases. The warm up model developed by Garrod et al. (2006) suggested that CH3OCHO is mainly synthesized on grain surface in lower temperatures and gas phase reactions play a dominant role in forming CH3OCHO when the gas temperature is above 200 K. In this scheme, formation of CH3OCHO is attributed to both grain surface and gas phase reactions. In our case, the observations of CH3OCHO transitions at 3 mm band have low upper level energies and should sample freshly evaporated species. The rotation temperatures of CH3OCHO in most cores are lower than 200 K. We then favor CH3OCHO observed by us at lower frequency band is synthesized on grain surface. Future higher angular resolution observations of high energy level lines can detect inner and even hotter components of the hot cores, and can test if the gas phase reactions play an important role in forming CH3OCHO.
C2H5CN can be formed by ion-molecule reactions in gas phase, but the processes are quite slow. Grain surface reactions through hydrogenation of HC3N is a more efficient mechanism (Blake et al. 1987; Caselli et al. 1993; Charnley et al. 2004). Contrary to the two complex oxygen-bearing molecules, the column densities of C2H5CN did not show positive correlation with its rotation temperatures. A possible explanation is that C2H5CN tends to have higher gas temperature than the oxygen-bearing COMs while our lower energy level lines can only trace lower excitation temperatures in the outer envelopes of the hot cores (Öberg et al. 2013). Large amount of C2H5CN are not fully evaporated from grain surface. Surprisingly the column densities of C2H5CN correlate well with those of CH3OH which is inconsistent with previous observations. Previous observations have shown that nitrogen-bearing molecules have strong correlation with other nitrogen-bearing molecules and no correlation with oxygen-bearing COMs (Bisschop et al. 2007; Bergner et al. 2017; Suzuki et al. 2018). As argued before, our observations may only sample freshly evaporated species which have not involved in subsequent gas phase reactions yet. The observed correlation between C2H5CN and CH3OH may reflect initial chemical environments or physical differences (Van’t Hoff et al. 2020).
The spatial separation between C2H5CN and the two oxygen-bearing molecules can be seen from Figure 2 and the figures in the supplementary material. But no obvious temperature differentiation is observed as in Orion KL, W3(OH) complex and G34.26+0.15 (Blake et al. 1987; Crockett et al. 2014; Wyrowski et al. 1999; Qin et al. 2015; Mookerjea et al. 2007), due to our targeted lines having low upper level energies. Another reason is that in most cases our beam may cover part of both nitrogen and nitrogen cores. Nitrogen and oxygen differentiation is a long-standing problem. Different chemical models give different explanations (Caselli et al. 1993; Garrod et al. 2008; Rodgers & Charnley 2003; Van’t Hoff et al. 2020). Higher resolution observations of highly excited lines from various COMS toward a large sample of hot cores are needed to interpret the observed differentiation.
5 Conclusions
We have performed a systematic hot core survey employing
C2H5CN, CH3OCHO and CH3OH commonly observed in hot
cores, based on the data obtained by the ATOMS project. We
summarize the main results in the following.
1. The ATOMS 3 mm band were set up to cover multiple C2H5CN, CH3OCHO
and CH3OH transitions, which were then used for deriving their
rotation temperatures and column densities. We identify a dense
core as a hot core if more than 3 transitions of the COMs are
identified and have rotation temperature above 100 K. In total, 60
hot cores are identified, out of which 45 are newly detected, thus representing
the largest hot core sample with similar angular
resolution and spectral coverage.
2. The observations have shown that
line intensities of C2H5CN are stronger than those of
CH3OCHO lines in 19 cores while the opposite is observed in 5
cores. There are total absence of C2H5CN line emission in 4 cores
while CH3OCHO lines are not detected in 9 cores. Probably the different spectral features
reflect the differences in physical and chemical environments.
3. Line images of the three molecules show compact source
structure concentrated on small regions for the hot cores. There
are 28 hot cores associated with UC Hii regions. Based on
relative positions between UC Hii regions and CH3OH
emission peaks, we classify the detected cores into two
categories: externally heated and internally heated hot cores. 24
hot cores are externally heated by radiation from adjacent UC
Hii regions while the others are heated internally.
4. Our large sample shows that column densities of CH3OCHO and
CH3OH correlate well with their rotation temperatures, and
column densities of the two molecules have a positive correlation.
The results support that CH3OCHO and CH3OH originate from the grain surface chemistry.
5. Nitrogen and oxygen differentiation is observed in 29 hot cores
with nitrogen-bearing and oxygen-bearing molecules peaking at
different positions, but no clear differences in temperature and
column density are seen from our data.
In summary, our ALMA 12 m array observations provide the largest robust hot core sample with similar angular resolution and spectral coverage. 24 hot cores are considered to be heated by external energy sources, and therefore hot cores may be not considered at evolutionary sequence of massive star formation. The targeted lines of ATOMS have upper level energies of C2H5CN and CH3OCHO less than 139 K, hence the hottest components are not observed. The heating mechanisms as well as nitrogen and oxygen differentiation in rotation temperature are needed to be verified by future observations of highly excited lines of various COMs. The future observations can also test whether gas phase chemical reactions play an important role in higher temperatures, as suggested by chemical models.
Acknowledgements
This work has been supported by the National Key R&D Program of China (No. 2017YFA0402701), by the National Natural Science Foundation of China (grant Nos. 12033005, 12073061, 12122307, 12103045, 11973013, and 11873086), and by the international partnership program of Chinese Academy of Sciences through grant No.114231KYSB20200009, Shanghai Pujiang Program 20PJ1415500, and the science research grants from the China Manned Space Project with No. CMS-CSST-2021-B06. This research was carried out in part at the Jet Propulsion Laboratory, which is operated by the California Institute of Technology under contract with NASA. J.-E. Lee was supported by the National Research Foundation of Korea (NRF) grant funded by the Korea government (MSIT; grant No. 2021R1A2C1011718). C.W.L. is supported by the Basic Science Research Program through the National Research Foundation of Korea (NRF) funded by the Ministry of Education, Science and Technology (NRF-2019R1A2C1010851). This work is sponsored in part by the Chinese Academy of Sciences (CAS), through a grant to the CAS South America Center for Astronomy (CASSACA) in Santiago, Chile. G.G. and L.B. acknowledge support by the ANID BASAL project FB210003. This paper makes use of the following ALMA data: ADS/JAO.ALMA#2019.1.00685.S. ALMA is a partnership of ESO (representing its member states), NSF (USA), and NINS (Japan), together with NRC (Canada), MOST and ASIAA (Taiwan), and KASI (Republic of Korea), in cooperation with the Republic of Chile. The Joint ALMA Observatory is operated by ESO, AUI/NRAO, and NAOJ.
Data Availability
The data underlying this article are available in the ALMA archive.
References
- Ahmadi (2018) Ahmadi, A., Beuther, H., Mottram, J. C., et al. 2018, A&A, 618, A46
- Allen (2017) Allen, V., van der Tak, F. F. S., Sánchez-Monge, Á, et al., 2017, A&A, 603, A133
- Araya (2005) Araya, E., Hofner, P., Kurtz, S. et al., 2005, ApJS, 157, 279
- Beltran (2009) Beltrán, M. T., Codella, C., Viti, S., et al. 2009, ApJ, 690, L93
- Bergin (2010) Bergin, E. A., Phillips, T. G., Comito, C., et al., 2010, A&A, 521, L20
- Bergner (2017) Bergner, J. B., Öberg, K. I., Garrod, R. T., et al., 2017, ApJ, 841, 120
- Belloche (2013) Belloche A., Müller H. S. P., Menten K. M., et al., 2013, A&A, 559, A47
- Belloche (2016) Belloche, A., Müller, H. S. P., Garrod, R. T., et al., 2016, A&A, 587, A91
- Belloche (2019) Belloche, A., Garrod, R. T., Müller, H. S. P., et al., 2019, A&A, 628, 10
- Beuther (2007) Beuther, H., Churchwell, E. B., McKee, C. F., & Tan, J. C. 2007, in Protostars and Planets V, ed. B. Reipurth, D. Jewitt, & K. Keil, 165
- Beuther (2009) Beuther, H., Zhang, Q., Bergin, E. A., & Sridharan, T. K., 2009, AJ, 137, 406
- Beuther (2005) Beuther, H., Zhang, Q., Sridharan, T. K., & Chen, Y., 2005, ApJ, 628, 800
- Beuther (2004) Beuther, H., Zhang, Q., Hunter, T. R., et al., 2004, ApJL, 616, L19
- Bisschop (2007) Bisschop S. E., Fuchs G. W., van Dishoeck E. F., Linnartz H., 2007, A&A, 474, 1061
- Blake (1987) Blake G. A., Sutton E. C., Masson C. R., & Phillips T. G., 1987, ApJ, 315, 621
- Bonfand (2017) Bonfand, M., Belloche, A., Menten, K. M., et al., 2017, A&A, 604, 60
- Bonfand (2019) Bonfand, M., Belloche, A., Garrod, R. T., et al., 2019, A&A, 628, A27
- Bogelund (2019) Bøgelund, E. G., Barr, A. G., Taquet, V., et al., 2019, A&A, 628, A2
- Brogan (2016) Brogan, C. L., Hunter, T. R., Cyganowski, C. J., et al. 2016, ApJ, 832, 187
- Calcutt (2019) Calcutt, H., Viti, S., Codella, C., et al., 2014, MNRAS, 433, 3157
- Caselli (1993) Caselli, P., Hasegawa, T. I., & Herbst, E., 1993, ApJ, 408, 548
- Ceccarelli (2017) Ceccarelli, C., Caselli, P., Fontani, F., et al., 2017, ApJ, 850, 176
- Cesaroni (2005) Cesaroni, R. 2005, in IAU Symposium, Vol. 227, Massive Star Birth: A Crossroads of Astrophysics, ed. R. Cesaroni, M. Felli, E. Churchwell, & M. Walmsley, 59–69
- Charnley (1992) Charnley, S. B., Tielens, A. G. G. M., & Millar, T. J., 1992, ApJL,399, L71
- Charnley (1995) Charnley, S. B., Kress, M. E., Tielens, A. G. G. M., & Millar, T. J., 1995, ApJ, 448, 232
- Charnley (2004) Charnley, S. B., Ehrenfreund, P., Millar, T. J., Boogert, A. C. et al., 2004, MNRAS, 347, 157
- Choudhury (2015) Choudhury, R., Schilke, P., Stéphan, G., et al., 2015, A&A, 575, A68
- Coletta (2020) Coletta, A., Fontani, F., Rivilla, V. M., et al., 2020, A&A, 641, A54
- Crockett (2014) Crockett, N. R., Bergin, E. A., Neill, J. L., et al., 2014, ApJ, 787, 112
- Csengeri (2019) Csengeri, T., Belloche, A., Bontemps, S., et al., 2019, A&A, 632, A57
- Dall’Olio (2019) Dall’Olio, D., Vlemmings, W. H. T., Persson, M. V., et al. 2019, A&A, 626, 36
- Dartois (1999) Dartois, E., Schutte, W., Geballe, T. R., et al., 1999, A&A, 342, L32
- De (2003) De Buizer, J. M., Radomski, J. T., Telesco, C. M., & Pina, R. K., 2003, ApJ, 598, 1127
- Dedes (2011) Dedes, C., Leurini, S., Wyrowski, F., et al., 2011, 526, A59
- Ehrenfreund (2000) Ehrenfreund, P., & Charnley, S. B., 2000, ARA&A, 38, 427
- Fayolle (2015) Fayolle, E. C., Öberg, K. I., Garrod, R. T., et al., 2015, A&A, 576, A45
- Feng (2015) Feng, S., Beuther, H., Semenov, D., et al., 2016, A&A, 593, A46
- Fuente (2021) Fuente, A., Trevino-Morales, S. P., Alonso-Albi, T., et al., 2021, MNRAS, 507, 1886
- Fontani (2007) Fontani, F., Pascucci, I., Caselli, P., et al., 2007, A&A, 470, 639
- Fu (2017) Fu, L., & Lin, G.-M., 2017, RAA, 16, 182
- Garrod (2006) Garrod, R. T., & Herbst, E., 2006, A&A, 457, 927
- Garrod (2008) Garrod, R. T., Widicus Weaver, S. L., & Herbst, E., 2008, ApJ, 682, 283
- Geppert (2006) Geppert, W. D., Hamberg, M., Thomas, R. D., et al., 2006, Faraday Discuss. 133, paper 13
- Gibb (2000) Gibb, E., Nummelin, A., Irvine, W. M., Whittet, D. C. B., & Bergman, P., 2000a, ApJ, 545, 309
- Gibb (2000) Gibb, E., Whittet, D. C. B., Schutte, W. A., et al., 2000b, ApJ, 536, 347
- Gieser (2019) Gieser, C., Semenov, D., Beuther, H., et al., 2019, A&A, 631, A142
- Gieser (2021) Gieser, C., Beuther, H., Semenov, D., et al., 2021, A&A, 648, A66
- Guzman (2018) Guzmán, A. E., Guzmán, V. V., Garay, G., et al., 2018, ApJS, 236, 45
- Halfen (2018) Halfen, D. T., Ilyushin, V. V., & Ziurys, L. M., 2013, ApJ, 767, 66
- Herbst (2009) Herbst, E., & van Dishoeck, E. F., 2009, ARA&A, 47, 427
- Hernandez (2014) Hernández-Hernández, V., Zapata, L. A., Kurtz, S., Garay, G., 2014, ApJ, 786, 38
- Hernandez (2019) Hernández-Hernández, V., Kurtz, S., Kalenskii, S., et al., 2019, AJ, 158, 18
- Horn (2004) Horn, A., Møllendal, H., Sekiguchi, O., et al., 2004, ApJ, 611, 605
- Jimenez-Serra (2012) Jiménez-Serra, I., Zhang, Q., Viti,S.,Martń-Pintado, J., & de Wit, W. J., 2012, ApJ, 753, 34
- Jorgensen (2021) Jørgensen, J. K., Belloche, A., & Garrod, R. T., 2021, ARA&A, 58, 727
- Kalenskii (2010) Kalenskii, S. V., & Johansson, L. E. B., 2010, Astronomy Reports 54:1084–1104
- Kurtz (2000) Kurtz, S., Cesaroni, R., Churchwell, E., Hofner, P., & Walmsley, C. M. 2000, in Protostars & Planets IV, ed. V. Mannings, A. Boss & S. Russell (Tucson: Univ. Arizona Press), 299
- Lee (2019) Lee, J.-E., Lee, S., Baek, G., et al., 2019, NatAs, 3, 314
- Law (2021) Law, Charles J., Zhang, Qizhou, Öberg, Karin I., et al., 2021, ApJ, 909, 214
- Li (2020) Li, J., Wang, J. Z., Qiao, H. H., et al., 2020, MNRAS, 492, 556
- Ligterink (2020) Ligterink, N. F. W., El-Abd, S. J., Brogan, C. L., et al., 2020, ApJ, 901, 37
- Liu (2021) Liu, H.-L., Liu, T., Evans, N. J., et al., 2021, MNRAS, 505, 2801
- Liu (2001) Liu, S.-Y., Mehringer, D. M., & Snyder, L. E., 2001, ApJ, 552, 654
- Liu (2002) Liu, S.-Y., Girart, J. M., Remijan, A. et al. 2002, ApJ, 576, 255
- Liu (2020) Liu, T., Evans, N., J., Kim, K.-T., et al., 2020a, MNRAS, 696, 2790
- Liu (2020) Liu, T., Evans, N., J., Kim, K.-T., et al., 2020b, MNRAS, 696, 2821
- Liu (2015) Liu, T., Kim, K.-T., Wu, Y. F., et al., 2015, ApJ, 810, 147
- Luo (2019) Luo, G., Feng, S. Y., Li, D., et al., 2019, ApJ, 885, 82
- McGuire (2021) McGuire, Brett A., 2021, 2021arXiv210913848M
- McMullin (2007) McMullin J. P., Waters B., Schiebel D., Young W., Golap K., 2007, in Shaw R. A., Hill F., Bell D. J., eds, ASP Conf. Ser. Vol. 376, ADASS XVI. Astron. Soc. Pac., San Francisco, p.127
- Menten (2005) Menten, K., Pillai, T., & Wyrowski, F., 2005, in IAU Symp., 23
- Millar (1991) Millar, T. J., Herbst, E., Charnley, S. B., 1991, ApJ, 369, 147
- Mills (2018) Mills, E. A. C., Corby, J., Clements, A. R., et al., 2018, ApJ, 869, 121
- Moller (2013) Möller, T., Bernst, I., Panoglou, D., et al., 2013, A&A, 549, A21
- Moller (2021) Möller, T., Schilke, P., Schmiedeke, A., et al., 2021, A&A, 651, A9
- Moller (2017) Möller, T., Endres, C., & Schilke, P., 2017, A&A, 589, A7
- Molet (2019) Molet, J., Brouillet, N., Nony, T., et al., 2019, A&A, 626, A132
- Mookerjea (2007) Mookerjea, B., Casper, E., Mundy, L. G., & Looney, L. W., 2007, ApJ, 659, 447
- Mottram (2013) Mottram, J. C., van Dishoeck, E. F., Schmalzl, M., et al., 2013, A&A, 558, A126
- Mottram (2020) Mottram, J. C., Beuther, H., Ahmadi, A. , et al., 2020, A&A ,636, A1118
- Muller (2005) Müller, H. S. P., Schlöder, F., Stutzki, J., & Winnewisser, G., 2005, J. Mol. Struct., 742, 215
- Muller (2016) Müller, H. S. P., Belloche, A., Xu, L.-H., et al., 2016, A&A, 587, A92
- Muller (2001) Müller, H. S. P., Thorwirth, S., Roth, D. A., Winnewisser, G., 2001, A&A, 370, L49
- Neill (2014) Neill, J. L. Bergin, E. A., Lis, D. C. et al., 2014, ApJ, 789, 8
- Oberg (2009) Öberg, Karin I., Garrod, R. T., van Dishoeck, E. F.,& Linnartz, H., 2009, A&A, 504, 891
- Oberg (2013) Öberg, K. I., Boamah, M. D., Fayolle, E. C., et al., 2013, ApJ, 771, 95
- Orozco (2017) Orozco-Aguilera, M. T., Zapata, L. A., Hirota, T., et al, 2017, ApJ, 847, 66
- Ospina (2018) Ospina-Zamudio, J., Lefloch, B., Ceccarelli, C. et al, 2018, A&A, 618, A145
- Pagani (2017) Pagani, L., Favre, C., Goldsmith, P. F., et al. 2017, A&A, 604, 32
- Palau (2017) Palau, A., Walsh, C., Sánchez-Monge, Á., et al., 2017, MNRAS, 467, 2723
- Peng (2019) Peng, Y. P., Rivilla, V. M., Zhang, L., et al., 2019, ApJ, 871, 251
- Pickett (1998) Pickett H. M., Poynter R. L., Cohen E. A., Delitsky M. L., Pearson J. C., Müller H. S. P., 1998, JQSRT, 60, 883
- Pols (2018) Pols, S., Schwörer, A., Schilke, P., et al., 2018, A&A, 614, A123
- Qin (2008) Qin, S.-L., Huang, M. H., Wu, Y. F., et al., 2008, ApJ, 686, L21
- Qin (2010) Qin, S.-L., Wu, Y. F., Huang, M. H., et al., 2010, ApJ, 711, 399
- Qin (2015) Qin, S.-L., Schilke, P., Wu, J. W., et al., 2015, ApJ, 803, 39
- Rathborne (2011) Rathborne, J. M., Garay, G., Jackson, J. M., et al., 2011, ApJ, 741, 120
- Reid (1988) Reid, M. J., Schneps, M. H., Moran, J. M., et al., 1998, ApJ, 330, 809
- Remijan (2003) Remijan, A., Snyder, L. E., Friedel, D. N., et al., 2003, ApJ, 590, 314
- Remijan (2004) Remijan, A., Shiao, Y.-S., Friedel, D. N., et al., 2004, ApJ, 617, 384
- Rivilla (2017) Rivilla, V. M., Beltrán, M. T., Cesaroni, R., et al. 2017, A&A, 598, A59
- Rolffs (2011) Rolffs, R., Schilke, P., Zhang, Q., et al. 2011, A&A, 536, A33
- Rodgers (2001) Rodgers, S. D., & Charnley, S. B., 2001, ApJ, 546, 324
- Rodgers (2003) Rodgers, S. D., & Charnley, S. B., 2003, ApJ, 585, 355
- Rong (2016) Rong, J. L., Qin, S.-L., Zapata, L. A., et al. 2016, MNRAS, 455, 1428
- Sanchez (2010) Sánchez-Monge, Á., Palau, A., Estalella, R., et al., 2010, ApJ, 721, 107
- Sanchez (2014) Sánchez-Monge, Á., Beltrán, M. T., Cesaroni, R., et al. 2014, A&A, 569, A11
- Sanchez (2017) Sánchez-Monge, Á., Schilke, P., Schmiedeke, A., et al., 2017, A&A, 604, A6
- Schilke (2001) Schilke, P., Groesbeck, T. D., Blake, G. A., & Phillips, T. G., 1997, ApJS, 108, 301
- Schilke (2012) Schilke, P., Benford,D. J., Hunter, T. R., Lis, D. C.,& Phillips,T. G., 2001, ApJS, 132, 281
- Schilke (2006) Schilke, P., Comito, C., Thorwirth, S., et al., 2006, A&A, 454, L41
- Suzuki (2016) Suzuki, T., Ohishi, M., Hirota, T., et al., 2016, ApJ, 825, 79
- Suzuki (2018) Suzuki, T., Ohishi, M., Saito, M., et al., 2018, ApJS, 237, 3
- Sakai (2018) Sakai, T., Yanagida, T., Furuya, K., et al., 2018, ApJ, 857, 35
- Sakai (2013) Sakai, T., Sakai, N., Foster, J. B., et al., 2013, ApJ, 775, 31
- Taniguchi (2020) Taniguchi, K., Guzmán, A., Majumdar, L., et al. ApJ, 898, 54
- Taquet (2016) Taquet, V., Wirström, E. S., & Charnley, S. B., 2016, ApJ, 821, 46
- Taquet (2015) Taquet, V., López-Sepulcre, A., Ceccarelli, C., et al., 2015, ApJ, 804, 81
- Taquet (2015) Taquet, V., Ceccarelli, C., & Kahane, C., 2012, A&A, 538, A42
- Tercero (2018) Tercero, B., Cuadrado, S., López, A., et al. 2018, A&A, 620, L6
- Tychoniec (2021) Tychoniec, Ł. van Dishoeck, E., F., van’t Hoff, M. L. R. et al., 2021, A&A, 655, A65
- van (2020) van’t Hoff, M. L. R., Bergin, E. A., & Jörgensen, J. K., et al., 2020, ApJ, 897, L38
- van (2000) van der Tak, F. F. S. , van Dishoeck, E. F. ,& Caselli, P., 2000, A&A, 361, 327
- van (2021) van der Walt, S. J., Kristensen, L. E., Jørgensen, J. K., et al., 2021, A&A, 655, A86
- van (1998) van Dishoeck, E. F., & Blake, G. A. ,1998, ARA&A, 36, 317
- Widicus (2017) Widicus Weaver, S. L., Laas, J. C., Zou, L. et al., 2017, ApJS, 232, 3
- Wong (2018) Wong, W.-H., & An, Tao, 2018, RAA, 18, 134
- wu (2014) Wu, Y. F., Liu, T., & Qin, S.-L., 2014, ApJ, 791, 123
- wyrowski (1999) Wyrowski, F., Schilke, P., Walmsley, C. M., & Menten, K. M., 1999, ApJ, 514, L43
- Xie (2021) Xie, J. J., Fuller, G., Li, D., et al., 2021, SCPMA, 64, 7
- Xue (2019) Xue, C., Remijan, A. J., Burkhardt, A. M., et al., 2019, ApJ, 871, 112
- Zapata (2011) Zapata, L. A., Schmid-Burgk, J., & Menten, K. M., 2011, A&A, 529, A24
- Zinnecker (2007) Zinnecker, H., & Yorke, H. W., 2007, ARA&A, 45, 481
| Source | RA | DEC | C2H5CN | CH3OCHO | CH3OH | ||||||||
|---|---|---|---|---|---|---|---|---|---|---|---|---|---|
| h m s | Trot (K) | N (cm-2) | f | Trot (K) | N (cm-2) | f | Trot (K) | N (cm-2) | |||||
| I08303–4303S | 08:32:08.68 | –43:13:45.78 | 2.2 | 10416 | (7.11.0)1014 | (2.80.4)10-3 | 1019 | (1.50.2)1016 | (6.10.1)10-2 | 101 | 2.51017 | ||
| I08470–4243S | 08:48:47.79 | –42:54:27.90 | 1.8 | 12518 | (1.30.2)1015 | (1.50.3)10-3 | 20030 | (2.10.2)1017 | (2.50.1)10-1 | 20232 | (8.51.1)1017 | ||
| I09018–4816 | 09:03:33.46 | –48:28:01.69 | 3.4 | 1608 | (1.90.1)1017 | ||||||||
| I11298–6155E | 11:32:05.59 | –62:12:25.62 | 3.1 | 1246 | (1.30.3)1016 | (8.35.3)10-2 | 124 | 1.61017 | |||||
| I12326–6245E,S | 12:35:35.09 | –63:02:31.91 | 1.3 | 13032 | (3.10.2)1015 | (8.40.5)10-3 | 13733 | (2.30.2)1016 | (6.20.6)10-2 | 137 | 3.71017 | ||
| I13079–6218 | 13:11:13.75 | –62:34:41.55 | 2.4 | 10013 | (2.10.2)1016 | (1.20.2)10-2 | 1109 | (1.10.3)1017 | (8.52)10-2 | 110 | 1.31018 | ||
| I13134–6242 | 13:16:43.2 | –62:58:32.3 | 2.2 | 1394 | (8.20.5)1015 | (7.50.5)10-3 | 1605 | (2.10.1)1017 | (1.90.1)10-1 | 160 | 1.11018 | ||
| I13140–6226S | 13:17:15.49 | –62:42:24.42 | 5.5 | 1394 | (5.90.1)1014 | (7.40.2)10-3 | 12017 | (6.70.1)1015 | (8.40.1)10-2 | 120 | 8.11016 | ||
| I13471–6120E,S | 13:50:41.81 | –61:35:10.67 | 1 | 1348 | (2.20.5)1015 | (1.70.4)10-3 | 12610 | (1.10.2)1017 | (8.51.3)10-2 | 126 | 1.31018 | ||
| I13484–6100 | 13:51:58.31 | –61:15:41.5 | 2.5 | 13118 | (1.60.6)1015 | (1.50.5)10-2 | 126 | 1.11017 | |||||
| I14498–5856S | 14:53:42.68 | –59:08:52.89 | 2.8 | 14413 | (8.60.1)1014 | (1.90.1)10-3 | 1063 | (1.50.1)1016 | (3.30.3)10-2 | 1358 | (4.50.4)1017 | ||
| I15254–5621E | 15:29:19.39 | –56:31:22.34 | 0.8 | 1483 | (4.20.1)1015 | (2.30.2)10-3 | 14614 | (9.20.2)1016 | (5.20.4)10-2 | 16513 | (1.80.1)1018 | ||
| I15437–5343 | 15:47:32.73 | –53:52:38.8 | 2.3 | 12820 | (1.30.1)1015 | (1.70.1)10-3 | 10611 | (2.10.1)1016 | (2.80.2)10-2 | 17028 | (7.50.4)1017 | ||
| I15520–5234E,S | 15:55:48.47 | –52:43:06.75 | 2.9 | 11813 | (1.60.1)1015 | (3.60.3)10-3 | 16030 | (3.70.1)1016 | (8.40.4)10-2 | 16828 | (4.40.1)1017 | ||
| I16060–5146E,S | 16:09:52.64 | –51:54:54.49 | 1.9 | 1105 | (30.2)1015 | (20.1)10-2 | 11022 | (2.50.2)1016 | (1.70.2)10-1 | 110 | 1.51017 | ||
| I16065–5158E,S | 16:10:19.99 | –52:06:07.25 | 3.1 | 12515 | (20.1)1016 | (1.50.2)10-2 | 15043 | (8.90.1)1016 | (6.80.1)10-2 | 17414 | (1.30.1)1018 | ||
| I16071–5142E | 16:10:59.59 | –51:50:23.37 | 4.2 | 1616 | (1.10.1)1016 | (1.10.1)10-2 | 15020 | (1.10.1)1017 | (1.10.1)10-1 | 19016 | (9.80.2)1017 | ||
| I16076–5134E,S | 16:11:26.59 | –51:41:57.84 | 4.3 | 11018 | (3.40.2)1015 | (20.2)10-2 | 12132 | (2.50.3)1016 | (1.50.2)10-1 | 13014 | (1.70.1)1017 | ||
| I16164–5046E | 16:20:11.08 | –50:53:14.75 | 2.8 | 13320 | (7.40.1)1015 | (8.10.2)10-3 | 15719 | (1.20.2)1017 | (1.30.2)10-1 | 18774 | (9.10.1)1017 | ||
| I16172–5028E,S | 16:21:02.97 | –50:35:12.6 | 1.8 | 11032 | (1.90.3)1015 | (3.30.5)10-3 | 20418 | (5.70.1)1017 | |||||
| I16272–4837c1 | 16:30:58.77 | –48:43:53.57 | 2.2 | 2208 | (4.20.1)1016 | (1.30.1)10-2 | 23037 | (8.90.2)1017 | (2.80.1)10-1 | 24021 | (3.20.1)1018 | ||
| I16272–4837c2 | 16:30:58.68 | –48:43:51.32 | 2 | 1203 | (3.10.1)1015 | (6.90.1)10-3 | 1509 | (3.90.1)1016 | (8.70.1)10-2 | 1806 | (4.50.1)1017 | ||
| I16272–4837c3 | 16:30:57.29 | –48:43:39.87 | 2.1 | 10311 | (2.10.1)1015 | (6.90.1)10-3 | 12312 | (3.80.1)1015 | (8.70.1)10-2 | 1236 | (2.10.1)1017 | ||
| I16318–4724E | 16:35:33.96 | –47:31:11.59 | 2.2 | 1305 | (2.70.1)1016 | (9.60.8)10-3 | 14815 | (1.90.5)1017 | (6.80.2)10-2 | 19218 | (2.80.2)1018 | ||
| I16344–4658E | 16:38:09.49 | –47:04:59.73 | 1.7 | 1504 | (5.50.1)1015 | (1.10.1)10-2 | 16015 | (5.20.1)1016 | (1.10.1)10-1 | 16012 | (4.80.1)1017 | ||
| I16348–4654E,S | 16:38:29.65 | –47:00:35.67 | 0.8 | 27013 | (20.1)1017 | (1.30.1)10-2 | 21312 | (20.1)1018 | (1.30.1)10-1 | 22012 | (1.50.1)1019 | ||
| I16351–4722E,S | 16:38:50.50 | –47:28:00.68 | 1.5 | 12110 | (5.70.1)1015 | (7.60.1)10-3 | 15031 | (60.3)1016 | (80.4)10-2 | 150 | 7.51017 | ||
| I16458–4512S | 16:49:30.04 | –45:17:44.58 | 1.1 | 1204 | (2.10.1)1016 | (1.40.1)10-1 | 120 | 1.51017 | |||||
| I16484–4603 | 16:52:04.66 | –46:08:33.85 | 1.3 | 12012 | (1.70.3)1015 | (10.3)10-3 | 1275 | (6.10.3)1016 | (3.60.3)10-2 | 1514 | (1.70.1)1018 | ||
| I16547–4247S | 16:58:17.18 | –42:52:07.57 | 2.5 | 1148 | (3.10.1)1015 | (7.80.3)10-3 | 15020 | (2.20.2)1016 | (5.50.4)10-2 | 1705 | (40.1)1017 | ||
| I17008–4040 | 17:04:22.91 | –40:44:22.91 | 1.7 | 1617 | (1.60.1)1016 | (50.1)10-3 | 15014 | (2.80.1)1017 | (8.80.1)10-2 | 18012 | (3.20.1)1018 | ||
| I17016–4124c1E | 17:05:10.97 | –41:29:06.95 | 0.9 | 1536 | (3.60.1)1016 | (7.80.1)10-3 | 14314 | (4.90.1)1017 | (1.10.1)10-1 | 19314 | (4.60.1)1018 | ||
| I17016–4124c2 | 17:05:11.20 | –41:29:07.05 | 1.8 | 10112 | (50.2)1015 | (1.70.1)10-3 | 16532 | (20.3)1017 | (6.60.1)10-2 | 18011 | (3.10.1)1018 | ||
| I17158–3901c1 | 17:19:20.43 | –39:03:51.58 | 2.9 | 1529 | (10.1)1015 | (3.20.4)10-3 | 15112 | (2.20.2)1016 | (7.10.5)10-2 | 1502 | (3.10.2)1017 | ||
| I17158–3901c2S | 17:19:20.47 | –39:03:49.20 | 2.8 | 1523 | (1.50.1)1015 | (1.40.1)10-3 | 150 | 1.11017 | |||||
| I17175–3544E | 17:20:53.42 | –35:46:57.72 | 3.4 | 1749 | (5.40.2)1016 | (8.60.4)10-3 | 1838 | (1.40.1)1018 | (2.20.1)10-1 | 1826 | (6.30.1)1018 | ||
| I17220–3609E,S | 17:25:25.22 | –36:12:45.34 | 1.6 | 18314 | (1.60.1)1016 | (5.70.3)10-3 | 17322 | (3.80.1)1017 | (1.40.1)10-1 | 1766 | (2.80.1)1018 | ||
| I17233–3606E,S | 17:26:42.46 | –36:09:17.85 | 3.9 | 1604 | (3.90.1)1016 | (4.10.2)10-2 | 10014 | (8.90.5)1016 | (9.30.6)10-2 | 1658 | (9.60.4)1017 | ||
| I17441–2822E | 17:47:20.17 | –28:23:04.74 | 1.3 | 16018 | (2.50.1)1016 | (1.80.1)10-2 | 1447 | (9.60.2)1016 | (6.90.2)10-2 | 2078 | (1.40.1)1018 | ||
| I18032–2032c1 | 18:06:14.92 | –20:31:43.22 | 0.9 | 20417 | (1.20.1)1017 | (1.10.1)10-1 | 204 | 1.11018 | |||||
| I18032–2032c2 | 18:06:14.88 | –20:31:39.59 | 2.4 | 1275 | (20.1)1016 | (40.3)10-2 | 13012 | (70.2)1016 | (1.50.4)10-1 | 1465 | (4.70.2)1017 | ||
| I18032–2032c3 | 18:06:14.80 | –20:31:37.26 | 1.1 | 1103 | (2.40.1)1015 | (40.3)10-2 | 110 | 1.81017 | |||||
| I18032–2032c4 | 18:06:14.66 | –20:31:31.57 | 2.1 | 13016 | (80.1)1015 | (3.80.1)10-3 | 14013 | (1.70.2)1017 | (8.10.3)10-2 | 1578 | (2.10.1)1018 | ||
| I18056–1952S | 18:08:38.23 | –19:51:50.31 | 1.1 | 2859 | (1.90.1)1018 | (6.30.1)10-2 | 1335 | (2.10.1)1018 | (70.3)10-2 | 2269 | (30.1)1019 | ||
| I18089–1732 | 18:11:51.45 | –17:31:28.96 | 1.7 | 2779 | (4.10.1)1016 | (1.60.1)10-2 | 12814 | (2.30.5)1017 | (8.80.2)10-2 | 2007 | (2.60.1)1018 | ||
| I18117–1753S | 18:14:39.51 | –17:52:00.08 | 1.6 | 18028 | (9.50.1)1015 | (5.90.2)10-3 | 16025 | (1.30.2)1017 | (8.11.1)10-2 | 1635 | (1.60.1)1018 | ||
| I18159–1648c1 | 18:18:54.66 | –16:47:50.28 | 1.7 | 15726 | (7.60.2)1015 | (7.60.1)10-3 | 16118 | (2.40.1)1017 | (2.40.4)10-1 | 22812 | (1.10.2)1018 | ||
| I18159–1648c2 | 18:18:54.34 | –16:47:49.97 | 1.9 | 10420 | (1.10.2)1015 | (1.80.3)10-3 | 11022 | (2.90.3)1016 | (4.80.4)10-2 | 16511 | (60.1)1017 |
| Source | RA | DEC | C2H5CN | CH3OCHO | CH3OH | ||||||||
|---|---|---|---|---|---|---|---|---|---|---|---|---|---|
| h m s | Trot (K) | N (cm-2) | f | Trot (K) | N (cm-2) | f | Trot (K) | N (cm-2) | |||||
| I18182–1433S | 18:21:09.05 | –14:31:47.88 | 2.1 | 12010 | (1.10.1)1015 | (5.20.5)10-3 | 1224 | (2.40.2)1016 | (1.10.1)10-1 | 120 | 2.11017 | ||
| I18236–1205S | 18:26:25.79 | –12:03:53.08 | 1.4 | 1108 | (1.80.1)1015 | (1.10.1)10-2 | 13820 | (1.70.1)1017 | |||||
| I18290–0924S | 18:31:44.13 | –09:22:12.25 | 1.4 | 1204 | (3.30.9)1015 | (5.81.6)10-3 | 120 | 5.71017 | |||||
| I18316–0602 | 18:34:20.91 | –05:59:42.0 | 2.9 | 18635 | (2.80.1)1015 | (3.20.1)10-3 | 108204 | (2.10.15)1016 | (2.40.2)10-2 | 1677 | (8.70.3)1017 | ||
| I18411–0338S | 18:43:46.23 | –03:35:29.77 | 1 | 1344 | (9.60.5)1015 | (1.10.1)10-2 | 16015 | (70.1)1016 | (7.70.5)10-2 | 16014 | (9.10.6)1017 | ||
| I18469–0132E,S | 18:49:33.05 | –01:29:03.34 | 0.9 | 1248 | (5.10.1)1015 | (3.60.2)10-2 | 13615 | (9.40.2)1016 | (6.70.4)10-2 | 1459 | (1.40.1)1018 | ||
| I18507+0110E,S | 18:53:18.56 | +01:14:58.23 | 1.3 | 1726 | (90.2)1016 | (8.20.2)10-3 | 20011 | (1.60.2)1018 | (1.50.2)10-1 | 24016 | (1.10.1)1019 | ||
| I18507+0121 | 18:53:18.01 | +01:25:25.56 | 1.7 | 1604 | (3.70.1)1016 | (8.80.3)10-3 | 20012 | (6.10.1)1017 | (1.50.1)10-1 | 2208 | (4.20.1)1018 | ||
| I18517+0437S | 18:54:14.24 | +04:41:40.65 | 2.3 | 19030 | (81)1014 | (8.41.1)10-4 | 14023 | (2.80.3)1016 | (2.90.4)10-2 | 1648 | (9.50.3)1017 | ||
| I19078+0901c1E,S | 19:10:13.16 | +09:06:12.49 | 1.7 | 14022 | (2.50.2)1015 | (1.50.1)10-2 | 140 | 1.71017 | |||||
| I19078+0901c2 | 19:10:14.13 | +09:06:24.67 | 1.8 | 12012 | (3.20.2)1015 | (1.50.1)10-2 | 1156 | (4.60.3)1016 | 1708 | (8.70.3)1017 | |||
| I19095+0930E,S | 19:11:53.99 | +09:35:50.27 | 0.5 | 16011 | (7.50.2)1015 | (1.80.1)10-3 | 1213 | (1.30.1)1017 | (3.10.1)10-2 | 15615 | (4.20.1)1018 |
Notes: The superscript E in column 1 indicates that the hot core is externally heated, while S denotes that there is spatial separation between nitrogen- and oxygen-bearing molecules. is the source size derived from the deconvolved continuum size on assuming =ab, where a and b are major and minor axes of the continuum source from Gaussian fitting. f denotes the relative abundance of the molecular species (C2H5CN or CH3OCHO) with respect to CH3OH.
Author affiliations
1Department of Astronomy, Yunnan University, Kunming 650091, People’s Republic of China
2Shanghai Astronomical Observatory, Chinese Academy of Sciences, 80 Nandan Road, Shanghai 200030, People’s Republic of China
3Jet Propulsion Laboratory, California Institute of Technology, 4800 Oak Grove Drive, Pasadena, CA 91109, USA
4National Astronomical Observatories, Chinese Academy of Sciences, Beijing 100101, People’s Republic of China
5University of Chinese Academy of Sciences, Beijing 100049, People’s Republic of China
6NAOC-UKZN Computational Astrophysics Centre, University of KwaZulu-Natal,Durban 4000, South Africa
7Center for Astrophysics, Harvard & Smithsonian, 60 Garden Street,Cambridge, MA 02138, USA
8Department of Astronomy, Peking University, 100871 Beijing, People’s Republic of China
9Departamento de Astronom’ia, Universidad de Chile, Las Condes, 7591245 Santiago, Chile
10Department of Physics, University of Helsinki, PO Box 64, FI-00014 Helsinki, Finland
11Korea Astronomy and Space Science Institute, 776 Daedeokdaero, Yuseong-gu, Daejeon 34055, Republic of Korea
12University of Science and Technology, Korea (UST), 217 Gajeong-ro,Yuseong-gu, Daejeon 34113, Republic of Korea
13School of Physics and Astronomy, Sun Yat-sen University, 2 Daxue Road, Zhuhai, Guangdong 519082, People’s Republic of China
14Yunnan Observatories, Chinese Academy of Sciences, 396 Yangfangwang, Guandu District, Kunming, 650216, People’s Republic of China
15Chinese Academy of Sciences South America Center for Astronomy, National Astronomical Observatories, CAS, Beijing 100101, China
16Institute of Astronomy and Astrophysics, Academia Sinica, 11F of Astronomy-Mathematics Building, AS/NTU No. 1, Section 4, Roosevelt Road., Taipei 10617, Taiwan
17School of Space Research, Kyung Hee University, Yongin-Si, Gyeonggi-Do 17104, Republic of Korea
18Kavli Institute for Astronomy and Astrophysics, Peking University, 5 Yiheyuan Road, Haidian District, Beijing 100871, People’s Republic of China
19Department of Physics, Anhui Normal University, Wuhu, Anhui 241002, People’s Republic of China
20Institute of Astrophysics, School of Physics and Electronical Science, Chuxiong Normal University, Chuxiong, 675000, People’s Republic of China
21Institute of Astronimy and Astrophysics, Anqing Normal University, Anqing, 246133, People’s Republic of China
22College of Science, Yunnan Agricultural University, Kunming 650201, People’s Republic of China
24Physical Research Laboratory, Navrangpura, Ahmedabad-380 009, India
25Indian Institute of Space Science and Technology, Thiruvananthapuram 695 547, India
Appendix A Supplementary material
A.1 Spectra in SPW 7


A.2 Spectra in SPW 8


A.3 Images of the continuum and organic molecular lines for externally heated hot cores


A.4 Images of the continuum and organic molecular lines for internally heated hot cores


