ASASSN-15hy: An Underluminous, red 03fg-like Type Ia Supernova
Abstract
We present photometric and spectroscopic observations of the 03fg-like type Ia supernova (SN Ia) ASASSN-15hy from the ultraviolet (UV) to the near-infrared (NIR). ASASSN-15hy shares many of the hallmark characteristics of 03fg-like SNe Ia, previously referred to as “super-Chandrasekhar” SNe Ia. It is bright in the UV and NIR, lacks a clear -band secondary maximum, shows a strong and persistent C ii feature, and has a low Si ii 6355 velocity. However, some of its properties are also extreme among the subgroup. ASASSN-15hy is underluminous ( mag), red ( mag), yet slowly declining (=0.72 0.04 mag). It has the most delayed onset of the -band maximum of any 03fg-like SN. ASASSN-15hy lacks the prominent -band break emission feature that is typically present during the first month past maximum in normal SNe Ia. Such events may be a potential problem for high-redshift SN Ia cosmology. ASASSN-15hy may be explained in the context of an explosion of a degenerate core inside a nondegenerate envelope. The explosion impacting the nondegenerate envelope with a large mass provides additional luminosity and low ejecta velocities. An initial deflagration burning phase is critical in reproducing the low 56Ni mass and luminosity, while the large core mass is essential in providing the large diffusion time scales required to produce the broad light curves. The model consists of a rapidly rotating 1.47 degenerate core and a 0.8 nondegenerate envelope. This “deflagration core-degenerate” scenario may result from the merger between a white dwarf and the degenerate core of an asymptotic giant branch star.
1 Introduction
Type Ia supernovae (SNe Ia) are one of the most precise extragalactic distance indicators in the cosmos. Their high intrinsic luminosity and apparent uniformity enable them to be used in cosmological studies, such as mapping the expansion history of the universe (e.g., Riess et al., 1998; Perlmutter et al., 1999), measuring the Hubble constant, and determining the equation of state of dark energy (e.g., Riess et al., 2007; Sullivan et al., 2011; Suzuki et al., 2012).
SNe Ia are thought to come from the thermonuclear explosions of at least one carbon-oxygen white dwarf (C/O WD) in a binary system (Hoyle & Fowler, 1960). The explosive products are mainly dictated by nuclear physics, and, to first order, it is the effectiveness of this burning that determines the observed photometric and spectroscopic properties (e.g., Hoeflich & Khokhlov, 1996; Mazzali et al., 2007). These luminous events are powered by the decay of radioactive 56Ni. The amount of 56Ni produced determines the peak luminosity (Arnett, 1982), while the interplay between 56Ni, luminosity, and opacity determines the light-curve shape (Mazzali et al., 2001). For normal SNe Ia, brighter objects produce more 56Ni and also have broader light curves (Phillips, 1993; Nugent et al., 1995; Phillips et al., 1999).
However, the ejecta mass and the exact details of the explosions are still debated, and the progenitor systems and explosion mechanisms of SNe Ia are still not fully understood (e.g., Maoz et al. 2014). Some of the possible progenitor scenarios are single degenerate, double degenerate, triple/quadruple systems, and core degenerate. The single-degenerate scenario consists of a C/O WD and a nondegenerate companion star which is either a red-giant, main sequence or He star (e.g., Whelan & Iben 1973; Nomoto et al. 1984), whereas the double degenerate scenario consists of two WDs that merge on dynamical or secular time scales (Iben & Tutukov, 1984; Webbink, 1984). Another scenario consists of collisions of two WDs (e.g., Rosswog et al., 2009). Based on secular Lidov-Kozai mechanism, Thompson (2011) suggested that “something akin to a collision” may occur in a triple system. Going beyond the secular approximations, Katz & Dong (2012),Kushnir et al. (2013),Pejcha et al. (2013) found that direct collision between two WDs may result in a thermonuclear explosion in a triple/quadruple system. Finally, the core-degenerate (CD) scenario describes the merger of a WD and the degenerate core of an asymptotic giant branch (AGB) star within its nondegenerate envelope (Livio & Riess, 2003; Kashi & Soker, 2011; Ilkov & Soker, 2012). In each scenario, the mass of the exploding WD may be near, below, or above the Chandrasekhar mass limit () depending on the exact configuration of the system or the type of the companion star. Furthermore, the flame front may propagate as a deflagration, detonation or may transition between these two propagation speeds.
As observations of SNe have accumulated, many peculiar subtypes of SNe Ia with unique and extreme observational properties have emerged. It is currently unclear which combinations of progenitor systems and explosion mechanisms lead to the observed SN Ia diversity. One of the most rare peculiar subtypes is the “super-Chandrasekhar” or 03fg-like SNe.111In this work we follow the nomenclature of naming a subtype after the first SN of its kind discovered (i.e., 03fg-like), as it is not clear if the ejecta mass of these objects in fact exceeds . To date there have only been a handful of well-studied SNe Ia identified as members of this subtype, including: SN 2003fg (Howell et al., 2006), SN 2006gz (Hicken et al., 2007; Maeda et al., 2009), SN 2007if (Scalzo et al., 2010; Yuan et al., 2010; Childress et al., 2011), SN 2009dc (Yamanaka et al., 2009; Tanaka et al., 2010; Silverman et al., 2011; Taubenberger et al., 2011; Hachinger et al., 2012), SN 2012dn (Chakradhari et al., 2014; Parrent et al., 2016; Nagao et al., 2017; Taubenberger et al., 2019), ASASSN-15pz (Chen et al., 2019), and LSQ14fmg (Hsiao et al., 2020). Furthermore, Ashall et al. (2021) presents data of 5 more 03fg-like SNe.
Generally, 03fg-like SNe have high peak luminosities (M mag), slow decline rates ( mag), and long rise times (typically 21 d, e.g., Silverman et al. 2011; Taubenberger et al. 2011). They also have a primary -band maximum that peaks after that of the band (e.g., Ashall et al. 2020). These objects have also been shown to be bright in the ultraviolet (UV) in comparison to normal SNe Ia (Silverman et al., 2011; Taubenberger et al., 2011; Brown et al., 2014b; Chen et al., 2019). However, not all members of this subtype are overluminous. For example, SN 2012dn has a relatively fainter peak luminosity (M mag, Taubenberger et al. 2019) comparing to those SNe Ia that have similar decline rate, yet it still shares the other similarities of the 03fg-like group mentioned above.
03fg-like SNe exhibit low expansion velocity gradients and have weaker Ca ii features than normal SNe Ia at early times (e.g., Scalzo et al. 2010; Taubenberger et al. 2011; Chakradhari et al. 2014). Furthermore, the vast majority of these objects show very strong C ii features that persist past maximum light. Carbon lines, if detected in a normal SN Ia, are usually only observed in spectra within a few days of the explosion. Another peculiar spectroscopic feature of 03fg-like SNe is the absence of the -band break near 1.5 m within the first month past maximum light (Taubenberger et al., 2011; Hsiao et al., 2019). In normal SN Ia, the strength and velocity of the -band break is directly linked to the amount and distribution of 56Ni in the ejecta (Wheeler et al., 1998; Hsiao et al., 2013; Ashall et al., 2019a, b).
The origins of these 03fg-like events are still under debate. Most recently, a class of interaction scenarios has emerged among the possible theoretical interpretations. Early suggestions of single-degenerate, rapid rotating super- WD (Howell et al., 2006; Hachisu et al., 2012) have been challenged since the model simulations could not reproduce the slow expansion velocities on top of the high luminosity regardless of the explosion mechanism, such as pure detonation, pure deflagration and delayed detonation (e.g., Pfannes et al., 2010; Hachinger et al., 2012; Fink et al., 2018). The “interaction” (e.g., Yuan et al., 2010; Hachinger et al., 2012; Taubenberger et al., 2013; Noebauer et al., 2016; Taubenberger et al., 2019) or “envelope” models (e.g., Khokhlov et al., 1993; Hoeflich & Khokhlov, 1996; Scalzo et al., 2010, 2014; Hsiao et al., 2020), in which the interaction between the exploding WD and surrounding circumstellar medium (CSM) provides an additional energy source and slows down the expansion, present a promising route to explain these peculiar events. Recent works have shown photometric evidence of CSM such as the NIR excess in SN 2012dn (Yamanaka et al., 2016; Nagao et al., 2017) and possible wind interaction in LSQ14fmg (Hsiao et al., 2020). However, the nature of the “envelope” is still under debate (e.g., pre-explosion wind material, the product of double degenerate merger, or the envelope of an AGB star in the core degenerate scenario; Kashi & Soker, 2011; Ilkov & Soker, 2012; Aznar-Siguán et al., 2015) and there is currently no spectral evidence of interaction observed so far.
Extensive follow-up observations of 03fg-like SNe are rare. The advent of wide-field and untargeted searches created an opportunity for advancement in the studies of 03fg-like SNe, as they are generally located in low-mass, low-luminosity environments (Howell et al., 2006; Childress et al., 2011; Taubenberger et al., 2011; Chakradhari et al., 2014; Hsiao et al., 2020), and therefore may have been missed by previous surveys. The Carnegie Supernova Project-II (CSP-II; 2011–2015) obtained high-precision, rapid-cadence observations of over 100 SNe Ia (Phillips et al., 2019; Hsiao et al., 2019), mainly from untargeted searches. One of the objects observed by the CSP-II was the 03fg-like SN Ia ASASSN-15hy located in a nearby low-luminosity host galaxy.
We present photometric and spectroscopic follow-up observations of ASASSN-15hy, a new 03fg-like object sharing the vast majority of the general properties as previous members but also exhibiting extremeness, such as being the faintest, reddest and having the most delayed -band peak time within the subgroup. The observations and data reductions are summarized in Section 2. The host properties and extinction are presented in Section 3. In Sections 4 and 5, the photometric and spectroscopic properties of ASASSN-15hy are analyzed, respectively. Model simulation and interpretation are discussed in Sections 6 and 6.3. Finally, we conclude in Section 7.
2 Observations
| ASASSN-15hy | |
|---|---|
| A.k.a. | PS15aou |
| (J2000) | |
| (J2000) | |
| 2457151.6 0.4 | |
| 2457155.6 0.7 | |
| 2457157.1 0.5 | |
| 2457158.9 1.1 | |
| 0.72 0.04 mag | |
| 0.44 0.03 mag | |
| 0.28 0.02 mag | |
| 0.12 0.02 mag | |
| bbPeak apparent magnitude without any corrections. | 15.72 0.01 mag |
| bbPeak apparent magnitude without any corrections. | 15.38 0.01 mag |
| bbPeak apparent magnitude without any corrections. | 15.30 0.01 mag |
| bbPeak apparent magnitude without any corrections. | 15.50 0.01 mag |
| ccPeak absolute magnitude with -correction, Milky Way and host-galaxy extinction correction. | mag |
| ccPeak absolute magnitude with -correction, Milky Way and host-galaxy extinction correction. | mag |
| ccPeak absolute magnitude with -correction, Milky Way and host-galaxy extinction correction. | mag |
| ccPeak absolute magnitude with -correction, Milky Way and host-galaxy extinction correction. | mag |
| 1.24 0.18 | |
| 0.13 mag | |
| Host | |
| Heliocentric redshift | 0.0185 0.0003 |
| CMB redshift | 0.0176 0.0003 |
| Distance modulusddObtained from the CMB redshift, including the uncertainty due to peculiar velocity dispersion (assuming 300 km s-1). The cosmological parameters assumed for this work are km s-1 Mpc -1, and . | 34.33 0.11 mag |
| mag | |
| Stellar mass M⋆ | (0.77 0.16) 109 M⊙ |
| log10(sSFR) | 10.21 0.31 yr-1 |
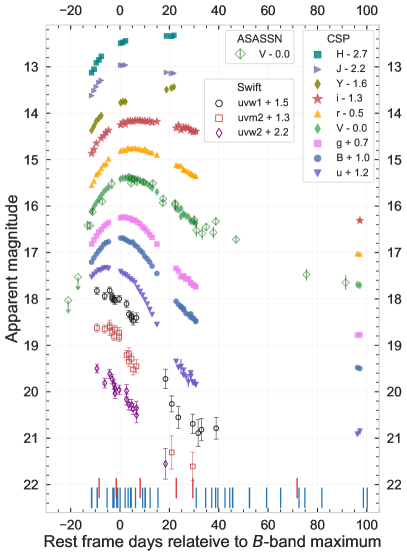
ASASSN-15hy (aka PS15aou) was discovered by the All Sky Automated Survey for SuperNovae (ASAS-SN, Shappee et al. 2014; Kochanek et al. 2017) in an image taken with the double “Cassius” telescope on 2015 April 25.21 UT at 16.4 mag and was confirmed two days later in another image taken with the Las Cumbres Observatory 1-m robotic telescope in Sutherland, South Africa (Holoien et al., 2015). It was spectroscopically classified by the Public ESO Spectroscopic Survey for Transient Objects (PESSTO; Smartt et al., 2015) as a young peculiar SN Ia with similarities to SN 2003fg and SN 2006gz on 2015 April 27.36 UT (Frohmaier et al., 2015). On the same day as the classification, at 11.5 d relative to the rest-frame -band maximum, the CSP-II started an optical and near-infrared (NIR) follow-up campaign using the 1-m Swope, 2.5-m du Pont, and the 6.5-m Baade telescopes, located at the Las Campanas Observatory (LCO) in Chile. In this paper, we present complementary multiwavelength photometric and spectroscopic observations of ASASSN-15hy from the CSP-II, ASAS-SN, , and Gemini. ASASSN-15hy is only second 03fg-like object with a NIR spectroscopic time series and has a multiband light-curve data set from UV to NIR. Note that the photometric observation gap between +31 d and +96 d are due to the lack of available observation time of the CSP-II during the Chilean winter. The photometry and observation logs are listed in Appendix A.
2.1 Photometry
The ASAS-SN observations of ASASSN-15hy consist of -band photometry, including 3 nondetection limits. The ASAS-SN images were reduced with an automated pipeline that uses the ISIS package (Alard & Lupton, 1998; Alard, 2000) for image subtraction, the IRAF222IRAF was distributed by the National Optical Astronomy Observatory, which was managed by the Association of Universities for Research in Astronomy (AURA) under a cooperative agreement with the National Science Foundation. package for performing aperture photometry, and the AAVSO Photometric All-sky Survey (APASS, Henden et al. 2015) for calibration.
CSP-II optical photometric observations in the bands of ASASSN-15hy were obtained with the e2v 4112 4096 pixel CCD imager attached to the Swope 1-m telescope at LCO. The NIR images were taken using RetroCam on the LCO 2.5-m du Pont telescope. RetroCam employs a single chip Rockwell 1024 1024 HAWAII-1 HgCdTe detector.
The CSP-II photometric observations were reduced following the procedure described in Phillips et al. (2019). Both optical and NIR images of ASASSN-15hy were background subtracted, with optical and NIR host-galaxy template images obtained at the Swope and Baade telescopes respectively, more than +300 d past maximum light. Point-spread-function photometry was used to compute the SN magnitude with respect to local-sequence stars, which were calibrated with standard star fields. An -band finder chart, with labeled local-sequence stars, is shown in Fig. A16.
Finally, UV , , , and optical photometry was obtained (PI: Holoien) with the Ultraviolet Optical Telescope (UVOT) onboard the spacecraft (Gehrels et al., 2004; Roming et al., 2005). The photometric reduction follows the same basic manner outlined by Brown et al. (2009, 2014b).
Fig. 1 presents the observed light curves of ASASSN-15hy. All photometry mentioned above is tabulated in Appendix A. The basic observational parameters of ASASSN-15hy are summarized in Table 1. As much as possible, photometry in the bands are placed via -correction in the most recent CSP-II natural system (Phillips et al., 2019), referred to as the “CSP natural system” in the subsequent text.
2.2 Spectroscopy
Spectroscopic observations of ASASSN-15hy were obtained using multiple telescopes and instruments. There are 34 optical spectra (including 22 previously published) from 11.6 d to +155.2 d and 6 NIR spectra from 8.5 d to +71.7 d relative to rest-frame -band maximum, respectively. A journal of the spectroscopic observations and the details of the published spectrum are given in Appendix A.


This work contribute twelve optical spectroscopic observations of ASASSN-15hy. Five of them were obtained with the FAST spectrograph (Fabricant et al., 1998) on the 1.5-m Tillinghast telescope at the F. L. Whipple Observatory (FLWO 1.5 m) and were reduced using a combination of custom IDL and standard IRAF procedures (Matheson et al., 2005). Four of the optical spectra were taken with the SPRAT spectrograph on the 2-m Liverpool Telescope (LT, Steele et al. 2004) and reduced using the LT pipeline (Piascik et al., 2014). Two spectra obtained with ALFOSC on the Nordic Optical 2.5-m Telescope (NOT) and one spectrum taken with WFCCD mounted on the 2.5-m du Pont telescope were all reduced in the standard manner using IRAF scripts. The optical spectroscopic observations of ASASSN-15hy are shown in Fig. 2.
The NIR spectral observations were obtained using GNIRS (Elias et al., 1998) on the 8.2-m Gemini North Telescope (GN), FLAMINGOS-2 (F2, Eikenberry et al. 2008) on the 8.2-m Gemini South Telescope (GS), and FIRE (Simcoe et al., 2013) on the 6.5-m Baade Telescope. The observing techniques and reduction procedures of these three instruments are described in Hsiao et al. (2019). The NIR spectra of ASASSN-15hy are presented in Fig. 3.
2.3 Host Observations
Integral-field spectroscopy of the host galaxy of ASASSN-15hy was obtained when the SN had faded, on 2017 July 19 UT, with the Multi-Unit Spectroscopic Explorer (MUSE, Bacon et al. 2010), mounted on the Unit 4 telescope at the ESO Very Large Telescope (VLT UT4) of the Cerro Paranal Observatory. These host observations were obtained as part of the All-weather MUSE Supernova Integral-field Nearby Galaxies (AMUSING, Galbany et al. 2016a) survey, an ongoing project studying the environments of SNe by means of the analysis of a large number of nearby SN host galaxies.
MUSE provides a wide field-of-view of approximately 11′ and a square spatial pixel size of 0.2″0.2″. This limits the spatial resolution of the data to the atmospheric seeing during the observations, which was 1.6″ while observing the host galaxy of ASASSN-15hy. The spectroscopy covers a wavelength range from 4750 to 9300 Å, with a mean spectral resolution / 3000 and a spectral sampling of 1.25 Å.
3 Host Properties
The host-galaxy properties of 03fg-like SNe can be extreme, and as a group, distinct from those of normal SNe Ia. Detailed studies of these galaxies are therefore likely pertinent to understanding the origin of 03fg-like SNe. With the integral-field spectroscopy taken by MUSE, we conducted a similar analysis to that presented by Hsiao et al. (2020) in order to obtain several measurements of galaxy properties, both at the location of ASASSN-15hy and for the galaxy as a whole.

3.1 Host Redshift
In most Swope images of ASASSN-15hy, the SN appears hostless, which is remarkable given that the estimated redshift based on the SN spectrum is , which is relatively nearby (Frohmaier et al., 2015). With the deeper MUSE data, a faint and extended source is apparent in the synthetic -band image (left panel of Fig. 4), produced by convolving the transmission function of the CSP -band filter with the MUSE datacube. The extended source observed to the south east (SE) of the SN is presumed to be the host of ASASSN-15hy. We manually defined a contour (marked with green in Fig. 4) that includes the extended source but excludes a foreground star. Note that another bright point source within the contour in the synthetic -band image is a foreground star and is excluded in the analysis. The extracted spectrum within this contour revealed the typical emission lines of a star-forming galaxy.
A heliocentric redshift for the host galaxy of = 0.0185 0.0003 was derived by measuring the positions of the strongest emission lines, such as H, [O iii] 5007 Å, and H. Correcting to the cosmic microwave background (CMB) rest frame yielded = 0.0176 0.0003, which translates to a distance modulus () of 34.33 0.11 mag assuming km s-1 Mpc -1, and for the cosmological parameters. Note that the quoted uncertainty in includes an assumed peculiar velocity dispersion of 300 km s-1.
3.2 Host Environment
To study the host properties of ASASSN-15hy, the MUSE data were analyzed using methods similar to those of Galbany et al. (2014, 2016b) and Hsiao et al. (2020). The right panel of Fig. 4 shows the extinction-corrected H emission map of the host and reveals structures across the galaxy that are not seen in the synthetic -band image shown in the left panel of Fig. 4. Spectra were extracted at several locations, and simple stellar population analysis was performed in order to obtain several measurements characterizing the host-galaxy properties. These measurements are listed in Table 2.
The host of ASASSN-15hy has a low stellar mass and extremely low metallicity indicated by the subsolar oxygen abundance. It contains a remarkably young stellar population component based on the high H equivalent width. Furthermore, this low-mass galaxy is very efficient in producing new stars, as shown by the high specific star formation rate (sSFR). The details of the host environment analysis and the results are presented in Appendix C.1.
In the context of 03fg-like SNe, the properties of the host environment of ASASSN-15hy are largely consistent with other group members. The MUSE observation of the LSQ14fmg host shows similar properties, such as low metallicity, low stellar mass, high sSFR, and a relatively young stellar population component (Hsiao et al., 2020). The host of SN 2007if was also shown to be a low-stellar-mass and metal-poor galaxy (Scalzo et al., 2010; Childress et al., 2011). The host environment of 03fg-like objects indicates that they are likely to originate from low-metallicity and young progenitors (Childress et al., 2011; Khan et al., 2011; Silverman et al., 2011; Taubenberger et al., 2011). However, the current small sample and the lack of a complete and consistent theoretical scenario hinder our ability to disentangle these effects and identify the dominant environmental driver for this class of objects.
| Location | HEW | 12 + | Stellar mass | SFR | log10(sSFR) | |
|---|---|---|---|---|---|---|
| (Å) | O3N2 (dex) | D16 (dex) | (log10(M⋆/M⊙)) | (M⊙ yr-1) | (yr-1) | |
| SN | 30.480.89 | 8.43 0.11 | 8.04 0.35 | 6.77 0.10 | 0.200.0910-3 | 10.47 0.61 |
| Structure A | 75.300.48 | 8.210.14 | 7.840.15 | 1.210.2810-3 | ||
| Global | 33.250.28 | 8.340.14 | 7.870.16 | 8.89 0.09 | 0.0480.007 | 10.21 0.31 |
3.3 Host-galaxy Extinction
Obtaining an accurate value of the host-galaxy extinction of 03fg-like SNe is difficult. As described by Scalzo et al. (2012), the Lira relation (Lira, 1996; Phillips et al., 1999) does not hold for these objects. Nevertheless, Chen et al. (2019) derived a color excess for SN 2009dc by utilizing the Lira method and assuming that ASASSN-15pz has zero host-galaxy reddening. This strategy relies on the assumption that the difference in the late-time color is not intrinsic to the SN Ia. In this work, the relation between and the Na i D equivalent width (EW) from Poznanski et al. (2012) and Phillips et al. (2013) was adopted to estimate the host reddening and extinction of ASASSN-15hy.
Each optical spectrum of ASASSN-15hy was inspected for a narrow Na i D absorption at the redshift of the host galaxy, and no absorption features were found. A detection limit of EW 0.1 Å was estimated using the WiFeS spectrum taken on 2015 May 13, selected for its relatively high resolution and signal-to-noise ratio (S/N). The detail of the methodology is described in Appendix C.2. The Na i D absorption from the Milky Way (MW) was measured to have an EW of 0.82 0.25 Å in the same spectrum, corresponding to a MW color excess of mag based on the relation presented in Poznanski et al. (2012). This is consistent with the value obtained from the Galactic reddening map of Schlafly & Finkbeiner (2011).
From the nondetection of the host-galaxy Na i D lines, we assume zero extinction throughout the paper. The extinction estimate from the Balmer decrement of the MUSE observation at the location of the SN is also consistent with zero. An extinction uncertainty = mag is estimated based on the MW Na i D and extinction measurements compiled by Phillips et al. (2013) and references therein, using the Na i D EW detection limit of 0.1 Å. This translates to an uncertainty of 0.03 mag for the color excess. Hence, throughout this work, a host-galaxy color excess of mag is adopted for ASASSN-15hy.
ASASSN-15hy is dim in the optical and red in near maximum in comparison to the 03fg-like group (see Section 4) and begs the question whether these properties are intrinsic to the SN or due to host-galaxy reddening. Comparisons of the spectral energy distributions (SEDs) of ASASSN-15hy with those of well-observed 03fg-like SNe Ia show that these properties are likely to be intrinsic to the SN. To match the optical flux of ASASSN-15hy to those of ASASSN-15pz or SN 2009dc by invoking host-galaxy extinction requires an enormous intrinsic UV flux from ASASSN-15hy that is times higher than the UV bright SN 2009dc and ASASSN-15pz. The nondetection of Na i D reaffirms that the SED differences are dominated by differences in the intrinsic properties. Details of the SED comparisons are presented in Appendix C.3.
4 Photometric Properties
The observed light curves of ASASSN-15hy are presented in Fig. 1. In this section, the photometric properties of ASASSN-15hy are analyzed by comparing light-curve parameters, such as the -band decline rate333 is the change in magnitude between maximum light and +15 d past maximum in a certain band (Phillips, 1993). and the color stretch444 is the difference in time between -band maximum and the reddest point in the color curve, normalized by 30 days (Burns et al., 2014). , as well as the shapes of the light and color curves relative to other SNe Ia. The basic observational parameters of ASASSN-15hy are summarized in Table 1.
Six of seven published 03fg-like objects so far: SN 2006gz (Hicken et al., 2007), SN 2007if (Scalzo et al., 2010; Friedman et al., 2015; Krisciunas et al., 2017), SN 2009dc (Taubenberger et al., 2011; Hicken et al., 2012; Friedman et al., 2015; Krisciunas et al., 2017), SN 2012dn (Chakradhari et al., 2014; Yamanaka et al., 2016; Taubenberger et al., 2019), ASASSN-15pz (Chen et al., 2019), and LSQ14fmg (Hsiao et al., 2020), are included for comparison in this section. Note that SN 2003fg (Howell et al., 2006) is not included in the comparison due to the lack of - and -band light curves. A well observed normal SN Ia, 2007af (Krisciunas et al., 2017), is included for comparison in this section. All photometry is -corrected (and S-corrected if the filter function is available) following the manner described in Appendix B.
These SNe were selected for comparison to ASASSN-15hy as they allow for the full diversity of properties to be explored, and other subclasses (such as 2002cx-like, 1991bg-like) are not included here due to highly distinct differences with 03fg-like objects (see Fig. 1 of Taubenberger 2017).
4.1 Luminosity Width Relation
SNe Ia follow a luminosity width relation (LWR), where SNe Ia with broader light curves are intrinsically brighter, and SNe with narrower light curves are dimmer (Pskovskii, 1977; Phillips, 1993; Phillips et al., 1999). This relation serves as a cornerstone of modern SN Ia cosmology. To determine where ASASSN-15hy and other 03fg-like SNe are located on the luminosity-width diagram, the -corrected -band light curves were used to directly measure the time of maximum, decline rate (B), and the apparent peak magnitude . These measurements were obtained through a Gaussian process interpolation included in the SuperNovae in object-oriented Python (SNooPy; Burns et al. 2011, 2014) package. Finally, MW and host-galaxy extinction corrections and distance modulus were applied to the to obtain the absolute peak magnitude , hereafter for short.
ASASSN-15hy reached -band maximum at = 2457151.6 0.4, has a of 0.72 0.04 mag, and a of 15.72 0.01 mag. As suggested in Section 3.3, there is no evidence of ASASSN-15hy suffering from substantial host-galaxy extinction. Hence, only a MW color excess mag was used to correct the photometry of ASASSN-15hy, which translates to a -band extinction of AB = 0.53 mag based on the extinction law from Cardelli et al. (1989) assuming RV = 3.1. Converting to absolute magnitude, using the AB value above, and a of 34.33 0.11 mag from the host-galaxy redshift in the CMB frame gives 19.14 0.11 mag. This corresponds to a of mag if including the uncertainty of the host extinction.
| SN | aaObtained from the CMB redshift with the same cosmological parameters assumed for ASASSN-15hy (see Section 3.1 ). | ccObtained from Schlafly & Finkbeiner (2011). | ddAdopted from Hicken et al. (2007), Scalzo et al. (2010), Taubenberger et al. (2011), Taubenberger et al. (2019), Chen et al. (2019), Hsiao et al. (2020) and this work respectively. | |
|---|---|---|---|---|
| (mag) | (MW, mag) | (host, mag) | ||
| 2006gz | 0.023 | 34.950.09 | 0.05 | 0.180.05 |
| 2007if | 0.073 | 37.510.03 | 0.07 | 0.0 |
| 2009dc | 0.022 | 34.790.09 | 0.06 | 0.100.07 |
| 2012dn | 0.009 | 33.280.21bbCorrected for infall towards the Virgo cluster and the Great Attractor (recession velocity = km s-1, Mould et al. 2000). | 0.05 | 0.040.01 |
| ASASSN-15pz | 0.014 | 33.890.14 | 0.01 | 0.0 |
| LSQ14fmg | 0.065 | 37.240.03 | 0.05 | 0.130.15 |
| ASASSN-15hy | 0.0176 | 34.330.11 | 0.13 |
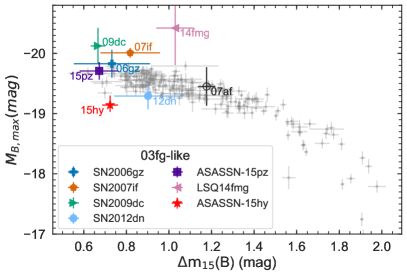
Figure 5 demonstrates where ASASSN-15hy and other 03fg-like events are located on the luminosity-width diagram. ASASSN-15hy is intrinsically the least luminous 03fg-like SN and is located below the LWR for normal SNe Ia; whereas SN 2006gz, SN 2012dn, and ASASSN-15pz blend into the normal population; and SN 2007if, SN 2009dc, and LSQ14fmg are all overluminous compared to normal SNe Ia. The corresponding adopted and reddening values of the 03fg-like SNe are tabulated in Table 3. A of 32.09 0.32 mag and mag (obtained from ) are adopted for the normal SN Ia 2007af.
ASASSN-15hy is almost one magnitude dimmer than SN 2009dc despite the fact that they have very similar values, NIR luminosities (see Section 4.2), and spectral properties (see Section 5). If ASASSN-15hy followed the LWR, for its absolute magnitude of 19.14 mag, it would be expected to have a of mag, demonstrating the uniqueness of this event. Cosmology light-curve fitters are liable to give incorrect results for SNe similar to ASASSN-15hy because of the red intrinsic color at maximum (see Section 4.3).


4.2 Light-curve Evolution
Figure 6 compares the optical rest-frame -corrected light curves of ASASSN-15hy and other SNe in the comparison sample described earlier. A 91T-like SN Ia, LSQ12gdj (Scalzo et al., 2014) is added to the sample for comparison. Another peculiar object, SN 2006bt (Foley et al., 2010; Stritzinger et al., 2011; Krisciunas et al., 2017), which is underluminous but slowly declining, is also included in the comparisons since it has a similar -band light-curve shape to 03fg-like SNe Ia. The - and -band light curves of all SNe in the figure have similar shapes but differ in time scale. ASASSN-15hy evolves more slowly on the rise compared to the SNooPy SN Ia template, but behaves similarly to some other 03fg-like SNe. The rise time of ASASSN-15hy (22.5 4.6 d), determined by fitting the flux converted from the CSP-II and ASAS-SN -band pre-maximum magnitudes with a second order polynomial, is similar to most of the 03fg-like objects where values can be determined. In this respect, ASASSN-15hy is particularly similar to SN 2007if (Scalzo et al., 2010) and SN 2009dc (Silverman et al., 2011; Taubenberger et al., 2011), which have rise times of 24.2 0.4 d and 23 2 d, and decline rates of 0.71 0.03 mag and 0.71 0.06 mag respectively. From maximum light to +30 d, ASASSN-15hy has similar behavior to the comparison SNe. However, after 30 d past maximum light, ASASSN-15hy has among the slowest declining light curves in all bands. In the band, ASASSN-15hy declines by 1.0 mag from +30 to +90 d, whereas SN 2009dc declines by 1.4 mag, for example.
The - and -band light curves of ASASSN-15hy are similar to other 03fg-like objects but differ significantly from other SNe Ia. In the band, normal and 91T-like SNe show a shoulder feature at +15 d after peak, while ASASSN-15hy and other 03fg-like objects generally do not show this feature. In the band, ASASSN-15hy has a slower rise compared to normal and 91T-like SNe Ia and lacks a pronounced secondary maximum. Note that SN 2006bt also lacks a clear secondary maximum in the band, however, it differs in NIR light-curve properties and spectra compared to 03fg-like objects (see below). ASASSN-15hy has an -band primary maximum that occurs after the -band maximum and has a difference in peak times () of 7.2 1.1 d. Although this is a ubiquitous property of 03fg-like objects (Ashall et al., 2020), ASASSN-15hy has the largest value of among all 03fg-like objects included in Ashall et al. (2020), which have a mean of 3.0 2.1 d.
In fact, the overall trend of peak times and decline rates indicates the extreme nature of ASASSN-15hy. ASASSN-15hy declines progressively more slowly and peaks progressively later in time, from blue to redder bands. This trend is significantly different from the normal SN Ia 2007af, which does not show the same progressive change especially from to band. On the other hand, the 03fg-like objects all show a relatively smooth transition, similar to ASASSN-15hy. However, ASASSN-15hy is on the extreme end in its light-curve properties, including the slowest decline rate and the largest difference in peak times in both and bands.
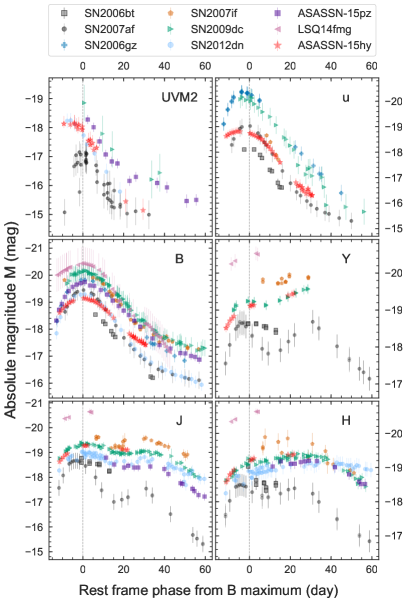
To compare the intrinsic brightnesses of ASASSN-15hy and others, Fig. 7 presents the absolute magnitudes, corrected for MW and host extinction, of the comparison SNe Ia in the and bands. The larger error bars are due to the high uncertainties in the host reddenings for some of the comparison SNe Ia. UVOT photometry of the comparison SNe was obtained from the Optical Ultraviolet Supernova Archive (SOUSA; Brown et al. 2014a) via the Swift Supernova website.555https://pbrown801.github.io/SOUSA/
ASASSN-15hy is UV bright and has a peak absolute magnitude of mag in the band, which is more than 1 mag brighter comparing to the normal SN Ia 2007af around the same time, consistent with other 03fg-like objects (Taubenberger et al., 2011; Brown et al., 2014b; Chen et al., 2019). The light curve of ASASSN-15hy is most comparable to SN 2012dn, and they both peak earlier than the normal SN Ia 2007af. The early bright UV feature of 03fg-like SNe may be explained by the shock interaction (e.g., Fryer et al., 2010; Blinnikov & Sorokina, 2010; Taubenberger et al., 2011; Hachinger et al., 2012; Scalzo et al., 2012).
During the photospheric phase, ASASSN-15hy is one of the faintest 03fg-like SNe in the and bands at -band maximum. It is 1.4 and 1.0 mag fainter than SN 2009dc in the and band, respectively. In fact, ASASSN-15hy is fainter than the normal SN Ia 2007af, which has a faster decline rate. Interestingly, ASASSN-15hy has a similar brightness to other 03fg-like SNe in the NIR bands.
As shown in Fig. 7, the NIR light curves of ASASSN-15hy are broader, brighter than normal SNe Ia and do not have two distinct maxima, similar to other 03fg-like objects. In the and bands, ASASSN-15hy continued to rise in brightness over the duration of our NIR observations and does not appear to have reached peak by the final observations at +22 d past -band maximum, which have magnitudes of and 19.39 mag respectively. The 03fg-like events SN 2009dc, SN 2012dn and ASASSN-15pz all show weak secondary maxima around +30 d in the band, similar to the timing of the NIR secondary maximum for a normal SN Ia. Unfortunately, our -band light curve does not extend to these epochs.
SN 2006bt shares some similar properties in the optical with 03fg-like objects, but shows a different evolution in the NIR; for example, SN 2006bt showed a decrease in flux in the band after the -band peak. Clearly, NIR light curves can be used as a powerful diagnostic to distinguish 03fg-like SNe from other subclasses of SNe Ia.
4.3 Color Curves

The observed , , , , and color curves of ASASSN-15hy are presented in Fig. 8, along with those of other 03fg-like SNe and the normal SN Ia 2007af. Here, host extinction corrections, which are themselves uncertain, are not applied to all comparison SNe.
In and , ASASSN-15hy shows the reddest observed colors of all 03fg-like SNe at maximum light and has values of mag and mag respectively, compared to an range of 0.04 to 0.09 mag and 0.21 to 0.07 mag for other 03fg-like SNe. This color difference would be even more pronounced after correcting for host-galaxy reddening, since ASASSN-15hy has negligible host extinction. These colors of ASASSN-15hy evolve monotonically redward from the first observation at d relative to the -band maximum until +30 d. While most of other 03fg-like SNe show local color minima around 0 d similar to the normal SN Ia 2007af, except for SN 2007if (it is unclear due to the lack of observations). If ASASSN-15hy has such local minimum, the timing of the bluest point would be much earlier than most of the other 03fg-like SNe. Although any possible host-galaxy extinction may shift the color curve vertically, the shape of the color curve would not change significantly. Thus, ASASSN-15hy is unique in that it does not have an initial phase where it evolves bluer in and , as well as the reddest color among 03fg-like SNe at -band maximum. Our observations may not be early enough to capture the bluest point of and ; nevertheless, this turn over point is shown to be possibly the earliest among 03fg-like SNe.
The color stretch parameter, , can also be used to characterize a SN Ia and is determined by locating the timing of the reddest point in the color curve (Burns et al., 2014). ASASSN-15hy has an of 1.24 0.18 (the large error due to the lack of photometric coverage at the reddest point). ASASSN-15hy, along with all other 03fg-like SNe, have values larger than 1.0, matching the slowest decliners in the normal population. The large together with a late are uniform features of these 03fg-like SNe, enabling classification between peculiar subgroups of SNe Ia (Ashall et al., 2020).
The color curve of ASASSN-15hy is also unique compared to normal SNe Ia and the majority of 03fg-like events. As Hsiao et al. (2020) have shown, the color curve is one of the more obvious ways to distinguish this subclass from normal objects. Compared with normal SNe Ia, these peculiar 03fg-like objects evolve more slowly in time, as well as having shallower peaks and troughs in their evolution. These differences are most likely caused by the unusually broad -band light curve in 03fg-like objects that also display very weak or missing -band secondary maxima. Within the 03fg-like group, there is a large scatter in colors at the epoch of maximum. ASASSN-15hy is separated from the majority of 03fg-like members and is at least 0.1 mag redder than other 03fg-like objects around the time of minimum, but is not as extreme as LSQ14fmg. The unusually flat color of LSQ14fmg is suggested to be the outcome of interaction of the SN ejecta with a superwind of an AGB star (Hsiao et al., 2020), which could potentially be the case for ASASSN-15hy as well.
The top panel of Fig. 8 shows the UVOT color curves. ASASSN-15hy evolves to the red up to +20 d and then turns blueward. This is similar to the other members of the 03fg-like group (e.g., SN 2009dc and 2012dn), and ASASSN-15hy appears to be the bluest at early times. The blue UVoptical color ( = mag at -band maximum) may indicate a lack of line-blanketing from Fe lines comparing to other members, possibly caused by differences in metallicity (e.g., Lentz et al. 2000) or caused by differences in the outer slope of the density profile of the ejecta (Walker et al., 2012). Conversely, the color of the normal SN Ia 2007af starts quite red and evolves monotonically blueward over time. 03fg-like SNe are known to be UV-blue as well as UV-bright at early times (Milne et al., 2013; Brown et al., 2014b; Chen et al., 2019), and this unique early UV evolution separates them from the normal population.
The color curve of ASASSN-15hy is similar to that of SN 2009dc and other 03fg-like SNe but evolves differently when compared to the normal SN Ia 2007af. This is not a surprise given the difference between the NIR light curves of 03fg-like and normal SNe Ia. For example, normal SNe Ia become rapidly redder in until +15 d past -band maximum, then drop to a local blue minimum at +30 d. They then evolve to the red again as the observations show. The red bump +15 d is thought to be associated with the evolution of the -band break and the unveiling of iron group elements in the ejecta (Wheeler et al., 1998). Unlike normal SNe Ia, ASASSN-15hy becomes redder more slowly over time and only increases 0.3 mag from 0 to +20 d, whereas SN 2007af increases 1.5 mag during the same time period. SN 2009dc and SN 2012dn also show a similar slow reddening at early times and then flatten off in color between +15 to +40 d, possibly due to the lack of a -band break in the NIR spectra. It is noteworthy that SN 2007if evolves bluer in after +15 d until the last observed epoch, although the uncertainties are large.


5 Spectroscopic Properties
The spectroscopic data set of ASASSN-15hy has broad wavelength coverage and high cadence. In total, there are 42 optical (11.6 to 155.2 d) and 6 NIR (8.5 to 71.7 d) spectroscopic observations, enabling a detailed look at the spectral features and evolution of a rare 03fg-like object. Note that all phases in this section are relative to the epoch of -band maximum and corrected for time dilation, unless otherwise stated.
5.1 Optical Wavelengths
The first two optical spectra were taken concurrently with the first Swope multifilter observations (Fig. 2) and appear blue as confirmed by the color (Fig. 8). The SED then evolves redwards rapidly. The early optical spectra are dominated by P-Cygni profiles of intermediate-mass elements (IME; such as Si, Ca, and S), unburned elements (C and O), and iron group elements (IGEs). Most of these features are also prevalent in the spectra of normal SNe Ia. However, there is a lack of higher-ionization species such as Fe iii in ASASSN-15hy, which are typical of normal, slow-declining SNe Ia.
5.1.1 Comparison of Spectral Features
The left panel of Fig. 9 presents a pre-maximum optical spectrum of ASASSN-15hy with labeled line identifications, as well as comparisons between ASASSN-15hy and a variety of subclasses of SNe Ia. The ions present in ASASSN-15hy are similar to those observed in the normal SN 2011fe. The notable differences are the overall weaker spectral features in ASASSN-15hy, particularly the Ca ii features as well as the stronger C ii features. The weak spectral lines of ASASSN-15hy resemble those of SN 1991T and SN 2012Z (02cx-like). However, the ionization states of these two objects are much higher than ASASSN-15hy, as the early spectra of SN 1991T and SN 2012Z are dominated by Fe iii lines (Filippenko et al., 1992a; Stritzinger et al., 2015). ASASSN-15hy does not exhibit the Ti ii feature around 4000 Å, which is present in 06bt- and 91bg-like SNe (e.g., Filippenko et al. 1992b; Foley et al. 2010). Overall, the spectra of ASASSN-15hy are remarkably similar to the 03fg-like event SN 2009dc (Taubenberger et al., 2011), demonstrating that this object belongs in the 03fg-like subclass.
The right panel of Fig. 9 presents a comparison between ASASSN-15hy and other 03fg-like SNe around one week after -band maximum. All of the objects have a similar ionization state, are dominated by IMEs, show weak Ca ii H&K features, and most have persistent C ii absorptions past maximum light. However, the strength and velocity of the Si ii 6355 feature vary within this subclass.
SN 2009dc and ASASSN-15hy are the two 03fg-like SNe Ia that have the most complete optical spectroscopic data sets. Figure 10 shows the time series comparison between these two 03fg-like objects. Again, these two objects have very similar evolution in their spectral features, except for the slightly redder color of ASASSN-15hy. The C ii 6850 line is still present in both ASASSN-15hy and SN 2009dc around one week after maximum, while C ii in a normal SN Ia, if present at all, usually disappears soon after the explosion (Taubenberger et al., 2011; Folatelli et al., 2012). The strong and persistent C ii feature implies substantial unburned material in the ejecta (Howell et al., 2006; Hicken et al., 2007).

5.1.2 Si ii and C ii Evolution
To compare the line profiles of ASASSN-15hy and other SNe quantitatively, we measured the velocities and pseudo-equivalent widths (pEW) of the Si ii 6355 and C ii 6850 features. We first divide the flux by the local continuum around the feature, which is constructed by connecting the two local maxima on both sides of the feature. The area is integrated to obtain the pEW. The position of the absorption minimum is obtained by fitting a Gaussian profile to obtain the blue-shifted velocity. To estimate the measurement uncertainties, we bootstrap-resample the flux 500 times repeating the above process. The mean and standard deviation of the realizations are adopted as the measured value and corresponding error for each pEW and velocity measurement.
ASASSN-15hy has small pEW values for Si ii 5972 and 6355 near maximum light, which places it in the “shallow silicon” (SS) group on the Branch diagram (Branch et al., 2006). This is a common characteristic of 03fg-like events (e.g., Taubenberger et al. 2011; Hsiao et al. 2020), as shown in Fig. 11. The only 03fg-like SN that might sit in a different area of the Branch diagram is SN 2012dn; however, this SN also has a lower luminosity than most of the other 03fg-like SNe. Interestingly, the underluminous ASASSN-15hy is sitting closer to the brighter 03fg-like SNe, such as SNe 2007if and 2009dc, on the Branch diagram.
The velocity of Si ii 6355 for ASASSN-15hy ranges from km s-1 at -10 d to km s-1 at +2 d and is km s-1 slower than the normal SN 2011fe. The lack of a rapid velocity decline at early times appears to be a consistent trait of 03fg-like SNe, as shown in the top panel of Fig. 12, indicating that the Si layer is confined to a narrow range. ASASSN-15hy shows a velocity plateau at km s-1 from 5 to +2 d. Similar behavior was also reported in the bright 03fg-like object SN 2007if (Scalzo et al., 2010). In general, the velocities of ASASSN-15hy and other 03fg-like SNe are relatively lower than the mean velocity of SS SNe Ia from Folatelli et al. (2013), however, there is a large spread of velocity among the group.
In ASASSN-15hy, it is not possible to determine the Si velocity evolution after +2 d, because the blending of the low-excitation Fe ii 6456, 6516 lines with the Si ii 6335 feature causes a sudden drop in in what is measured as the Si velocity. Therefore, after +2 d the measurement does not represent the true velocity of the Si ii 6355 feature. This blending effect is usually seen in subluminous SNe Ia at similar early phases (Galbany et al., 2019) and at later times in normal SNe Ia (e.g., Folatelli et al., 2013). This velocity drop has been previously mistaken as a distinguishing feature of 03fg-like objects (Scalzo et al., 2012). The fact that we see this blending effect so early in ASASSN-15hy may be an indication that there is a low ionization state in the line-forming region.


The C ii 6580 velocity of ASASSN-15hy is similar to the Si ii 6355 velocity at 11 d ( km s-1), but diverges from the Si ii velocity shortly after this time period. By -band maximum, the C ii velocity is km s-1 lower than the Si iivelocity. This is in contrast with the majority of the comparison SNe which show similar velocity gradients for C ii 6580 and Si ii 6355.
Previous studies have shown that for normal SNe Ia the C ii and Si ii velocity evolution is similar (Parrent et al., 2011; Folatelli et al., 2012). However, ASASSN-15hy has a pre-maximum C ii velocity decline rate of km s-1 per 10 days but only 500 km s-1 per 10 days for Si ii. This diverging behavior in velocities is also seen in SN 2012dn (Chakradhari et al., 2014; Parrent et al., 2016; Taubenberger et al., 2019). This may indicate that there is carbon-rich material below the Si layer, or more likely, it could be a projected velocity and ionization effect. If the C ii is in a confined region just above the photosphere, more absorption is seen from the material not moving directly towards the observer, which results in a projection effect that makes the material appear to be at a lower velocity (Hoeflich, 1990).
Despite the differences in velocity of C ii 6580 within the 03fg-like subgroup, ASASSN-15hy and most other members of this subgroup have large pEW values for this ion, which continues past maximum light. It persists much longer than in normal SNe Ia, such as SN 2011fe, as shown in the bottom panel of Fig. 12. The C ii pEW of ASASSN-15hy has a value of 19 Å at 11 d and gradually decreases with time, disappearing around 2 weeks past maximum light. In contrast, the normal SN Ia 2011fe only has a pEW of 5 Å at 17 d, which rapidly declines to 2 Å within 5 days, and then gradually disappears while approaching maximum light. This is evidence of substantial unburned material within the ejecta of ASASSN-15hy.
5.2 Near-infrared Wavelengths


ASASSN-15hy has 6 NIR spectra covering epochs from 8.5 to +71.7 d, making it only the second 03fg-like object with NIR spectral observations (the first one being SN 2009dc). All spectra have high S/N allowing for unambiguous identifications of several lines and their evolution.
5.2.1 Line Identification and Evolution
A number of spectral lines in ASASSN-15hy are identified and labeled in Fig. 13 (a). The line list from Marion et al. (2009), as well as line identifications from Taubenberger et al. (2011), Hsiao et al. (2015, 2019) and Gall et al. (2012), were used as a guide to identify the NIR features in ASASSN-15hy. The NIR spectra of ASASSN-15hy mainly consist of Ca ii, Mg ii, Fe ii, and Co ii lines with a possible contribution from C i.
The strongest feature in the NIR is the Ca ii 0.8538 m IR triplet, which is also present in the region overlapping with the optical spectra. Multiple Mg ii lines also were identified: 0.9227, 1.0927, 1.6787, and 2.1369 m. These line identifications were confirmed by examining these features in velocity space, where they all follow a similar velocity trend, shown as solid symbols in the left panel of Fig. 13 (b). The Mg ii 0.9227 m feature may also have contributions from O i and Si ii, but in ASASSN-15hy these are minor as the velocity evolution of this feature matches the other Mg ii lines. We attribute the absorption feature seen at 0.97 m (marked orange in Fig. 13) to be a blend of Mg ii 1.0092 m and Fe ii 0.9998 m. Thus, the blending likely affects the velocity evolution of these two ions presented in Fig. 13 (b). This feature is likely to have a significant contribution from Fe ii by +8.1 d. The presence of Fe ii at this time period is consistent with the optical spectroscopy of ASASSN-15hy, where a velocity drop in the Si ii 6355 feature due to the blending with Fe ii 6456 and 6516 was observed around the same time.
The IGE features become stronger with time. As shown in the +22.8 d spectra, Fe ii 0.9998, 1.0500, and 1.0863 m are all clearly visible and are also seen in SN 2009dc (Taubenberger et al., 2011). Co ii 2.1365, 2.2205, 2.3613, and 2.4596 m emission features are also present in the 2.1 2.4 m region in the same spectrum.
5.2.2 Possible C i Detection
Throughout the NIR spectral observations, there are no strong C i features such as those observed in SN 1999by (Hoeflich et al., 2002), iPTF13ebh (Hsiao et al., 2015) or SN 2015bp (Wyatt et al., 2021), but a weak C i 1.0693 m line may be present in ASASSN-15hy at 8.5 and 1.5 d. the right panel of Fig. 14 shows a notch at 1.03 m (marked with dark red) next to the absorption of Mg ii 1.0927 m. This is similar to the position of the C i 1.0693 m feature in iPTF13ebh at early times, where the feature is strong and unambiguous. The weak notch in ASASSN-15hy would correspond to a velocity of km s-1 assuming that it originated from C i 1.0693 m. Such a velocity at d is km s-1 faster than the optical C ii 6580 line. This velocity difference could be due to a large carbon envelope in the ejecta that extends to higher velocities. An ionization change throughout the envelope could cause C i and C ii to have distinctly different observed velocities. Furthermore, if the C ii layer is small, the velocity could appear lower than the location of the bulk of the C ii material due to projected velocity effects (see Section 5.1.2).
Unfortunately, there are no other clear C i features, such as C i 1.1754 m, in the first two NIR spectra. The next observation at +8.1 d contains two newly formed features aroun 1.02 and 1.12 m, marked red and pink in Fig. 13 (a), respectively. These may be attributed to C i 1.0693 m and 1.1754 m. However, these lines are more likely produced through absorption from IGEs, due to their similarity in velocity to the Fe ii lines. We do not exclude the possibility that these two features are blended with weak C i.
5.2.3 Missing H-band Break
Interestingly, ASASSN-15hy does not show an -band break near 1.5 m until +72 d. For a normal SN Ia, the -band break (Kirshner et al., 1973) appears around +3 d and peaks in strength around +10 to +12 d (e.g., Hsiao et al., 2013), as demonstrated by SN 2012fr (Contreras et al., 2018; Hsiao et al., 2019) in the middle panel of Fig. 14. The -band break is produced by a multiplet of allowed Co ii, Ni ii, and Fe ii emission lines that emerge when the photosphere recedes deep into the 56Ni rich region (Wheeler et al., 1998; Hoeflich et al., 2002). The strength of the -band break has been found to correlate with SN Ia light-curve shape (Hsiao et al., 2013), and the outer blue velocity () of the break has been found to directly trace the outer 56Ni region in the ejecta (Ashall et al., 2019a, b). The absence of an -band break suggests that the photosphere has not reached the core of the 56Ni region by +30 d. This absence was also noted in SN 2009dc (Taubenberger et al., 2011).
Despite the peculiar behavior of the -band break, Co ii features are apparent in the 2.12.4 m region at +23 d, which is a similar phase to the onset of these features in all three comparison SNe in Fig. 14. It has been proposed that these Co ii features form in the same region as the -band break (Wheeler et al., 1998). We rule out the lack of the -band break being caused by an ionization effect, since 91T-like SNe Ia show strong -band breaks but have a higher-ionization state than ASASSN-15hy (M.M. Phillips et al. in preparation). The missing -band break in ASASSN-15hy could be evidence of an opacity difference between the and bands for this peculiar object (see Appendix D.3 for more details).
The NIR spectra of ASASSN-15hy and SN 2009dc are nearly identical in both color and evolution of the line profiles, as shown in the left panel of Fig. 14. ASASSN-15hy shows both similarities and discrepancies when compared to a normal SN Ia. The early time NIR spectra of ASASSN-15hy have smooth continua and show shallow IME features such as Mg ii, which is consistent with both SN 2009dc and SN 2012fr. However, after maximum light the features of ASASSN-15hy are different from the normal SN Ia 2012fr, especially in the 1.2 to 1.6 m region. As discussed above, part of this is due to the delayed onset of the -band break and distribution of 56Ni. After maximum light, SN 2012fr presents strong absorption features near 1.2 m, thought to be the cause of the rapid decrease in -band magnitude that is seen in normal SNe Ia (Branch et al., 1983; Elias et al., 1985). However, ASASSN-15hy shows a limited decrease of the flux in this region, which is consistent with its broad and slowly-declining -band light curve (see Fig. 7).
6 Model Results
In this section, we briefly discuss the physics of ASASSN-15hy, provide one possible interpretation of the data, and compare the data to explosion models. A more in depth description of our modeling assumptions and methodology can be found in Appendix D.
6.1 Envelope models
In this work, we employ the parameterized framework of spherical envelope models (Hoeflich & Khokhlov, 1996) and make use of the observed spectral evolution and photometric properties of ASASSN-15hy to constrain model parameters. This class of models has been previously shown to provide a consistent picture for the 03fg-like object LSQ14fmg (Hsiao et al., 2020) and the observed slow rise and decline of SN 2009dc (Noebauer et al., 2016). The envelope models may be consistent with the core degenerate (CD) scenario (e.g., Kashi & Soker, 2011). The CD scenario consists of the explosion of a degenerate core within a nondegenerate envelope. In this scenario, the ignition process and thermonuclear explosion may be triggered by the merger between the core of an AGB star and a WD: 1) on dynamical time scale which results in a detonation (Kashi & Soker, 2011; Aznar-Siguán et al., 2015; Taubenberger, 2017), or 2) on secular time scales which may lead to an early deflagration phase with a transition to a detonation, subsequently called “Deflagration-CD” (DCD) (Hoeflich et al., 2019). We stress that in our models the nature of the envelope is unknown. It may be the nondegenerate outer envelope of an AGB star in the CD scenario, but we do not rule out other possibilities.
The main model parameters are: the mass of the nondegenerate envelope ; the radius of the nondegenerate envelope ; the extent of the He and C layers in mass and velocity space; the initial metallicity ; the mass of the hydrostatic, possibly rotating, core which is referred to as the core mass, ; the amount of mass burnt during the deflagration phase, , which is controlled by the transition density at which the deflagration transforms into a detonation ; and possible interaction with the nearby environment or wind.
The central density () is calculated using the equations of hydrostatic equilibrium for models with up to (Hoeflich et al., 1998). For models with in excess of , we assume fast rotating cores that ignite at a central density of g cm-3 (Yoon & Langer, 2005). These densities are found at the lower end of the classical delayed-detonation models and may be attributed to He- or C-accreting WDs within the class of explosions (Telesco et al., 2015; Diamond et al., 2015, 2018). For these values of , approximately of electron rich iron-group elements are produced.
To first order, specific observational parameters are directly linked to model parameters. This produces a set of selection criteria that allows us to determine the best matching model. The main criteria are: , which determines the final “shell” velocity indicated by the Si line region formed in quasi statistical equilibrium (QSE) (Hoeflich & Khokhlov, 1996; Quimby et al., 2007); and , which determines the width of the shell. With increasing radius, the shell becomes more confined in velocity space (Fig. D19); and determines the diffusion time scales and therefore the rise time to maximum light (Hoeflich & Khokhlov, 1996; Dessart et al., 2014; Shen & Moore, 2014). The detonation in a sub- (1 ) model produces a rise time that is too short, and models with produce a rise time that is too long by several days. The best agreement was found with a model of that puts ASASSN-15hy near, but over .

The secondary selection criteria in the case of DCD are: or , which regulates the 56Ni production and therefore the luminosity, if all other parameters are kept the same, in the same fashion as in the classical delayed detonation models (e.g., Hoeflich et al., 2002). In general within the CD scenario, the metallicity, and the relative amount of control the color , the UV and NIR flux, and the formation of CO.
6.2 Best Matching Model
ASASSN-15hy’s relatively low peak luminosity and broad light curves place it into a specific, and somewhat unusual, area of parameter space. As ASASSN-15hy has a low Si velocity at maximum light, which translates into a relative large , previous sets of envelope models which detonate (Khokhlov et al., 1993; Hoeflich & Khokhlov, 1996; Quimby et al., 2007) predict a higher peak luminosity than majority of other 03fg-like events and generally slower rise and decline (Noebauer et al., 2016). The secondary model criteria such as and may be the keys to explain the peculiarity of ASASSN-15hy. The explanation under the DCD envelope model, the underlying physics, and the path to arrive at the best matching parameters are presented in Appendix D. Here we summarize the main results.
The best matching model (a slightly modified version of DCD07, see Appendix D.4) has the following parameters: , , , , , , and a total 56Ni mass . The large was required to produce long diffusion time scales and a broad light curve; a large is required to produce the low observed ejecta velocities exemplified by Si ii; the low metallicity produces the long rise and lack of line blanketing relative to the normal SNe Ia; and the low transition density or large ensures that the 56Ni mass is lower than that which is produced in other 03fg-like objects and thus, the luminosity of the SN is low. Finally, a small , which was determined by the velocity range of Si ii, produces an extended density enhancement in the outer layers of the ejecta rather than a confined density shell, which would be produced by larger envelope radii. The chemical structure is largely consistent with the observed velocity and velocity range of the ions (see Appendix D.2 and D.3). Note that up to 40% of the total luminosity comes in the form of hard X-rays and UV at early times in our model, as discussed in Appendix D.4.
In Fig. 15, the effects of metallicity and core mass are illustrated using the following models: the high () and low () DET2ENV6 model of Hoeflich & Khokhlov (1996) in the left panel and our best matching DCD07 with in comparison to DCD07 with in the right panel. The low-mass DET2ENV6 model has of , similar to the best matching parameter of ASASSN-15hy, but shows a rise time significantly shorter than the observation and a very asymmetric light curve. Moreover, its high leads to an optically thick C/O shell, and the low leads to a shorter rise time and faster evolution that is inconsistent with ASASSN-15hy. The DCD07 models (), as shown in the right panel of Fig. 15, provide overall matching light-curve shapes and luminosities as the observed ones. Comparing the and DCD07 models shows a more extended dark phase as increases, and the model is more consistent with the early ASAS-SN nondetections.
ASASSN-15hy requires a rather large envelope mass that has a significant amount of He left in the outer layers combined with a low metallicity and a late deflagration to detonation transition. The significant amount of helium and the low progenitor metallicity below that of the host galaxy points to an old, low-mass progenitor. Note that, despite the considerable amount of He, narrow He lines may not be detected due to the low opacity in the outer layer and gamma-ray trapping, such that the necessary gamma-rays to excite the He are not available (e.g., Graham, 1988). ASASSN-15hy is not a typical 03fg-like object compared to the current public sample. An analysis on larger sample is needed to determine whether the model parameter space of ASASSN-15hy is common for 03fg-like SNe or not.
6.3 DCD Models in Context
In the following discussion, we put ASASSN-15hy and our model in a larger context. The basic characteristics are the explosion of a degenerate core of embedded in a compact high-mass envelope with a significant fraction of He and low . The resulting explosion has a red color at maximum light for a 03fg-like object, a low luminosity, and took place in a low-metallicity galaxy with ongoing star formation.
The best matching model has a low transition density from deflagration to detonation (DDT) which results in an extend phase of the deflagration burning similar to the sublumious classical SNe Ia models. As discussed in Appendix D.4 a low metallicity and C/O ratio can be expected to shift the DDT to low densities (Poludnenko et al., 2019). Thus, the very low Z may be the key for understanding why ASASSN-15hy is a subluminous CD explosion.
Our analysis suggests that ASASSN-15hy can be described by the DCD scenario in which the explosion starts as a rather long deflagration phase and turns into a detonation. An initial deflagration requires a WD companion merging with the central core of an AGB star on secular time scales rather than on dynamical ones. This is similar to classical delayed detonation models, which have a long deflagration phase and low transition densities. These models may explain transitional and subluminous SNe Ia (Hoeflich et al., 2002; Patat et al., 2012; Hsiao et al., 2015; Ashall et al., 2016, 2018; Galbany et al., 2019).
In normal SNe Ia, a low transition density is rare and produces intrinsically red optical colors similar to that observed in ASASSN-15hy. Within the DCD framework, subluminous objects that behave like ASASSN-15hy should be rare and the low metallicity suggests that the progenitor may have been a Pop II/III star. Low-mass AGB stars in metal-poor environments are carbon stars with highly enhanced Ba and other s-process elements (Aaronson & Mould, 1980; Cohen et al., 2006; Kirby et al., 2015). Even though hydrogen is not apparent in the spectra and the limits for ongoing mass loss are rather low, hydrogen and s-process elements may be detectable when the ejecta have cleared the low-density cocoon that has a size of a few tenths to a few light years and was produced by prior mass-loss episodes (Dragulin & Hoeflich, 2016). We do not expect Balmer lines to appear right away, but when the envelope collides with the edge of the cocoon in yr. This collision may lead to a revival of X-ray emission.
For degenerate cores (or WDs), the C/O ratio increases with decreasing main sequence mass as a result of stellar evolution. At lower mass and hence lower central temperatures, during the central stellar He burning, capture on 12C dominates triple-, resulting in low C/O ratios (C/O ). The subsequent He-shell burning occurs at higher temperatures. Thus, shell burning results in ratios close to the statistical equilibrium (C/O ). Because of the size of the convective He burning core decreases with and (Domínguez et al., 2001), the overall C/O ratio also decreases with and . The CD scenario requires an explosion during the AGB phase. A common-envelope phase is more common for more massive stars. Stars of mass have evolutionary times of years and may be expected to be related to starburst episodes. Although there is a strong correlation between low-metallicity, starburst galaxies and 03fg-like in general (L. Galbany et al, in preparation), the progenitor system of ASASSN-15hy may have been produced in a previous episode of star formation. This may indicate that 03fg-like SNe come from a diverse group of progenitors.
6.4 Alternative Scenarios
Under the class of interaction or envelope models, several studies on 03fg-like objects have suggested that the origin of the envelope material could come from WD-WD mergers (e.g., Scalzo et al., 2010; Hachinger et al., 2012; Taubenberger et al., 2013; Noebauer et al., 2016). Here we briefly discuss the alternative progenitor systems based on the parameter space described above. However, numerical simulations and comparisons are beyond the scope of this work.
The dynamical merger of two WDs may be an alternative possible scenario for ASASSN-15hy and 03fg-like objects (e.g., Pakmor et al., 2010, 2012). This scenario may produce a similar overall structure, light curves, and spectra when compared to CDs of that undergo detonation burning. However, it is not obvious how, in this framework, one would produce an explosion with similar conditions as ASASSN-15hy. Our models of ASASSN-15hy require an extended nondegenerate envelope consisting of He/C/O without extensive mixing and high density outer material, which favors a CD/AGB scenario. Furthermore, a long deflagration phase is required to produce the low 56Ni mass, which cannot be achieved in a dynamical merger, since these models detonate. Finally a total ejecta mass exceeding the is required to produce the observed light curves. This may disfavor the secular merger scenario (Piersanti et al., 2003), which explodes near , as a viable scenario for ASASSN-15hy.
Though there is no polarimetric observations available for ASASSN-15hy, the lack of polarization in the other two 03fg-like explosions, SN 2009dc (Tanaka et al., 2010) and SN 2007if (Cikota et al., 2019), may disfavor explosion mechanisms with strong, large scale asymmetries, such as dynamical mergers (Bulla et al., 2016). However, this does not exclude the possibility that a majority of 03fg-like SNe are the result of dynamical mergers. ASASSN-15hy and LSQ14fmg (Hsiao et al., 2020) are consistent with the DCD scenario, however, these two are on the extreme ends among the current 03fg-like objects. A larger sample of 03fg-like events and larger scale of model comparison are needed for future analysis.
7 Conclusion
Photometric and spectroscopic observations of ASASSN-15hy have been presented, covering 12 to +155 d relative to -band maximum. ASASSN-15hy has many similar characteristics to previously discovered 03fg-like SNe Ia. However, ASASSN-15hy also shows its own uniqueness and provides additional insight into this peculiar subgroup.
ASASSN-15hy has the following properties that are similar to other 03fg-like SNe:
-
•
Slowly evolving (rise time = 22.5 4.6 d in -band) and broad light curves ( = 0.72 0.04 mag),
-
•
No distinct secondary maxima and peaking later than normal SNe Ia in the bands,
-
•
A relatively blue UVoptical color ( = mag at -band maximum),
-
•
Bright peak luminosity in both UV (M mag) and NIR ( 19.39 mag),
-
•
Weak Ca ii but strong and persistent C ii spectral feature,
-
•
A relatively low Si ii velocity ( km s-1 at maximum light) and lacks an early time rapid velocity decline,
-
•
No prominent -band break feature in the first month past -band maximum.
AMUSING observations show that the host of ASASSN-15hy is a low-mass, low-metallicity galaxy with a relatively young stellar population. These properties are generally consistent with other 03fg-like events. The host galaxy of ASASSN-15hy is barely visible in optical images, but in the H map, the host is clearly visible.
Despite similarities mentioned above with previously published 03fg-like SNe, ASASSN-15hy is unique in several ways. At optical wavelengths, it is dim compared with classical 03fg-like events and even when compared with normal SNe Ia with similar decline rates. It has a peak absolute magnitude of M mag, which is a mag dimmer than SN 2009dc and located below the LWR of normal SNe Ia. This makes ASASSN-15hy the faintest SN among the current 03fg-like SNe Ia sample. ASASSN-15hy is also the reddest and has a observed color of 0.18 0.01 mag at -band maximum, which is 0.1 mag redder than the average of other 03fg-like objects. Furthermore, ASASSN-15hy has the longest delayed onset of its -band primary peak relative to that in the band at 7.2 1.1 d.
We find that ASASSN-15hy is consistent with the “deflagration core-degenerate” scenario, which consists of the secular merger of the degenerate core of an AGB star and a WD inside the nondegenerate envelope of the AGB star. The best matching model has the parameters: , , , , , , and total . A large core mass is required in order to produce a broad light curve. To produce a slow expansion velocity and a narrow IME shell, a large envelope mass is needed. A major portion of this envelope consists of He, which does not add to the line opacity but contributes to the hydrodynamics in the ejecta. Critically, a long deflagration phase is required to produce the observed low luminosity and red color. Finally, a metallicity of is required to provide a small opacity and a dark phase on the rise, in order to match the early light curve and avoid producing significant line-blanketing to block the UV flux and over-redistribute the flux to the NIR.
The predominant host-galaxy type for 03fg-like objects has been low mass, low metallicity and star-forming, including ASASSN-15hy, meaning that these objects may be more common at high redshifts. This has direct consequences for high-redshift dark energy experiments. 03fg-like SNe Ia have similar light-curve shapes in the and bands compared to normal SNe Ia and therefore cannot be distinguished at high redshifts in these rest-frame bands alone. Observations of redder bands in the rest frame, such as band to NIR band, are required to identify 03fg-like SNe Ia through purely photometric means. Further studies on larger samples of 03fg-like SNe Ia are necessary to fully understand their impact on dark energy experiments. Overall, more observations are required to test the consistency of the model simulations to understand the physics of the progenitors and the explosions.
Acknowledgments
The authors would like to thank the anonymous referee for their useful comments. We thank the technical, scientific staff, and support astronomers of the Las Campanas Observatory and the ESO Telescopes at the Paranal Observatory. The CSP-II has been supported by NSF grants AST-1008343, AST-1613426, AST-1613455, AST-1613472, and the Danish Agency for Science and Technology and Innovation through a Sapere Aude Level 2 grant (PI: M.S.) C.A. is supported by the NSF grant AST #1908952. J.L., S.K., M.S., and E.Y.H acknowledge the support provided by the Florida Space Research Program. P.A.H. acknowledges the support by the National Science Foundation grant AST-1715133. L.G. acknowledges financial support from the Spanish Ministry of Science, Innovation and Universities (MICIU) under the 2019 Ramón y Cajal program RYC2019-027683 and from the Spanish MICIU project PID2020-115253GA-I00. E.B. was supported in part by NASA grant 80NSSC20K0538. M.D.S. is supported by generous grants from Villum FONDEN (13261, 28021) and by a project grant (8021-00170B) from the Independent Research Fund Denmark. Support for T.W.-S.H. was provided by NASA through the NASA Hubble Fellowship grant HST-HF2-51458.001-A awarded by the Space Telescope Science Institute, which is operated by the Association of Universities for Research in Astronomy, Inc., for NASA, under contract NAS5-26555. H.K. was funded by the Academy of Finland projects 324504 and 328898. Support for J.L.P. is provided in part by ANID through the Fondecyt regular grant 1191038 and through the Millennium Science Initiative grant ICN12009, awarded to The Millennium Institute of Astrophysics, MAS. Time domain research by D.J.S. is supported by NSF grants AST-1821987, 1813466, & 1908972, and by the Heising-Simons Foundation under grant #2020-1864. This paper includes data gathered with the 6.5 meter Magellan Telescopes located at Las Campanas Observatory, Chile, and is also based upon observations made with ESO Telescopes at the La Silla or Paranal Observatories under programme ID(s) 191.D-0935 and 099.D-0022(A). This work has been partially supported by the Spanish grant PGC2018-095317-B-C21 within the European Funds for Regional Development (FEDER). Finally, this paper is also includes observations obtained at the international Gemini Observatory (GN-2015A-Q-8, GS-2015A-Q-5), a program of NSF’s NOIRLab, which is managed by the Association of Universities for Research in Astronomy (AURA) under a cooperative agreement with the National Science Foundation. on behalf of the Gemini Observatory partnership: the National Science Foundation (United States), National Research Council (Canada), Agencia Nacional de Investigación y Desarrollo (Chile), Ministerio de Ciencia, Tecnología e Innovación (Argentina), Ministério da Ciência, Tecnologia, Inovações e Comunicações (Brazil), and Korea Astronomy and Space Science Institute (Republic of Korea).
: Swope (e2v), du Pont (RetroCam, WFCCD), , ASAS-SN, VLT (MUSE), NOT (ALFOSC), LT (SPART), FLWO 1.5m (FAST), Baade (FIRE), GN (GNIRS), GS (F2).
References
- Aaronson & Mould (1980) Aaronson, M., & Mould, J. 1980, ApJ, 240, 804, doi: 10.1086/158293
- Alard (2000) Alard, C. 2000, A&AS, 144, 363, doi: 10.1051/aas:2000214
- Alard & Lupton (1998) Alard, C., & Lupton, R. H. 1998, ApJ, 503, 325, doi: 10.1086/305984
- Arnett (1982) Arnett, W. D. 1982, ApJ, 253, 785, doi: 10.1086/159681
- Ashall et al. (2016) Ashall, C., Mazzali, P. A., Pian, E., & James, P. A. 2016, MNRAS, 463, 1891, doi: 10.1093/mnras/stw2114
- Ashall et al. (2018) Ashall, C., Mazzali, P. A., Stritzinger, M. D., et al. 2018, MNRAS, 477, 153, doi: 10.1093/mnras/sty632
- Ashall et al. (2019a) Ashall, C., Hoeflich, P., Hsiao, E. Y., et al. 2019a, ApJ, 878, 86, doi: 10.3847/1538-4357/ab204b
- Ashall et al. (2019b) Ashall, C., Hsiao, E. Y., Hoeflich, P., et al. 2019b, ApJ, 875, L14, doi: 10.3847/2041-8213/ab1654
- Ashall et al. (2020) Ashall, C., Lu, J., Burns, C., et al. 2020, ApJ, 895, L3, doi: 10.3847/2041-8213/ab8e37
- Ashall et al. (2021) Ashall, C., Lu, J., Hsiao, E. Y., et al. 2021, arXiv e-prints, arXiv:2106.12140. https://arxiv.org/abs/2106.12140
- Aznar-Siguán et al. (2015) Aznar-Siguán, G., García-Berro, E., Lorén-Aguilar, P., Soker, N., & Kashi, A. 2015, MNRAS, 450, 2948, doi: 10.1093/mnras/stv824
- Bacon et al. (2010) Bacon, R., Accardo, M., Adjali, L., et al. 2010, in Society of Photo-Optical Instrumentation Engineers (SPIE) Conference Series, Vol. 7735, Ground-based and Airborne Instrumentation for Astronomy III, ed. I. S. McLean, S. K. Ramsay, & H. Takami, 773508, doi: 10.1117/12.856027
- Baldwin et al. (1981) Baldwin, J. A., Phillips, M. M., & Terlevich, R. 1981, PASP, 93, 5, doi: 10.1086/130766
- Blinnikov & Sorokina (2010) Blinnikov, S. I., & Sorokina, E. I. 2010, arXiv e-prints, arXiv:1009.4353. https://arxiv.org/abs/1009.4353
- Branch et al. (1983) Branch, D., Lacy, C. H., McCall, M. L., et al. 1983, ApJ, 270, 123, doi: 10.1086/161103
- Branch et al. (2006) Branch, D., Dang, L. C., Hall, N., et al. 2006, PASP, 118, 560, doi: 10.1086/502778
- Brown et al. (2014a) Brown, P. J., Breeveld, A. A., Holland, S., Kuin, P., & Pritchard, T. 2014a, Ap&SS, 354, 89, doi: 10.1007/s10509-014-2059-8
- Brown et al. (2009) Brown, P. J., Holland, S. T., Immler, S., et al. 2009, AJ, 137, 4517, doi: 10.1088/0004-6256/137/5/4517
- Brown et al. (2014b) Brown, P. J., Kuin, P., Scalzo, R., et al. 2014b, ApJ, 787, 29, doi: 10.1088/0004-637X/787/1/29
- Bulla et al. (2016) Bulla, M., Sim, S. A., Pakmor, R., et al. 2016, MNRAS, 455, 1060, doi: 10.1093/mnras/stv2402
- Burns et al. (2011) Burns, C. R., Stritzinger, M., Phillips, M. M., et al. 2011, AJ, 141, 19, doi: 10.1088/0004-6256/141/1/19
- Burns et al. (2014) —. 2014, ApJ, 789, 32, doi: 10.1088/0004-637X/789/1/32
- Cardelli et al. (1989) Cardelli, J. A., Clayton, G. C., & Mathis, J. S. 1989, ApJ, 345, 245, doi: 10.1086/167900
- Chakradhari et al. (2014) Chakradhari, N. K., Sahu, D. K., Srivastav, S., & Anupama, G. C. 2014, MNRAS, 443, 1663, doi: 10.1093/mnras/stu1258
- Chen et al. (2019) Chen, P., Dong, S., Katz, B., et al. 2019, ApJ, 880, 35, doi: 10.3847/1538-4357/ab2630
- Childress et al. (2011) Childress, M., Aldering, G., Aragon, C., et al. 2011, ApJ, 733, 3, doi: 10.1088/0004-637X/733/1/3
- Childress et al. (2016) Childress, M. J., Tucker, B. E., Yuan, F., et al. 2016, PASA, 33, e055, doi: 10.1017/pasa.2016.47
- Cikota et al. (2019) Cikota, A., Patat, F., Wang, L., et al. 2019, MNRAS, 490, 578, doi: 10.1093/mnras/stz2322
- Cohen et al. (2006) Cohen, J. G., McWilliam, A., Shectman, S., et al. 2006, AJ, 132, 137, doi: 10.1086/504597
- Contreras et al. (2018) Contreras, C., Phillips, M. M., Burns, C. R., et al. 2018, ApJ, 859, 24, doi: 10.3847/1538-4357/aabaf8
- Dessart et al. (2014) Dessart, L., Blondin, S., Hillier, D. J., & Khokhlov, A. 2014, MNRAS, 441, 532, doi: 10.1093/mnras/stu598
- Diamond et al. (2015) Diamond, T. R., Hoeflich, P., & Gerardy, C. L. 2015, ApJ, 806, 107, doi: 10.1088/0004-637X/806/1/107
- Diamond et al. (2018) Diamond, T. R., Hoeflich, P., Hsiao, E. Y., et al. 2018, ApJ, 861, 119, doi: 10.3847/1538-4357/aac434
- Domínguez et al. (2001) Domínguez, I., Höflich, P., & Straniero, O. 2001, ApJ, 557, 279, doi: 10.1086/321661
- Dopita et al. (2007) Dopita, M., Hart, J., McGregor, P., et al. 2007, Ap&SS, 310, 255, doi: 10.1007/s10509-007-9510-z
- Dopita et al. (2010) Dopita, M., Rhee, J., Farage, C., et al. 2010, Ap&SS, 327, 245, doi: 10.1007/s10509-010-0335-9
- Dopita et al. (2016) Dopita, M. A., Kewley, L. J., Sutherland, R. S., & Nicholls, D. C. 2016, Ap&SS, 361, 61, doi: 10.1007/s10509-016-2657-8
- Dragulin & Hoeflich (2016) Dragulin, P., & Hoeflich, P. 2016, ApJ, 818, 26, doi: 10.3847/0004-637X/818/1/26
- Eikenberry et al. (2008) Eikenberry, S., Elston, R., Raines, S. N., et al. 2008, in Proc. SPIE, Vol. 7014, Ground-based and Airborne Instrumentation for Astronomy II, 70140V, doi: 10.1117/12.788326
- Elias et al. (1985) Elias, J. H., Matthews, K., Neugebauer, G., & Persson, S. E. 1985, ApJ, 296, 379, doi: 10.1086/163456
- Elias et al. (1998) Elias, J. H., Vukobratovich, D., Andrew, J. R., et al. 1998, in Proc. SPIE, Vol. 3354, Infrared Astronomical Instrumentation, ed. A. M. Fowler, 555–565, doi: 10.1117/12.317281
- Fabricant et al. (1998) Fabricant, D., Cheimets, P., Caldwell, N., & Geary, J. 1998, PASP, 110, 79, doi: 10.1086/316111
- Filippenko et al. (1992a) Filippenko, A. V., Richmond, M. W., Matheson, T., et al. 1992a, ApJ, 384, L15, doi: 10.1086/186252
- Filippenko et al. (1992b) Filippenko, A. V., Richmond, M. W., Branch, D., et al. 1992b, AJ, 104, 1543, doi: 10.1086/116339
- Fink et al. (2018) Fink, M., Kromer, M., Hillebrandt, W., et al. 2018, A&A, 618, A124, doi: 10.1051/0004-6361/201833475
- Fisher et al. (1999) Fisher, A., Branch, D., Hatano, K., & Baron, E. 1999, MNRAS, 304, 67, doi: 10.1046/j.1365-8711.1999.02299.x
- Folatelli et al. (2012) Folatelli, G., Phillips, M. M., Morrell, N., et al. 2012, ApJ, 745, 74, doi: 10.1088/0004-637X/745/1/74
- Folatelli et al. (2013) Folatelli, G., Morrell, N., Phillips, M. M., et al. 2013, ApJ, 773, 53, doi: 10.1088/0004-637X/773/1/53
- Foley et al. (2010) Foley, R. J., Narayan, G., Challis, P. J., et al. 2010, ApJ, 708, 1748, doi: 10.1088/0004-637X/708/2/1748
- Friedman et al. (2015) Friedman, A. S., Wood-Vasey, W. M., Marion, G. H., et al. 2015, ApJS, 220, 9, doi: 10.1088/0067-0049/220/1/9
- Frohmaier et al. (2015) Frohmaier, C., Prajs, S., Dennefeld, M., et al. 2015, The Astronomer’s Telegram, 7452, 1
- Fryer et al. (2010) Fryer, C. L., Ruiter, A. J., Belczynski, K., et al. 2010, ApJ, 725, 296, doi: 10.1088/0004-637X/725/1/296
- Galbany et al. (2014) Galbany, L., Stanishev, V., Mourão, A. M., et al. 2014, A&A, 572, A38, doi: 10.1051/0004-6361/201424717
- Galbany et al. (2016a) Galbany, L., Anderson, J. P., Rosales-Ortega, F. F., et al. 2016a, MNRAS, 455, 4087, doi: 10.1093/mnras/stv2620
- Galbany et al. (2016b) Galbany, L., Stanishev, V., Mourão, A. M., et al. 2016b, A&A, 591, A48, doi: 10.1051/0004-6361/201528045
- Galbany et al. (2019) Galbany, L., Ashall, C., Höflich, P., et al. 2019, A&A, 630, A76, doi: 10.1051/0004-6361/201935537
- Gall et al. (2012) Gall, E. E. E., Taubenberger, S., Kromer, M., et al. 2012, MNRAS, 427, 994, doi: 10.1111/j.1365-2966.2012.21999.x
- Gehrels et al. (2004) Gehrels, N., Chincarini, G., Giommi, P., et al. 2004, ApJ, 611, 1005, doi: 10.1086/422091
- Gerardy et al. (2007) Gerardy, C. L., Meikle, W. P. S., Kotak, R., et al. 2007, ApJ, 661, 995, doi: 10.1086/516728
- Graham (1988) Graham, J. R. 1988, ApJ, 335, L53, doi: 10.1086/185338
- Hachinger et al. (2012) Hachinger, S., Mazzali, P. A., Taubenberger, S., et al. 2012, MNRAS, 427, 2057, doi: 10.1111/j.1365-2966.2012.22068.x
- Hachisu et al. (2012) Hachisu, I., Kato, M., Saio, H., & Nomoto, K. 2012, ApJ, 744, 69, doi: 10.1088/0004-637X/744/1/69
- Henden et al. (2015) Henden, A. A., Levine, S., Terrell, D., & Welch, D. L. 2015, in American Astronomical Society Meeting Abstracts, Vol. 225, American Astronomical Society Meeting Abstracts #225, 336.16
- Hicken et al. (2007) Hicken, M., Garnavich, P. M., Prieto, J. L., et al. 2007, ApJ, 669, L17, doi: 10.1086/523301
- Hicken et al. (2012) Hicken, M., Challis, P., Kirshner, R. P., et al. 2012, ApJS, 200, 12, doi: 10.1088/0067-0049/200/2/12
- Hoeflich (1990) Hoeflich, P. 1990, A&A, 229, 191
- Hoeflich (1995) —. 1995, ApJ, 443, 89, doi: 10.1086/175505
- Hoeflich (2003) Hoeflich, P. 2003, in Astronomical Society of the Pacific Conference Series, Vol. 288, Stellar Atmosphere Modeling, ed. I. Hubeny, D. Mihalas, & K. Werner, 185
- Hoeflich (2009) Hoeflich, P. 2009, in American Institute of Physics Conference Series, Vol. 1171, Recent Directions in Astrophysical Quantitative Spectroscopy and Radiation Hydrodynamics, ed. I. Hubeny, J. M. Stone, K. MacGregor, & K. Werner, 161–172, doi: 10.1063/1.3250057
- Hoeflich et al. (2002) Hoeflich, P., Gerardy, C. L., Fesen, R. A., & Sakai, S. 2002, ApJ, 568, 791, doi: 10.1086/339063
- Hoeflich & Khokhlov (1996) Hoeflich, P., & Khokhlov, A. 1996, ApJ, 457, 500, doi: 10.1086/176748
- Hoeflich et al. (1995) Hoeflich, P., Khokhlov, A. M., & Wheeler, J. C. 1995, ApJ, 444, 831, doi: 10.1086/175656
- Hoeflich et al. (1993) Hoeflich, P., Mueller, E., & Khokhlov, A. 1993, A&A, 268, 570
- Hoeflich et al. (1998) Hoeflich, P., Wheeler, J. C., & Thielemann, F. K. 1998, ApJ, 495, 617, doi: 10.1086/305327
- Hoeflich et al. (2017) Hoeflich, P., Hsiao, E. Y., Ashall, C., et al. 2017, ApJ, 846, 58, doi: 10.3847/1538-4357/aa84b2
- Hoeflich et al. (2019) Hoeflich, P., Ashall, C., Fisher, A., et al. 2019, in Nuclei in the Cosmos XV, Vol. 219, 187–194, doi: 10.1007/978-3-030-13876-9_31
- Höflich (2003) Höflich, P. 2003, in Astronomical Society of the Pacific Conference Series, Vol. 288, Stellar Atmosphere Modeling, ed. I. Hubeny, D. Mihalas, & K. Werner, 185
- Holoien et al. (2015) Holoien, T. W. S., Stanek, K. Z., Kochanek, C. S., et al. 2015, The Astronomer’s Telegram, 7450, 1
- Howell et al. (2006) Howell, D. A., Sullivan, M., Nugent, P. E., et al. 2006, Nature, 443, 308, doi: 10.1038/nature05103
- Hoyle & Fowler (1960) Hoyle, F., & Fowler, W. A. 1960, ApJ, 132, 565, doi: 10.1086/146963
- Hristov et al. (2018) Hristov, B., Collins, D. C., Hoeflich, P., Weatherford, C. A., & Diamond, T. R. 2018, ApJ, 858, 13, doi: 10.3847/1538-4357/aab7f2
- Hsiao et al. (2007) Hsiao, E. Y., Conley, A., Howell, D. A., et al. 2007, ApJ, 663, 1187, doi: 10.1086/518232
- Hsiao et al. (2013) Hsiao, E. Y., Marion, G. H., Phillips, M. M., et al. 2013, ApJ, 766, 72, doi: 10.1088/0004-637X/766/2/72
- Hsiao et al. (2015) Hsiao, E. Y., Burns, C. R., Contreras, C., et al. 2015, A&A, 578, A9, doi: 10.1051/0004-6361/201425297
- Hsiao et al. (2019) Hsiao, E. Y., Philips, M. M., Marion, G. H., et al. 2019, PASP, 131, 014002, doi: 10.1088/1538-3873/aae961
- Hsiao et al. (2020) Hsiao, E. Y., Hoeflich, P., Ashall, C., et al. 2020, ApJ, 900, 140, doi: 10.3847/1538-4357/abaf4c
- Iben & Tutukov (1984) Iben, Jr., I., & Tutukov, A. V. 1984, ApJS, 54, 335, doi: 10.1086/190932
- Ilkov & Soker (2012) Ilkov, M., & Soker, N. 2012, MNRAS, 419, 1695, doi: 10.1111/j.1365-2966.2011.19833.x
- Karp et al. (1977) Karp, A. H., Lasher, G., Chan, K. L., & Salpeter, E. E. 1977, ApJ, 214, 161, doi: 10.1086/155241
- Kashi & Soker (2011) Kashi, A., & Soker, N. 2011, MNRAS, 417, 1466, doi: 10.1111/j.1365-2966.2011.19361.x
- Katz & Dong (2012) Katz, B., & Dong, S. 2012, arXiv e-prints, arXiv:1211.4584. https://arxiv.org/abs/1211.4584
- Kewley et al. (2001) Kewley, L. J., Dopita, M. A., Sutherland, R. S., Heisler, C. A., & Trevena, J. 2001, ApJ, 556, 121, doi: 10.1086/321545
- Khan et al. (2011) Khan, R., Stanek, K. Z., Stoll, R., & Prieto, J. L. 2011, ApJ, 737, L24, doi: 10.1088/2041-8205/737/1/L24
- Khokhlov et al. (1993) Khokhlov, A., Mueller, E., & Hoeflich, P. 1993, Astronomy and Astrophysics, 270, 223
- Khokhlov (1995) Khokhlov, A. M. 1995, ApJ, 449, 695, doi: 10.1086/176091
- Khokhlov et al. (1997) Khokhlov, A. M., Oran, E. S., & Wheeler, J. C. 1997, ApJ, 478, 678, doi: 10.1086/303815
- Kirby et al. (2015) Kirby, E. N., Guo, M., Zhang, A. J., et al. 2015, ApJ, 801, 125, doi: 10.1088/0004-637X/801/2/125
- Kirshner et al. (1973) Kirshner, R. P., Willner, S. P., Becklin, E. E., Neugebauer, G., & Oke, J. B. 1973, ApJ, 180, L97, doi: 10.1086/181161
- Kochanek et al. (2017) Kochanek, C. S., Shappee, B. J., Stanek, K. Z., et al. 2017, PASP, 129, 104502, doi: 10.1088/1538-3873/aa80d9
- Krisciunas et al. (2017) Krisciunas, K., Contreras, C., Burns, C. R., et al. 2017, AJ, 154, 211, doi: 10.3847/1538-3881/aa8df0
- Kuncarayakti et al. (2018) Kuncarayakti, H., Anderson, J. P., Galbany, L., et al. 2018, A&A, 613, A35, doi: 10.1051/0004-6361/201731923
- Kushnir et al. (2013) Kushnir, D., Katz, B., Dong, S., Livne, E., & Fernández, R. 2013, ApJ, 778, L37, doi: 10.1088/2041-8205/778/2/L37
- Lentz et al. (2000) Lentz, E. J., Baron, E., Branch, D., Hauschildt, P. H., & Nugent, P. E. 2000, ApJ, 530, 966, doi: 10.1086/308400
- Lira (1996) Lira, P. 1996, Master’s thesis, Universidad de Chile
- Livio & Riess (2003) Livio, M., & Riess, A. G. 2003, ApJ, 594, L93, doi: 10.1086/378765
- Livne (1999) Livne, E. 1999, ApJ, 527, L97, doi: 10.1086/312405
- Maeda et al. (2009) Maeda, K., Kawabata, K., Li, W., et al. 2009, ApJ, 690, 1745, doi: 10.1088/0004-637X/690/2/1745
- Maoz et al. (2014) Maoz, D., Mannucci, F., & Nelemans, G. 2014, ARA&A, 52, 107, doi: 10.1146/annurev-astro-082812-141031
- Marino et al. (2013) Marino, R. A., Rosales-Ortega, F. F., Sánchez, S. F., et al. 2013, A&A, 559, A114, doi: 10.1051/0004-6361/201321956
- Marion et al. (2009) Marion, G. H., Höflich, P., Gerardy, C. L., et al. 2009, AJ, 138, 727, doi: 10.1088/0004-6256/138/3/727
- Matheson et al. (2005) Matheson, T., Blondin, S., Foley, R. J., et al. 2005, AJ, 129, 2352, doi: 10.1086/429679
- Mazzali et al. (2001) Mazzali, P. A., Nomoto, K., Cappellaro, E., et al. 2001, ApJ, 547, 988, doi: 10.1086/318428
- Mazzali et al. (2007) Mazzali, P. A., Röpke, F. K., Benetti, S., & Hillebrandt, W. 2007, Science, 315, 825, doi: 10.1126/science.1136259
- Mihalas (1978) Mihalas, D. 1978, Stellar Atmospheres, 2nd edn. (New York: W. H. Freeman)
- Milne et al. (2013) Milne, P. A., Brown, P. J., Roming, P. W. A., Bufano, F., & Gehrels, N. 2013, ApJ, 779, 23, doi: 10.1088/0004-637X/779/1/23
- Mould et al. (2000) Mould, J. R., Huchra, J. P., Freedman, W. L., et al. 2000, ApJ, 529, 786, doi: 10.1086/308304
- Nagao et al. (2017) Nagao, T., Maeda, K., & Yamanaka, M. 2017, ApJ, 835, 143, doi: 10.3847/1538-4357/835/2/143
- Niemeyer et al. (1996) Niemeyer, J. C., Hillebrandt, W., & Woosley, S. E. 1996, ApJ, 471, 903, doi: 10.1086/178017
- Noebauer et al. (2016) Noebauer, U. M., Taubenberger, S., Blinnikov, S., Sorokina, E., & Hillebrandt, W. 2016, MNRAS, 463, 2972, doi: 10.1093/mnras/stw2197
- Nomoto (1982) Nomoto, K. 1982, ApJ, 253, 798, doi: 10.1086/159682
- Nomoto et al. (1984) Nomoto, K., Thielemann, F.-K., & Yokoi, K. 1984, ApJ, 286, 644, doi: 10.1086/162639
- Nugent et al. (1995) Nugent, P., Phillips, M., Baron, E., Branch, D., & Hauschildt, P. 1995, ApJ, 455, L147, doi: 10.1086/309846
- Oke & Sandage (1968) Oke, J. B., & Sandage, A. 1968, ApJ, 154, 21, doi: 10.1086/149737
- Oke et al. (1995) Oke, J. B., Cohen, J. G., Carr, M., et al. 1995, PASP, 107, 375, doi: 10.1086/133562
- Pakmor et al. (2010) Pakmor, R., Kromer, M., Röpke, F. K., et al. 2010, Nature, 463, 61, doi: 10.1038/nature08642
- Pakmor et al. (2012) Pakmor, R., Kromer, M., Taubenberger, S., et al. 2012, ApJ, 747, L10. https://arxiv.org/abs/1201.5123
- Parrent et al. (2011) Parrent, J. T., Thomas, R. C., Fesen, R. A., et al. 2011, ApJ, 732, 30, doi: 10.1088/0004-637X/732/1/30
- Parrent et al. (2016) Parrent, J. T., Howell, D. A., Fesen, R. A., et al. 2016, MNRAS, 457, 3702, doi: 10.1093/mnras/stw239
- Patat et al. (2012) Patat, F., Höflich, P., Baade, D., et al. 2012, A&A, 545, A7, doi: 10.1051/0004-6361/201219146
- Pejcha et al. (2013) Pejcha, O., Antognini, J. M., Shappee, B. J., & Thompson, T. A. 2013, MNRAS, 435, 943, doi: 10.1093/mnras/stt1281
- Penney & Hoeflich (2014) Penney, R., & Hoeflich, P. 2014, ApJ, 795, 84, doi: 10.1088/0004-637X/795/1/84
- Perlmutter et al. (1999) Perlmutter, S., Aldering, G., Goldhaber, G., et al. 1999, ApJ, 517, 565, doi: 10.1086/307221
- Pfannes et al. (2010) Pfannes, J. M. M., Niemeyer, J. C., & Schmidt, W. 2010, A&A, 509, A75, doi: 10.1051/0004-6361/200912033
- Phillips (1993) Phillips, M. M. 1993, ApJ, 413, L105, doi: 10.1086/186970
- Phillips et al. (1999) Phillips, M. M., Lira, P., Suntzeff, N. B., et al. 1999, AJ, 118, 1766, doi: 10.1086/301032
- Phillips et al. (2013) Phillips, M. M., Simon, J. D., Morrell, N., et al. 2013, ApJ, 779, 38, doi: 10.1088/0004-637X/779/1/38
- Phillips et al. (2019) Phillips, M. M., Contreras, C., Hsiao, E. Y., et al. 2019, PASP, 131, 014001, doi: 10.1088/1538-3873/aae8bd
- Piascik et al. (2014) Piascik, A. S., Steele, I. A., Bates, S. D., et al. 2014, in Society of Photo-Optical Instrumentation Engineers (SPIE) Conference Series, Vol. 9147, Ground-based and Airborne Instrumentation for Astronomy V, 91478H, doi: 10.1117/12.2055117
- Piersanti et al. (2003) Piersanti, L., Gagliardi, S., Iben, Icko, J., & Tornambé, A. 2003, ApJ, 598, 1229, doi: 10.1086/378952
- Poludnenko et al. (2019) Poludnenko, A. Y., Chambers, J., Ahmed, K., Gamezo, V. N., & Taylor, B. D. 2019, Science, 366, aau7365, doi: 10.1126/science.aau7365
- Poludnenko et al. (2011) Poludnenko, A. Y., Gardiner, T. A., & Oran, E. S. 2011, Physical Review Letters, 107, 054501, doi: 10.1103/PhysRevLett.107.054501
- Poznanski et al. (2012) Poznanski, D., Prochaska, J. X., & Bloom, J. S. 2012, MNRAS, 426, 1465, doi: 10.1111/j.1365-2966.2012.21796.x
- Pskovskii (1977) Pskovskii, I. P. 1977, Soviet Ast., 21, 675
- Quimby et al. (2006) Quimby, R., Höflich, P., Kannappan, S. J., et al. 2006, ApJ, 636, 400, doi: 10.1086/498014
- Quimby et al. (2007) Quimby, R., Höflich, P., & Wheeler, J. C. 2007, ApJ, 666, 1083, doi: 10.1086/520527
- Rasmussen & Williams (2005) Rasmussen, C. E., & Williams, C. K. I. 2005, Gaussian Processes for Machine Learning (Adaptive Computation and Machine Learning) (The MIT Press)
- Riess et al. (1998) Riess, A. G., Filippenko, A. V., Challis, P., et al. 1998, AJ, 116, 1009, doi: 10.1086/300499
- Riess et al. (2007) Riess, A. G., Strolger, L.-G., Casertano, S., et al. 2007, ApJ, 659, 98, doi: 10.1086/510378
- Roming et al. (2005) Roming, P. W. A., Kennedy, T. E., Mason, K. O., et al. 2005, Space Sci. Rev., 120, 95, doi: 10.1007/s11214-005-5095-4
- Rosswog et al. (2009) Rosswog, S., Kasen, D., Guillochon, J., & Ramirez-Ruiz, E. 2009, ApJ, 705, L128, doi: 10.1088/0004-637X/705/2/L128
- Scalzo et al. (2012) Scalzo, R., Aldering, G., Antilogus, P., et al. 2012, ApJ, 757, 12, doi: 10.1088/0004-637X/757/1/12
- Scalzo et al. (2010) Scalzo, R. A., Aldering, G., Antilogus, P., et al. 2010, ApJ, 713, 1073, doi: 10.1088/0004-637X/713/2/1073
- Scalzo et al. (2014) Scalzo, R. A., Childress, M., Tucker, B., et al. 2014, MNRAS, 445, 30, doi: 10.1093/mnras/stu1723
- Schlafly & Finkbeiner (2011) Schlafly, E. F., & Finkbeiner, D. P. 2011, ApJ, 737, 103, doi: 10.1088/0004-637X/737/2/103
- Shappee et al. (2014) Shappee, B. J., Prieto, J. L., Grupe, D., et al. 2014, ApJ, 788, 48, doi: 10.1088/0004-637X/788/1/48
- Sharp & Hoeflich (1990) Sharp, C. M., & Hoeflich, P. 1990, Ap&SS, 171, 213
- Shen & Moore (2014) Shen, K. J., & Moore, K. 2014, ApJ, 797, 46, doi: 10.1088/0004-637X/797/1/46
- Silverman et al. (2011) Silverman, J. M., Ganeshalingam, M., Li, W., et al. 2011, MNRAS, 410, 585, doi: 10.1111/j.1365-2966.2010.17474.x
- Simcoe et al. (2013) Simcoe, R. A., Burgasser, A. J., Schechter, P. L., et al. 2013, PASP, 125, 270, doi: 10.1086/670241
- Smartt et al. (2015) Smartt, S. J., Valenti, S., Fraser, M., et al. 2015, A&A, 579, A40, doi: 10.1051/0004-6361/201425237
- Stahl et al. (2020) Stahl, B. E., Zheng, W., de Jaeger, T., et al. 2020, MNRAS, 492, 4325, doi: 10.1093/mnras/staa102
- Steele et al. (2004) Steele, I. A., Smith, R. J., Rees, P. C., et al. 2004, in Society of Photo-Optical Instrumentation Engineers (SPIE) Conference Series, Vol. 5489, Ground-based Telescopes, ed. J. Oschmann, Jacobus M., 679–692, doi: 10.1117/12.551456
- Stritzinger et al. (2011) Stritzinger, M. D., Phillips, M. M., Boldt, L. N., et al. 2011, AJ, 142, 156, doi: 10.1088/0004-6256/142/5/156
- Stritzinger et al. (2015) Stritzinger, M. D., Valenti, S., Hoeflich, P., et al. 2015, A&A, 573, A2, doi: 10.1051/0004-6361/201424168
- Sullivan et al. (2011) Sullivan, M., Guy, J., Conley, A., et al. 2011, ApJ, 737, 102, doi: 10.1088/0004-637X/737/2/102
- Suzuki et al. (2012) Suzuki, N., Rubin, D., Lidman, C., et al. 2012, ApJ, 746, 85, doi: 10.1088/0004-637X/746/1/85
- Tanaka et al. (2010) Tanaka, M., Kawabata, K. S., Yamanaka, M., et al. 2010, ApJ, 714, 1209, doi: 10.1088/0004-637X/714/2/1209
- Taubenberger (2017) Taubenberger, S. 2017, The Extremes of Thermonuclear Supernovae, ed. A. W. Alsabti & P. Murdin, 317, doi: 10.1007/978-3-319-21846-5_37
- Taubenberger et al. (2011) Taubenberger, S., Benetti, S., Childress, M., et al. 2011, MNRAS, 412, 2735, doi: 10.1111/j.1365-2966.2010.18107.x
- Taubenberger et al. (2013) Taubenberger, S., Kromer, M., Hachinger, S., et al. 2013, MNRAS, 432, 3117, doi: 10.1093/mnras/stt668
- Taubenberger et al. (2019) Taubenberger, S., Floers, A., Vogl, C., et al. 2019, MNRAS, 488, 5473, doi: 10.1093/mnras/stz1977
- Telesco et al. (2015) Telesco, C. M., Höflich, P., Li, D., et al. 2015, ApJ, 798, 93, doi: 10.1088/0004-637X/798/2/93
- Thompson (2011) Thompson, T. A. 2011, ApJ, 741, 82, doi: 10.1088/0004-637X/741/2/82
- Walker et al. (2012) Walker, E. S., Hachinger, S., Mazzali, P. A., et al. 2012, MNRAS, 427, 103, doi: 10.1111/j.1365-2966.2012.21928.x
- Webbink (1984) Webbink, R. F. 1984, ApJ, 277, 355, doi: 10.1086/161701
- Wheeler et al. (1998) Wheeler, J. C., Höflich, P., Harkness, R. P., & Spyromilio, J. 1998, ApJ, 496, 908, doi: 10.1086/305427
- Whelan & Iben (1973) Whelan, J., & Iben, Jr., I. 1973, ApJ, 186, 1007, doi: 10.1086/152565
- Wyatt et al. (2021) Wyatt, S. D., Sand, D. J., Hsiao, E. Y., et al. 2021, ApJ, 914, 57, doi: 10.3847/1538-4357/abf7c3
- Yamanaka et al. (2009) Yamanaka, M., Kawabata, K. S., Kinugasa, K., et al. 2009, ApJ, 707, L118, doi: 10.1088/0004-637X/707/2/L118
- Yamanaka et al. (2016) Yamanaka, M., Maeda, K., Tanaka, M., et al. 2016, PASJ, 68, 68, doi: 10.1093/pasj/psw047
- Yaron & Gal-Yam (2012) Yaron, O., & Gal-Yam, A. 2012, PASP, 124, 668, doi: 10.1086/666656
- Yoon & Langer (2005) Yoon, S. C., & Langer, N. 2005, A&A, 435, 967, doi: 10.1051/0004-6361:20042542
- Yuan et al. (2010) Yuan, F., Quimby, R. M., Wheeler, J. C., et al. 2010, ApJ, 715, 1338, doi: 10.1088/0004-637X/715/2/1338
- Zhang et al. (2016) Zhang, K., Wang, X., Zhang, J., et al. 2016, ApJ, 820, 67, doi: 10.3847/0004-637X/820/1/67
Appendix A Photometry and Observational Logs
Figure A16 presents the -band finding chart of ASASSN-15hy with the positions of the local-sequence stars, used for CSP-II photometric observations at LCO. ASAS-SN -band nondetection limits and photometric observations, in the standard system, are tabulated in Table 4. The CSP-II optical photometry of ASASSN-15hy is presented in the natural system (see Section 5.1 of Krisciunas et al. 2017) of the Swope+e2v (Phillips et al., 2019) in Table 5. The host subtracted UVOT photometry is shown in Table 6. The CSP-II NIR photometry is presented in the natural system of the du Pont+RetroCam in Table 7.
Among the previously published optical spectra, twelve were taken with KAST double spectrograph on the 3-m Shane telescope at the Lick Observatory and the LRIS (Oke et al., 1995) on the 10-m Keck-I telescope at the W.M. Keck Observatory and were published by Stahl et al. (2020). Another previously published series was obtained with the WiFeS instrument (Dopita et al., 2007, 2010) on the Australian National University 2.3-m telescope (ANU) as part of the ANU WiFeS SuperNovA Programme (AWSNAP, Childress et al. 2016). Note that red and blue spectra observed on the same night were merged, yielding nine spectra in total from WiFeS. One classification spectrum taken with the EFOSC2 on the ESO New Technology Telescope (NTT) by the PESSTO program (Smartt et al., 2015) is also included and is publicly available on WISeREP (Yaron & Gal-Yam, 2012). A log of the spectroscopic observations of ASASSN-15hy is given in Table 8. The phases in all tables are expressed in rest-frame phase in days with respect to -band maximum JD = 2457151.6 0.4.

| JD | UT Date | Phase | mag(err) |
|---|---|---|---|
| 2457100.2 | 2015-03-18 | 50.5 | 17.11 |
| 2457108.9 | 2015-03-27 | 42.0 | 17.90 |
| 2457115.9 | 2015-04-03 | 35.1 | 16.73 |
| 2457116.9 | 2015-04-04 | 34.1 | 16.97 |
| 2457117.9 | 2015-04-05 | 33.1 | 17.19 |
| 2457129.8 | 2015-04-17 | 21.4 | 18.03 |
| 2457133.8 | 2015-04-21 | 17.5 | 17.53 |
| 2457137.8 | 2015-04-25 | 13.6 | 16.42(0.10) |
| 2457138.8 | 2015-04-26 | 12.6 | 16.42(0.09) |
| 2457139.8 | 2015-04-27 | 11.6 | 16.12(0.08) |
| 2457143.9 | 2015-05-01 | 7.6 | 15.90(0.06) |
| 2457147.8 | 2015-05-05 | 3.8 | 15.52(0.12) |
| 2457154.8 | 2015-05-12 | 3.1 | 15.37(0.05) |
| 2457155.8 | 2015-05-13 | 4.1 | 15.51(0.05) |
| 2457156.1 | 2015-05-13 | 4.4 | 15.42(0.05) |
| 2457157.1 | 2015-05-14 | 5.4 | 15.42(0.05) |
| 2457158.1 | 2015-05-15 | 6.4 | 15.48(0.05) |
| 2457160.8 | 2015-05-18 | 9.0 | 15.48(0.06) |
| 2457164.7 | 2015-05-22 | 12.8 | 15.51(0.06) |
| 2457168.9 | 2015-05-26 | 17.0 | 15.88(0.06) |
| 2457173.9 | 2015-05-31 | 21.9 | 15.96(0.09) |
| 2457181.8 | 2015-06-08 | 29.6 | 16.30(0.10) |
| 2457182.7 | 2015-06-09 | 30.5 | 16.52(0.14) |
| 2457185.0 | 2015-06-11 | 32.8 | 16.59(0.13) |
| 2457186.8 | 2015-06-13 | 34.5 | 16.45(0.09) |
| 2457189.7 | 2015-06-16 | 37.4 | 16.57(0.13) |
| 2457190.7 | 2015-06-17 | 38.4 | 16.33(0.09) |
| 2457199.1 | 2015-06-25 | 46.6 | 16.72(0.07) |
| 2457228.1 | 2015-07-24 | 75.1 | 17.48(0.13) |
| 2457244.2 | 2015-08-09 | 90.9 | 17.65(0.15) |
| JD | Phase | ||||||
|---|---|---|---|---|---|---|---|
| 2457139.9 | 11.5 | 16.33(0.01) | 16.12(0.01) | 16.21(0.01) | 16.11(0.01) | 16.05(0.01) | 16.17(0.01) |
| 2457140.9 | 10.6 | 16.27(0.01) | 16.03(0.01) | 16.11(0.01) | 16.01(0.01) | 15.96(0.01) | 16.08(0.01) |
| 2457141.9 | 9.6 | 16.22(0.01) | 15.94(0.01) | 16.03(0.01) | 15.93(0.01) | 15.82(0.01) | 15.95(0.01) |
| 2457142.9 | 8.6 | 16.18(0.01) | 15.86(0.01) | 15.96(0.01) | 15.85(0.01) | 15.78(0.02) | … |
| 2457143.8 | 7.6 | 16.18(0.01) | 15.81(0.01) | 15.90(0.01) | 15.78(0.01) | 15.69(0.01) | 15.84(0.01) |
| 2457144.9 | 6.6 | 16.14(0.01) | 15.74(0.01) | 15.83(0.01) | 15.69(0.01) | 15.61(0.01) | 15.79(0.01) |
| 2457145.8 | 5.7 | 16.13(0.01) | 15.70(0.01) | 15.79(0.01) | 15.64(0.01) | 15.59(0.01) | 15.71(0.01) |
| 2457146.9 | 4.7 | 16.14(0.01) | 15.65(0.01) | 15.77(0.01) | 15.60(0.01) | 15.48(0.01) | 15.67(0.01) |
| 2457151.9 | 0.2 | 16.21(0.01) | 15.55(0.01) | 15.69(0.01) | 15.42(0.01) | 15.31(0.01) | 15.55(0.01) |
| 2457152.9 | 1.2 | 16.25(0.01) | 15.53(0.01) | 15.69(0.01) | 15.40(0.01) | 15.29(0.01) | 15.49(0.01) |
| 2457153.9 | 2.2 | 16.28(0.01) | 15.54(0.01) | 15.72(0.01) | 15.40(0.01) | 15.30(0.01) | 15.53(0.01) |
| 2457154.9 | 3.2 | 16.32(0.01) | 15.56(0.01) | 15.75(0.01) | 15.40(0.01) | 15.25(0.01) | 15.47(0.01) |
| 2457155.9 | 4.2 | 16.37(0.01) | 15.56(0.01) | 15.78(0.01) | 15.38(0.01) | 15.27(0.01) | 15.46(0.01) |
| 2457156.9 | 5.1 | 16.40(0.03) | 15.60(0.01) | 15.78(0.02) | 15.40(0.02) | 15.26(0.01) | 15.48(0.01) |
| 2457157.8 | 6.1 | 16.45(0.01) | 15.61(0.01) | 15.84(0.01) | 15.42(0.01) | 15.26(0.01) | 15.46(0.01) |
| 2457158.9 | 7.1 | 16.55(0.01) | 15.65(0.01) | 15.88(0.01) | 15.42(0.01) | 15.27(0.01) | 15.45(0.01) |
| 2457159.9 | 8.1 | 16.64(0.01) | 15.69(0.01) | 15.95(0.01) | 15.44(0.01) | 15.27(0.01) | 15.45(0.01) |
| 2457160.9 | 9.1 | 16.72(0.01) | 15.75(0.01) | 16.00(0.01) | 15.48(0.01) | 15.30(0.01) | 15.47(0.01) |
| 2457161.9 | 10.1 | 16.81(0.01) | 15.79(0.01) | 16.08(0.01) | 15.49(0.01) | 15.27(0.01) | 15.46(0.02) |
| 2457162.9 | 11.0 | 16.91(0.01) | 15.85(0.01) | 16.14(0.01) | 15.52(0.01) | 15.32(0.01) | 15.48(0.01) |
| 2457163.9 | 12.0 | 17.03(0.01) | 15.91(0.01) | 16.20(0.01) | 15.56(0.01) | 15.34(0.01) | 15.46(0.01) |
| 2457164.9 | 13.0 | 17.14(0.01) | 15.97(0.01) | 16.29(0.01) | 15.61(0.01) | 15.35(0.01) | 15.50(0.01) |
| 2457166.9 | 14.9 | 17.35(0.01) | 16.12(0.01) | 16.45(0.01) | 15.70(0.01) | 15.40(0.01) | 15.48(0.01) |
| 2457174.8 | 22.7 | 18.15(0.03) | 16.64(0.01) | 17.05(0.01) | 16.06(0.01) | 15.62(0.01) | 15.62(0.01) |
| 2457175.7 | 23.7 | 18.27(0.04) | 16.70(0.01) | 17.12(0.01) | 16.08(0.01) | 15.64(0.01) | 15.56(0.01) |
| 2457176.8 | 24.7 | 18.25(0.16) | 16.82(0.05) | 17.17(0.06) | 16.14(0.07) | 15.63(0.02) | 15.66(0.04) |
| 2457177.9 | 25.7 | 18.39(0.05) | 16.81(0.01) | 17.22(0.02) | 16.18(0.01) | 15.72(0.01) | 15.61(0.01) |
| 2457178.8 | 26.7 | 18.48(0.03) | 16.88(0.01) | 17.31(0.02) | 16.21(0.01) | 15.74(0.01) | 15.61(0.01) |
| 2457179.8 | 27.7 | 18.58(0.11) | 16.86(0.02) | 17.34(0.04) | 16.23(0.01) | 15.77(0.01) | 15.62(0.01) |
| 2457180.8 | 28.7 | 18.43(0.06) | 16.96(0.01) | 17.36(0.02) | 16.33(0.02) | 15.80(0.02) | 15.67(0.02) |
| 2457181.9 | 29.7 | 18.60(0.03) | 17.00(0.01) | 17.42(0.01) | 16.34(0.01) | 15.84(0.01) | 15.70(0.01) |
| 2457182.9 | 30.7 | 18.65(0.03) | 17.04(0.01) | 17.48(0.01) | 16.37(0.01) | 15.86(0.01) | 15.69(0.01) |
| 2457249.6 | 96.2 | 19.71(0.04) | 18.08(0.01) | 18.48(0.01) | 17.69(0.01) | 17.53(0.01) | … |
| 2457250.6 | 97.2 | 19.65(0.07) | 18.07(0.01) | 18.50(0.02) | 17.71(0.02) | 17.53(0.01) | 17.61(0.02) |
| JD | Phase | ||||||
|---|---|---|---|---|---|---|---|
| 2457142.1 | 9.4 | 17.30(0.09) | 17.32(0.09) | 16.33(0.08) | 15.20(0.06) | 16.11(0.06) | 15.98(0.08) |
| 2457145.3 | 6.2 | 17.61(0.10) | 17.35(0.09) | 16.44(0.08) | 15.26(0.06) | 15.88(0.06) | 15.67(0.08) |
| 2457147.3 | 4.3 | … | 17.32(0.16) | 16.32(0.08) | … | … | … |
| 2457147.4 | 4.2 | 17.41(0.10) | 17.29(0.09) | … | 15.21(0.06) | 15.76(0.06) | 15.61(0.07) |
| 2457148.4 | 3.2 | 17.53(0.10) | 17.40(0.09) | 16.47(0.08) | 15.33(0.06) | 15.88(0.06) | 15.62(0.08) |
| 2457149.1 | 2.5 | … | … | … | 15.28(0.06) | … | … |
| 2457149.2 | 2.4 | 17.64(0.10) | 17.51(0.09) | 16.51(0.08) | 15.32(0.06) | 15.70(0.06) | 15.55(0.07) |
| 2457149.5 | 2.1 | 17.73(0.10) | … | 16.54(0.08) | … | … | … |
| 2457149.6 | 2.0 | 17.83(0.11) | 17.36(0.09) | … | 15.34(0.06) | 15.89(0.06) | 15.55(0.07) |
| 2457151.3 | 0.3 | 17.76(0.10) | 17.48(0.10) | 16.50(0.08) | 15.38(0.06) | 15.72(0.06) | 15.57(0.07) |
| 2457154.3 | 2.6 | 17.87(0.12) | 17.91(0.10) | 16.61(0.08) | 15.55(0.07) | 15.88(0.06) | 15.45(0.07) |
| 2457155.3 | 3.6 | 18.08(0.11) | 17.96(0.12) | 16.83(0.08) | 15.55(0.07) | 15.81(0.06) | 15.51(0.07) |
| 2457156.4 | 4.7 | 18.08(0.12) | 17.99(0.11) | 16.89(0.08) | 15.63(0.07) | 15.88(0.06) | 15.45(0.07) |
| 2457157.0 | 5.3 | 18.17(0.12) | 18.22(0.12) | 16.97(0.09) | 15.72(0.06) | 15.95(0.06) | 15.42(0.07) |
| 2457158.4 | 6.6 | 18.23(0.15) | 18.15(0.14) | 16.91(0.10) | 15.73(0.08) | 16.04(0.07) | 15.43(0.08) |
| 2457170.4 | 18.4 | 19.35(0.33) | … | 18.22(0.21) | 17.02(0.14) | 17.04(0.10) | 15.82(0.10) |
| 2457173.0 | 21.0 | … | 20.01(0.36) | 18.76(0.17) | 17.29(0.10) | 17.03(0.07) | 16.04(0.10) |
| 2457175.6 | 23.5 | … | … | 19.05(0.24) | 17.38(0.12) | 17.30(0.09) | 16.13(0.09) |
| 2457181.6 | 29.4 | … | … | 19.19(0.21) | 17.98(0.13) | 17.59(0.08) | 16.39(0.08) |
| 2457181.7 | 29.5 | … | 20.31(0.31) | … | … | … | … |
| 2457183.9 | 31.7 | … | … | 19.39(0.29) | 17.83(0.14) | 17.64(0.10) | 16.48(0.10) |
| 2457185.2 | 33.0 | … | … | 19.32(0.24) | 17.97(0.14) | 17.68(0.09) | … |
| 2457185.3 | 33.1 | … | … | … | … | … | 16.40(0.13) |
| 2457187.8 | 35.5 | … | … | … | 18.26(0.16) | 17.75(0.10) | 16.51(0.09) |
| 2457191.3 | 38.9 | … | … | 19.29(0.23) | 18.27(0.16) | 17.72(0.09) | 16.59(0.09) |
| 2457192.6 | 40.2 | … | … | … | 18.52(0.29) | 18.11(0.16) | 16.97(0.17) |
| 2457197.0 | 44.5 | … | … | … | 18.49(0.19) | 17.77(0.10) | 16.84(0.11) |
| JD | Phase | |||
|---|---|---|---|---|
| 2457139.9 | 11.5 | 15.97(0.01) | 15.82(0.01) | 15.83(0.02) |
| 2457140.9 | 10.5 | 15.88(0.01) | 15.71(0.01) | 15.75(0.02) |
| 2457141.8 | 9.6 | 15.77(0.01) | 15.63(0.01) | 15.61(0.03) |
| 2457142.9 | 8.6 | 15.71(0.01) | 15.54(0.01) | 15.55(0.03) |
| 2457143.9 | 7.6 | 15.65(0.01) | 15.49(0.01) | 15.47(0.03) |
| 2457151.9 | 0.3 | 15.37(0.01) | 15.16(0.01) | 15.19(0.02) |
| 2457152.8 | 1.2 | 15.35(0.01) | 15.17(0.01) | 15.17(0.02) |
| 2457153.8 | 2.2 | 15.35(0.01) | 15.16(0.01) | 15.14(0.02) |
| 2457170.8 | 18.8 | 15.09(0.01) | 15.32(0.01) | 15.03(0.01) |
| 2457172.8 | 20.8 | 15.06(0.01) | 15.34(0.01) | 15.04(0.01) |
| 2457173.8 | 21.8 | 15.03(0.01) | 15.34(0.01) | 15.02(0.02) |
| JD | UT Date | Phase | Telescope | Instrument | Ref.aa1: Frohmaier et al. 2015; 2: Stahl et al. 2020; 3: this work; 4: Childress et al. 2016. |
|---|---|---|---|---|---|
| Optical | |||||
| 2457139.9 | 2015-04-27 | 11.6 | ESO-NTT | EFOSC2 | 1 |
| 2457140.0 | 2015-04-27 | 11.4 | Shane | KAST | 2 |
| 2457142.2 | 2015-04-29 | 9.3 | NOT | ALFOSC | 3 |
| 2457142.2 | 2015-04-29 | 9.2 | ANU | WiFeS | 4 |
| 2457146.3 | 2015-05-03 | 5.2 | ANU | WiFeS | 4 |
| 2457148.7 | 2015-05-06 | 2.9 | LT | SPRAT | 3 |
| 2457150.3 | 2015-05-07 | 1.3 | ANU | WiFeS | 4 |
| 2457150.7 | 2015-05-08 | 0.9 | LT | SPRAT | 3 |
| 2457151.7 | 2015-05-09 | 0.0 | LT | SPRAT | 3 |
| 2457153.7 | 2015-05-11 | 2.0 | LT | SPRAT | 3 |
| 2457155.0 | 2015-05-12 | 3.3 | FLWO 1.5m | FAST | 3 |
| 2457155.9 | 2015-05-13 | 4.2 | FLWO 1.5m | FAST | 3 |
| 2457156.2 | 2015-05-13 | 4.5 | ANU | WiFeS | 4 |
| 2457160.9 | 2015-05-18 | 9.1 | FLWO 1.5m | FAST | 3 |
| 2457161.9 | 2015-05-19 | 10.1 | FLWO 1.5m | FAST | 3 |
| 2457187.0 | 2015-06-13 | 34.7 | Shane | KAST | 2 |
| 2457189.5 | 2015-06-16 | 37.2 | Keck-I | LRIS | 2 |
| 2457191.1 | 2015-06-17 | 38.7 | NOT | ALFOSC | 3 |
| 2457192.0 | 2015-06-18 | 39.6 | Shane | KAST | 2 |
| 2457194.9 | 2015-06-21 | 42.5 | FLWO 1.5m | FAST | 3 |
| 2457196.9 | 2015-06-23 | 44.5 | Shane | KAST | 2 |
| 2457198.2 | 2015-06-24 | 45.7 | ANU | WiFeS | 4 |
| 2457205.1 | 2015-07-01 | 52.5 | ANU | WiFeS | 4 |
| 2457212.1 | 2015-07-08 | 59.4 | ANU | WiFeS | 4 |
| 2457217.9 | 2015-07-14 | 65.1 | Shane | KAST | 2 |
| 2457225.5 | 2015-07-22 | 72.5 | du Pont | WFCCD | 3 |
| 2457227.9 | 2015-07-24 | 74.9 | Shane | KAST | 2 |
| 2457234.9 | 2015-07-31 | 81.8 | ANU | WiFeS | 4 |
| 2457252.0 | 2015-08-17 | 98.6 | ANU | WiFeS | 4 |
| 2457258.9 | 2015-08-24 | 105.3 | Shane | KAST | 2 |
| 2457286.7 | 2015-09-21 | 132.6 | Shane | KAST | 2 |
| 2457305.6 | 2015-10-10 | 151.2 | Shane | KAST | 2 |
| 2457306.7 | 2015-10-11 | 152.3 | Shane | KAST | 2 |
| 2457309.7 | 2015-10-14 | 155.2 | Shane | KAST | 2 |
| Near-infrared | |||||
| 2457143.0 | 2015-04-30 | 8.5 | GN | GNIRS | 3 |
| 2457150.1 | 2015-05-07 | 1.5 | GN | GNIRS | 3 |
| 2457159.9 | 2015-05-17 | 8.1 | GN | GNIRS | 3 |
| 2457174.9 | 2015-06-01 | 22.8 | Baade | FIRE | 3 |
| 2457181.7 | 2015-06-08 | 29.5 | GS | F2 | 3 |
| 2457224.7 | 2015-07-21 | 71.7 | GS | F2 | 3 |
Appendix B - and -corrections
In this work, -corrections (Oke & Sandage, 1968) were performed in the optical bands for all the comparison SNe Ia presented in Section 4. Note that for SN 2007if and SN 2012dn, the SNIFS absolute-flux-calibrated spectra (Scalzo et al., 2010; Taubenberger et al., 2019) were used to calculate the magnitudes by integrating the flux directly under the CSP Swope+e2v passbands, hence no - or -corrections were needed. The -corrections of SN 2007af, SN 2006bt and LSQ12gdj were computed using SNooPy, which uses the Hsiao templates (Hsiao et al., 2007) for SNe Ia.
For other peculiar 03fg-like objects, such as SN 2006gz, SN 2009dc, and ASASSN-15pz, the spectral time series of SN 2009dc (Silverman et al., 2011; Taubenberger et al., 2011), SN 2012dn (Taubenberger et al., 2019), and the Hsiao normal SN Ia templates (Hsiao et al., 2007) were used as different options for the assumed SED in order to determine the -corrections and the corresponding errors. The following procedures were followed for each SN Ia: (1) warp all the spectral sets (SN 2009dc, SN 2012dn, Hsiao templates, and the observed spectra of the SN Ia in question) to match the observed photometric colors of the SN Ia; (2) calculate the -correction using the warped spectra from the above step; (3) interpolate the -corrections to the photometric epochs with Gaussian process (Rasmussen & Williams, 2005) and with constant extrapolation if the desired epoch is outside the covered range; (4) choose the SED option that produces the smallest in -correction values compared to the ones obtained from the observed spectra of the SN Ia in question, in order to produce the final -correction; and (5) at each photometric epoch, adopt the standard deviation of the -correction from all SED options as the final -correction errors. Following the above procedures, the optimal SED set for SN 2006gz, SN 2009dc, and ASASSN-15pz were spectral time series of SN 2012dn, SN 2009dc, and SN 2009dc, respectively.
For photometry published in the natural system with known filter response functions, such as that obtained by the Harvard-Smithsonian Center for Astrophysics (CfA) Supernova Group (Hicken et al., 2007, 2012), the light curves are also -corrected to the CSP-II Swope+e2v natural system. For photometry published in the standard systems, the light curves are left as published without removing or applying color terms, such as the Las Cumbres Observatory light curves of ASASSN-15pz from Chen et al. (2019) and the multi-instrument S-corrected light curves of SN 2009dc from Taubenberger et al. (2011). When computing the -corrections in step 2), the rest-frame filters were set to be the CSP-II Swope+e2v filters.
The optical spectroscopic data set of ASASSN-15hy are quite complete in time coverage and rapid in cadence. Thus, it forms the base set of SEDs for the -correction calculations for ASASSN-15hy. Figure B17 presents the comparison of -corrections computed with various SED options for ASASSN-15hy. The different sets of -corrections are similar at early times but diverge after +10 d past maximum light, especially in the band where 03fg-like SNe Ia show peculiar light-curve evolution compared to normal SNe Ia. This divergence is captured in the adopted -correction errors. Among four 03fg-like objects, SN 2006gz, SN 2009dc, ASASSN-15pz, ASASSN-15hy, the average adopted -correction error is 0.01 mag. This is on the same level as the errors attributed to the diversity of spectroscopic features in normal SNe Ia (Hsiao et al., 2007).

Appendix C Host-Galaxy Analysis
C.1 Integral-field Spectroscopy
The analysis of the MUSE integral-field spectroscopy of the ASASSN-15hy host is detailed here, while the main results were presented in Section 3.2. First, the MW extinction-corrected maps of the most prominent emission lines were constructed. Spectra were then extracted using a 1.6″ diameter aperture, similar to the FWHM of the observation, and centered at two positions: one at the brightest nearby host H structures toward the SE of the SN (marked as Structure A in the right panel of Fig. 4) and the other at the position of ASASSN-15hy. A simple stellar populations analysis was performed on these two spectra and on the integrated global spectrum of the galaxy by summing up the spectra in all spaxels while accounting for spatial covariance in the error budget. Several galactic parameters were obtained from the three spectra including the ongoing SFR determined from the H emission line, the ratio of young-to-old populations determined from the H EW, and the oxygen abundance (12 + ) in both the O3N2 (Marino et al., 2013) and D16 (Dopita et al., 2016) scales.
The spectrum extracted at the location of ASASSN-15hy has a low S/N with a very noisy stellar continuum. The Balmer H and lines were detected, and they indicate the presence of gas ionized by ongoing star formation at that location. This location show subsolar oxygen abundance implied by both O3N2 and D16 calibrators and relatively high sSFR. From the spectrum extracted at the location of Structure A, the oxygen abundance is substantially subsolar. The oxygen line at 5007 is as bright as H, pointing to very low metal content. This is supported by the location of the line ratios in the BPT diagram (Baldwin et al., 1981), falling below the Kewley et al. (2001) demarcation line at the edge where low-metallicity regions fall, similar to the host of LSQ14fmg (Hsiao et al., 2020). The HEW of Structure A is relatively high, indicating a significant contribution from populations as young as 10 Myr (See Kuncarayakti et al. 2018 for example). Regarding global properties, we found a SFR of 0.048 0.007 M⊙ yr-1 and a stellar mass of (0.77 0.16) 109 M⊙, corresponding to a log10(sSFR) of 10.21 0.31 yr-1. The global spectrum also yielded relatively high HEW and low subsolar oxygen abundances in both the O3N2 and D16 calibrators. As discussed in Section 3.2, such low-mass and low-metallicity host environment are typical for the 03fg-like SNe. Analysis with a larger sample are underway (L. Galbany et al, in preparation).
C.2 Detection Limit of Na i D
A detection limit of EW 0.1 Å was estimated using the WiFeS spectrum taken on 2015 May 13, selected for its relatively high resolution and S/N. Here, we outline the procedures for estimating the detection limit. First, an idealized spectrum was created by Gaussian smoothing and oversampling the observed WiFeS spectrum. Artificial absorption lines with varying depths and widths, simulating the narrow Na i D absorptions, were then added to the idealized spectrum. The resolution was degraded to match the resolution of WiFeS with the R3000 grating. The spectrum was then resampled at the same wavelength grid as the observed WiFeS spectrum. Finally, random flux noise was added using the uncertainties measured from the observed spectrum.
The strength of the simulated Na i D absorption was decreased until the EW measured from the degraded spectrum was on the same level as the EW measurement error determined through 100 realizations of degraded spectra. The EW measured using the corresponding idealized spectrum is then taken as the detection limit. We estimated for ASASSN-15hy that the Na i D EW is 0.0 0.1 Å. Note that the derived detection limit is robust against varying width of the simulated Na i D absorption, as well as resolution further degraded by seeing, for example, by a factor of 2.
C.3 Comparisons of Spectral Energy Distribution


By comparing the SED (covering from 2000 to 8000 Å) of ASASSN-15hy to those of well-studied 03fg-like SNe, we further investigate whether the relative faintness of ASASSN-15hy in the optical is due to host-galaxy extinction. SN 2009dc (Taubenberger et al., 2011; Krisciunas et al., 2017) and ASASSN-15pz (Chen et al., 2019) were chosen for this test due to their similarity in spectroscopic properties with ASASSN-15hy and the availability of photometry in the UV. They have host color excess values of 0.1 (Taubenberger et al., 2011) and 0.0 mag (Chen et al., 2019), determined by the EW of Na i D, from the corresponding literature. The SED of ASASSN-15hy is extinction and reddening “corrected” to match those of SN 2009dc and ASASSN-15pz. The best matching extinction parameters, and , were selected by locating the minimum of the averaged Normalized Root Mean Square Error (NRMSE) between the comparison SEDs over the selected four epochs presented in Fig. C18. Note that the weight of the was set to 0.05 when calculating the NRMSE to avoid bias due to the significant extinction in the UV.
Unusually high intrinsic UV flux would be required for ASASSN-15hy if it is to match the overall SED of the reference SNe, especially in the optical region, with the best-fit and . The derived intrinsic SED of ASASSN-15hy has an average of 2 and 5 times of the flux in the band compared to those of SN 2009dc and ASASSN-15pz respectively, which translates to 0.8 and 1.7 mag brighter in magnitudes. Such high UV flux is not likely as SN 2009dc and ASASSN-15pz are already UV bright compared to normal SNe Ia (Taubenberger et al., 2011; Brown et al., 2014b; Chen et al., 2019). Given the above result from the SED extinction test and the minimal extinction derived from the nondetection of Na i D, we suggest that the apparent differences in the SEDs are intrinsic to the SNe or their immediate surrounding environment.
Appendix D Model Selection in the Core Degenerate Scenario
In the context of the CD scenario, we explain how the photometric and spectral properties of ASASSN-15hy translate to our chosen model parameters in details in this section, with the main results summarized in Section 6. Our goal is to show how we obtain our best fit model parameters and not to present an overall model grid for the CD scenario. In a star undergoing a common-envelope phase, we would expect that the hydrogen envelope is most stripped. We note however, that every AGB star removes its envelope in the final stages such that it forms a naked C/O core that later is seen as a white dwarf. One of the goals of this investigation is to probe for the ignition mechanism in ASASSN-15hy.
D.1 Model Construction and Free Parameters
In this work, we use the parameterized framework of spherical envelope models (Hoeflich & Khokhlov, 1996) and make use of the spectral evolution of elements and photometric properties to constrain model parameters. Similar models were presented for the 03fg-like object LSQ14fmg (Hsiao et al., 2020). Here we list the main parameters and selection criteria as mentioned in Section 6. The main parameters are:
-
1.
the mass of the nondegenerate envelope ,
-
2.
the radius of the nondegenerate envelope ,
-
3.
the size of the He and C layers in mass and velocity space,
-
4.
the initial metallicity ,
-
5.
the mass of the hydrostatic (possibly rotating) core; referred to as the core mass, ,
-
6.
the amount of mass burnt in the deflagration phase, or the transition density from the deflagration to detonation burning ,
-
7.
possible interaction with the nearby environment or wind.
The parameters of the presented models are determined by the observational constraints. The primary selection criteria allow us to determine the model parameter based on the observation properties are:
- 1.
-
2.
determines the width of the shell. With increasing radius, the shell becomes more confined in velocity space (Fig. D19),
-
3.
determines the diffusion time scales, therefore, the rise time to maximum light (Hoeflich & Khokhlov, 1996; Shen & Moore, 2014; Dessart et al., 2014). The detonation in a sub- (1) model produces a rise time that is too short, and models with produces one that is too long by several days. The best agreement was found with a model of 1.47 that puts ASASSN-15hy near but over .
The secondary selection criteria in the case of DCD are: or which regulates the 56Ni production and therefore the luminosity, if all other parameters are kept the same, as in the classical delayed detonation models (e.g., Hoeflich et al., 2002). Note that in general within the CD scenario, Z and the relative amount of controls the color , the UV and NIR flux, and the CO-formation.
D.2 Structure of the Explosion Models
For the simulations, we used our HYDrodynamical RAdiation code (HYDRA) which utilizes a nuclear network of 218 isotopes during the early phases of the explosion and detailed, time-dependent non-LTE models for atomic level populations and diatomic molecules (Sharp & Hoeflich, 1990; Hoeflich et al., 1995), including - and positron transport and radiation-hydrodynamics to calculate LCs and spectra (Höflich, 2003; Penney & Hoeflich, 2014; Hoeflich et al., 2017). Here, 912 to 1812 depth points are used. For possible interaction, a recent module is used based on the work presented in Gerardy et al. (2007); Dragulin & Hoeflich (2016), and Hsiao et al. (2020), covering a larger parameter space than existing published models (Hoeflich & Khokhlov, 1996; Hsiao et al., 2020). The ranges covered are , where we assume that the rotationally supported degenerate core follows the solutions of Yoon & Langer (2005); ; ; . The metallicity range is chosen to cover the range from extreme Population III to Population I stars. Only the baseline and best matching model are presented here, but the entire set of models will be discussed and applied to analyze a sample of 03fg-like SNe Ia in future work.
Although the elemental contribution of a specific feature changes with time, we use the models to identify the velocity range in which specific elements are present. Note that the model parameters have not been fine-tuned, and that Rayleigh-Taylor instabilities are suppressed in spherical models, but may smear-out the edges in velocity space by about km s-1. The baseline model (DCD07) has the following parameters: , , , , , , and the total 56Ni mass . The resulting density and abundance structures are shown in Fig. D19.
The overall structure consists of a central core of nuclear statistical equilibrium (NSE) burning products, layers of IME produced by explosive O burning (Si/S & Ca) and explosive C burning (Mg, Ne, O), and outer unburned C/O and He layers originating from the initial structure. As usual in this class of models, the presence of a nondegenerate envelope results in the compression in velocity space of all burning layers (Hoeflich & Khokhlov, 1996; Quimby et al., 2007).
Two peculiarities of the baseline model are: (1) the lack of a pronounced density shell when compared to a more typical envelope model or the large-amplitude pulsating delayed-detonation (DDT) models (Hoeflich & Khokhlov, 1996; Quimby et al., 2007; Hoeflich et al., 2017; Hsiao et al., 2020), and (2) that parts of the C/O envelope undergo burning. Both are a direct consequence of the small of rather than an extended envelope with e.g. (see Fig. D19). Typically, an exploding WD reaches the initial stage of free expansion after about 10 to 20 seconds. However, in DCD07, the compact shell gets overrun by the ejecta within 1 to 2 seconds. Thus, a new pressure equilibrium between the shell and the inner material can be reached leading to a very shallow density shell-like feature between 0.7 and 1.4 (see the left panels of Fig. D19). Moreover, the large envelope mass , combined with the early interaction and lack of geometrical dilution of the ejecta, results in sufficiently high densities and peak temperature in the inner layers of the shell for explosive C burning (producing O, Ne, and Mg) to take place (see the right panels of Fig. D19). In the model DCD07, the NSE, QSE and explosive C-burning products are below km s-1, km s-1, and km s-1, respectively. The S velocity range is shifted relative to Si by and km s-1 at the inner and outer edges of explosive O burning, when the transitions to NSE and C-burning occur, respectively.
In this model, very limited He burning, below the abundance level of , takes place via helium capture on carbon, 12C(O, which also occurs during normal helium burning. For models with similar parameters but smaller , larger , or smaller , explosive He burning can lead to an increased outer abundance of NSE, QSE, and explosive C-burning products at high velocities, as is seen in some sub- or -mass models with He-donors (Nomoto, 1982; Hoeflich & Khokhlov, 1996; Shen & Moore, 2014; Hoeflich et al., 2019). Corollary models with the same parameters as DCD07 but with a larger produce very few products of explosive C burning (lower right panel of Fig. D19) compared to our model that shows more O/Ne/Mg (upper-right panel of Fig. D19).666Note that can be slightly lower than without changing the discussion above. However, more C/O would result in an earlier onset of CO formation at d in this model.

D.3 Resulting Spectral Constraints
Observed spectral measurements of ASASSN-15hy allow us to select the basic parameters for the model. In the baseline model the Si abundance peaks at about km s-1, which compares well with the observed Si ii 6355 velocity plateau in Fig. 12 and allows us to set . determines the velocity range of elements. Our choice of is determined such that silicon is produced between km s-1. The absorption minimum indicates a velocity range for Si ii 6355 of km s-1. At later times, the feature around becomes increasingly dominated by blends of Fe II lines (Fisher et al., 1999; Hoeflich, 1995). Therefore, the lower velocity limit is uncertain. The upper end of the Si velocity is better determined by the blue wing of the Si during early times (Hoeflich, 1995; Quimby et al., 2006) because Si is needed to produce a wing. The observed value of the wing indicates a somewhat larger value ( km s-1) than in our models. This may indicate a slightly smaller than adopted. However, Shallow line wings are subject to blends and noise.
As discussed in Section 5.1.2 and common in thermonuclear explosions (Branch et al., 1983; Hoeflich, 1995), the spectral feature at roughly transitions from being formed by Si ii to Fe ii dominated when the photosphere recedes from S/Si to the NSE layers past maximum. By +2 d from maximum light, the Si ii 6355 feature is blended with Fe ii 6456, 6516. Note that the Fe is not primordial but produced by the radioactive decay chain 56Ni 56Co 56Fe with half-life times of 6.1 and 77.1 d, respectively. The decay results in an Fe mass fraction at d past the explosion. Therefore, the interpretation of this feature being blended by Fe ii does not depend on the initial . The theoretical Mg velocities ( km s-1) are consistent with the observations discussed in the observational sections. A potential challenge for the model comes from the observed velocity range of the optical C ii 6580 from km s-1 at d to about km s-1 at d past maximum light. If the weak feature in the NIR at 1.03 is indeed C i, it implies a higher velocity of km s-1 at 8.5 d. The early C i and C ii velocities are marginally consistent with the model which shows C down to km s-1, but the C ii velocity past maximum is not.
The systematically lower velocity of C ii 6580 may be understood as a limb effect. The optical C ii 6580 feature is situated on the emission portion of the Si ii 6355 P-Cygni profile, subjecting the C ii feature to a pronounced limb-brightening effect (Hoeflich, 1990). The C ii absorbs radiation from an underlying disk that brightens towards the edge. The result is that the C ii absorption profile is dominated by low absorption velocities, due to the fact that the observer sees the projected velocities (Hoeflich et al., 2002).
The possible early C i velocity in the NIR agrees with the peak C abundance in the models. C i has been previously identified in SN 1999by, a subluminous SN Ia with an extended C-rich layer (Hoeflich et al., 2002). SN 1999by and ASASSN-15hy are both red in their colors at maximum light. Rather than being dominated by ionized C, very strong C i lines in the NIR are expected if the envelope of ASASSN-15hy is C rich. Since ASASSN-15hy does not show strong C i lines but requires a large envelope mass for the overall abundance distribution, we conclude that the He layer provides the mass without additional spectral features.
By about maximum light, the photosphere is formed in the NSE and IME layers. As in SN 1999by, the ejecta are dominated by singly ionized iron-group elements, namely Fe ii and Co ii. Within the spectral constraints, we suggest a possible interpretation for the difference between the - and -band features in this object as an effect related to the velocity gradient (). As discussed in section 5.2, ASASSN-15hy shows the individual components of Co/Fe multiplets in the but not in the band.
The appearance of -band emission has been attributed to the fact that the photosphere recedes within the NSE region and that the emission is powered by the incomplete Rosseland cycle (Mihalas, 1978) well above the optical photosphere. Because the envelope is optically thick in the UV to the outer layers, the Rosseland cycle redistributes UV photons to the NIR. The emission is expected to be formed at similar radii in both the (m) and (m) bands because the lines originate from atomic levels with similar oscillator strengths and excitation energies (Fig. D20, lower panel). As this process is dominated by atomic physics, one would assume it should also hold true for 03fg-like SNe Ia. However, observations show that this is not the case. In 03fg-like SNe, the 56Ni region is located in the deeper, high density layers where the photosphere recedes more slowly with time. Thus, less IGE are above the photosphere at comparable times, and the features are weaker and develop later in time.
As a second effect, the quantitative difference between the - and -band properties in normal SNe Ia versus 03fg-like and subluminous SNe Ia can be understood in terms of differences in the velocity gradient. More precisely, the differences in the opacities in the and bands are manifested by the quasi-continuum produced by many overlapping lines. The optical depth due to expansion opacities is (Karp et al., 1977; Hoeflich et al., 1993), which is illustrated in Fig. D20. The opacity is smaller by a factor of in 03fg-like SNe compared to normal SNe Ia, and the quasi-continuum over the -band region is larger by a factor of two compared to the -band region (see Fig. D20, upper panel). As a result, the quasi-continuum forms close to the outer edge of 56Ni in the band, whereas the photosphere recedes to well within the 56Ni region in the band.
This interpretation is supported by the similarity of 03fg-like SNe and SN 1999by in their NIR evolution of the IGE spectral features (Hoeflich et al., 2002). The larger emission in the band is mostly due to thermalization at the photosphere and results in a weak -band break and weaker but present -band features. In both cases, the 56Ni is confined to low velocities layers (less than 6,000 to km s-1), whereas the 56Ni in normal SNe Ia extends to about 12,000 to km s-1.
Note that temperature in the outer layers of the envelope is sufficiently low and the density is sufficiently high for CO formation 1 month after the explosion. However, with He substituting for the C/O mixture in the envelope, our model forms CO only when the C/O is at low velocities and has cooled down, that is, months after explosion. However, the exact details of CO formation are subject to numerical uncertainties.

D.4 Resulting Light-curve Constraints
The comparison between the DCD07 model and observed light curves is shown in Fig. 15. For comparison to observations, we adopted a distance modulus of mag (see Section 3.1), applied only the Galactic reddening correction of mag (see Section 3.3), and aided our choice of the best matching model with comparisons to the Doppler shifts of observed spectral features. The model’s post-maximum decline generally agrees with that of ASASSN-15hy. As usual for cool envelope models (Hoeflich & Khokhlov, 1996; Hsiao et al., 2020), they do not show a strong secondary maximum, with the exception of luminous SNe, small , and high metallicity, . High metallicity is needed to produce a secondary maximum because iron group elements dominate the opacity. The NIR flux is formed in the Wien tail of the energy distribution, thus the NIR luminosity scales as . For bright SNe Ia, the photospheric radius increases well beyond the first maximum (Hoeflich et al., 1995). However, for low temperatures, the photosphere begins to recede near the time of maximum light and the secondary maximum in the -band merges with the primary maximum (Hoeflich et al., 1995; Taubenberger, 2017; Hsiao et al., 2020). The challenge is to find a model within our framework that is red in , dim in the band compared to other 03fg-like objects, and luminous in both the UV and the NIR. while at the same time maintaining agreement in the spectroscopic properties that set and .
As has been shown with previous envelope models with a detonation and a core (Hoeflich & Khokhlov (1996); see left panel of Fig. 15), the rise times increase with , and the light curve becomes dimmer and broader because geometrical dilution in the material of the degenerate WD decreases. However, for ASASSN-15hy, the core mass needed to be increased to beyond , to increase the diffusion time scales in the core, leading to a slow pre-maximum rise consistent with observations.
A large is inferred from the low Si ii velocity and narrow Si ii distribution in the observed spectra. However, we need a fast receding photosphere and low opacities to avoid the photosphere forming in the massive C/O layers. Opacities are dominated by IGEs with solar composition, or even typical Pop II abundances with . For low continuum opacities, we need He-rich material and a C/O ratio larger than that in carbon stars, with a metallicity set to for the baseline model. The shell becomes optically thin within days, even in the UV, resulting in a significant amount of hard UV and X-rays ( of the luminosity), during the phase dominated by 56Ni decay in the early part of the light curve. This avoids the redistribution of the IR luminosity via the incomplete Rosseland cycle mentioned above. Virtually any metals would absorb the hard radiation from the inner region, heating the shell and boosting the optical and IR luminosity by volume driven bound-free and free-free emission. The need for a low-metallicity model is consistent with the low metallicity of the host galaxy and the surrounding environment of ASASSN-15hy (see Section 3.2 and Appendix C.1).
The model places ASASSN-15hy in the regime of super- degenerate cores but only slightly above . Models with even larger , such as that produced by the merging of two WDs on dynamical time scales, would start as detonations and produce more 56Ni resulting in a brighter SN (Pakmor et al., 2012). Being close to makes the ignition of deflagration burning likely (Khokhlov, 1995; Niemeyer et al., 1996). One of the key ingredients of the CD model is an extended deflagration phase that results in pre-expansion of the core prior to the deflagration to detonation transition. Here, we use an extended deflagration burning of to avoid a strong increase in the 56Ni production for a small . Note that such a late transition from deflagration to detonation has only been found in very subluminous SNe Ia (Hoeflich et al., 2017), which are rare in their own right.
The model produced early light curves that are approximately 1 mag brighter than the ASAS-SN nondetection limits. Parts of the delay between the explosion and first light can be understood in terms of the initial reheating phase. At early times, the temperature in the envelope cools rapidly, within minutes by adiabatic expansion. Because of the small expansion velocity in the nickel region, -rays are mostly trapped and don’t contribute to the heating of the outer material, resulting in delayed heating of the outer layers compared to normal SNe Ia. The duration of this phase mostly depends on the geometrical dilution of the 56Ni layers and thus, on the expansion velocity of the 56Ni layers since the -ray opacity does not depend on temperature. This phase lasts until to days after the explosion for normal and subluminous SNe Ia, respectively (Hoeflich et al., 2002, 2017). As a result of the low temperature in these phases, the optical opacities are very low, and this phase is characterized by an increasing photospheric velocity with time, and rather blue colors compared to models with solar metallicity and large envelope masses, which have mag (Hoeflich & Khokhlov, 1996). In ASASSN-15hy, the velocities are similar to a subluminous SNe Ia, but the mass is larger and thus, the density is higher, leading to high luminosity from the degenerate core. The -rays then start to heat the outer layers of the degenerate core similar to subluminous SNe Ia after about days. With , the early radiation cannot excite C/O rich material, due to the lack of strong line blanketing as commonly produced by lines of iron group elements. To effectively block the early radiation, we need some elements with lower ionization potential and strong lines such as IGEs, for example, by mixing a small amount of IGEs into the inner shell, boosting the opacity. More extended mixing would shorten the reheating.
The metallicity777For numerical reasons, a resolution of only is used at the interface between the core and the envelope. was increased to at the interface of the degenerate core and the C/O region of the shell. That is, the metallicity of the envelope was increased. Since the degenerate core fully burns increasing the metallicity there will only have small effects and here, we are interested only in the opacity effects of the envelope on the light curve, not in producing fully self-consistent models. The result is an extended ‘dark(er)’ phase, lasting about one week after the explosion and an early red color (see Fig. 15). The increase in and the corresponding dark phase bring this model within agreement of the ASAS-SN -band nondetections and reproduces the observed apparent rise time of days. Thus, we choose this modified baseline model with as our best matching model. The -band last nondetection flux at 16 d is slightly lower than the theoretical flux, but a change of 1 day in phase from explosion between observations and the model is well within the model uncertainties expected by mixing at the chemical interface between QSE and IGE elements (see Fig. D19). The increase in metallicity also brings the best matching model into closer agreement with the UV observations (Section 4). The early low luminosity excludes the presence of an ongoing interaction as suggested for LSQ14fmg (Hsiao et al., 2020), which would add a constant early luminosity. Using the same approach and the nondetections being 2 mag below maximum light provides an upper limit of the mass-loss rate of the AGB star to .
The mass of the degenerate core suggests the ignition begins as a deflagration and subsequently turns into a detonation as discussed above. To produce a subluminous SN we require a late transition density. A deflagration to detonation transition is a common characteristic in reactive fluids in general, but the details in stellar explosions are still under debate and may involve the Zel’dovich mechanism (i.e., the mixing of burned and unburned material), crossing shock waves, magnetohydrodynamic-instabilities, and shear flows in a highly turbulent medium (Niemeyer et al., 1996; Khokhlov et al., 1997; Livne, 1999; Poludnenko et al., 2011; Hristov et al., 2018). Recently, semi-analytical solutions have been developed that suggest that a DDT is unavoidable under C/O-WD conditions and that the transition density decreases with increasing specific nuclear energy production (Poludnenko et al., 2019). The model has low metallicity, resulting in a late DDT transition and a subluminous SN. Therefore, we expect these ASASSN-15hy-like objects are rare.
D.5 Future Prospects
We outline the limitations of this study, which should be seen as a starting point towards understanding the nature of 03fg-like SNe Ia. Due to the sensitivity of the models to the rise time and the possible ‘dark phase’, early-time data are extremely important. Such data may be expected from ongoing and future campaigns such as and in particular, early time UV spectra with HST to test for the chemical signature of the outer few tenths of a solar mass. The simulations are based on spherical explosions involving deflagrations and shell interaction, both of which are Raleigh-Taylor (RT) unstable. The steep chemical gradients are likely to be smeared out on RT scales, but full 3D hydro-simulations are needed to determine the details. The picture provided by the model is consistent with the observations of ASASSN-15hy, but forces the models into a particular corner of parameter space. Two 03fg-like objects, ASASSN-15hy and LSQ14fmg are consistent with the scenario suggested here with clear predictions for larger samples. The super-Chandrasekhar value of lends credence to the DCD scenario. However, both ASASSN-15hy and LSQ14fmg are odd-balls in some respects. The lack of polarization in a few other 03fg-like explosions, such as SN 2009dc (Tanaka et al., 2010) and SN 2007if (Cikota et al., 2019) is expected within the CD scenario, but not in merger scenarios without massive envelopes. However, this does not exclude the possibility that a majority of 03fg-like SNe are the result of dynamical mergers. A larger sample of 03fg-like events is needed for further analyses. A key difference between scenarios should be expected in the predictions of the nature of the nearby environment. X-ray and radio observations and a better characterization of the hosts are needed. Because of the similarity of the bands with normal SNe Ia, 03fg-like SNe could hide in data sets where the light curves are followed in only a few photometric bands. Observations of redder bands such as the band are required in order to distinguish these peculiar events as well as to exclude them for cosmological use.