Answering Product-Questions by Utilizing Questions from Other Contextually Similar Products
Abstract
Predicting the answer to a product-related question is an emerging field of research that recently attracted a lot of attention. Answering subjective and opinion-based questions is most challenging due to the dependency on customer-generated content. Previous works mostly focused on review-aware answer prediction; however, these approaches fail for new or unpopular products, having no (or only a few) reviews at hand. In this work, we propose a novel and complementary approach for predicting the answer for such questions, based on the answers for similar questions asked on similar products. We measure the contextual similarity between products based on the answers they provide for the same question. A mixture-of-expert framework is used to predict the answer by aggregating the answers from contextually similar products. Empirical results demonstrate that our model outperforms strong baselines on some segments of questions, namely those that have roughly ten or more similar resolved questions in the corpus. We additionally publish two large-scale datasets111The datasets are freely available at https://registry.opendata.aws under the names Amazon-PQSim and Amazon-PQA. used in this work, one is of similar product question pairs, and the second is of product question-answer pairs.
1 Introduction
Product-related Question Answering (PQA) is a popular and essential service provided by many e-commerce websites, letting consumers ask product related questions to be answered by other consumers based on their experience. The large archive of accumulated resolved questions can be further utilized by customers to support their purchase journey and automatic product question answering tools (e.g. Jeon et al. (2005); Cui et al. (2017); Carmel et al. (2018)). However, there are many unanswered questions on these websites, either because a newly issued question has not attracted the community attention yet, or because of many other reasons Park et al. (2015). This may frustrate e-commerce users, in particular when their purchase decision depends on the question’s answer. Automatic PQA may assist the customers and the sellers by answering these unanswered questions, based on various diversified resources.
Previous PQA approaches leverage product specifications and description information Cui et al. (2017); Lai et al. (2018); Gao et al. (2019), as well as customer-reviews Yu et al. (2012); McAuley and Yang (2016); Yu and Lam (2018); Das et al. (2019); Fan et al. (2019); Chen et al. (2019); Deng et al. (2020), for answering product related questions. However, there are two notable shortcomings to these two approaches. Product information can typically address questions about product features and functionality, but can’t address complex and subjective questions such as opinion question (Is it good for a 10 year old?), advice-seeking question (What is the color that best fit my pink dress?), or unique usage questions (Can I play Fifa 2018 on this laptop?). Customer-reviews, on the other hand, can partially address this kind of questions Wan and McAuley (2016), yet there are many products with few or no reviews available, either because they are new on the site or are less popular.
We propose a novel and complementary approach for answering product-related questions based on a large corpus of PQA. Given an unanswered product question, we seek similar resolved questions222We consider questions similar if they have the same semantic intent. For example, can I wash this?, Is the product washable?, Is it ok to clean it with water? are all considered as similar questions when asked in context of a similar product. about similar products and leverage their existing answers to predict the answer for the customer’s question. We call our method SimBA (Similarity Based Answer Prediction). For example, the answer for the question “Will these jeans shrink after a wash?”, asked about a new pair of jeans on the website, may be predicted based on the answers for similar questions asked about other jeans that share properties such as fabric material, brand, or style. An example is shown in Table 1. The main hypothesis we explore in this work is whether the answer to a product question can be predicted, based on the answers for similar questions about similar products, and how reliable this prediction is.
As our method relies on the existing PQA corpus, it addresses the two mentioned shortcomings of the previous approaches. First, it can address a variety of product-related questions that are common in PQA, including subjective and usage questions. Second, our method can provide answers to new or less popular products as it leverages an existing set of similar questions from other similar products.
A key element of our proposed method is a novel concept that we refer to as Contextual Product Similarity, which determines whether two products are similar in the context of a specific question. For example, two smart-watches may be similar with regards to their texting capability but different with regards to sleep monitoring. In Section 3 we formally define this concept and propose a prediction model for measuring contextual similarity between products, with respect to a given question. Additionally, we describe an efficient method to train this model by leveraging an existing PQA corpus.
Another appealing property of SimBA is its ability to support the predicted answer by providing the list of highly similar questions upon which the answer was predicted, hence increasing users’ confidence and enhancing user engagement.
Our main contributions are: (a) A novel PQA method that overcomes several shortcomings of previous methods. (b) A novel concept of Contextual Product Similarity and an effective way to automatically collect annotations to train this model. (c) Finally, publishing two large scale datasets, one is a question similarity data set and the second is a large-scale Amazon product questions and answers dataset, details are provided in Section 4.
Empirical evaluation of our method demonstrates that it outperforms a strong baseline in some question segments, and that a hybrid model is effective in all the vast majority of the questions.
| Product: Dickies Men’s Jeans, 100% Cotton. |
| Q: Will these shrink after a wash? |
| Predicted answer: No |
| Similar Product 1: Eddie Bauer Men’s Jeans, 100% |
| Cotton. |
| Q: Do these shrink when you wash and dry them? |
| A: No |
| Similar Product 2: Timberland PRO Men’s Jean, 99% |
| Cotton, 1% Polyurethane. |
| Q: Was there any shrinkage after washing? |
| A: No shrinkage |
| Similar Product 3: Levi’s Men’s Jeans, 98% Cotton, |
| 2% Elastane. |
| Q: Do these shrink at all during washing/drying? |
| A: They have not shrunk |
2 Related Work
Automatic aswering product related questions has become a permanent service provided by many e-commerce websites and services (Cui et al., 2017; Carmel et al., 2018). Questions are typically answered based on product details from the catalog, existing Q&A’s on the site, and customer reviews. Each of these resources, used for answer generation, has been studied extensively by the research community recently, probably due to the complexity of this task, the availability of appropriate datasets (McAuley, 2016), and the emergent increase in on-line shopping usage.
Lai et al. (2018) built a question answering system based on product facts and specifications. They trained a question answering system by transfer learning from a large-scale Amazon dataset to the Home Depot domain. Gao et al. (2019) generated an answer from product attributes and reviews using adversarial learning model which is composed of three components: a question-aware review representation module, a key-value attribute graph, and a seq2seq model for answer generation. Yu et al. (2012) answered opinion questions by exploiting hierarchical organization of consumer reviews, where reviews were organized according to the product aspects.
The publication of Amazon datasets of reviews333https://nijianmo.github.io/amazon/index.html and Q&As McAuley (2016), triggered a flood of studies on review-aware answer prediction and generation. McAuley and Yang (2016) formulated the review based question answering task as a mixture-of-experts framework — each review is an “expert” that votes on the answer to a yes/no question. Their model learns to identify ‘relevant’ reviews based on those that vote correctly. In a following work, Wan and McAuley (2016) observed that questions have multiple, often divergent, answers, and the full spectrum of answers should be further utilized to train the answering system.
Chen et al. (2019) described a multi-task attention mechanism which exploits large amounts of Q&As, and a few manually labeled reviews, for answer prediction. Fan et al. (2019) proposed a neural architecture, directly fed by the raw text of the question and reviews, to mark review segment as the final answer, in a reading comprehension fashion. Das et al. (2019) learned an adversarial network for inferring reviews which best answer a question, or augment a given answer. Deng et al. (2020) incorporated opinion mining into the review-based answer generation. Yu and Lam (2018) generated aspect-specific representation for questions and reviews for answer prediction for yes-no questions. Yu et al. (2018) used transfer learning from a resource-rich source domain to a resource-poor target domain, by simultaneously learning shared representations of questions and reviews in a unified framework of both domains.
All this line of works assume the existence of rich set of product reviews to be used for question answering. This solution fails when no reviews are available. The challenge of review generation for a given product, while utilizing similar products’ reviews, was addressed by Park et al. (2015). For a given product they extracted useful sentences from the reviews of other similar products. Similarly, Pourgholamali (2016) mined relevant content for a product from various content resources available for similar products. Both works focused on the extraction of general useful product related information rather than answering a specific product question, as in our case. Second, the product-similarity methods they considered rely on product specifications and description, and do not depend on the question to be answered, while our method considers a specific question at hand when estimating contextual product similarity.
3 Similarity-Based Answer Prediction
In this section, we introduce the Similarity-Based Answer-prediction (SimBA) method for predicting the answer for a product question, based on the answers for other similar product questions. We restrict our study to yes/no questions only, due to their popularity in the PQA domain (54% on our PQA dataset), and following common practices in answer prediction studies McAuley and Yang (2016); Yu and Lam (2018). Figure 1 presents our prediction framework and its main components.

Formally, a question-product-answer tuple is denoted by , where . is the set of tuples of a given product category. 444The answer for the target record is unknown. is the target record of an unanswered question , asked about product . We treat as the knowledge-base we use for answering .
Given a target record , in order to predict its answer , we first retrieve a set of records from with the most similar questions to (Figure 1, stage 1). We denote the retrieved records as siblings of . We then filter the siblings by applying a Question-to-Question similarity (Q2Q) model, keeping only records with highly similar questions which are expected to have the same question intent as of , (Figure 1, stage 2). We denote these records as twins of . We then apply our Contextual Product Similarity (CPS) model to measure the contextual similarity between and its twins (Figure 1, stage 3). The CPS similarity score is used to weight the twins by considering them as voters, applying a mixture-of-experts model over their answers for the final answer prediction (Figure 1, stage 4). More details about the model’s components, the training processes, and other specifications, are described in the following.
3.1 Sibling Retrieval
Given a target record , and a corpus of product-question-answer records , our first goal is to retrieve all records with a question having the same intent as of . As might be very large, applying a complex neural model to measure the similarity of each question in to is often infeasible. We therefore apply a two step retrieval process. In a preliminary offline step, we index the records in by creating embedding vectors for their questions, using a pre-trained encoder. For retrieval, done both during training and inference, we similarly embed the question into vector . We then use a fast Approximate K Nearest Neighbors (AKNN) search to retrieve records, with the most similar questions, based on the cosine similarity between and the embedding vectors of the questions in . We denote the set of retrieved siblings of by .
3.2 Twin detection
The retrieved sibling records are those with the most similar questions to the target question. In the second step of the retrieval process, we enhance our record selection by applying a highly accurate transformer-based Question-to-Question (Q2Q) classifier (See Section 5.1), which we train over our question to question similarity dataset (Section 4.1). The classifier predicts the similarity between a target question and each of the questions in . A record is considered a twin of if , where is a hyper-parameter of the system. We denote the set of twins of by .
3.3 Contextual Product Similarity (CPS)
We consider products and to be contextually similar, with respect to a yes/no question , if the answer to on both products is the same555By design, both products belong to the same product category , which prevents comparing unrelated products. For example, comparing an airhorn and a computer fan in the context of the question is it loud is therefore prevented.. Given a pair of twin records , our CPS model is aims to predict the contextual similarity between them, i.e. whether their (highly similar) questions have the same answer.
Since and are twins, their questions are expected to have the same intent; yet, they might be phrased differently. To avoid losing any information, we provide both questions as input to the CPS model, during training and during inference time.
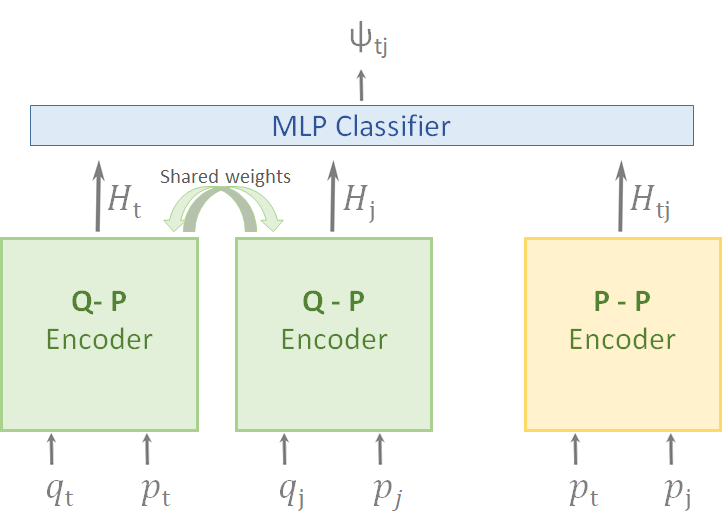
CPS Model Architecture
Figure 2 depicts the CPS model for predicting the contextual similarity between a target record , and one of its twins - record . For each record, the question-product pair is embedded using a pre-trained transformer encoder, allowing the product textual content and the question text attend each other666The product textual content can be accumulated from several resources. In our experiments, we restrict the product content to its title and bullet points.:
The two models share weights to avoid over-fitting and for more efficient learning. A second encoder embeds the textual content of both products, encapsulating the similarity between them:
Then, a one hidden MLP layer takes the concatenation of the three embedding vectors, to predict the probability of ,
| (1) |
Another key advantage of the CPS model is its ability to be trained on a large scale, without human annotations, by simply yielding the training labels directly from the polarity between the answers of twin pairs extracted from our training data. For any pair of twins :
| (2) |
| Question 1 | Question 2 | Label |
|---|---|---|
| Can this be used with regular light bulbs? | Can i put a regular light bulb in this? | Similar |
| Can i use these labels in a laser printer? | Can this be used in laser printer? | Similar |
| Does the hat have an adjustable strap inside? | Does the hat adjust inside? | Similar |
| Can this organizer hold sleeved cards? | Can it hold cards with sleeves on them? | Similar |
| Does this phone have bluetooth? | Does the phone have gps? | Different |
| Can just two player play this game | Whats the length of play of this game? | Different |
| Is there a diffuser for this dryer? | Can this go in the dryer? | Different |
| What material is the neck strap made of? | Does this come with a neck strap? | Different |
3.4 Mixture of Experts
A mixture of experts is a widely-used method to combine the outputs of several classifiers by associating a weighted confidence score with each classifier Jacobs et al. (1991). In our setting, experts are individual twins that lend support for or against a particular answer for a question. Each twin is weighted by its contextual similarity to the target record , as predicted by the CPS model.
Given a target record , the weight of each of its twins, is determined by
where , and is a lower weight-limit; a hyper-parameter that we tune on the development set.777We tried using the CPS raw score for all twins, i.e. , however, using a fine-tuned minimal weight yielded better results.
The predicted class of is therefore derived by
| (3) |
where positive/negative indicates ‘yes’/‘no’ respectively, and
Our methodology can be easily expanded to incorporate more answer predictors (voters) of different types into SimBA. An example for such an expansion is described at Section 5.3.
4 Datasets
We introduce two new datasets to experiment with our answer prediction approach: 1) The Amazon Product Question Similarity (Amazon-PQSim) dataset which is used to train our Q2Q model; 2) The Amazon Product Question Answers (Amazon-PQA) dataset of product related Q&As, used for training the SimBA model.
4.1 Amazon-PQSim Dataset
We collected a first-of-a-kind question-to-question similarity dataset of product-question pairs from the Amazon website (Amazon-PQSim. See Table 2 for examples). Unlike the Quora dataset of general question pairs888https://www.kaggle.com/c/quora-question-pairs, product questions are asked in the context of a designated product page. This makes them unique and different from questions asked in other domains. For example, the question Is it waterproof?, when appears on the Fitbit Flyer detailed page, should implicitly be interpreted as Is Fitbit Flyer waterproof?.
The following steps were taken for the data collection: (a) randomly sampling product-questions from the Amazon website. (b) filtering out some of these questions (e.g., non-English questions, for more details, see Appendix A). (c) For each of the remaining questions, we retrieved up to three candidate similar questions from the collection. A question is paired with the original question if the Jaccard similarity among them is in the range of . We ignore highly similar questions () since we don’t want nearly verbatim pairs in our dataset, as well as dissimilar pairs (). (d) Finally we used the Appen crowd-sourcing platform999https://appen.com for manual annotation of question pairs similarity 101010As the questions are asked in context of a specific product, they are often written in an anaphoric form (e.g. Is it waterproof?). To keep our dataset general, we instructed the judges to accept such questions as if they included the actual related product name. For example, the pair Is it waterproof? and Is this Fitbit waterproof? were labeled as similar.. Each question pair was labeled by at least three judges, and up to seven, until reaching agreement of 70% or more.
The above steps resulted in a nearly balanced dataset (1.08 positive-negative ratio) of more than 180K product question pairs with judges agreement of 70% or more, and among them about 90K question pairs have perfect judges agreement (1.14 positive-negative ratio).
4.2 Amazon-PQA Dataset
We collected a large corpus of product questions and answers from the Amazon website, similar to the popular Amazon Q&A dataset McAuley (2016). Since our answer prediction method directly utilizes an existing corpus of resolved questions, we aim to collect all available questions per narrow sub-category instead of a sample of questions across broad categories by the popular Amazon Q&A dataset. For example, instead of sampling from the broad Electronics category, we collect all questions under the narrower Monitors and Receivers categories.
Raw Data Extraction
Yes/No Question Classification
Yes/No Answer Labeling
Questions are typically answered by free-text answers, posted independently by multiple users. In order to convert these answers into a single yes/no answer, we first classified each answer into one of three classes: yes, no and maybe, and then used majority vote among the classified answers. We used a pre-trained RoBERTa-based classifier, and trained the model on McAuley’s dataset McAuley (2016), taking only yes/no questions. See Appendix A for details.
5 Experiments
We experiment with eleven product categories covered by our Amazon-PQA dataset (Section 4.2), training a SimBA answer prediction model for each of the categories independently. Next, we describe the data preparation steps for each of the SimBA components.
5.1 Data Preparation
Sibling Retrieval Using AKNN
For each record ( is the category dataset), we use AKNN to retrieve the top- similar siblings from , while making sure that neither of them share the same product with . We collect training example pairs by coupling each record with each of its siblings: .
For retrieval we use Universal Sentence Encoder (USE) Cer et al. (2018) to embed each question into a 512-length vector . We use the Annoy111111https://github.com/spotify/annoy python library for the implementation of efficient AKNN retrieval. In all experiments, for each record we retrieve the top-K similar records, based on the cosine-similarity between the embedding vectors.
Twin Detection Using the Q2Q Model
For each sibling pair , we use our Q2Q model to score their question-similarity and keep only those with to yield a collection of twin pairs, . We use to ensure only highly similar question pairs.
For our Q2Q model, we apply a standard pre-trained RoBERTa Liu et al. (2019) classifier. Specifically, we use Hugging-Face base-uncased pre-trained model121212https://github.com/huggingface/transformers and fine-tune131313We use batch size 32, maximum sequence length of 128, learning rate 5e-5, and 3 epochs. it for the classification task on our Q2Q dataset141414We only used the examples with full agreement., while splitting the data into train, dev and test sets with 80%-10%-10% partition, respectively. For (its minimal value) the model achieves test accuracy of 83.2% with a precision of 81.3% and a recall of 87.7%. When setting the twin confidence level threshold to , the precision of the Q2Q model raises to 89.9% with a recall of 69.5%.
We compare the performance of the Q2Q similarity classifier with several unsupervised baselines, namely: (a) Jaccard similarity, (b) cosine similarity over USE embedding, and (c) cosine similarity over RoBERTa151515Hugging-Face sentence-transformers roberta-large-nli-stsb-mean-tokens model. embedding. The results are summarized in Table 3, showing that the Q2Q model significantly outperforms these baselines.
| Majority | Jaccard | USE | RoBERTa | Q2Q |
| vote | similarity | cosine | cosine | |
| 53.1 | 62.0 | 69.6 | 70.7 | 83.2 |
5.2 CPS Model
Training
The CPS model predicts the contextual similarity between a pair of twin records. In our experiments, the textual content of a product consists of the product title concatenated with the product bullet points, separated by semicolons. The question text is the original query as appeared in the Amazon PQA-dataset. For the encoding modules of the CPS model we use a standard pre-trained RoBERTa-based model as well, while using the token for separating the two inputs to each encoder. For training, twin pairs are labeled according to their contextual similarity using Equation 2.
We train, fine-tune, and test, an independent CPS model for each category set , using , , and (details of the data split described in Appendix A). The training set is created as described in Section 5.1. and , are created the same with one modification – rather than retrieving the siblings for a record from the dataset it belongs to, the siblings are retrieved from , for both , and . This represents a real-world scenario where existing products with their related questions are used as a corpus for predicting the answer to a question about a new product. Each product with all related questions appear only in one of these sets.
Evaluation
We evaluate the CPS model by measuring the accuracy of its contextual similarity prediction over . The accuracy per category is presented in Table 4.
| Category | Acc | Majority | |
|---|---|---|---|
| Light Bars | 73.9 | 61.1 | +12.8 |
| Monitors | 78.2 | 68.2 | +9.9 |
| Smartwatches | 80.0 | 65.6 | +14.4 |
| Receivers | 77.5 | 67.6 | +9.9 |
| Backpacks | 83.9 | 76.0 | +7.9 |
| Jeans | 71.3 | 59.3 | +11.9 |
| Beds | 84.6 | 72.0 | +12.6 |
| Home Office Desks | 73.9 | 63.4 | +10.5 |
| Masks | 75.1 | 66.9 | +8.2 |
| Posters & Prints | 72.3 | 60.9 | +11.5 |
| Accessories | 79.1 | 72.4 | +6.6 |
| Macro Average | 77.2 | 66.7 | +9.7 |
The model achieves a relatively high accuracy with a macro average of 77.2% over all categories, presenting a significant lift of 9.7% over the majority decision baseline. This is an encouraging result, considering the fact that the answers for many questions cannot be directly inferred from the product textual information. We conjecture that the model is able to learn the affinity between different products, in the context of a given question, for predicting their contextual similarity. For example, the two backpacks Ranvoo Laptop Backpack and Swiss Gear Bungee Backpack, were correctly classified by the CPS model as similar () in context of the question “Will this fit under a plane seat?”, and classified as different () in context of the question “Does it have a separate laptop sleeve?”.
5.3 Answer Prediction Methods
We experiment with our SimBA model and with a few baselines over the test set of all categories. The first one is Majority which returns the majority answer among all records in the category. Other methods are described next.
SimBA
Given a target record , SimBA scores each of its twins by the CPS model and predicts the answer for , using Equation 3. was fine-tuned on the combined dev set of all categories and was set to 0.38.
Question Similarity Only (QSO)
We modify the SimBA model to ignore the CPS classification score when implementing the Mixture-of-Experts model (Eq. 3), by setting an equal weight of to all twin votes:
Product Similarity Only (PSO)
We modify the SimBA model by setting and to empty strings at the input of the CPS model, both during training and during inference, forcing it to rely on the products’ textual content alone. The twin retrieval process remains untouched.
Answer Prediction Classifier (APC)
We experiment with a direct prediction approach that only considers the product textual content and the question for answer prediction. For each category , we fine-tune a pre-trained RoBERTa-based classifier over all records , using and (separated by the token) as input and as the training label.
SimBA+APC
The experimental results show that different answer-prediction methods (e.g. SimBA vs APC) may be preferable for different product categories. Therefore, we combine both methods, for achieving optimal results, by mixing the vote of APC with the twin votes, using the Mixture-of-Experts approach:
where is the APC predicted answer, and , and for , and , respectively161616We also tried a few different splits on the development set. All values () are fine-tuned on the development set for each category separately. The values we used are detailed in Table 10 in Appendix A.
| # Twins | Answer | |
|---|---|---|
| (Monitors) Does this require WiFi? | 51 | 91% No |
| (Backpacks) Will it fit under a plane seat? | 213 | 90% Yes |
| (Smartwatches) Can it measure blood sugar level? | 34 | 97% No |
| (Smartwatches) Does it come with a charger? | 269 | 96% Yes |

| Questions with 1+ Twins | Questions with 60+ Twins | |||||||
|---|---|---|---|---|---|---|---|---|
| % of data | SimBA | APC | SimBA+APC | % of data | SimBA | APC | SimBA+APC | |
| Light bars | 62.5 | 75.3 | 74.8 | 77.7 | 9.0 | 74.1 | 68.1 | 75.0 |
| Monitors | 79.2 | 76.0 | 76.4 | 76.5 | 27.0 | 78.5 | 78.5 | 78.5 |
| Smartwatches | 88.3 | 77.3 | 79.3 | 79.0 | 31.9 | 79.9 | 81.7 | 80.8 |
| Receivers | 57.5 | 70.1 | 70.3 | 72.0 | 4.8 | 83.2 | 77.9 | 83.2 |
| Backpacks | 74.7 | 80.7 | 82.7 | 82.3 | 21.5 | 82.7 | 83.2 | 82.9 |
| Jeans | 63.3 | 67.4 | 65.9 | 67.4 | 13.4 | 74.8 | 70.9 | 75.7 |
| Beds | 70.4 | 77.7 | 76.4 | 77.9 | 16.8 | 82.5 | 80.4 | 82.5 |
| Home & office desks | 65.0 | 71.8 | 76.2 | 75.8 | 4.7 | 80.0 | 84.4 | 84.4 |
| Masks | 76.5 | 70.9 | 74.2 | 73.0 | 4.2 | 80.4 | 82.6 | 80.4 |
| Posters & prints | 60.1 | 73.4 | 73.4 | 74.4 | 9.3 | 75.9 | 69.6 | 75.9 |
| Accessories | 71.7 | 78.1 | 79.0 | 79.2 | 7.2 | 82.3 | 81.6 | 82.7 |
| Macro Average | 69.9 | 74.4 | 75.3 | 75.9 | 13.6 | 79.5 | 78.1 | 80.2 |
5.4 Answer Prediction Evaluation
The answer prediction accuracy results of all tested predictors, macro-averaged over of all categories, are presented in Figure 3. We inspect the performance of the methods on different subsets of the test data, where each subset is determined by all records having at least twins, . The horizontal axis indicates the minimal number of twins in the subset and the percentage of the data each subset represents. For example, the results at represent the entire test set, while the results at represents the subset of questions with at least 10 twins, account for 40.2% of the test set.
The performance of Majority begins with (the percent of ‘yes’ questions in the entire population) and drops for questions with many twins. We hypothesize that "obvious" questions, for which the answer is the same across many products, are rarely asked hence have fewer twins. In contrast, informative questions, for which the answer is varied across products, are frequently asked w.r.t. many products, hence have many twins. Therefore we see a drop in accuracy of the Majority baseline as the number of twins grows.
The accuracy of QSO is significantly higher than the majority-vote baseline. This demonstrates an interesting phenomena in the data of similar questions that tend to have the same answer over variety of products, typically of the same type. A few examples are presented in Table 5. The QSO method successfully detects these groups of questions and predicts the majority answer for each such group. We find that PSO method generally doesn’t improve over QSO. This is somewhat surprising, as we expected that using product similarity information, such as brand, model, or key features, would increase the prediction accuracy. This demonstrates the importance of question-context, as used in SimBA, in addition to the product information alone.
Moving to SimBA, we can see a large performance improvement over the QSO and PSO methods, which we attribute directly to the CPS model. We also see consistent improvement in accuracy with the number of twins, likely due to the larger support the model has for predicting the answer.
The APC method, despite its relative simplicity, performs very well and greatly outperforms the majority-vote and the QSO and PSO baselines. For the segment of questions with less than 10 twins, APC outperforms the SimBA method. This segment represents roughly 60% of the questions. However, for the segment of questions with 60 or more twins, which accounts for 13.6% of the questions, SimBA method consistently outperforms the inductive baseline by 1-2%. When inspecting the results by category, as shown in Table 6, we can see that considering all questions with at least 1 twin, the APC method dominates in 7 out of the 11 categories, while for questions with at least 60 twins, SimBA method dominates in 6 out of the 11 categories.
Finally, we see that the two approaches compliment each other and can be effectively joined, as the SimBA+APC method outperforms both of them over all subsets.
6 Conclusions
We presented SimBA, a novel answer prediction approach in the PQA domain, which directly leverages similar questions answered with respect to other products. Our empirical evaluation shows that on some segments of questions, namely those with roughly ten or more similar questions in the corpus, our method can outperform a strong inductive method that directly utilizes the question and the textual product content. We further show that the two approaches are complementary and can be integrated to increase the overall answer prediction accuracy.
For future work, we plan to explore how SimBA can be extended and be applied beyond yes-no questions, e.g., for questions with numerical answers or open-ended questions. Another interesting research direction is combining additional voters to the Mixture-of-Experts model, such as a review-aware answer predictor or a product details-based predictor. Additionally, our current evaluation considered a static view of the answered product-question corpus, we plan to explore temporal aspects of our method, for example, considering questions age or ignoring answers of obsolete products that might be irrelevant.
Acknowledgments
Ohad Rozen would like to express his gratitude to Yanai Elazar, Vered Shwartz, and Ido Dagan for providing him valuable advice while he was conducting this research during his internship at Amazon.
References
- Carmel et al. (2018) David Carmel, Liane Lewin-Eytan, and Yoelle Maarek. 2018. Product question answering using customer generated content - research challenges. SIGIR ’18, page 1349–1350. Association for Computing Machinery.
- Cer et al. (2018) Daniel Cer, Yinfei Yang, Sheng-yi Kong, Nan Hua, Nicole Limtiaco, Rhomni St. John, Noah Constant, Mario Guajardo-Cespedes, Steve Yuan, Chris Tar, Yun-Hsuan Sung, Brian Strope, and Ray Kurzweil. 2018. Universal sentence encoder. CoRR, abs/1803.11175.
- Chen et al. (2019) Long Chen, Ziyu Guan, Wei Zhao, Wanqing Zhao, Xiaopeng Wang, Zhou Zhao, and Huan Sun. 2019. Answer identification from product reviews for user questions by multi-task attentive networks. In Proceedings of the AAAI Conference on Artificial Intelligence, volume 33, pages 45–52.
- Cui et al. (2017) Lei Cui, Shaohan Huang, Furu Wei, Chuanqi Tan, Chaoqun Duan, and Ming Zhou. 2017. Superagent: A customer service chatbot for e-commerce websites. In Proceedings of ACL 2017, System Demonstrations, pages 97–102.
- Das et al. (2019) Manirupa Das, Zhen Wang, Evan Jaffe, Madhuja Chattopadhyay, Eric Fosler-Lussier, and Rajiv Ramnath. 2019. Learning to answer subjective, specific product-related queries using customer reviews by adversarial domain adaptation. CoRR, abs/1910.08270.
- Deng et al. (2020) Yang Deng, Wenxuan Zhang, and Wai Lam. 2020. Opinion-aware answer generation for review-driven question answering in e-commerce. In Proceedings of CIKM 2020, page 255–264. Association for Computing Machinery.
- Fan et al. (2019) Miao Fan, Chao Feng, Mingming Sun, Ping Li, and Haifeng Wang. 2019. Reading customer reviews to answer product-related questions. In Proceedings of the 2019 SIAM International Conference on Data Mining, pages 567–575. SIAM.
- Gao et al. (2019) Shen Gao, Zhaochun Ren, Yihong Eric Zhao, Dongyan Zhao, Dawei Yin, and Rui Yan. 2019. Product-aware answer generation in e-commerce question-answering. In Proceedings WSDM 2019, pages 429–437. ACM.
- He and Dai (2011) Jing He and Decheng Dai. 2011. Summarization of yes/no questions using a feature function model. volume 20 of Proceedings of Machine Learning Research, pages 351–366, South Garden Hotels and Resorts, Taoyuan, Taiwain. PMLR.
- Jacobs et al. (1991) Robert A. Jacobs, Michael I. Jordan, Steven J. Nowlan, and Geoffrey E. Hinton. 1991. Adaptive mixtures of local experts. Neural Comput., 3(1):79–87.
- Jeon et al. (2005) Jiwoon Jeon, W Bruce Croft, and Joon Ho Lee. 2005. Finding similar questions in large question and answer archives. In Proceedings CIKM 2005, pages 84–90.
- Lai et al. (2018) T. M. Lai, T. Bui, N. Lipka, and S. Li. 2018. Supervised transfer learning for product information question answering. In Proceedings of ICMLA 2018, pages 1109–1114.
- Liu et al. (2019) Yinhan Liu, Myle Ott, Naman Goyal, Jingfei Du, Mandar Joshi, Danqi Chen, Omer Levy, Mike Lewis, Luke Zettlemoyer, and Veselin Stoyanov. 2019. Roberta: A robustly optimized BERT pretraining approach. CoRR, abs/1907.11692.
- McAuley (2016) Julian McAuley. 2016. Amazon question/answer data. https://jmcauley.ucsd.edu/data/amazon/qa/".
- McAuley and Yang (2016) Julian J. McAuley and Alex Yang. 2016. Addressing complex and subjective product-related queries with customer reviews. In Proceedings WWW 2016, pages 625–635. ACM.
- Park et al. (2015) Dae Hoon Park, Hyun Duk Kim, ChengXiang Zhai, and Lifan Guo. 2015. Retrieval of relevant opinion sentences for new products. In Proceedings SIGIR 2015, pages 393–402. ACM.
- Pourgholamali (2016) Fatemeh Pourgholamali. 2016. Mining information for the cold-item problem. In Proceedings of RecSys 2016, page 451–454. ACM.
- Wan and McAuley (2016) Mengting Wan and Julian McAuley. 2016. Modeling ambiguity, subjectivity, and diverging viewpoints in opinion question answering systems. In Proceeding of ICDM 2016, pages 489–498. IEEE.
- Yu et al. (2018) Jianfei Yu, Minghui Qiu, Jing Jiang, Jun Huang, Shuangyong Song, Wei Chu, and Haiqing Chen. 2018. Modelling domain relationships for transfer learning on retrieval-based question answering systems in e-commerce. In Proceedings of WSDM 2018, page 682–690. ACM.
- Yu et al. (2012) Jianxing Yu, Zheng-Jun Zha, and Tat-Seng Chua. 2012. Answering opinion questions on products by exploiting hierarchical organization of consumer reviews. In Proceedings of EMNLP 2012, pages 391–401. ACL.
- Yu and Lam (2018) Qian Yu and Wai Lam. 2018. Review-aware answer prediction for product-related questions incorporating aspects. In Proceedings of WSDM 2018, pages 691–699. ACM.
Appendix A Supplemental Material
A.1 Amazon-PQSim dataset
The Amazon-PQSim dataset includes question pairs, where all questions are published on Amazon website. Each pairs has a corresponding label: 1 for similar, else 0. The labels were collected via Appen crowd sourcing service. We took the following filtering steps (step b in 4.1) for each question:
-
•
Removed any question with less than five words.
-
•
Removed any question with more than 15 words.
-
•
Removed any none-English questions.
-
•
Removed any question with multiple question-marks (may indicate multiple questions).
-
•
Removed questions with rare words (any word which is not in the top 2000 most frequent words).
A.2 Amazon-PQA dataset
The Amazon-PQA dataset includes questions and their answers that are published on Amazon website, along with the public product information and category (Amazon Browse Node name). The data includes the following fields:
-
•
‘question_id‘,
-
•
‘asin_id‘,
-
•
‘question_text‘,
-
•
‘answer_text‘,
-
•
‘bullet_points‘,
-
•
‘product_description‘,
-
•
‘brand_name‘,
-
•
‘item_name ‘,
In addition, we augment this data with fields derived from our current work:
-
•
‘is_yes-no_question‘,
-
•
‘yes-no_answer‘ (yes, no, maybe),
Yes/No Question Classification
We followed He and Dai (2011) for detecting Yes/No questions using simple heuristics, such as checking if the question starts with a Be verb (am, is, are, been, being, was, were), Modal verb (can, could, shall, should, will, would, may, might) or an Auxiliary verb (do, did, does, have, had, has), and additionally ends with a question mark. We tested the classifier on McAuley’s dataset McAuley (2016), identified yes/no questions with 98.4% precision at 96.5% recall, while considering McAuley as ground truth171717McAuley and Yang reported identifying yes/no questions with 97% precision at 82% recall on their dataset..
Yes/No Answer Labeling
As described in Section A.2, we used the McAuley dataset McAuley (2016) to train a RoBERTa-based classifier, taking only yes/no questions. For testing, we used 5 annotator to annotate 583 question-answer pairs, randomly sampled from our raw data. The model achieved 97% and 88% precision for the yes and no labels, respectively, and a recall of 65% and 51% on the entire test set181818McAuley and Yang reported 98% accuracy after keeping only the 50% of instances about which their classifier was the most confident..
Next, to determine each question’s final yes/no answer, we first omitted answers classified as maybe. When a question is answered by a verified seller, we considered it as most reliable and used it as the final label. Otherwise we used the majority votes among the remaining answers. In our experiments, we ignore questions with an equal number of yes and no answers.
Dataset Split
Each item in our dataset is a (product, question, answer) triplet. We split the labeled triplets into train (80%), dev (10%), and test (10%) sets for each category, relating to the number of products. Each product with all related questions appear only in one of these sets. The statistics for this dataset are given in Table 8.
A.3 CPS Model Details
The CPS has a total of 254.6M parameters. For all incorporated RoBERTa models we use a maximum sequence length of 256, dropout of 0.1 , and a 32 batch size for training. We applied different learning rates and number of epochs for each product-category. The specific values we used after tuning are shown in Table 9.
| Category | # Products | # Questions | # Y/N Questions | # Answers | # Q. Answered Yes | # Q. Answered No |
|---|---|---|---|---|---|---|
| Light Bars | 6,151 | 48,736 | 23,956 | 95,853 | 10,146 | 5,243 |
| Monitors | 6,246 | 170,529 | 86,837 | 316,126 | 35,353 | 22,947 |
| Smartwatches | 8,611 | 166,400 | 94,936 | 289,945 | 41,683 | 22,033 |
| Receivers | 3,442 | 58,618 | 33,511 | 135,700 | 14,488 | 7,364 |
| Backpacks | 12,096 | 68,598 | 38,914 | 138,996 | 19,902 | 6,090 |
| Jeans | 38,008 | 61,908 | 17,518 | 129,346 | 7,708 | 5,548 |
| Beds | 17,202 | 108,723 | 46,722 | 238,786 | 17,757 | 13,917 |
| Home Office Desks | 6,986 | 55,303 | 23,202 | 112,958 | 9,523 | 5,971 |
| Masks | 13,384 | 51,295 | 24,989 | 100,789 | 9,757 | 5,759 |
| Posters & Prints | 33,803 | 53,939 | 20,737 | 99,926 | 8,171 | 5,450 |
| Accessories | 38,825 | 238,603 | 159,272 | 438,447 | 60,990 | 23,772 |
| Rest of 89 Categories | 1,288,754 | 8,906,362 | 4,833,639 | 18,565,933 | 2,219,022 | 1,055,816 |
| Total | 1,473,508 | 9,989,014 | 5,404,233 | 20,662,805 | 2,454,500 | 1,179,910 |
| Train Set | Dev Set | Test Set | Total | |||||||||
|---|---|---|---|---|---|---|---|---|---|---|---|---|
| Category | # P | # Q | % Yes | # P | # Q | % Yes | # P | # Q | % Yes | # P | # Q | % Yes |
| Light bars | 2,552 | 8,675 | 68.1 | 319 | 1,080 | 68.7 | 319 | 1,296 | 69.2 | 3,190 | 11,051 | 68.3 |
| Monitors | 3,421 | 29,886 | 63.3 | 427 | 3,890 | 64.7 | 427 | 4,260 | 63.0 | 4,275 | 38,036 | 63.4 |
| Smartwatches | 4,128 | 34,734 | 68.5 | 516 | 3,730 | 66.4 | 516 | 3,778 | 67.8 | 5,160 | 42,242 | 68.3 |
| Receivers | 1,725 | 11,991 | 69.2 | 215 | 1,827 | 68.1 | 215 | 2,356 | 65.7 | 2,155 | 16,174 | 68.5 |
| Backpacks | 4,834 | 14,740 | 78.4 | 604 | 1,397 | 75.9 | 604 | 1,908 | 77.3 | 6,042 | 18,045 | 78.0 |
| Jeans | 5,365 | 6,056 | 61.3 | 670 | 773 | 59.8 | 670 | 769 | 58.1 | 6,705 | 7,598 | 60.8 |
| Beds | 5,912 | 16,792 | 59.1 | 739 | 2,017 | 58.3 | 739 | 2,276 | 58.3 | 7,390 | 21,085 | 58.9 |
| Home Office Desks | 2,576 | 8,637 | 62.7 | 322 | 1,059 | 64.3 | 322 | 962 | 62.9 | 3,220 | 10,658 | 62.9 |
| Masks | 4,332 | 8,541 | 64.8 | 541 | 1,180 | 64.0 | 541 | 1,099 | 63.1 | 5,414 | 10,820 | 64.5 |
| Posters & Prints | 5,739 | 7,226 | 62.7 | 717 | ,868 | 62.4 | 717 | 850 | 66.0 | 7,173 | 8,944 | 63.0 |
| Accessories | 14,422 | 54,125 | 73.5 | 1,802 | 6,038 | 73.7 | 1,802 | 6,706 | 74.5 | 18,026 | 66,869 | 73.6 |
| Total | 55,006 | 201,403 | 66.5* | 6,872 | 23,859 | 66.0* | 6,872 | 26,260 | 66.0* | 68,750 | 251,522 | 66.4* |
| Category | # Epochs | Learning Rate |
|---|---|---|
| Light Bars | 3 | 3.0E-5 |
| Monitors | 4 | 3.0E-5 |
| Smartwatches | 3 | 3.0E-5 |
| Receivers | 4 | 3.0E-5 |
| Backpacks | 4 | 3.0E-5 |
| Jeans | 3 | 2.0E-5 |
| Beds | 4 | 4.0E-5 |
| Home Office Desks | 3 | 2.0E-5 |
| Masks | 3 | 3.0E-5 |
| Posters & Prints | 3 | 2.0E-5 |
| Accessories | 3 | 2.0E-5 |
| Category | |||
|---|---|---|---|
| Light Bars | 3 | 8 | 2 |
| Monitors | 6 | 2 | 63 |
| Smartwatches | 2 | 11 | 49 |
| Receivers | 2 | 0 | 0 |
| Backpacks | 1 | 4 | 17 |
| Jeans | 7 | 8 | 22 |
| Beds | 1 | 0 | 0 |
| Home Office Desks | 4 | 1 | 38 |
| Masks | 4 | 6 | 3 |
| Posters & Prints | 5 | 0 | 18 |
| Accessories | 1 | 2 | 16 |