Analysis of Twitter and YouTube during USelections 2020
Abstract.
The presidential elections in the United States on 3 November 2020 have caused extensive discussions on social media. A part of the content on US elections is organic, coming from users discussing their opinions of the candidates, political positions, or relevant content presented on television. Another significant part of the content generated originates from organized campaigns, both official and by astroturfing.
In this study, we obtain approximately 17.5M tweets containing 3M users, based on prevalent hashtags related to US election 2020, as well as the related YouTube links, contained in the Twitter dataset, likes, dislikes and comments of the videos and conduct volume, sentiment and graph analysis on the communities formed.
Particularly, we study the daily traffic per prevalent hashtags, plot the retweet graph from July to September 2020, show how its main connected component becomes denser in the period closer to the elections and highlight the two main entities (’Biden’ and ’Trump’). Additionally, we gather the related YouTube links contained in the previous dataset and perform sentiment analysis. The results on sentiment analysis on the Twitter corpus and the YouTube metadata gathered, show the positive and negative sentiment for the two entities throughout this period. The results of sentiment analysis indicate that 45.7% express positive sentiment towards Trump in Twitter and 33.8% positive sentiment towards Biden, while 14.55% of users express positive sentiment in YouTube metadata gathered towards Trump and 8.7% positive sentiment towards Biden. Our analysis fill the gap between the connection of offline events and their consequences in social media by monitoring important events in real world and measuring public volume and sentiment before and after the event in social media.
1. Introduction
Today social networks have a very important role in online social discourse and especially during pre-elections period. OSNs can either be used productively to perform dissemination, communication or administration in elections, like in (howard2018algorithms). The content posted by the users can represent their political belief or is either used to comment, be sarcastic or express negative opinion towards a political party or ideology. Twitter and YouTube while constitute two of the most popular online social networks attracting million of users daily, capture a very important proportion of this online discourse.
Through analysis of this online discourse we can discover the main tendencies and preference of the electorate, generate patters that can distinguish users’ favouritism towards an ideology or a specific political party, study the sentiment prevailed towards the political parties or even predict the outcome of the elections. Analyzing the sentiment is a necessary step towards any of these directions. We are not focusing on the prediction of the electoral outcome, or sarcasm detection, but rather exploring the sentiment towards the political parties in Twitter and YouTube, as well.
Sentiment analysis have been extensively studied in Twitter, usually studying a specific event. Through sentiment analysis we can visualize the variation of sentiment of the electorate during a political event [(Wang et al., 2012; Diakopoulos and Shamma, 2010)], a company event [(Daniel et al., 2017)], product reviews [(Mukherjee and Bhattacharyya, 2012)] or model the public mood and emotion and connect tweets’ sentiment features with fluctuations with real events [(Bollen et al., 2009)]. The main task of these works is to predict elections, classify the electorate and distinguish posts towards one political party or ideology, although is has been addressed in many works that Twitter is not suitable for elections prediction [(Gayo-Avello, 2013; Gayo-Avello et al., 2011)].
Sentiment in these analyses is represented by a variable with values like ’Positive’, ’Negative’ and ’Neutral’, or even more specific (’Happy’,’Angry’, etc.). Each word in the corpus can be assigned with more than one sentiment (’Positive’ and ’Negative’). Other metrics that can be measured in this analysis, are ’subjectivity’ and ’polarity’, where the first one is defined as the ratio of ’positive’ and ’negative’ tweets to ’neutral’ tweets, while the second is defined as the ratio of ’Positive’ to ’Negative’ tweets. There is a plethora of works of sentiment analysis in Twitter [(Martínez-Cámara et al., 2014; Giachanou and Crestani, 2016; Go et al., 2009; Mittal and Goel, 2012; Saif et al., 2012)].
Sentiment analysis usually requires ’text normalization’, an initial preprocessing of the corpus in order to extract the lexical features that can significantly affect the performance [(Kolchyna et al., 2015; Pak and Paroubek, 2010; Jianqiang and Xiaolin, 2017)]. The steps of the preprocessing include tokenization, expansion of abbreviations and removal of stop words (URLs, mentions etc.).
In this study we obtain the most popular hashtags around the US elections and gather a dataset of 7.5M tweets, for a period of three months. We extract 16.642 unique YouTube videos contained in this dataset as well as their metadata (likes, comments, authors etc.). Initially, we perform a volume analysis and an association of the diverse features of the YouTube videos. The next step is to identify two main entities (‘Trump’ and ‘Biden’) in our corpus, in order to perform sentiment analysis. Next, we study the retweet graph in six different time points in our dataset, from July to September 2020 and highlight the two main entities (’Biden’ and ’Trump’). The final section is the sentiment analysis by utilizing Vader sentiment analysis model and we show the higher positive sentiment towards Donald Trump in Twitter (45.7%) and in YouTube (14.55%) in comparison to the positive sentiment expressed towards Joe Biden, by the users in Twitter(33.8%) and YouTube (8.7%).
1.1. Background
Some methods incorporate the use of Twitter features, like emoticons [(Liu et al., 2012; Wang and Castanon, 2015; Zhao et al., 2012; Yamamoto et al., 2014) ]. The main technique that is used in sentiment analysis in Twitter is to incorporate a lexicon, specially made for the domain of the dataset [(Ghiassi and Lee, 2018; Antonakaki et al., 2017)]. In (Kouloumpis et al., 2011) they obtain three different corpora of tweets and explore the usage of linguistic features towards sentiment analysis. In (Zhang et al., 2011) they are adopting a lexicon-based method on diverse Twitter datasets. In (Smailović et al., 2015) they conduct a study of sentiment analysis on a dataset of 26,175 general Bulgarian tweets. Through feature selection and classification (binary SVM) they show that the negative sentiment predominated before and after the election period. We are not compiling a specially made lexicon, because we do not have a language barrier or analyzing a plethora of entities; we are just focusing on the two main candidates.
Sentiment Analysis in Twitter does not have to be limited in one language; there are works studying multiple language datasets [(Wehrmann et al., 2017; Narr et al., 2012; Davies and Ghahramani, 2011; Wehrmann et al., 2017; Guthier et al., 2017; Saroufim et al., 2018; Ptáček et al., 2014; Zhang et al., 2017)]. Recent studies in sentiment analysis use Deep Convolutional Neural Networks [(Severyn and Moschitti, 2015a; Jianqiang et al., 2018; You et al., 2015; Severyn and Moschitti, 2015b; Jianqiang et al., 2018; Wehrmann et al., 2017; Dos Santos and Gatti, 2014; alharbi2019twitter; Severyn and Moschitti, 2015c)]. Our work focuses on a single language (English) which is the dataset based on.
There is a plethora of studies that have used sentiment analysis in the political domain [(O’Connor et al., 2010; Antonakaki et al., 2016)], either for group polarization [(Conover et al., 2011; Colleoni et al., 2014)], during the Arab spring [(Weber et al., 2013)] or for Hugo Chávez [(Morales et al., 2015)]. For example in (Wang et al., 2012) they study a dataset of 36 million tweets on 2012 U.S. presidential candidates and apply a realtime analysis of public sentiment. Using the Amazon Mechanical Turk, they label the dataset with tweets’ sentiment (positive, negative, neutral, or unsure) in order to apply statistical classification (Naïve Bayes model on uni-gram features) on a training set consisting of nearly 17.000 tweets (16% positive,56% negative, 18% neutral, 10% unsure). Also, in (Christensen, 2013) they attempt to understand the broader picture of how Twitter is used by party candidates, understand the content and the level of interaction by followers. More detailed background on Twitter Sentiment Analysis methods can be found on surveys like (Bakshi et al., 2016; Ravi and Ravi, 2015; Serrano-Guerrero et al., 2015; Antonakaki et al., 2020).
Background work on sentiment analysis on YouTube [(Susarla et al., 2012; Wang et al., 2011)], studies the sentiment on user comments [(Thelwall et al., 2012), (Lindgren, 2012)], identifies the trends and demonstrates the influence of real events of user sentiments [(Krishna, 2014)], implements model utilizing audio, visual and textual modalities as sources of information [(Poria et al., 2016)] and studies the popularity indicators and audience sentiments of videos [(Amarasekara and Grant, 2019)]. YouTube analysis has been used to discover irrelevant and misleading metadata [(Bajaj et al., 2016)], to identify spam campaigns [(O’Callaghan et al., 2012)], to discover extremists videos and hidden communities [(Sureka et al., 2010)], to propagate preference information of personalised video [(Baluja et al., 2008)], to estimate causality between user profiles [(Jang et al., 2013)] and to apply opinion mining [(Severyn et al., 2014)]. Our analysis on the YouTube corpus, is based on several metadata from YouTube videos, like user comments, likes and identify the sentiment towards our two main entities: ’Biden’ and ’Trump’.
2. Dataset
2.1. Twitter
In this study, we search for all the prevalent hashtags (#2020election, #Vote, #2020usaelection, #Biden, #BlueWave2020, #donaldtrump, #Election2020, #Elections_2020, #MyPresident, #November3rd etc.) regarding the US elections on 3 November 2020 and obtain the Twitter corpus through Twitter API. The acquisition of the dataset started on 19 July 2020 and finished 22 September 2020. This resulted in a dataset of approximately 17.5M tweets, containing 3M users, with the most prevalent hashtags being #Biden, #Trump2020 and #vote. In table 1 we can see the most popular hashtags, sorted by the number of tweets within which they are contained and in Appendix A, on table 5 the whole list of hashtags used in our analysis.

| Hashtag | Tweets count |
|---|---|
| #Trump2020 | 2.930.633 |
| #VOTE | 2.258.115 |
| #Vote | 1.785.378 |
| #vote | 1.494.138 |
| #Election2020 | 1.277.839 |
| #Biden | 1.129.063 |
| #Debate2020 | 827.446 |
| #VoteBlueToSaveAmerica | 802.793 |
| #BidenHarris2020 | 658.816 |
| #Trump | 597.172 |
Figure 1 shows the total number of tweets per day, for every hashtag contained in our dataset.
2.2. YouTube
From the election tweets, we extracted all the YouTube video links, contained on those tweets. We followed these links and ended up with 16.642 unique videos. Through the YouTube Data API, we obtained all the publicly available data regarding these videos. The accessible data used in this study for each video are:
-
(a)
the number of views, likes, dislikes and comments,
-
(b)
the category where it belongs (e.g. News & Politics, Entertainment, Music, etc.),
-
(c)
the text and the author of each selected comment, and
-
(d)
the YouTube channel that posted the video.
In figure 2 we see how many videos belong to each category. In this study we focus on the election’s topic, so we filtered out the videos that do not belong to the following categories: News & Politics, People & Blogs, and Entertainment. The filtering led to a dataset of 12.538 videos.

From the 12.538 videos, we gathered all the comments and their replies generated between 19/7/20 and 22/9/20. This resulted in a dataset of 3.091.176 unique commenters and 27.927.909 comments and replies. Figure 3 shows the total number of comments and replies per day, related to the elections. We notice an increase in number of comments from July to September, with diurnal patters. Also there is a peak in 21/8 potentially explained by a speech from Joe Biden (Twitter, 2020c) as well as three specific tweets current President Donald Trump posted (Twitter, 2020f; Boggs, 2020; Higgins, 2020).

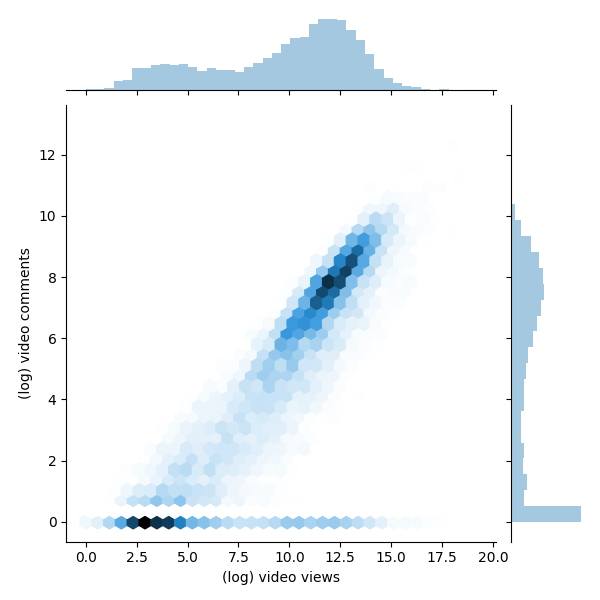
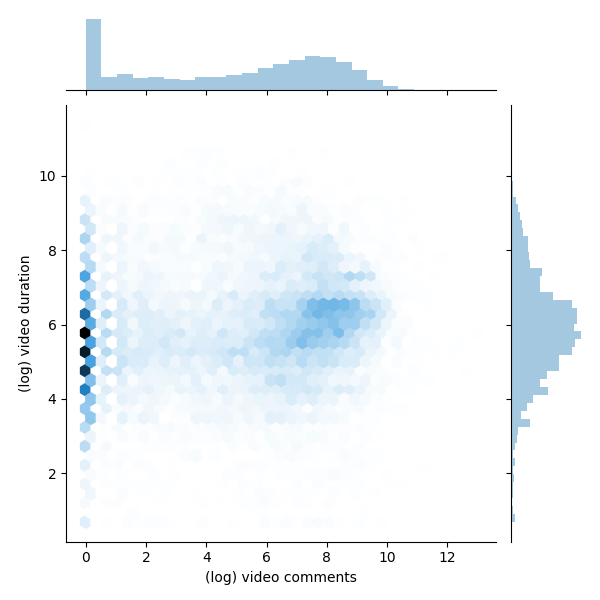
In figure 4 we see different join plots that illustrate the logarithmic relationship between the accessible features of the 12.538 videos. For example, in 4 (a) we see that many videos have 0 comments and close to 0 likes. The main concentration is between 6 and 10. In 4 (e) we see the comparison of views with the duration of a video. The higher concentration of views is between 10 and 15 and for the video duration, between 5 and 8.
 |
 |
| (a) | (b) |
 |
 |
| (c) | (d) |
 |
 |
| (e) | (f) |
3. Methodology
3.1. Text Preprocessing
Initially, for both Twitter and YouTube, we follow a prerequisite set of steps for preprocessing of the corpus (tweets - comments); by removing punctuation symbols, text emojis, URLs, by modifying mentions and hashtags and by removing starting characters of (’@’ and ’#’). This procedure removes the text noise and finally it allows the identification of the entity that was discussed by the users. The next step includes the transformation of the text to lower-case and the tokenization of the collected tweets. Then, we perform lemmatization of each token. This technique normalizes the inflected word forms. As a result of the previous steps, this sentiment analysis will be performed on lower cased and normalized sentences.
3.2. Sentiment Analysis
In our implementation of sentiment analysis, we utilize Vader (Gilbert and Hutto, 2014) sentiment analysis model from python NLTK library(Bird et al., 2009). We choose this particular implementation because it is especially attuned to the sentiment expressed in social media. Vader uses a list of lexical features that are labeled according to their semantic orientation. Thanks to the implementation simplicity, sentiment analysis execution time remains low. Utilizing the already developed sentiment solution, we need to perform text filtering and parse our data to SentimentIntensityAnalyzer function that returns the scores of positive, negative, and neutral sentiment types. In our analysis, we compute such sentiment for each collected tweet and comment in our database and summarize those sentiment scores daily for each particular user. We compute two values of daily sentiment scores per user: summary, where the daily user sentiment is a sum product of scores of tweets that was created by the user at each day; and the average score where the summary score is divided by the number of tweets where a particular entity was mentioned by the user.
| Entity | Key words |
|---|---|
| Trump | trump, donald, donaldtrump, |
| trump2020, votetrumpout, | |
| trumpislosing, dumptrump, | |
| nevertrump, republican | |
| Biden | biden, joseph, bluewave2020, |
| votebluetosaveamerica, voteblue, | |
| ridinwithbiden, neverbiden, democrat |
3.3. The Entities
The sentiment analysis of the corpus develops only the emotion vector of a particular sentence without presenting the entity within it was discussed. To identify the entity that was described at each tweet, we generate the set of keywords for the particular dataset entities (‘Trump’ and ‘Biden’). We are matching those keywords in each text to identify if the entity was used on the specific tweet-comment text. Each time the entity is used in a particular tweet-comment, we assign the sentiment values on those entities to the user who posts this particular tweet. Those entity sentiments are assigned to the user daily, since we are interested in the identification of the user/community dynamic and present how entity sentiment evolves day by day. The two entities along with the corresponding keywords that were used for each one, are on table 2.
3.4. Event consequences
Since our work is based on the analysis of the 2020 US Presidential elections we monitor real world events that may trigger significant user interest in social media. Interesting examples of such events that can be used are the candidates’ debate on TV. The depict of the online conversations regarding these events are visible within our analysis. By analyzing the user engagement of these specific periods, one day before and one day after, shows whether such real world events are connected in the virtual world of social networks. For this reason we selected all TV debate dates and the dates after President trump was diagnosed positive with COVID-19.
4. Results
4.1. Volume Analysis
In this section, we include several volume measures derived from our dataset. Initially, we perform a volume analysis on the whole corpus of the tweets. In figure 5 we plot the cumulative distribution of the daily tweets where we notice that 90% of the times there are 150.000 tweets daily post. In figure 1 we plot the number of tweets per day where we notice the diurnal increases of the posts. In figure 6 we can see the cumulative distribution of the daily tweets per hashtag, where we note the prevailing hashtags of #DonaldTrump, #MAGA, #vote and #Trump.


We plot the daily active users per entity for both Twitter and YouTube in figure 7, for each entity of ‘Trump’ and ‘Biden’ and we notice that the total number of users are increasing from July to September and that the users posting at Twitter and commenting on YouTube for Trump exceed the users for Biden, in Twitter and YouTube respectively. The number of users posting tweets for the entity of Trump seems to exceed the corresponding number of users for the entity ‘Biden’. In both figures, we notice a peak on day 20/8/2020, potentially because of three specific tweets current President Donald Trump posted (Twitter, 2020f; Boggs, 2020; Higgins, 2020). We also notice the total traffic of Twitter to overcomes the total YouTube traffic.

4.2. The retweet graph
In figure 8 we plot the retweet graph. This graph is developed by the retweet relationships between all users in the collected dataset. We present the retweet relation as a directed edge between two users (nodes). Also, we assign edge weight with the number of retweets that users are performed for a particular destination node. We also perform a filtering metric where we remove the low weighted edges of weight 1 until weight 7. With the filtering procedure, we reduce the noise the volume of not significant relations and also reduce the number of edges that are manageable for visualization. Before filtering, our graph consisted of 1.142.376 nodes and 3.859.640 edges and after filtering non-significant edges we reduce the number of nodes to 114.971 and the number of edges to 211.534. For the entity visualization, we use 2 colors for our entities, in red color represent the entity of Trump, and in blue color the entity of Biden.
We apply sentiment analysis on each day and we measure the number of tweets that a user posts containing a particular entity. We use this counter to provide coloring of the user node by selecting the most popular entity of the user at each particular date. We also develop a bar plot with the volume of users that allows us to compare the daily volume per entity. Users that don’t use any entities in their tweets, remain without particular coloring.
Graph plots 8 were generated with Gephi Furchterman Reingold layout (Bastian et al., 2009) while we export Gephi generated positions and we use them to generate a daily graph with networkX python library (Aric Hagberg, 2005). In tables 3 and 4 we show the highest retweeted used with the highest numbers of in degree and out-degree respectively, with anonymized usernames.
 |
 |
| (a) | (b) |
 |
 |
| (c) | (d) |
 |
 |
| (e) | (f) |
| User | Number of Followings | Number of Followers |
|---|---|---|
| User 1 | 62.9K | 68.5K |
| User 2 | 18.5K | 78.4K |
| User 3 | 43.1K | 61.7K |
| User | Number of Followings | Number of Followers |
|---|---|---|
| User 1 | 5,299 | 8,505 |
| User 2 | 37.1K | 34.7K |
| User 3 | 72.3K | 78.1K |
4.3. Sentiment Analysis
In this section, we present the results from the sentiment analysis in our corpus, as described in 3.2. In figure 9 we present the daily average sentiment for the entity ‘Biden’. The solid line is the average sentiment in YouTube comments and the dotted line is the average sentiment in the corpus of the tweets. Below zero we have the negative sentiment and above zero the positive sentiment for each social media. On 23 August of 2020, we notice a peak on the positive sentiment and could be potentially explained by (Twitter, 2020d, e). In figure 10, we plot the daily overall sentiment for entity Biden, where we notice the same peak of negative sentiment on 23 August, while a second peak on 19/9 until 22/9 could be explained by his tweet regarding the successor of Justice Ginsburg (Twitter, 2020a) or a follow tweet on the current president(Twitter, 2020b).
The corresponding daily plots for overall and average sentiment on the entity of Trump are shown in 12 and 11. The peak on overall positive sentiment on 12-13 September could be explained by (Twitter, 2020g, h, i, j).


Additionally, in figure 14 we plot the positive sentiment time series for the two sets of hashtags for each state. We notice the daily fluctuations for every states per entity (blue is the entity ’Biden’ and red is for ’Trump’. The juxtaposition of the time series in the form resembling an EEG makes it easier to discern localized events from nation-wide twitter traffic. The list of states abbreviations can be found here: (Wikipedia, 2020).

s


4.4. Event consequences
We use sentiment analysis on specific time points of our dataset timeline ,with important events that allow us to identify how the social media users react to those events. Specifically, we select the dates of the TV debates (September 29 and October 22) and the date when the President Trump was diagnosed positive to COVID-19 (October 2). We selected those particular dates since they were the most important events during the pre-elections period. We use the sentiment analysis results to identify the fluctuations of the sentiment and we measure the volume around each entity topic. Our results are presented in figures: [16,15], where it is noticeable that the first debate and Trump COVID-19 announcement events generated high volume of user interest in social media. In the first case of the debates both entities are soared in comparison with previous dates. At the second event, the volume of the entity ‘Trump’ is taking the first place during the user discussions on social media by increasing the volume of tweets for the entity ‘Trump’ and by presenting high dissonance on sentiment values.
5. Linking Twitter and YouTube data
In this section, we explore the differences in discussion and community between the social networks. We perform Louvain community detection on both social graphs, we associate communities in the YouTube comment graph with communities in the Twitter retweet graph, and measure their similarity and differences.
Figure 17 shows the 4-core of the YouTube comment graph.
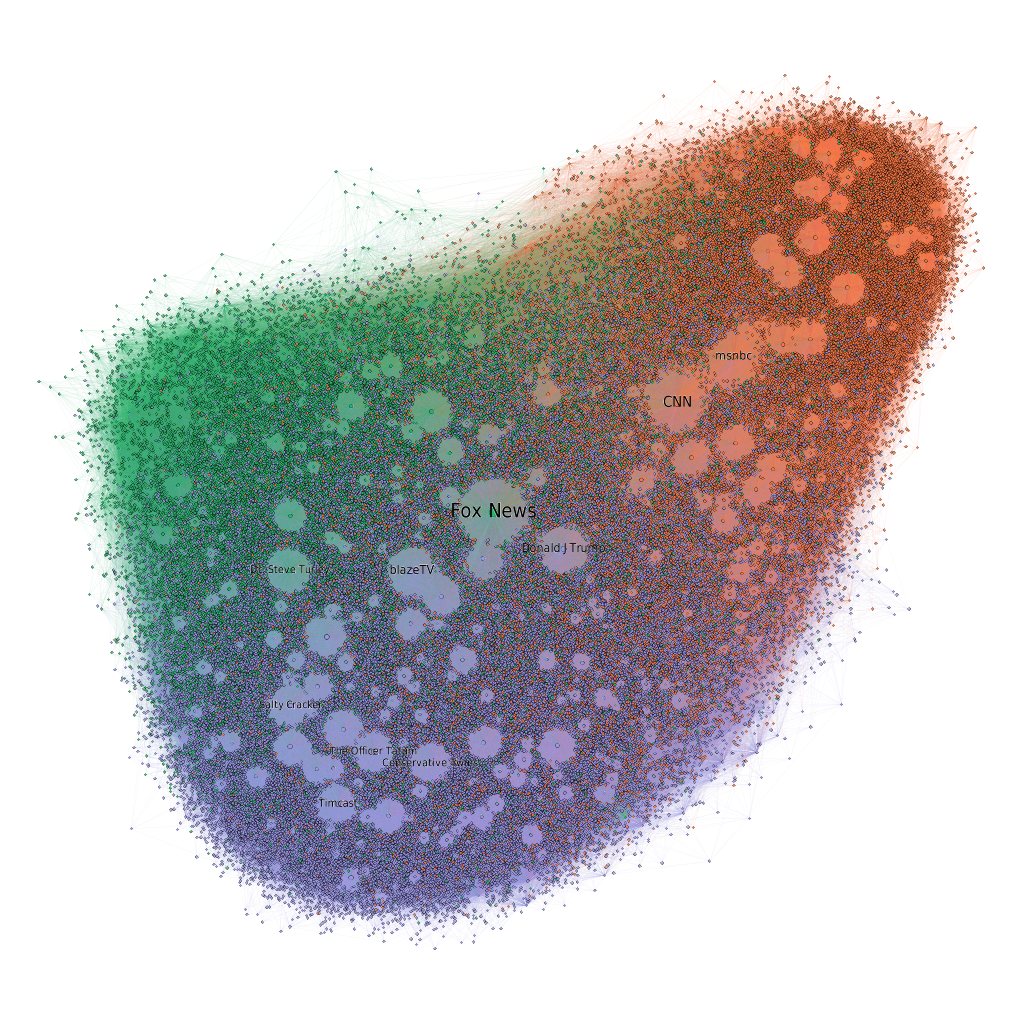

Figure 19 shows the interactions between the 3 largest YouTube communities (top half) in the YouTube-comment graph (YT) and the 6 largest Twitter communities in the Retweet graph (RT). Each community is named after its highest PageRank member (or second highest, when more clear) in the corresponding graph. The size of each relation depicts the number of users in the RT community that tweeted video URLs from any channel in the YT community.

6. Conclusions
This work having obtained the tweets for the most popular hashtags regarding the US elections 2020, as well as the the extracted unique YouTube videos, performs an analysis regarding the volume of tweets and users, the identification of entities and the correlation between the features of the YouTube videos. Next, it demonstrates sentiment analysis on the Twitter corpus and the YouTube metadata and shows that the positive sentiment is higher for Donald Trump in comparison with Joe Biden. We identify how real world events trigger user discussions in social media around that topic. Additionally, this study includes the evolution of the retweet graph along six different time points in the dataset, from July to September 2020 and highlights the two main entities (’Biden’ and ’Trump’).
We are planning to perform sarcasm detection in this dataset, which is an important step in the analysis of political content.
Acknowledgements.
This document is the results of the research project co-funded by the European Commission, project CONCORDIA, with grant number 830927 (EUROPEAN COMMISSION Directorate-General Communications Networks, Content and Technology) and by the European Union and Greek national funds through the Operational Program Competitiveness, Entrepreneurship and Innovation, under the call RESEARCH–CREATE–INNOVATE (project code:T1EDK-02857, and T1EDK-01800).| Hashtag | Tweets count |
|---|---|
| #Trump2020 | 2.930.633 |
| #Vote | 1.785.378 |
| #vote | 1.494.138 |
| #Election2020 | 1.277.839 |
| #Biden | 1.129.063 |
| #VoteBlueToSaveAmerica | 802.793 |
| #trump2020 | 228.289 |
| #VoteTrumpOut | 147.065 |
| #election2020 | 106.412 |
| #trump | 89.767 |
| #biden | 82.802 |
| #2020election | 41.794 |
| #November3rd | 34.299 |
| #NovemberIsComing | 32.680 |
| #donaldtrump | 28.265 |
| #MyPresident | 24.609 |
| #Elections_2020 | 6.249 |
| #2020elections | 3.828 |
| #USElections | 3.580 |
| #bluewave2020 | 3.040 |
| Total | 10.252.523 |
Appendix A List of all Hashtags
In this section, we list all the retrieved hashtags on which we based our dataset along with the tweets count within which there were contained, in table 5.
References
- (1)
- Amarasekara and Grant (2019) Inoka Amarasekara and Will J Grant. 2019. Exploring the YouTube science communication gender gap: A sentiment analysis. Public Understanding of Science 28, 1 (2019), 68–84.
- Antonakaki et al. (2020) Despoina Antonakaki, Paraskevi Fragopoulou, and Sotiris Ioannidis. 2020. A survey of Twitter research: Data model, graph structure, sentiment analysis and attacks. Expert Systems with Applications 164 (2020), 114006.
- Antonakaki et al. (2016) Despoina Antonakaki, Dimitris Spiliotopoulos, Christos V Samaras, Sotiris Ioannidis, and Paraskevi Fragopoulou. 2016. Investigating the complete corpus of referendum and elections tweets. In 2016 IEEE/ACM International Conference on Advances in Social Networks Analysis and Mining (ASONAM). IEEE, IEEE, San Francisco, CA, USA, 100–105.
- Antonakaki et al. (2017) Despoina Antonakaki, Dimitris Spiliotopoulos, Christos V. Samaras, Polyvios Pratikakis, Sotiris Ioannidis, and Paraskevi Fragopoulou. 2017. Social media analysis during political turbulence. PloS one 12, 10 (2017), e0186836.
- Aric Hagberg (2005) Dan Schult Aric Hagberg, Pieter Swart. 2005. Python networkx library for graph creation/visualization. https://networkx.github.io/
- Bajaj et al. (2016) Payal Bajaj, Mridul Kavidayal, Priyanshu Srivastava, Md Nadeem Akhtar, and Ponnurangam Kumaraguru. 2016. Disinformation in multimedia annotation: Misleading metadata detection on YouTube. In Proceedings of the 2016 ACM workshop on Vision and Language Integration Meets Multimedia Fusion. 53–61.
- Bakshi et al. (2016) Rushlene Kaur Bakshi, Navneet Kaur, Ravneet Kaur, and Gurpreet Kaur. 2016. Opinion mining and sentiment analysis. In 2016 3rd International Conference on Computing for Sustainable Global Development (INDIACom). IEEE, IEEE, New Delhi, Andaman and Nicobar Islands, India, 452–455.
- Baluja et al. (2008) Shumeet Baluja, Rohan Seth, Dharshi Sivakumar, Yushi Jing, Jay Yagnik, Shankar Kumar, Deepak Ravichandran, and Mohamed Aly. 2008. Video suggestion and discovery for youtube: taking random walks through the view graph. In Proceedings of the 17th international conference on World Wide Web. 895–904.
- Bastian et al. (2009) Mathieu Bastian, Sebastien Heymann, and Mathieu Jacomy. 2009. Gephi: An Open Source Software for Exploring and Manipulating Networks. http://www.aaai.org/ocs/index.php/ICWSM/09/paper/view/154
- Bird et al. (2009) Steven Bird, Ewan Klein, and Edward Loper. 2009. Natural Language Processing with Python. O’Reilly Media.
- Boggs (2020) Justin Boggs. 2020 (accessed September 29, 2020). President Trump goes on an all caps Twitter tirade during the Democratic Convention. https://www.thedenverchannel.com/news/election-2020/president-trump-goes-on-an-all-caps-twitter-tirade-during-the-democratic-convention
- Bollen et al. (2009) Johan Bollen, Alberto Pepe, and Huina Mao. 2009. Modeling public mood and emotion: Twitter sentiment and socio-economic phenomena. arXiv preprint arXiv:0911.1583 (2009).
- Christensen (2013) Christian Christensen. 2013. WAVE-RIDING AND HASHTAG-JUMPING. Information, Communication & Society 16, 5 (2013), 646–666. https://doi.org/10.1080/1369118X.2013.783609
- Colleoni et al. (2014) Elanor Colleoni, Alessandro Rozza, and Adam Arvidsson. 2014. Echo chamber or public sphere? Predicting political orientation and measuring political homophily in Twitter using big data. Journal of communication 64, 2 (2014), 317–332.
- Conover et al. (2011) Michael D Conover, Jacob Ratkiewicz, Matthew R Francisco, Bruno Gonçalves, Filippo Menczer, and Alessandro Flammini. 2011. Political polarization on twitter. Icwsm 133, 26 (2011), 89–96.
- Daniel et al. (2017) Mariana Daniel, Rui Ferreira Neves, and Nuno Horta. 2017. Company event popularity for financial markets using Twitter and sentiment analysis. Expert Systems with Applications 71 (2017), 111–124.
- Davies and Ghahramani (2011) Alex Davies and Zoubin Ghahramani. 2011. Language-independent Bayesian sentiment mining of Twitter. In The 5th SNA-KDD Workshop’11 (SNA-KDD’11). SNA-KDD, University of California, 56–58.
- Diakopoulos and Shamma (2010) Nicholas A Diakopoulos and David A Shamma. 2010. Characterizing debate performance via aggregated twitter sentiment. In Proceedings of the SIGCHI conference on human factors in computing systems. 1195–1198.
- Dos Santos and Gatti (2014) Cicero Dos Santos and Maira Gatti. 2014. Deep convolutional neural networks for sentiment analysis of short texts. In Proceedings of COLING 2014, the 25th International Conference on Computational Linguistics: Technical Papers. COLING, Dublin, Ireland, 69–78.
- Gayo-Avello (2013) Daniel Gayo-Avello. 2013. A meta-analysis of state-of-the-art electoral prediction from Twitter data. Social Science Computer Review 31, 6 (2013), 649–679.
- Gayo-Avello et al. (2011) Daniel Gayo-Avello, Panagiotis Metaxas, and Eni Mustafaraj. 2011. Limits of electoral predictions using social media data. In Proceedings of the International AAAI Conference on Weblogs and Social Media, Barcelona, Spain.
- Ghiassi and Lee (2018) Manoochehr Ghiassi and S Lee. 2018. A domain transferable lexicon set for Twitter sentiment analysis using a supervised machine learning approach. Expert Systems with Applications 106 (2018), 197–216.
- Giachanou and Crestani (2016) Anastasia Giachanou and Fabio Crestani. 2016. Like it or not: A survey of twitter sentiment analysis methods. ACM Computing Surveys (CSUR) 49, 2 (2016), 1–41.
- Gilbert and Hutto (2014) CHE Gilbert and Erric Hutto. 2014. Vader: A parsimonious rule-based model for sentiment analysis of social media text. In Eighth International Conference on Weblogs and Social Media (ICWSM-14). Available at (20/04/16) http://comp. social. gatech. edu/papers/icwsm14. vader. hutto. pdf, Vol. 81. 82.
- Go et al. (2009) Alec Go, Lei Huang, and Richa Bhayani. 2009. Twitter sentiment analysis. Entropy 17 (2009), 252.
- Guthier et al. (2017) B. Guthier, K. Ho, and A. E. Saddik. 2017. Language-independent data set annotation for machine learning-based sentiment analysis. In 2017 IEEE International Conference on Systems, Man, and Cybernetics (SMC). SMC, Banff, AB, Canada, 2105–2110.
- Higgins (2020) Tucker Higgins. 2020 (accessed September 29, 2020). White House asks Supreme Court to let Trump block critics on Twitter. https://www.cnbc.com/2020/08/20/white-house-asks-supreme-court-to-let-trump-block-critics-on-twitter.html
- Jang et al. (2013) Haeng-Jin Jang, Jaemoon Sim, Yonnim Lee, and Ohbyung Kwon. 2013. Deep sentiment analysis: Mining the causality between personality-value-attitude for analyzing business ads in social media. Expert Systems with applications 40, 18 (2013), 7492–7503.
- Jianqiang and Xiaolin (2017) Zhao Jianqiang and Gui Xiaolin. 2017. Comparison research on text pre-processing methods on twitter sentiment analysis. IEEE Access 5 (2017), 2870–2879.
- Jianqiang et al. (2018) Z. Jianqiang, G. Xiaolin, and Z. Xuejun. 2018. Deep Convolution Neural Networks for Twitter Sentiment Analysis. IEEE Access 6 (2018), 23253–23260.
- Jianqiang et al. (2018) Zhao Jianqiang, Gui Xiaolin, and Zhang Xuejun. 2018. Deep convolution neural networks for twitter sentiment analysis. IEEE Access 6 (2018), 23253–23260.
- Kolchyna et al. (2015) Olga Kolchyna, Tharsis TP Souza, Philip Treleaven, and Tomaso Aste. 2015. Twitter sentiment analysis: Lexicon method, machine learning method and their combination. arXiv preprint arXiv:1507.00955 5656 (2015), 33–38.
- Kouloumpis et al. (2011) Efthymios Kouloumpis, Theresa Wilson, and Johanna D Moore. 2011. Twitter sentiment analysis: The good the bad and the omg! Icwsm 11, 538-541 (2011), 164.
- Krishna (2014) Amar Krishna. 2014. Polarity trend analysis of public sentiment on YouTube. (2014).
- Lindgren (2012) Simon Lindgren. 2012. ‘It took me about half an hour, but I did it!’Media circuits and affinity spaces around how-to videos on YouTube. European Journal of Communication 27, 2 (2012), 152–170.
- Liu et al. (2012) Kun-Lin Liu, Wu-Jun Li, and Minyi Guo. 2012. Emoticon smoothed language models for twitter sentiment analysis.. In Aaai, Vol. 12. Citeseer, Citeseer, Paris, France, 22–26.
- Martínez-Cámara et al. (2014) Eugenio Martínez-Cámara, M Teresa Martín-Valdivia, L Alfonso Urena-López, and A Rturo Montejo-Ráez. 2014. Sentiment analysis in Twitter. Natural Language Engineering 20, 1 (2014), 1–28.
- Mittal and Goel (2012) Anshul Mittal and Arpit Goel. 2012. Stock prediction using twitter sentiment analysis. Standford University, CS229 (2011 http://cs229. stanford. edu/proj2011/GoelMittal-StockMarketPredictionUsingTwitterSentimentAnalysis. pdf) 15 (2012), 2352.
- Morales et al. (2015) Alfredo Jose Morales, Javier Borondo, Juan Carlos Losada, and Rosa M Benito. 2015. Measuring political polarization: Twitter shows the two sides of Venezuela. Chaos: An Interdisciplinary Journal of Nonlinear Science 25, 3 (2015), 033114.
- Mukherjee and Bhattacharyya (2012) Subhabrata Mukherjee and Pushpak Bhattacharyya. 2012. Feature specific sentiment analysis for product reviews. In International Conference on Intelligent Text Processing and Computational Linguistics. Springer, 475–487.
- Narr et al. (2012) Sascha Narr, Michael Hulfenhaus, and Sahin Albayrak. 2012. Language-independent twitter sentiment analysis. Knowledge discovery and machine learning (KDML), LWA 89898 (2012), 12–14.
- O’Callaghan et al. (2012) Derek O’Callaghan, Martin Harrigan, Joe Carthy, and Pádraig Cunningham. 2012. Network analysis of recurring youtube spam campaigns. arXiv preprint arXiv:1201.3783 (2012).
- O’Connor et al. (2010) Brendan O’Connor, Ramnath Balasubramanyan, Bryan R Routledge, and Noah A Smith. 2010. From tweets to polls: Linking text sentiment to public opinion time series. Tepper School of Business 344 (2010), 559.
- Pak and Paroubek (2010) Alexander Pak and Patrick Paroubek. 2010. Twitter as a corpus for sentiment analysis and opinion mining.. In LREc, Vol. 10. LREC, Valletta, Malta, 1320–1326.
- Poria et al. (2016) Soujanya Poria, Erik Cambria, Newton Howard, Guang-Bin Huang, and Amir Hussain. 2016. Fusing audio, visual and textual clues for sentiment analysis from multimodal content. Neurocomputing 174 (2016), 50–59.
- Ptáček et al. (2014) Tomáš Ptáček, Ivan Habernal, and Jun Hong. 2014. Sarcasm detection on czech and english twitter. In Proceedings of COLING 2014, the 25th International Conference on Computational Linguistics: Technical Papers. ACL, Dublin, Ireland, 213–223.
- Ravi and Ravi (2015) Kumar Ravi and Vadlamani Ravi. 2015. A survey on opinion mining and sentiment analysis: tasks, approaches and applications. Knowledge-Based Systems 89 (2015), 14–46.
- Saif et al. (2012) Hassan Saif, Yulan He, and Harith Alani. 2012. Alleviating data sparsity for twitter sentiment analysis. In CEUR Workshop proceedings. CEUR Workshop Proceedings (CEUR-WS. org), CEUR, Lyon, France., 297–312.
- Saroufim et al. (2018) Carl Saroufim, Akram Almatarky, and Mohammad Abdel Hady. 2018. Language independent sentiment analysis with sentiment-specific word embeddings. In Proceedings of the 9th Workshop on Computational Approaches to Subjectivity, Sentiment and Social Media Analysis. ACL, Brussels, Belgium, 14–23.
- Serrano-Guerrero et al. (2015) Jesus Serrano-Guerrero, Jose A Olivas, Francisco P Romero, and Enrique Herrera-Viedma. 2015. Sentiment analysis: A review and comparative analysis of web services. Information Sciences 311 (2015), 18–38.
- Severyn and Moschitti (2015a) Aliaksei Severyn and Alessandro Moschitti. 2015a. Twitter Sentiment Analysis with Deep Convolutional Neural Networks. In Proceedings of the 38th International ACM SIGIR Conference on Research and Development in Information Retrieval (SIGIR ’15). Association for Computing Machinery, New York, NY, USA, 959–962. https://doi.org/10.1145/2766462.2767830
- Severyn and Moschitti (2015b) Aliaksei Severyn and Alessandro Moschitti. 2015b. Twitter sentiment analysis with deep convolutional neural networks. In Proceedings of the 38th International ACM SIGIR Conference on Research and Development in Information Retrieval. ACM, Chile, 959–962.
- Severyn and Moschitti (2015c) Aliaksei Severyn and Alessandro Moschitti. 2015c. Unitn: Training deep convolutional neural network for twitter sentiment classification. In Proceedings of the 9th international workshop on semantic evaluation (SemEval 2015). SIGLEX — SIGSEM, Denver, Colorado, 464–469.
- Severyn et al. (2014) Aliaksei Severyn, Olga Uryupina, Barbara Plank, Alessandro Moschitti, and Katja Filippova. 2014. Opinion mining on YouTube. (2014).
- Smailović et al. (2015) J. Smailović, J. Kranjc, M. Grčar, M. Žnidaršič, and I. Mozetič. 2015. Monitoring the Twitter sentiment during the Bulgarian elections. In 2015 IEEE International Conference on Data Science and Advanced Analytics (DSAA). IEEE, Paris, 1–10.
- Sureka et al. (2010) Ashish Sureka, Ponnurangam Kumaraguru, Atul Goyal, and Sidharth Chhabra. 2010. Mining youtube to discover extremist videos, users and hidden communities. In Asia Information Retrieval Symposium. Springer, 13–24.
- Susarla et al. (2012) Anjana Susarla, Jeong-Ha Oh, and Yong Tan. 2012. Social networks and the diffusion of user-generated content: Evidence from YouTube. Information Systems Research 23, 1 (2012), 23–41.
- Thelwall et al. (2012) Mike Thelwall, Pardeep Sud, and Farida Vis. 2012. Commenting on YouTube videos: From Guatemalan rock to el big bang. Journal of the American Society for Information Science and Technology 63, 3 (2012), 616–629.
- Twitter (2020a) Twitter. 2020 (accessed September 29, 2020)a. Biden tweet on 20/9/2020. https://twitter.com/JoeBiden/status/1307703815630540802
- Twitter (2020b) Twitter. 2020 (accessed September 29, 2020)b. Biden tweet on 20/9/2020. https://twitter.com/JoeBiden/status/1307491919384260609
- Twitter (2020c) Twitter. 2020 (accessed September 29, 2020)c. Biden tweet on 21/8/2020. https://twitter.com/JoeBiden/status/1296599144119914499
- Twitter (2020d) Twitter. 2020 (accessed September 29, 2020)d. Biden tweet on 23/8/2020. https://twitter.com/JoeBiden/status/1297595030002180099
- Twitter (2020e) Twitter. 2020 (accessed September 29, 2020)e. Biden tweet on 23/8/2020. https://twitter.com/JoeBiden/status/1297206657576046595
- Twitter (2020f) Twitter. 2020 (accessed September 29, 2020)f. Donald Trump tweet on 20/8/2020. https://twitter.com/realDonaldTrump/status/1296274065762717696
- Twitter (2020g) Twitter. 2020 (accessed September 29, 2020)g. Trump tweet on 10/9/2020. https://twitter.com/realDonaldTrump/status/1304611528201703424
- Twitter (2020h) Twitter. 2020 (accessed September 29, 2020)h. Trump tweet on 12/9/2020. https://twitter.com/realDonaldTrump/status/1304920644165881856
- Twitter (2020i) Twitter. 2020 (accessed September 29, 2020)i. Trump tweet on 13/9/2020. https://twitter.com/realDonaldTrump/status/1304577591597301760
- Twitter (2020j) Twitter. 2020 (accessed September 29, 2020)j. Trump tweet on 13/9/2020. https://twitter.com/realDonaldTrump/status/1304613988337057794
- Wang et al. (2012) Hao Wang, Doğan Can, Abe Kazemzadeh, François Bar, and Shrikanth Narayanan. 2012. A system for real-time twitter sentiment analysis of 2012 US presidential election cycle. In Proceedings of the ACL 2012 system demonstrations. ACL, Jeju Island, Korea, 115–120.
- Wang and Castanon (2015) Hao Wang and Jorge A Castanon. 2015. Sentiment expression via emoticons on social media. In 2015 ieee international conference on big data (big data). IEEE, IEEE, Santa Clara, CA, USA, 2404–2408.
- Wang et al. (2011) Xiaolong Wang, Furu Wei, Xiaohua Liu, Ming Zhou, and Ming Zhang. 2011. Topic sentiment analysis in twitter: a graph-based hashtag sentiment classification approach. In Proceedings of the 20th ACM international conference on Information and knowledge management. 1031–1040.
- Weber et al. (2013) Ingmar Weber, Venkata R Kiran Garimella, and Alaa Batayneh. 2013. Secular vs. islamist polarization in egypt on twitter. In Proceedings of the 2013 IEEE/ACM international conference on advances in social networks analysis and mining. IEEE, Niagara Ontario Canada, 290–297.
- Wehrmann et al. (2017) Joonatas Wehrmann, Willian Becker, Henry EL Cagnini, and Rodrigo C Barros. 2017. A character-based convolutional neural network for language-agnostic Twitter sentiment analysis. In 2017 International Joint Conference on Neural Networks (IJCNN). IEEE, IEEE, Anchorage, Alaska, 2384–2391.
- Wehrmann et al. (2017) J. Wehrmann, W. Becker, H. E. L. Cagnini, and R. C. Barros. 2017. A character-based convolutional neural network for language-agnostic Twitter sentiment analysis. In 2017 International Joint Conference on Neural Networks (IJCNN). IJCNN, Anchorage, Alaska, 2384–2391.
- Yamamoto et al. (2014) Yuki Yamamoto, Tadahiko Kumamoto, and Akiyo Nadamoto. 2014. Role of Emoticons for Multidimensional Sentiment Analysis of Twitter. In Proceedings of the 16th International Conference on Information Integration and Web-Based Applications and Services (iiWAS ’14). Association for Computing Machinery, New York, NY, USA, 107–115.
- You et al. (2015) Quanzeng You, Jiebo Luo, Hailin Jin, and Jianchao Yang. 2015. Robust image sentiment analysis using progressively trained and domain transferred deep networks. arXiv preprint arXiv:1509.06041 3 (2015), 270–279.
- Zhang et al. (2011) Lei Zhang, Riddhiman Ghosh, Mohamed Dekhil, Meichun Hsu, and Bing Liu. 2011. Combining lexicon-based and learning-based methods for Twitter sentiment analysis. HP Laboratories, Technical Report HPL-2011 89 (2011), 32.
- Zhang et al. (2017) Shiwei Zhang, Xiuzhen Zhang, and Jeffrey Chan. 2017. A Word-Character Convolutional Neural Network for Language-Agnostic Twitter Sentiment Analysis. In Proceedings of the 22nd Australasian Document Computing Symposium (ADCS 2017). Association for Computing Machinery, New York, NY, USA, Article 12, 4 pages. https://doi.org/10.1145/3166072.3166082
- Zhao et al. (2012) Jichang Zhao, Li Dong, Junjie Wu, and Ke Xu. 2012. MoodLens: An Emoticon-Based Sentiment Analysis System for Chinese Tweets. In Proceedings of the 18th ACM SIGKDD International Conference on Knowledge Discovery and Data Mining (KDD ’12). Association for Computing Machinery, New York, NY, USA, 1528–1531.
- Wikipedia (2020) Wikipedia. 2020 (accessed September 29, 2020). List of U.S. state and territory abbreviations. https://en.wikipedia.org/wiki/List_of_U.S._state_and_territory_abbreviations