Agreement-on-the-Line: Predicting the Performance of Neural Networks under Distribution Shift
Abstract
Recently, Miller et al. [59] showed that a model’s in-distribution (ID) accuracy has a strong linear correlation with its out-of-distribution (OOD) accuracy on several OOD benchmarks — a phenomenon they dubbed “accuracy-on-the-line”. While a useful tool for model selection (i.e., the models with better ID accuracy are likely to have better OOD accuracy), this fact does not help estimate the actual OOD performance of models without access to a labeled OOD validation set. In this paper, we show a similar but surprising phenomenon also holds for the agreement between pairs of neural network classifiers: whenever accuracy-on-the-line holds, we observe that the OOD agreement between the predictions of any two pairs of neural networks (with potentially different architectures) also observes a strong linear correlation with their ID agreement. Furthermore, we observe that the slope and bias of OOD vs. ID agreement closely matches that of OOD vs. ID accuracy. This phenomenon, which we call agreement-on-the-line, has important practical applications: without any labeled data, we can predict the OOD accuracy of classifiers, since OOD agreement can be estimated with just unlabeled data. Our prediction algorithm outperforms previous methods both in shifts where agreement-on-the-line holds and, surprisingly, when accuracy is not on the line. This phenomenon also provides new insights into deep neural networks: unlike accuracy-on-the-line, agreement-on-the-line appears to only hold for neural network classifiers.
1 Introduction
Machine learning operates well when models observe and make decisions on data coming from the same distribution as the training data. Yet in the real world, this assumption rarely holds. Environments are never fully controlled. Robots interact with their surroundings, effectively changing what they see in the future. Self-driving cars face constant distribution shift when driving to new cities under changing weather conditions. Models trained on clinical data from one hospital face challenges when deployed for a different hospital with different subpopulations. Under these premises, practitioners constantly face the problem of estimating a model’s performance on new data distributions (out-of-distribution, or OOD) that are related to but different from the data distribution that the model was trained on (in-distribution, or ID). Depending on the distribution shift, models may sometimes break catastrophically under new conditions, or may only suffer a small degradation in performance. Differentiating between such cases is crucial in practice.
Assessing OOD performance is difficult because in reality, labeled OOD data is often very costly to obtain. On the other hand, unlabeled OOD data is much easier to obtain. A natural question is whether we can leverage unlabeled OOD data for estimating the OOD performance. This paradigm of using unlabeled data to predict the OOD generalization performance has received much attention recently [29, 9, 87, 22, 23, 10, 31]. Although many different metrics have been proposed, their success varies widely depending on the shift and the ID performance of the model. While it is impossible for a method to always work with no assumptions [29], a major obstacle to using these methods is that there is currently no understanding of when they work or a recipe to detect when their predictions might be unreliable.
In a separate but related line of work, Miller et al. [59] demonstrated that in a wide variety of common OOD prediction benchmarks such as CIFAR-10.1 [67], ImageNetV2 [67], CIFAR-10C [34], fMoW-wilds [13], there exists an almost perfect positive linear correlation between the ID test vs. OOD accuracy of models. When this phenomenon, called accuracy-on-the-line, occurs, improving performance on the ID test data directly leads to improvements on OOD performance. Furthermore, if we have access to the slope and bias of this correlation, predicting OOD accuracy becomes straightforward. Unfortunately, accuracy-on-the-line is not a universal phenomenon. In some datasets, such as Camelyon17-wilds [1], models with the same ID test performance have OOD performance that varied largely. Thus, while the accuracy-on-the-line phenomenon is interesting, its practical use is somewhat limited since determining whether accuracy-on-the-line holds requires labeled OOD data in the first place.

In this work, we begin by observing an analogous phenomenon based upon agreement rather than accuracy. Specifically, if we consider pairs of neural network of classifiers, and look at the agreement of their predictions (the proportion of cases where they make the same prediction, which requires no labeled data to compute), we find that there also often exists a strong linear correlation between ID vs. OOD agreement. We call this phenomenon agreement-on-the-line. Importantly, however, this phenomenon appears to be tightly coupled with accuracy-on-the-line: when agreement-on-the-line holds, accuracy-on-the-line also holds; and when agreement-on-the-line does not hold, neither does accuracy-on-the-line. Furthermore, when these properties hold, the linear correlations of both accuracy-on-the-line and agreement-on-the-line appear to have roughly the same slope and bias. Interestingly, unlike accuracy-on-the-line, which appears to be a general phenomenon, agreement-on-the-line, especially the fact that the slope and bias of the linear correlation agree across accuracy and agreement, appears to occur only for neural networks. Indeed, the phenomenon is quite unintuitive, given that there is no a-priori reason to believe that agreement and accuracy would be connected in such a manner; nonetheless, we find this phenomenon occurs repeatedly across multiple datasets and vastly different neural network architectures.
This phenomenon is of immediate practical interest. Since agreement-on-the-line can be validated without any labeled OOD data, we can use it as a proxy to assess whether accuracy-on-the-line holds, and thus whether ID accuracy is a reasonable OOD model selection criteria. Furthermore, since the slope and bias of the agreement-on-the-line fit can also be estimated without labeled OOD data, (for the cases where agreement-on-the-line holds) we can use this approach to derive a simple algorithm for estimating the OOD generalization of classifiers, without any access to labeled OOD data. The approach outperforms competing methods and predicts OOD test error with a mean absolute estimation error of on datasets where agreement-on-the-line holds. On datasets where agreement-on-the-line does not hold, the method as expected does not perform as well, but surprisingly still outperforms competing methods in terms of predicting OOD performance.
To summarize, our contributions are as follows:
-
1.
We discover and empirically analyze the agreement-on-the-line phenomenon: that ID vs. OOD agreement for pairs of neural network classifiers lies on a line precisely when the corresponding ID vs. OOD accuracy also lies on a line. Furthermore, the slope and bias of these two lines are approximately equal.
-
2.
Leveraging this phenomenon, we develop a simple method for estimating the OOD performance of classifiers without any access to labeled OOD data (and by observing whether agreement-on-the-line holds, the method also provides a “sanity check” that these estimates are reasonable). The proposed method outperforms all competing baselines for this task.
2 Related Works
Accuracy-on-the-line
Before Miller et al. [59], several other works proposing new benchmarks for performance evaluation [58, 67, 69, 85] have also observed a strong linear correlation between ID and OOD performance of models. Theoretical analysis of this phenomenon is limited. Miller et al. [59] constructs distribution shifts where accuracy-on-the-line can be observed assuming the data is Gaussian, however they do not incorporate any assumptions about the classifier. Another work by Mania and Sra [55] analyzes the phenomenon under the assumption that given two models, it is unlikely that the lower accuracy model classifies a data point correctly while the higher accuracy model classifies it incorrectly. Such model similarity has been observed by [56, 30]. Recent works have also observed some nonlinear correlations [47] and negative correlations in performance [79, 41]. In this work, we focus on the results from Miller et al. [59] and leave these nuances for future study.
Estimating ID generalization via agreement.
Departing from conventional approaches based on uniform convergence [63, 26, 3, 60], several recent works [62, 89, 28, 39] propose different approaches for estimating generalization error. In particular, this work is closely related to Jiang et al. [39], which shows that the disagreement between two models trained with different random seeds closely tracks the ID generalization error of the models, if the ensemble of the models are well-calibrated. Predicting ID generalization via disagreement has also previously been proposed by Madani et al. [54] and Nakkiran and Bansal [61]. Our method also uses disagreement for estimating performance but, unlike these works, we focus on OOD generalization, and, more importantly, we do not require calibration or models with the same architecture.
OOD generalization.
The problem of characterizing generalization in the OOD setting is even more challenging than the ID setting. Ben-David et al. [5] provides one of the first uniform-convergence-based bounds for domain adaptation, a related but harder framework of improving the OOD performance of models given unlabeled OOD data and labeled ID data. Several works [57, 18, 46] build on this approach and extend it to other learning scenarios. Most of these works attempt to bound the difference between ID and OOD performance via a certain notion of closeness between the original distribution and shifted distribution (e.g., the total variation distance and the divergence which is related to agreement), and build on the uniform-convergence framework [68]. As pointed out by Miller et al. [59], these approaches provide upper bounds on the OOD performance that grows looser as the distribution shift becomes larger, and the bounds do not capture the precise trends observed in practice. Predicting the actual OOD performance using unlabeled data has gained interest in the past decade. These methods can roughly be divided into three categories:
1. Placing assumptions on the distribution shift.
Donmez et al. [24] assume knowledge of the marginal of the shifted label distribution and show that OOD accuracy can be predicted if the shifted distribution satisfies several properties. Steinhardt and Liang [74] work under the assumption that the data can be separated into “views” that are conditionally independent given label . Chen et al. [10] assume prior knowledge about the shift and use an importance weighting procedure.
2. Placing assumptions on the classifiers.
Given multiple classifiers of interest, Platanios et al. [64, 65] form logical constraints based on assumptions about the hypothesis distribution to identify individual classifier’s error. On the other hand, Jaffe et al. [38] relates accuracy to the classifiers’ covariance matrix under the assumption that classifiers make independent errors and do better than random.
3. Empirically measuring the distribution shift.
A group of works [27, 71, 22, 23] train a regression model over metrics that measure the severity of the distribution shift. Inspired by the observation that the maximum softmax probability (or confidence) for OOD points is typically lower [35, 34], Guillory et al. [31] and more recently Garg et al. [29] utilize model confidence to predict accuracy. Chuang et al. [14] uses agreement with a set of domain-invariant predictors as a proxy for the unknown, true target labels. This method was extended upon by Chen et al. [9] which improves the predictors by self-training. Yu et al. [87] observed that the distance between the model of interest and a reference model trained on the pseudolabels of showed strong linear correlation with OOD accuracy.
Though a large number of methods have been proposed, for the large majority, it is not well-understood when they will work. Intuitively, no method will work on all shifts without additional assumptions [29]. But is there some simple general structure to shifts in the real world that allows us to reliably predict OOD accuracy? Even if such a structure is not universal, can we easily inspect if this structure holds? What is a plausible assumption we can make about the OOD behaviour of classifiers? The novelty and significance of our work comes from trying to better understand and address these questions, specifically for neural networks. In this work, we observe a phenomenon related to, but stronger than accuracy-on-the-line that allows us to reliably predict the OOD accuracy of neural networks.
| Dataset | Accuracy | Agreement | Confidence Interval | ||||
| Slope | Bias | Slope | Bias | ||||
| CIFAR-10.1v6 | 0.842 | -0.216 | 0.999 | 0.857 | -0.205 | 0.997 | (-0.046, 0.017) |
| CIFAR-10.2 | 0.768 | -0.287 | 0.999 | 0.839 | -0.226 | 0.996 | (-0.120, -0.030) |
| ImageNetv2 | 0.946 | -0.309 | 0.997 | 0.972 | -0.274 | 0.993 | (-0.0720, 0.061) |
| CIFAR-10C-Fog | 0.834 | -0.228 | 0.995 | 0.870 | -0.239 | 0.996 | (-0.077, 0.053) |
| CIFAR-10C-Snow | 0.762 | -0.289 | 0.974 | 0.766 | -0.266 | 0.974 | (-0.067, 0.047) |
| fMoW-wilds | 0.952 | -0.163 | 0.998 | 0.954 | -0.121 | 0.995 | (-0.042, 0.030) |
| Camelyon17-wilds | 0.373 | 0.046 | 0.263 | 0.381 | 0.075 | 0.226 | - |
| iWildCam-wilds | 0.700 | -0.037 | 0.738 | 0.411 | -0.094 | 0.424 | - |
3 The agreement-on-the-line phenomenon
3.1 Notation and setup
Let denote a set of neural networks trained on sampled from .
Given any pair of models , for a distribution , the expected accuracy and agreement are defined as:
| (1) |
We assume access to a labeled validation set sampled from that allows us to estimate the ID accuracy as the sample average of over the validation set. We do not assume access to a labeled OOD validation set, as this is often impractical to obtain, and thereby cannot directly estimate in a similar manner.
Agreement, on the other hand, only requires access to unlabeled data. We assume access to unlabeled samples from the shifted distribution of interest . Hence, we can estimate both the ID and OOD agreement as follows:
| (2) |
3.2 Experimental setup
We study the ID vs. OOD accuracy and agreement between pairs of models across more than 20 common OOD benchmarks and hundreds of independently trained neural networks.
Datasets.
We present results on 8 dataset shifts in the main paper, and include results for other distribution shifts in the Appendix C. These 8 datasets span:
- 1.
-
2.
Synthetic corruptions: CIFAR-10C Fog and CIFAR-10C Snow [34]
- 3.
Appendix C includes results on CINIC-10 [19], STL-10 [16], and other wilds and CIFAR-10C benchmarks. We also investigate an analogous phenomenon for the F1-score used to assess the reading comprehension performance of language models on the Amazon-SQuAD benchmark [58].
Models.
For ImageNetV2, we evaluate 50 ImageNet pretrained models from the timm [82] package. On the remaining 7 shifts, we evaluate on all independently trained models in the testbed created and utilized by [59] consisting of models for each shift. The evaluated models span a variety of convolutional neural networks (e.g. ResNet [33], DenseNet [36], EfficientNet [78], VGG [49]) as well as various Vision Transformers [25]. All architectures and models are listed in the Appendix D.
Probit scaling.
Miller et al. [59] report their results after probit scaling 111The probit transform is the inverse of the cumulative density function of the standard Gaussian distribution. the ID vs. OOD accuracies due to a better linear fit. We apply the same probit transform to both accuracy and agreement in our experiments.
3.3 Observations
We empirically observe a peculiar phenomenon in deep neural networks, which we call agreement-on-the-line characterized by the following three properties:
- Prop(i)
-
When ID vs. OOD accuracy observes a strong linear correlation ( values), we see that ID vs. OOD agreement is also strongly linearly correlated.
- Prop(ii)
-
When both accuracy and agreement observe strong linear correlation, we see that these linear correlations have almost the same slope and bias.
- Prop(iii)
-
When the linear correlation of ID vs. OOD accuracy is weak ( values), the linear correlation between ID and OOD agreement is similarly weak. 222The thresholds were only chosen to discretize the strength of the linear correlations as strong or weak for the 8 shifts. As shown in Appendix C, the phenomenon actually follows a gradient i.e. when the value is higher, the slope/bias of ID vs. OOD accuracy and ID vs. OOD agreement become closer to each other.
We show the agreement-on-the-line phenomenon on 8 datasets in Figure 1 and Table 1. On CIFAR-10.1, CIFAR-10.2, ImageNetV2, CIFAR-10C Fog/Snow, and fMoW-wilds, we find that both ID vs. OOD accuracy and agreement observe strong linear correlations, and the linear fits have the same slope and bias (Prop(i), Prop(ii)). On the other hand, on the datasets Camelyon17-wilds and iWildCam-wilds where accuracy is not linearly correlated, agreement is also not linearly correlated (Prop(iii)).
To ensure that the differences in the slopes is not statistically significant, we construct the following hypothesis test. For each dataset, we randomly sample 1000 subsets of 10 models from the model testbed and compute the corresponding difference in the slope of the linear fits: . In Table 1, we look at the 95 confidence interval of the distribution of these slope differences for the 6 datasets where we observe a strong correlation. For all datasets with the exception of CIFAR10.2, the null hypothesis (i.e. difference in slope is 0) lies within the 95 confidence interval thus cannot be rejected.
3.4 What makes agreement-on-the-line interesting?
First, agreement can be estimated with just unlabeled data. Hence, the agreement-on-the-line phenomenon has important practical implications for both checking whether the distribution shift observes accuracy-on-the-line and predicting the actual value of OOD accuracy without any OOD labels. We present a method to estimate OOD error using this phenomenon in Section 4.
Second, agreement-on-the-line does not directly follow from accuracy-on-the-line. Prior work has observed that expected ID accuracy often equals ID agreement over pairs of models with the same architecture, trained on the same dataset but with different random seeds [39]. Agreement-on-the-line goes beyond these results in two ways: (i) agreement between models with different architectures (Fig. 2) and (ii) agreement between different checkpoints on the same training run (Fig. 4) is also on the ID vs. OOD agreement line. These ID/OOD agreements do not equal the expected ID/OOD accuracy. Indeed, understanding why agreement-on-the-line holds requires going beyond the theoretical conditions presented in the prior work [39] which do not hold for this expanded set of models. Furthermore, the phenomenon of matching slopes is not due to the models performing well ID and OOD. Trivially, the agreement between a model and a perfect classifier is the accuracy of the model. However, in our experiments, even pairs of bad models display this phenomenon. See Appendix F for further discussion.
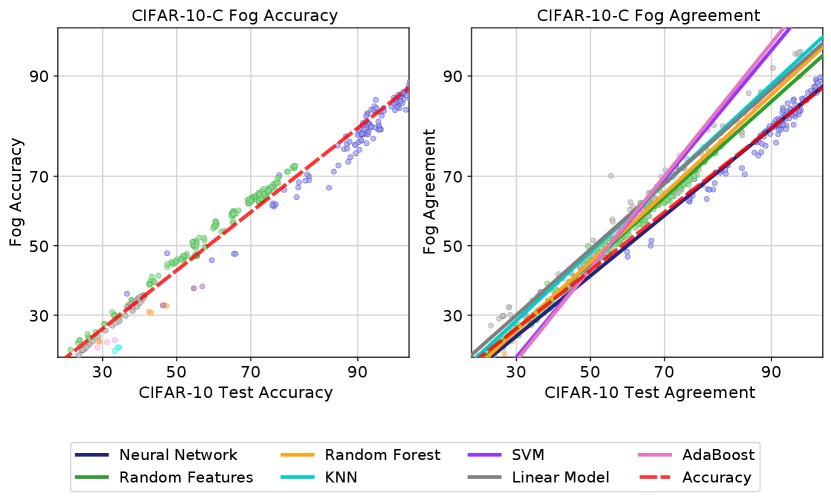
Finally, we emphasize that there is something special about neural networks that makes the ID vs. OOD agreement trend identical to the ID vs. OOD accuracy trend. This is unlike accuracy-on-the-line that holds across a wide range of models including neural networks and classical approaches. Figure 2 shows CIFAR-10 Test vs. CIFAR-10C Fog accuracy and agreement of linear models (e.g. logistic and ridge regression) and various non-linear models (e.g. Kernel SVM [17], k-Nearest Neighbors, Random Forests [6], Random Features [15], AdaBoost [90]). See plots for other datasets in Appendix C. We look at agreement between pairs of models from the same model family. While Prop(i) seems to hold for several other model families on several shifts, Prop(ii) only holds for neural networks, i.e. the slope and bias of the agreement line do not match the slope and bias of the accuracy line for other model families.
4 A method for estimating OOD accuracy
In this section, we describe how the phenomenon of agreement-on-the-line (described in Section 3) offers a simple practical method to perform model selection and estimate accuracy under distribution shifts. Recall from Section 3.1 that we have labeled ID validation data and unlabeled OOD data .
Model selection.
Without OOD labeled data, can we determine which model is likely to achieve the best OOD performance? When accuracy-on-the-line holds and ID vs. OOD accuracy is linearly correlated, we can simply pick the model with highest ID accuracy. In practice, how does one determine if accuracy-on-the-line holds without labeled OOD data? By Prop(i) and Prop(iii), agreement-on-the-line implies accuracy-on-the-line. Hence, we simply need to check if ID and OOD agreement (which can be estimated as in (2)) are linearly correlated, in order to know if our model selection criterion based on ID accuracy is valid.
OOD error prediction.
Agreement-on-the-line allows us to go beyond model selection and actually predict OOD accuracy. Intuitively, we can estimate the slope and bias of the agreement line with just unlabeled data. By Prop(ii), they match the slope and bias of the accuracy line and hence, we can estimate the OOD accuracy by linearly transforming the ID accuracy (with the appropriate probit scaling). We formalize this intuition below and provide an algorithm for OOD accuracy estimation in Algorithm 1. Implementation of our method is available at https://github.com/kebaek/agreement-on-the-line.
Recall (Section 3.1) that given distinct models of interest , we can estimate , and as sample averages over ID labeled validation data and OOD unlabeled data for all . We now describe an estimator for the OOD accuracy of a model .
From agreement-on-the-line, we know that when ID vs. OOD agreement lies on a line for all , ID vs. OOD accuracy for all would approximately also lie on the same line:
| (3) |
We estimate the slope and bias of the linear fit by performing linear regression after applying a probit transform on the agreements as follows.
| (4) |
For each model , given its ID validation accuracy, one could simply plug the estimated slope and bias from (4), and (sample average over validation set) into (3) to get an estimate of the model’s OOD accuracy. We call this simple algorithm ALine-S.
Notice that ALine-S does not directly use the OOD agreement estimates concerning the model of interest—we only use agreements indirectly via the estimates and . We find that a better estimator can be obtained by directly using the model’s OOD agreement estimates via simple algebra as follows.
First, note that for any pair of models , it directly follows from (3) that
| (5) |
By substituting into (5), we can get that average OOD accuracy of any pair of models is
| (6) |
We can plug in estimates of the terms on the right hand side ( from linear regression (4)) and the rest from sample averages. In this way, we can construct a system of linear equations of the form (LABEL:eq:prediction) involving “unknown” estimates of the probit transformed OOD accuracy of models and other “known” quantities. We solve the system via linear regression to obtain the unknown estimates. We call this procedure ALine-D, and it is described more explicitly in Algorithm 1. Note that there must be at least 3 models in the set of interest for the system of linear equations in (LABEL:eq:prediction) to have a unique solution.
5 Experiments
Datasets and models.
We evaluate our methods, the simple plug in of slope/bias estimate ALine-S and the more involved ALine-D, on the same models and datasets from Section 3 and two additional datasets CIFAR-10C-Saturate and RxRx1-wilds (See Appendix C and D for details on these datasets). Specifically, we look at CIFAR-10.1, CIFAR-10.2, ImageNetV2, CIFAR-10C, fMoW-wilds, and RxRx1-wilds, where we observe a strong correlation. We also look at the performance of models on datasets where we do not see a strong linear correlation, specifically Camelyon-wilds and iWildCam-wilds.
Baseline methods.
We choose 4 existing unlabeled estimation methods for comparison: Average Threshold Confidence (ATC) by Garg et al. [29], DOC-Feat in Guillory et al. [31], Average Confidence (AC) in [35], and naive Agreement [54, 61, 39]. All of these methods, like ALine, are based on the softmax outputs of the model. See Appendix A for more details about previous methods.
We implement the version of ATC that performed best in the paper, i.e. with negative entropy as the score function and temperature scaling to calibrate the models in-distribution. Although DOC was deemed the best method in Guillory et al. [31], we use DOC-Feat since DOC requires information from multiple OOD datasets. For ATC, DOC, and AC, consistent with the experimental design in Garg et al. [28], we report the best number achieved between before versus after temperature scaling. We also compare with the more recent, ProjNorm by Yu et al. [87] which showed stronger linear correlation with OOD accuracy than Rotation [23] and ATC [29]. We compare with this method separately in Section 5.1, as they do not provide a way to directly estimate the OOD accuracy.
| Dataset | ALine-D∗ | ALine-S∗ | ATC | AC | DOC | Agreement |
| CIFAR-10.1 | 1.11 | 1.17 | 1.21 | 4.51 | 3.87 | 5.98 |
| CIFAR-10.2 | 3.93 | 3.93 | 4.35 | 8.23 | 7.64 | 5.42 |
| ImageNetV2 | 2.06 | 2.08 | 1.14 | 66.2 | 11.50 | 6.70 |
| CIFAR-10C-Fog | 1.45 | 1.75 | 1.78 | 4.47 | 3.93 | 3.47 |
| CIFAR-10C-Snow | 1.32 | 1.97 | 1.31 | 5.94 | 5.49 | 2.57 |
| CIFAR-10C-Saturate | 0.41 | 0.77 | 0.69 | 2.03 | 1.51 | 4.14 |
| fMoW-wilds | 1.30 | 1.44 | 1.53 | 2.89 | 2.60 | 8.99 |
| RxRx1-wilds | 0.27 | 0.52 | 2.97 | 2.46 | 0.75 | 8.69 |
| Camelyon17-wilds | 5.47 | 8.31 | 11.93 | 13.30 | 13.57 | 6.79 |
| iWildCam-wilds | 4.95 | 6.01 | 12.12 | 4.46 | 5.02 | 7.35 |
5.1 Main results: comparison to other methods.
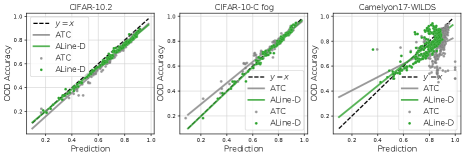
In Table 2, we observe that ALine-D generally outperforms other methods on datasets where agreement-on-the-line holds. On ImageNet to ImageNetV2 and CIFAR-10 to CIFAR-10C-Snow, ATC performs marginally better. As can be seen in Figure 3, ATC generally cannot accurately predict the model’s OOD performance for models that do not perform very well. This is consistent with experimental results in [29] and [87]. On the other hand, ALine performs equally well on “bad” models and “good” models. In some sense, given a collection of models where we are interested in the performance of each, ATC, AC, DOC-Feat, and Agreement only utilize information from the model of interest, whereas ALine utilizes the collective information from all models for each individual prediction.
As expected, on datasets where we do not observe a linear correlation between ID and OOD agreement (and accuracy), ALine does not perform very well, with a mean absolute estimation error of around . Interestingly, the other methods also do not perform very well on these datasets. No method successfully predicts the OOD accuracy for every distribution shift. The advantage of ALine is that there is a concrete way to verify when the method will successfully predict the OOD accuracy (i.e. check whether agreement is on the line). Other prediction methods do not have any way of characterizing when they will be successful. Finally, we note that ALine-D actually surpasses previous methods even when accuracy-on-the-line does not hold, suggesting that the algorithm has additional beneficial properties that require further study.
5.2 Correlation analysis
| Dataset | ALine-D | ProjNorm | ||
| CIFAR-10C | 0.995 | 0.974 | 0.98 | 0.973 |
Rather than predicting OOD accuracy, it could be useful to have a metric that just strongly correlates with the OOD accuracy, if the application simply requires an understanding of relative performance such as model selection. Recently, Yu et al. [87] proposed ProjNorm, a measurement they show has a very strong linear correlation with OOD accuracy, moreso than other recent methods including Rotation [23] and ATC [29]. To compare Aline-D with ProjNorm, we replicate the CIFAR-10C study in Yu et al. [87], where they train a ResNet18 model and predict its performance across all corruptions and severity levels of CIFAR-10C (See their Table 1 in [87]). Since ALine-D is an algorithm that requires a set of models for prediction, we use the 29 pretrained models from the CIFAR-10 testbed of Miller et al. [59], as the other models in the set. We look at the linear correlation of the estimates of OOD accuracy and the true accuracy across all corruptions and find that ALine-D achieves stronger correlation than ProjNorm (Table 3). See Appendix E for more experimental details.
5.3 Estimating performance along a training trajectory
We assess whether ALine can be utilized even in situations where the practioner only cares about the performance of a few models. In such situations, one could efficiently gather many models by training a single model and saving checkpoints along the way. We analyze whether our phenomenon is helpful for predicting such highly correlated hypotheses, instead of independently trained models. In Figure 4, we collect the ID and OOD test predictions every 5 epochs across CIFAR-10 training of a single ResNet18 model and every epoch across ImageNet training of a ResNet50 model. We see that even the agreement between every pair of checkpoints of a model across training is enough to get a good linear fit that matches the slope and bias of ID vs. OOD accuracy. By applying ALine-D to these checkpoints, we get a very good estimate of the OOD performance of the model across training epochs though slightly worse than for a collection of independently trained models. This suggests that given a model of interest, ALine does not require practitioners to train a large number of models, but just train one and save its predictions across training iterations. We do a more careful ablation study in Appendix G, looking at the number of models required for close estimates of accuracy.


6 Conclusion
The contributions of this work are two-fold. First, we observe the agreement-on-the-line phenomenon, and show that it correlates strongly with accuracy-on-the-line over a range of datasets and models. We also highlight that certain aspects of this phenomenon, namely the fact that the slope and bias of the linear fit is largely the same across agreement and accuracy, are specific to neural networks, and thus fundamentally seem connected to these classes of models. Second, using this empirical phenomenon, we propose a surprisingly simple but effective method for predicting OOD accuracy of classifiers, while only having access to unlabeled data from the new domain (and one that can be “sanity checked” via testing whether agreement-on-the line holds). Our method outperforms existing state-of-the-art approaches to this problem. Importantly, we do not claim that this phenomenon is universal, but we found it to be true across an extensive range of neural networks and OOD benchmarks that we experimented on. In addition to its practical relevance, this observation itself reveals something very interesting about the way neural networks learn, which we leave for future study.
Acknowledgments and Disclosure of Funding
We thank Rohan Taori and Saurabh Garg for valuable discussions regarding the model testbeds and temperature scaling used in this work, respectively. Christina Baek was supported by a Presidential Fellowship sponsored by Carnegie Mellon University. Yiding Jiang was supported by funding from the Bosch Center for Artificial Intelligence. Aditi Raghunathan was supported by an Open Philanthropy AI Fellowship.
References
- Bandi et al. [2018] Peter Bandi, Oscar Geessink, Quirine Manson, Marcory Van Dijk, Maschenka Balkenhol, Meyke Hermsen, Babak Ehteshami Bejnordi, Byungjae Lee, Kyunghyun Paeng, Aoxiao Zhong, et al. From detection of individual metastases to classification of lymph node status at the patient level: the camelyon17 challenge. IEEE transactions on medical imaging, 38(2):550–560, 2018.
- Bao et al. [2021] Hangbo Bao, Li Dong, Songhao Piao, and Furu Wei. Beit: Bert pre-training of image transformers. arXiv preprint arXiv:2106.08254, 2021.
- Bartlett et al. [2017] Peter L Bartlett, Dylan J Foster, and Matus J Telgarsky. Spectrally-normalized margin bounds for neural networks. Advances in neural information processing systems, 30, 2017.
- Beery et al. [2020] Sara Beery, Elijah Cole, and Arvi Gjoka. The iwildcam 2020 competition dataset. arXiv preprint arXiv:2004.10340, 2020.
- Ben-David et al. [2006] Shai Ben-David, John Blitzer, Koby Crammer, and Fernando Pereira. Analysis of representations for domain adaptation. Advances in neural information processing systems, 19, 2006.
- Breiman [2001] Leo Breiman. Random forests. Machine learning, 45:5–32, 2001.
- Brock et al. [2021] Andy Brock, Soham De, Samuel L Smith, and Karen Simonyan. High-performance large-scale image recognition without normalization. In International Conference on Machine Learning, pages 1059–1071. PMLR, 2021.
- Chen et al. [2021a] Chun-Fu Chen, Quanfu Fan, and Rameswar Panda. Crossvit: Cross-attention multi-scale vision transformer for image classification. International Conference on Computer Vision, 2021a.
- Chen et al. [2021b] Jiefeng Chen, Frederick Liu, Besim Avci, Xi Wu, Yingyu Liang, and Somesh Jha. Detecting errors and estimating accuracy on unlabeled data with self-training ensembles. arXiv preprint arXiv:2106.15728, 2021b.
- Chen et al. [2021c] Mayee Chen, Karan Goel, Nimit S Sohoni, Fait Poms, Kayvon Fatahalian, and Christopher Re. Mandoline: Model evaluation under distribution shift. International Conference on Machine Learning, page 1617–1629, 2021c.
- Chen et al. [2017] Yunpeng Chen, Jianan Li, Huaxin Xiao, Xiaojie Jin, Shuicheng Yan, and Jiashi Feng. Dual path networks. Advances in Neural Information Processing Systems, 2017.
- Chollet [2017] François Chollet. Xception: Deep learning with depthwise separable convolutions. In Proceedings of the IEEE conference on computer vision and pattern recognition, pages 1251–1258, 2017.
- Christie et al. [2018] Gordon Christie, Neil Fendley, James Wilson, and Ryan Mukherjee. Functional map of the world. In Proceedings of the IEEE Conference on Computer Vision and Pattern Recognition, 2018.
- Chuang et al. [2020] Ching-Yao Chuang, Antonio Torralba, and Stefanie Jegelka. Estimating generalization under distribution shifts via domain-invariant representations. arXiv preprint arXiv:2007.03511, 2020.
- Coates and Ng [2012] Adam Coates and Andrew Y Ng. Learning feature representations with k-means. Springer, 2012. URL https://www-cs.stanford.edu/~acoates/papers/coatesng_nntot2012.pdf.
- Coates et al. [2011] Adam Coates, Andrew Ng, and Honglak Lee. An analysis of single-layer networks in unsupervised feature learning. In Proceedings of the fourteenth international conference on artificial intelligence and statistics, pages 215–223. JMLR Workshop and Conference Proceedings, 2011.
- Cortes and Vapnik [1995] Corinna Cortes and Vladimir Vapnik. Support-vector networks. Machine learning, 20:273–297, 1995.
- Cortes et al. [2010] Corinna Cortes, Yishay Mansour, and Mehryar Mohri. Learning bounds for importance weighting. Advances in neural information processing systems, 23, 2010.
- Darlow et al. [2018] Luke N Darlow, Elliot J Crowley, Antreas Antoniou, and Amos J Storkey. Cinic-10 is not imagenet or cifar-10. arXiv preprint arXiv:1810.03505, 2018.
- D’Ascoli et al. [2021] Stéphane D’Ascoli, Hugo Touvron, Matthew L Leavitt, Ari S Morcos, Giulio Biroli, and Levent Sagun. Convit: Improving vision transformers with soft convolutional inductive biases. In Internation Conference on Machine Learning, pages 2286–2296, 2021.
- Deng et al. [2009] Jia Deng, Wei Dong, Richard Socher, Li-Jia Li, Kai Li, and Li Fei-Fei. Imagenet: A large-scale hierarchical image database. In 2009 IEEE conference on computer vision and pattern recognition, pages 248–255. Ieee, 2009.
- Deng and Zheng [2021] Weijian Deng and Liang Zheng. Are labels always necessary for classifier accuracy evaluation? In IEEE/CVF Conference on Computer Vision and Pattern Recognition (CVPR), pages 15064–15073. IEEE Computer Society, 2021. doi: 10.1109/CVPR46437.2021.01482.
- Deng et al. [2021] Weijian Deng, Stephen Gould, and Liang Zheng. What does rotation prediction tell us about classifier accuracy under varying testing environments? arXiv preprint arXiv:2106.05961, 2021.
- Donmez et al. [2010] Pinar Donmez, Guy Lebanon, and Krishnakumar Balasubramanian. Unsupervised supervised learning i: Estimating classification and regression errors without labels. Journal of Machine Learning Research, 11(44):1323–1351, 2010.
- Dosovitskiy et al. [2021] Alexey Dosovitskiy, Lucas Beyer, Alexander Kolesnikov, Dirk Weissenborn, Xiaohua Zhai, Thomas Unterthiner, Mostafa Dehghani, Matthias Minderer, Georg Heigold, Sylvain Gelly, Jakob Uszkoreit, and Neil Houlsby. An image is worth 16x16 words: Transformers for image recognition at scale. ICLR, 2021.
- Dziugaite and Roy [2017] Gintare Karolina Dziugaite and Daniel M Roy. Computing nonvacuous generalization bounds for deep (stochastic) neural networks with many more parameters than training data. arXiv preprint arXiv:1703.11008, 2017.
- Elsahar and Gallé [2019] Hady Elsahar and Matthias Gallé. To annotate or not? predicting performance drop under domain shift. In Proceedings of the 2019 Conference on Empirical Methods in Natural Language Processing and the 9th International Joint Conference on Natural Language Processing (EMNLP-IJCNLP), pages 2163–2173, 2019.
- Garg et al. [2021] S. Garg, Sivaraman Balakrishnan, J. Zico Kolter, and Zachary Chase Lipton. Ratt: Leveraging unlabeled data to guarantee generalization. In International Conference of Machine Learning, 2021.
- Garg et al. [2022] Saurabh Garg, Sivaraman Balakrishnan, Zachary Chase Lipton, Behnam Neyshabur, and Hanie Sedghi. Leveraging unlabeled data to predict out-of-distribution performance. In International Conference on Learning Representations, 2022.
- Geirhos et al. [2021] Robert Geirhos, Kantharaju Narayanappa, Benjamin Mitzkus, Tizian Thieringer, Matthias Bethge, Felix A Wichmann, and Wieland Brendel. Partial success in closing the gap between human and machine vision. Advances in Neural Information Processing Systems, 34:23885–23899, 2021.
- Guillory et al. [2021] Devin Guillory, Vaishaal Shankar, Sayna Ebrahimi, Trevor Darrell, and Ludwig Schmidt. Predicting with confidence on unseen distributions. In 2021 IEEE/CVF International Conference on Computer Vision (ICCV), pages 1114–1124, 2021. doi: 10.1109/ICCV48922.2021.00117.
- He et al. [2016a] Kaiming He, Xiangyu Zhang, Shaoqing Ren, and Jian Sun. Identity mappings in deep residual networks. European Conference on Computer Vision, 2016a.
- He et al. [2016b] Kaiming He, Xiangyu Zhang, Shaoqing Ren, and Jian Sun. Deep residual learning for image recognition. Computer Vision and Pattern Recognition, 2016b.
- Hendrycks and Dietterich [2019] Dan Hendrycks and Thomas G. Dietterich. Benchmarking neural network robustness to common corruptions and perturbations. In 7th International Conference on Learning Representations, ICLR, 2019.
- Hendrycks and Gimpel [2017] Dan Hendrycks and Kevin Gimpel. A baseline for detecting misclassified and out-of-distribution examples in neural networks. In 5th International Conference on Learning Representations, ICLR 2017, Toulon, France, April 24-26, 2017, Conference Track Proceedings, 2017.
- Huang et al. [2017] Gao Huang, Zhuang Liu, Laurens Van Der Maaten, and Kilian Q Weinberger. Densely connected convolutional networks. Conference on Computer Vision and Pattern Recognition, 2017.
- Iandola et al. [2016] Forrest N Iandola, Song Han, Matthew W Moskewicz, Khalid Ashraf, William J Dally, and Kurt Keutzer. Squeezenet: Alexnet-level accuracy with 50x fewer parameters and< 0.5 mb model size. arXiv preprint arXiv:1602.07360, 2016.
- Jaffe et al. [2015] Ariel Jaffe, Boaz Nadler, and Yuval Kluger. Estimating the accuracies of multiple classifiers without labeled data. In Guy Lebanon and S. V. N. Vishwanathan, editors, Proceedings of the Eighteenth International Conference on Artificial Intelligence and Statistics, volume 38, pages 407–415, 2015.
- Jiang et al. [2022] Yiding Jiang, Vaishnavh Nagarajan, Christina Baek, and J Zico Kolter. Assessing generalization of SGD via disagreement. In International Conference on Learning Representations, 2022.
- Jie Hu and Sun. [2018] Li Shen Jie Hu and Gang Sun. Squeeze-and-excitation networks. Conference on Computer Vision and Pattern Recognition, 2018.
- Kaplun et al. [2022] Gal Kaplun, Nikhil Ghosh, Saurabh Garg, Boaz Barak, and Preetum Nakkiran. Deconstructing distributions: A pointwise framework of learning. arXiv preprint arXiv:2202.09931, 2022.
- Koh et al. [2021] Pang Wei Koh, Shiori Sagawa, Henrik Marklund, Sang Michael Xie, Marvin Zhang, Akshay Balsubramani, Weihua Hu, Michihiro Yasunaga, Richard Lanas Phillips, Irena Gao, et al. Wilds: A benchmark of in-the-wild distribution shifts. In International Conference on Machine Learning, pages 5637–5664. PMLR, 2021.
- Krizhevsky [2009] Alex Krizhevsky. Learning multiple layers of features from tiny images. Technical report, University of Toronto, 2009.
- Krizhevsky et al. [2012] Alex Krizhevsky, Ilya Sutskever, and Geoffrey E Hinton. Imagenet classification with deep convolutional neural networks. Advances in Neural Information Processing Systems, 2012.
- Kurakin et al. [2018] Alexey Kurakin, Ian J. Goodfellow, Samy Bengio, Yinpeng Dong, Fangzhou Liao, Ming Liang, Tianyu Pang, Jun Zhu, Xiaolin Hu, Cihang Xie, Jianyu Wang, Zhishuai Zhang, Zhou Ren, Alan L. Yuille, Sangxia Huang, Yao Zhao, Yuzhe Zhao, Zhonglin Han, Junjiajia Long, Yerkebulan Berdibekov, Takuya Akiba, Seiya Tokui, and Motoki Abe. Adversarial attacks and defences competition. CoRR, abs/1804.00097, 2018. URL http://arxiv.org/abs/1804.00097.
- Kuzborskij and Orabona [2013] Ilja Kuzborskij and Francesco Orabona. Stability and hypothesis transfer learning. In International Conference on Machine Learning, pages 942–950. PMLR, 2013.
- Liang et al. [2022] Weixin Liang, Yining Mao, Yongchan Kwon, Xinyu Yang, and James Zou. On the nonlinear correlation of ml performance across data subpopulations. In ICML 2022: Workshop on Spurious Correlations, Invariance and Stability, 2022.
- Liu et al. [2018] Chenxi Liu, Barret Zoph, Maxim Neumann, Jonathon Shlens, Wei Hua, Li-Jia Li, Li Fei-Fei, Alan Yuille, Jonathan Huang, and Kevin Murphy. Progressive neural architecture search. European Conference on Computer Vision, 2018.
- Liu and Deng [2015] Shuying Liu and Weihong Deng. Very deep convolutional neural network based image classification using small training sample size. In 2015 3rd IAPR Asian Conference on Pattern Recognition (ACPR), pages 730–734, 2015. doi: 10.1109/ACPR.2015.7486599.
- Liu et al. [2022] Zhuang Liu, Hanzi Mao, Chao-Yuan Wu, Christoph Feichtenhofer, Trevor Darrell, and Saining Xie. A convnet for the 2020s. Proceedings of the IEEE/CVF Conference on Computer Vision and Pattern Recognition (CVPR), 2022.
- Loshchilov and Hutter [2017] Ilya Loshchilov and Frank Hutter. Sgdr: Stochastic gradient descent with warm restarts. International Conference on Learning Representations, 2017.
- Lu et al. [2020] Shangyun Lu, Bradley Nott, Aaron Olson, Alberto Todeschini, Hossein Vahabi, Yair Carmon, and Ludwig Schmidt. Harder or different? a closer look at distribution shift in dataset reproduction. ICML Workshop on Uncertainty and Robustness in Deep Learning, 2020.
- Ma et al. [2018] Ningning Ma, Xiangyu Zhang, Hai-Tao Zheng, and Jian Sun. Shufflenet v2: practical guidelines for efficient cnn architecture design. European Conference on Computer Vision, 2018.
- Madani et al. [2004] Omid Madani, David Pennock, and Gary Flake. Co-validation: Using model disagreement on unlabeled data to validate classification algorithms. In L. Saul, Y. Weiss, and L. Bottou, editors, Advances in Neural Information Processing Systems, volume 17, 2004.
- Mania and Sra [2020] Horia Mania and Suvrit Sra. Why do classifier accuracies show linear trends under distribution shift? arXiv preprint arXiv:2012.15483, 2020.
- Mania et al. [2019] Horia Mania, John Miller, Ludwig Schmidt, Moritz Hardt, and Benjamin Recht. Model similarity mitigates test set overuse. Advances in Neural Information Processing Systems, 32, 2019.
- Mansour et al. [2009] Yishay Mansour, Mehryar Mohri, and Afshin Rostamizadeh. Domain adaptation: Learning bounds and algorithms. arXiv preprint arXiv:0902.3430, 2009.
- Miller et al. [2020] John Miller, Karl Krauth, Benjamin Recht, and Ludwig Schmidt. The effect of natural distribution shift on question answering models. In International Conference on Machine Learning, pages 6905–6916. PMLR, 2020.
- Miller et al. [2021] John Miller, Rohan Taori, Aditi Raghunathan, Shiori Sagawa, Pang Wei Koh, Vaishaal Shankar, Percy Liang, Yair Carmon, and Ludwig Schmidt§. Accuracy on the line: On the strong correlation between out-of-distribution and in-distribution generalization. International Conference on Machine Learning, 2021.
- Nagarajan and Kolter [2019] Vaishnavh Nagarajan and J Zico Kolter. Deterministic pac-bayesian generalization bounds for deep networks via generalizing noise-resilience. arXiv preprint arXiv:1905.13344, 2019.
- Nakkiran and Bansal [2021] Preetum Nakkiran and Yamini Bansal. Distributional generalization: A new kind of generalization, 2021. URL https://openreview.net/forum?id=iQxS0S9ir1a.
- Negrea et al. [2020] Jeffrey Negrea, Gintare Karolina Dziugaite, and Daniel M. Roy. In defense of uniform convergence: Generalization via derandomization with an application to interpolating predictors. In International Conference on Machine Learning, ICML’20. JMLR.org, 2020.
- Neyshabur et al. [2017] Behnam Neyshabur, Srinadh Bhojanapalli, David McAllester, and Nati Srebro. Exploring generalization in deep learning. In Advances in Neural Information Processing Systems 30, NeurIPS 2017, 2017.
- Platanios et al. [2017] Emmanouil Platanios, Hoifung Poon, Tom M Mitchell, and Eric J Horvitz. Estimating accuracy from unlabeled data: A probabilistic logic approach. In I. Guyon, U. Von Luxburg, S. Bengio, H. Wallach, R. Fergus, S. Vishwanathan, and R. Garnett, editors, Advances in Neural Information Processing Systems, volume 30. Curran Associates, Inc., 2017.
- Platanios et al. [2014] Emmanouil Antonios Platanios, Avrim Blum, and Tom Mitchell. Estimating accuracy from unlabeled data. In Proceedings of the Thirtieth Conference on Uncertainty in Artificial Intelligence, UAI’14, page 682–691, Arlington, Virginia, USA, 2014. AUAI Press. ISBN 9780974903910.
- Radosavovic et al. [2020] Ilija Radosavovic, Raj Prateek Kosaraju, Ross Girshick, Kaiming He, and Piotr Dollár. Designing network design spaces. Computer Vision and Pattern Recognition, 2020.
- Recht et al. [2019] Benjamin Recht, Rebecca Roelofs, Ludwig Schmidt, and Vaishaal Shankar. Do ImageNet classifiers generalize to ImageNet? In Kamalika Chaudhuri and Ruslan Salakhutdinov, editors, Proceedings of the 36th International Conference on Machine Learning, volume 97 of Proceedings of Machine Learning Research, pages 5389–5400. PMLR, 09–15 Jun 2019.
- Redko et al. [2020] Ievgen Redko, Emilie Morvant, Amaury Habrard, Marc Sebban, and Younès Bennani. A survey on domain adaptation theory: learning bounds and theoretical guarantees. arXiv preprint arXiv:2004.11829, 2020.
- Roelofs et al. [2019] Rebecca Roelofs, Vaishaal Shankar, Benjamin Recht, Sara Fridovich-Keil, Moritz Hardt, John Miller, and Ludwig Schmidt. A meta-analysis of overfitting in machine learning. Advances in Neural Information Processing Systems, 32, 2019.
- Sandler et al. [2018] Mark Sandler, Andrew Howard, Menglong Zhu, Andrey Zhmoginov, and Liang-Chieh Chen. Mobilenetv2: Inverted residuals and linear bottlenecks. Conference on Computer Vision and Pattern Recognition, 2018.
- Schelter et al. [2020] Sebastian Schelter, Tammo Rukat, and Felix Biessmann. Learning to validate the predictions of black box classifiers on unseen data. In Proceedings of the 2020 ACM SIGMOD International Conference on Management of Data, page 1289–1299, New York, NY, USA, 2020. Association for Computing Machinery. ISBN 9781450367356.
- Simonyan and Zisserman [2015] Karen Simonyan and Andrew Zisserman. Very deep convolutional networks for large-scale image recognition. arXiv, 2015. URL https://arxiv.org/abs/1409.1556.
- Srinivas et al. [2021] Aravind Srinivas, Tsung-Yi Lin, Niki Parmar, Jonathon Shlens, Pieter Abbeel, and Ashish Vaswani. Bottleneck transformers for visual recognition. In Proceedings of the IEEE/CVF Conference on Computer Vision and Pattern Recognition (CVPR), pages 16519–16529, June 2021.
- Steinhardt and Liang [2016] Jacob Steinhardt and Percy Liang. Unsupervised risk estimation using only conditional independence structure. In Advances in Neural Information Processing Systems (NeurIPS), 2016.
- Szegedy et al. [2015a] Christian Szegedy, Wei Liu, Yangqing Jia, Pierre Sermanet, Scott Reed, Dragomir Anguelov, Dumitru Erhan, Vincent Vanhoucke, and Andrew Rabinovich. Going deeper with convolutions. Conference on Computer vision and Pattern Recognition, 2015a.
- Szegedy et al. [2015b] Christian Szegedy, Vincent Vanhoucke, Sergey Ioffe, Jonathon Shlens, and Zbigniew Wojna. Rethinking the inception architecture for computer vision. CoRR, abs/1512.00567, 2015b. URL http://arxiv.org/abs/1512.00567.
- Tan and Le [2019a] Mingxing Tan and Quoc Le. Efficientnet: rethinking model scaling for convolutional neural networks. International Conference on Machine Learning, 2019a.
- Tan and Le [2019b] Mingxing Tan and Quoc Le. EfficientNet: Rethinking model scaling for convolutional neural networks. In Kamalika Chaudhuri and Ruslan Salakhutdinov, editors, Proceedings of the 36th International Conference on Machine Learning, volume 97, pages 6105–6114, 2019b.
- Teney et al. [2022] Damien Teney, Yong Lin, Seong Joon Oh, and Ehsan Abbasnejad. Id and ood performance are sometimes inversely correlated on real-world datasets. arXiv preprint arXiv:2209.00613, 2022.
- Touvron et al. [2021] Hugo Touvron, Matthieu Cord, Alexandre Sablayrolles, Gabriel Synnaeve, and Hervé Jégou. Going deeper with image transformers. In Proceedings of the IEEE/CVF International Conference on Computer Vision (ICCV), pages 32–42, October 2021.
- Vaswani et al. [2021] Ashish Vaswani, Prajit Ramachandran, Aravind Srinivas, Niki Parmar, Blake Hechtman, and Jonathon Shlens. Scaling local self-attention for parameter efficient visual backbones. Conference on Computer Vision and Pattern Recognition, 2021.
- Wightman [2019] Ross Wightman. Pytorch image models. https://github.com/rwightman/pytorch-image-models, 2019.
- Xie et al. [2017] Saining Xie, Ross Girshick, Piotr Dollár, Zhuowen Tu, and Kaiming He. Aggregated residual transformations for deep neural networks. Computer Vision and Pattern Recognition, 2017.
- Xu et al. [2021] Weijian Xu, Yifan Xu, Tyler Chang, and Zhuowen Tu. Co-scale conv-attentional image transformers. International Conference on Computer Vision, 2021.
- Yadav and Bottou [2019] Chhavi Yadav and Léon Bottou. Cold case: The lost mnist digits. Advances in neural information processing systems, 32, 2019.
- Yu et al. [2019] Fisher Yu, Dequan Wang, Evan Shelhamer, and Trevor Darrell. Deep layer aggregation, 2019.
- Yu et al. [2022] Yaodong Yu, Zitong Yang, Alexander Wei, Yi Ma, and Jacob Steinhardt. Predicting out-of-distribution error with the projection norm, 2022.
- Zhang et al. [2018] Xiangyu Zhang, Xinyu Zhou, Mengxiao Lin, and Jian Sun. Shufflenet: An extremely efficient convolutional neural network for mobile devices. Computer Vision and Pattern Recognition, 2018.
- Zhou et al. [2020] Lijia Zhou, Danica J. Sutherland, and Nati Srebro. On uniform convergence and low-norm interpolation learning. In H. Larochelle, M. Ranzato, R. Hadsell, M.F. Balcan, and H. Lin, editors, Advances in Neural Information Processing Systems, volume 33, pages 6867–6877. Curran Associates, Inc., 2020.
- Zhu et al. [2009] Ji Zhu, Hui Zou, Saharon Rosset, and Trevor Hastie. Multi-class adaboost. Statistics and Its Interface, 2, 2009.
Appendix A Baseline Methods
In Section 5, we compare ALine-S/D to ATC, DOC-Feat, AC, and Agreement. We detail these methods below. Given model (the output after softmax) and unlabeled OOD data, the algorithms are
Average Threshold Confidence (ATC)
| (7) |
where and satisfies
| (8) |
DOC-Feat
| (9) |
Average Confidence (AC)
Given model and unlabeled OOD data,
| (10) |
Agreement
Given a pair of models , Agreement simply predicts their average OOD accuracy to be the agreement between the models .
Appendix B Theoretical Analysis from Miller et al.
To get a better understanding of the agreement-on-the-line phenomenon, we replicate a theoretical experiments in Miller et al. [59] using the same set of neural networks from their testbed. Specifically, we look at CIFAR-10 with different added Gaussian noise (their Figure 4).
B.1 Matching gaussian noise
Miller et al. [59] conduct a theoretical analysis on a toy gaussian mixture model to better understand the accuracy-on-the-line phenomena. From their analysis, they predict that accuracy-on-the-line occurs if the covariances of the ID and OOD data are the same up to some constant scaling factor. Inspired by this, they show that accuracy-on-the-line holds stronger on CIFAR-10 data corrupted with gaussian noise that matches the covariance of CIFAR-10 test data versus isotropic gaussian noise. Interestingly, even for this simple setting, we similarly observe that the ID vs OOD agreement trend is stronger on covariance matched gaussian noise.

Appendix C Correlation results on more datasets
To verify the agreement-on-the-line phenomenon, we compare the linear correlation between ID vs OOD accuracy and agreement across a variety of distribution shifts. Given a set of models, we plot the ID vs OOD accuracy of each model in the set. For agreement, we randomly pair each model with another model in the set, and plot the ID vs OOD agreement of these pairs. We provide values in the figure legends.
Datasets
In addition to the 8 datasets from the main body, we also observe the trend on other CIFAR10C corruptions [34]. For each corruption, we evaluate the models over data from all 5 severity levels (both in Figure 1 of main body and appendix).
We also look at shifting from CIFAR-10 to CINIC-10 [19] and CIFAR-10 to STL-10 [16] which are shifts from changes in the image source. Specifically, the CINIC-10 test dataset contains both CIFAR-10 Test data and a selection of ImageNet images for CIFAR-10 class labels downsampled to . We only consider the downsampled ImageNet data as the OOD dataset. Similarly, STL-10 contains processed ImageNet images for CIFAR-10 class labels. Since STL-10 is an unsupervised learning dataset, we only utilize the labeled subset of STL-10 as the OOD dataset. Additionally, STL-10 only contains 9 of the 10 CIFAR-10 classes, so we restrict the dataset to just those 9 classes.
Finally, we add results for a real-world shift from batch effects in images of cells in RxRx1-wilds and a reading comprehension dataset Amazon-SQuAD [58] which looks at the reading comprehension performance of models trained on paragraphs derived from Wikipedia articles on Amazon product reviews.
Models
For ImageNetV2, we evaluate 49 ImageNet pretrained models from the timm [82] package. See their repository for more details about the models. For RxRx1-wilds we trained 36 models of varying architecture and hyperparameters. Specifically, we vary weight decay between and optimizers between SGD, Adam, and AdamW. See D for architecture details.
Finally, we utilize all independently trained models from the CIFAR10, iWildCam-wilds, fMoW-wilds, and Camelyon17-wilds testbeds created and utilized by [59]. The hyperparameters used to train these models are explained in great detail in Appendix B.2 of Miller et al. [59]. The architectures of all models evaluated for the experiment are described in more detail in Appendix D.
Pretrained vs Not Pretrained
Miller et al. [59] showed that for some shifts, the ID vs OOD accuracy of ImageNet pretrained models follow a different linear trend than models trained from scratch in-distribution. In Figure 1 of the main body, we do not distinguish between pretrained and from scratch models as the trends for pretrained and from scratch models were the same for the 8 datasets we chose. Below, we divide results between pretrained and not pretrained models to be more precise. 333The fMoW-wilds testbed also contains two models pretrained on CLIP 444For CINIC-10 and STL-10, we only look at from scratch models as the shifted images are derived from ImageNet.
C.1 Over randomly initialized models


C.2 Over models pretrained on ImageNet


C.3 NLP Datasets

Miller additionally showed in [58] that the ID vs OOD F1 score of question-answering models is also often strongly linearly correlated. We plot the ID vs OOD F1 score of the models versus the ID (SQuAD) vs OOD (Amazon) F1-agreement, where F1-agreement is simply the average F1 score where one of the models is treated as the labels or the ground truth. Specifically,
| (11) |
C.4 Only Neural Networks
Here we observe the ID vs OOD accuracy and agreement trend of model families other than neural networks. In the main body of the paper, we illustrated how the agreement-on-the-line phenomenon is specific to neural networks on CIFAR10-Fog, a synthetic shift. Below, we illustrate this further on a data replication shift, CIFAR10.2, and a real-world shift, fMoW-wilds. Note that the slope of the ID vs OOD agreement trend of neural network models is closest to the slope of the ID vs OOD accuracy trend. Excluding neural networks, we observe that the agreement trend of random feature models [15] also has a similar slope to that of the accuracy trend for select shifts such as CIFAR-10.2.


Appendix D Model Architectures
We list the types of architectures and the corresponding number of models for each testbed.
| Architecture | Number of models |
|---|---|
| DenseNet121 [36] | 21 |
| DenseNet169 [36] | 8 |
| EfficientNetB0 [77] | 13 |
| ResNet18 [33] | 13 |
| ResNet50 [33] | 18 |
| ResNet101 [33] | 7 |
| PreActResNet18 [32] | 63 |
| PreActResNet34 [32] | 9 |
| PreActResNet50 [32] | 11 |
| PreActResNet101 [32] | 4 |
| ResNeXT d [83] | 12 |
| ResNeXT d [83] | 8 |
| ResNeXT d [83] | 1 |
| RegNet X200 [66] | 11 |
| RegNet X400 [66] | 13 |
| RegNet Y400 [66] | 5 |
| VGG11 [72] | 16 |
| VGG13 [72] | 13 |
| VGG16 [72] | 13 |
| VGG19 [72] | 12 |
| ShuffleNetV2 [53] | 56 |
| ShuffleNetG2 [88] | 13 |
| ShuffleNetG3 [88] | 8 |
| AlexNet [44] | 2 |
| MobileNet [70] | 12 |
| MobileNetV2 [70] | 13 |
| PNASNet-A [48] | 13 |
| PNASNet-B [48] | 13 |
| PNASNet-5-Large [48] | 3 |
| SqueezeNet [37] | 3 |
| SENet18 [40] | 13 |
| GoogLeNet [75] | 20 |
| DPN26 [11] | 8 |
| DPN92 [11] | 2 |
| Myrtlenet [Repo] | 1 |
| Xception [12] | 3 |
| Architecture | Number of models |
|---|---|
| Adversarial Inception v3 [45] | 1 |
| AlexNet [44] | 1 |
| BEiT [2] | 1 |
| BoTNet [73] | 1 |
| CaiT [80] | 1 |
| CoaT [84] | 2 |
| ConViT [20] | 3 |
| ConvNeXT [50] | 1 |
| CrossViT [8] | 9 |
| DenseNet [36] | 3 |
| DLA [86] | 10 |
| EfficientNet [77] | 1 |
| HaloNet [81] | 1 |
| NFNet [7] | 1 |
| ResNet [33] | 10 |
| ResNeXT [83] | 1 |
| Inception v3 [76] | 1 |
| VGG [72] | 1 |
Appendix E Section 5: Experimental Details
E.1 Details for Experiment 5.2: Correlation analysis
We replicate the correlation analysis experiment in Table 1 of Yu et al. [87] to compare the prediction performance of ALine-D versus ProjNorm. Essentially, we want to see how strong the linear correlation is between the estimate of OOD accuracy versus the true OOD accuracy by looking at the coefficients of determination and rank correlations of the fit. We use the GitHub repository of ProjNorm [87] found at https://github.com/yaodongyu/ProjNorm to replicate their correlation analysis experiment found in their Table 1. Using their repository, we train a base ResNet18 model for 20 epochs with their default hyperparameters
-
•
Batch Size: 128
-
•
Learning Rate: 0.001
-
•
Weight Decay: 0
-
•
Optimizer: SGD with Momentum 0.9
-
•
Pretrained: True
using cosine learning rate decay [51]. The repository uses the default implementation of ResNet18 by torchvision. The CIFAR-10 images are resized to be , then normalized. To compute ProjNorm, we use the repository to train a reference ResNet18 model using the pseudolabels of the base model for 500 iterations with the same hyperparameters as the base model. We use the ALine-D algorithm to predict the OOD accuracy of the base model. ALine-D requires a model set with at least 3 models so that the linear system of equations (Line 9 in Algorithm 1, Equation 6 in main body) has a unique solution. We use the 29 pretrained models from the CIFAR10 testbed as the other models in the model set.
E.2 Details for Experiment 5.3: Performance along a training trajectory
We train a ResNet18 model from scratch (no pretrained weights) on CIFAR10 for 150 epochs using the following hyperparameters:
-
•
Batch Size: 100
-
•
Learning Rate: 0.1
-
•
Weight Decay:
-
•
Optimizer: SGD with Momentum 0.9
-
•
Pretrained: False
We decay the learning rate by 0.1 at epoch 75 and epoch 113. We use simple data augmentation consisting of RandomCrop with padding, RandomHorizontalFlip, and Normalization. We modify ResNet18 to take in input images.
During training, we save the model weights every 5 training epochs. Given this collection of models, we estimate the CIFAR-10.1 accuracy of each one of these models using the ALine-D procedure.
E.3 Hardware
All experiments were conducted using GeForce GTX 1080 and 2080 graphics cards.
Appendix F The relationship between agreement and accuracy
This work is related to Jiang et al. [39], which shows that the agreement between two models of the same architecture trained with different random seeds is approximately equal to the average ID test accuracy of models if the ensemble consisting of the models is well-calibrated. They call this equality between accuracy and agreement Generalization Disagreement Equality (GDE).
Let us ignore the probit transform for a moment and assume the linear correlation between ID vs OOD accuracy and agreement are strong without it. In this simplified scenario, agreement-on-the-line implies that, for datasets where both agreement and accuracy are strongly linearly correlated, if ID agreement of a pair of models is equal to their average ID accuracy, then their OOD agreement is equal to their OOD accuracy. Formally, when a shift satisfies accuracy-on-the-line, we know by agreement-on-the-line that for any two models trained on ID samples , the following equations are approximately satisfied (ignoring probit transform)
| (12) | |||
| (13) | |||
| (14) |
for some slope and intercept . Thus, if the “ID gap” between accuracy and agreement is 0, then the “OOD gap” is also 0. This may suggest something about calibration on shifts where accuracy-on-the-line holds: if the ensemble of a pair of models is well calibrated ID, then by agreement-on-the-line GDE also holds OOD.
However, agreement-on-the-line goes beyond these results in two ways: (i) agreement between models with different architectures and (ii) agreement between different checkpoints on the same training run is also on the ID vs OOD agreement line. Jiang et al. [39] does not guarantee GDE holds for these cases. As can be seen in Figure 12, for most pairs of models, the ID and OOD gaps between probit scaled accuracy and agreement are not equal to 0 i.e. GDE does not occur ID or OOD. Indeed, understanding why agreement-on-the-line holds requires going beyond the theoretical conditions presented in the prior work [39] which do not hold for this expanded set of models.

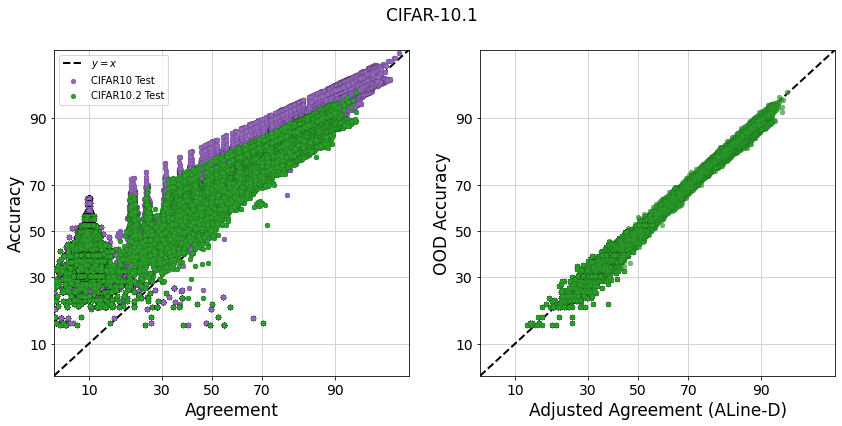


Is agreement-on-the-line a result of neural network performing well? In Figures 13 we look at the trend between ID agreement vs accuracy to observe whether the accuracy of the models in the collection plays a role in the success of ALine-D. Note that naturally, the gap between agreement and average accuracy is smaller for pairs of models that perform well. However, this does not necessarily correspond with better ALine-D performance on such models. On the right figure of 13, we plot the right hand side of ALine-D’s Equation 6 versus the left hand side ("adjusted agreement"), and observe that all pairs lie close to the diagonal, regardless of how large the gap is before the adjustment. This is to say that, all pairs of varying performance have strong linear correlation between ID vs OOD agreement, which we show in Figure 14.
Appendix G Ablation Study
G.1 How many models are necessary for ALine-D to make accurate predictions?


ALine-D is an algorithm that requires at least 3 models in the model set so that the system of linear equations (Line 9 in Algorithm 1) has a unique solution. Additionally, it may generally require more models for the slope and intercept of the agreement trend to match the slope and intercept of the accuracy trend. We observe the MAE (in ) of the ALine-D estimates of the OOD accuracy for model sets of varying sizes. For each distribution shift, we randomly sample models from the testbed to be our model set. ranges from 3 to 463 in increments of 10 for CIFAR-10 related shifts, and 3 to 48 in increments of 5 for ImageNetV2. Our ablation study shows that the success of ALine-D is not necessarily tied to the number of models. For CIFAR-10.1, we see a very quick drop in estimation error, and ALine-D performs well even for a small model set. Similarly, in ImageNetV2, we observe a decrease in estimation error as the number of models increases, however, the MAE is already pretty low from the start (). On the other hand, in CIFAR-10C Fog, the estimation error does not decrease, but the error is quite low (below ) from the start. This short ablation study seems to indicate that ALine-D performs pretty well when agreement-on-the-line holds even for a small number of models ( models). Additionally, it is not always the case that more models will decrease the estimation error further.
G.2 Does a model set of varied architecture perform better than models of the same architecture?
We study whether the diversity from varying the architecture of the models in the model set improves the performance of ALine-D. We look at the performance of ALine-D on CIFAR-10.1 and CIFAR-10C Fog over two model sets sampled from the CIFAR-10 testbed: (A) 20 PreActResNet18 [32] models, (B) 20 models of varying architecture. Similary for fMoW, we look at the performance over (A) 10 DenseNet121 [36] models , (B) 10 models of varying architecture. We randomly sample these models from the corresponding testbeds, and average our results over 10 seeds. Our results as shown below depends on the dataset. For CIFAR-10.1 and CIFAR-10C Fog, we see that ALine-D performs better on the diverse set consisting of many architecture types. On the other hand, for fMoW, ALine-D performed better on the uniform set consisting of models of one architecture.


